
94% of researchers rate our articles as excellent or good
Learn more about the work of our research integrity team to safeguard the quality of each article we publish.
Find out more
ORIGINAL RESEARCH article
Front. Oncol., 01 April 2025
Sec. Cancer Genetics
Volume 15 - 2025 | https://doi.org/10.3389/fonc.2025.1499217
This article is part of the Research TopicExploring Epigenetic Mechanisms in CancerView all 9 articles
 Ankang Yin1†
 Yufan Xu2†Xiyang Su3Runan Wang4Zebin Zhang1Yi Chen1Lu Han1Guoxiang Fu2*
 Wei Wang5*
 Juan Wang5*
Background: Elongation Factor Tu GTP Binding Domain Containing 2 (EFTUD2), a conserved spliceosomal GTPase, is involved in craniofacial development and various cancers, but its role in lung adenocarcinoma (LUAD) remains unclear.
Methods: EFTUD2 expression in LUAD tissues was analyzed using data from TCGA and GEO, and validated by immunohistochemistry, RT-qPCR, and Western blotting. The relationship between EFTUD2 expression and clinical features was examined using Fisher’s exact test. Diagnostic and prognostic analyses were performed in R. Hub genes related to EFTUD2 were identified through topological algorithms, and immune infiltration was assessed using CIBERSORT. The cGAS-STING pathway and m6A modification were also analyzed in the TCGA LUAD cohort. Functional assays were conducted to assess EFTUD2’s impact on LUAD cell proliferation, cell cycle, invasion, and metastasis, while glycolytic enzyme levels were measured by Western blotting.
Results: EFTUD2 was upregulated in LUAD tissues and cells, correlating with N classification, visceral pleural invasion, intravascular tumor embolism, and cytokeratin-19 fragment antigen 21-1. Sixteen EFTUD2-related hub genes were identified. Higher EFTUD2 expression was linked to altered immune cell infiltration, with increased TumorPurity scores and decreased StromalScore, ImmuneScore, and ESTIMATEScore values. Gene enrichment analyses highlighted EFTUD2’s involvement in cell adhesion, immune response. EFTUD2 was strongly associated with the cGAS-STING pathway and m6A modification. EFTUD2 knockdown inhibited LUAD cell proliferation, migration, and tumorigenicity, causing G0/G1 phase cell cycle arrest, and altered glycolytic enzyme expression. These findings may suggest that EFTUD2 positively regulates the progression of LUAD and modulates the glycolytic activity of tumor cells, making it valuable for LUAD treatment and prognosis.
Conclusions: EFTUD2 is a potential diagnostic and prognostic marker for LUAD, associated with immune infiltration, the tumor microenvironment, the cGAS-STING pathway, m6A modification, and glycolysis.
Lung cancer is a major contributor to cancer-related death globally, and lung adenocarcinoma (LUAD) represents approximately half of all reported lung cancer cases (1, 2). According to Siegel et al., as of 2024, lung cancer remains the leading cause of cancer-related deaths. The mortality rates for male and female lung cancer patients are 20% and 21%, respectively. The incidence of lung cancer is 49.0 cases per 100,000 individuals annually. Among newly diagnosed cancer cases, lung cancer accounts for 11% in men and 12% in women (2). Because LUAD presents with obscure clinical symptoms, the majority of the affected patients are diagnosed at an advanced stage, typically after the optimal window for surgical removal, and thus have a 5-year survival rate of ≤20%. Nevertheless, early detection and intervention can increase the LUAD survival rate to 60% (2, 3). Common cancer therapies include surgery, radiation therapy, chemotherapy, and allogeneic hematopoietic stem cell transplantation. In the future, treatments targeting genes with oncogenic potential will become one of the key approaches in cancer therapy (4). Low-dose computed tomography (LDCT) that can be used to identify early-stage tumors has facilitated the reduction of mortality rates among high-risk LUAD patients (3). However, LDCT, which can also detect benign nodules, is associated with a 25% false positive rate for nodule detection; this reduces the positive predictive value of LDCT and narrows its therapeutic applicability to larger groups (3). Hence, discovering biomarkers for selecting patients eligible for LDCT assessment is highly warranted. In recent years, significant progress has been made in the discovery and application of emerging biomarkers. Emerging biomarkers for LUAD include long non-coding RNAs (lncRNAs), microRNAs (miRNAs), epigenetic markers, as well as coding RNAs and protein markers (5–7).
Elongation factor Tu GTP binding domain containing 2 (EFTUD2), a highly conserved spliceosomal GTPase and alternative splicing factor, is a key constituent of U5 small nuclear ribonucleoproteins; as such, EFTUD2 is essential for spliceosome activation and RNA-splicing process regulation (8, 9). The maintenance of spliceosome dynamics depends on the binding of GTP/GDP to EFTUD2; however, disruption of this binding can prevent mRNA splicing, potentially leading to cell death (10, 11). Mutations or insufficient expression of EFTUD2 can result in abnormalities in craniofacial development (12–16). EFTUD2 also acts as an innate immunity regulator (17), playing a crucial role in hepatitis C and B virus infection prevention (18, 19).
Several recent studies have highlighted the role of EFTUD2 in cancer progression. EFTUD2 has been noted to increase hepatocellular carcinoma (HCC) cell survival and metastasis by inducing epithelial–mesenchymal transition and be associated with immune infiltration and poor prognosis, making it a potential therapeutic target for liver cancer (20–22). In their clinical study, Beyer et al. noted that increased EFTUD2 expression in endometrial cancer predicts poor prognosis and thus can be an independent indicator of progression-free survival (23). EFTUD2 is strongly expressed in colorectal cancer cells, and its deficiency in myeloid progenitor cells can inhibit cancer occurrence and progression (24). In general, EFTUD2 is strongly associated with cancer progression; however, the function of EFTUD2 in LUAD remains unknown.
In the present study, we first determined that EFTUD2 is strongly expressed in LUAD by using data from online databases. We then confirmed that EFTUD2 is highly expressed in LUAD tissue samples, indicating its potential as a LUAD diagnostic marker and prognostic indicator. Next, the hub genes associated with EFTUD2 were screened on the basis of The Cancer Genome Atlas (TCGA) data. Our results demonstrated that EFTUD2 shaped the tumor immune microenvironment (TIME) and is closely related to genes involved in N6-methyladenosine (m6A) modification and the cyclic GMP-AMP synthase-stimulator of interferon genes (cGAS-STING) pathway. Moreover, EFTUD2 knockdown was noted to inhibit the proliferation, migration, invasion, tumorigenicity, and cell cycle of LUAD cells. Gene set enrichment analysis (GSEA) revealed the signaling pathways in which EFTUD2 in LUAD cells might be involved. In general, by leveraging bioinformatics analysis followed by experimental substantiation, we elucidated the prospective function and predictive value of EFTUD2 in LUAD, indicating that EFTUD2 is a promising candidate for a therapeutic target in LUAD.
We obtained 174 lung clinical samples surgically excised and pathologically confirmed to be of LUAD from Sir Run Run Shaw Hospital, Affiliated with Zhejiang University, China, over 2018–2021. The 174 clinical surgically resected tissue samples include both tumor and paracancerous regions. These samples were from retrospectively enrolled patients who had not received any radiotherapy or chemotherapy presurgically. All patients were adults aged 34–86 years. We determined the clinical characteristics for analysis based on the research direction and the patient information available, which include Sex, Age, Smoking history, Visceral pleural invasion, Intravascular tumor embolism, TNM stages, and levels of LUAD-related biomarkers (CA125, CEA, CYFRA-21-1, Pro-GRP). To ensure the completeness of the analysis, we selected patients who met all the clinical characteristics mentioned above, patients who were missing any of the criteria will be excluded. This process was entirely random and involved no subjectivity. All experiments on the clinical samples were approved by the Research Ethics Committee of Sir Run Run Shaw Hospital, Affiliated with Zhejiang University.
The 174 lung clinical samples obtained in section 2.1 are paraffin-embedded sections of surgically resected LUAD tissues. The sections were sequentially placed in xylene I for 8 min, xylene II for 8 min, xylene III for 8 min, absolute ethanol I for 5 min, absolute ethanol II for 5 min, 85% ethanol for 5 min, 75% ethanol for 5 min, and washed with water for 2 min. The sections were stained with hematoxylin for 5 min, differentiated in hydrochloric acid solution for 2 s, then blued in ammonia water solution for 15–30 s, followed by rinsing with water. Afterward, the sections were immersed in 95% ethanol for dehydration, then stained in eosin solution for 5–8 s. The sections were sequentially placed in absolute ethanol I for 30 s, absolute ethanol II for 2.5 min, absolute ethanol III for 2.5 min, xylene I for 2.5 min, xylene II for 2.5 min, and finally mounted with neutral gum. The sections were examined under a microscope, and images were captured for analysis.
The paraffin-embedded sections were deparaffinized, rehydrated, and subjected to antigen retrieval. The tissue sections were placed in a retrieval box filled with sodium citrate buffer (pH 6.0). Once the buffer inside the pressure cooker reached boiling, the retrieval box was carefully placed inside. Antigen retrieval was performed at 121°C under high pressure for 3 minutes. Afterward, the pressure was released, and the sections were allowed to cool naturally to room temperature. The slides were then transferred to PBS and washed on a decolorizing shaker three times for 5 minutes each. Next, they were incubated in 3% hydrogen peroxide at room temperature for 25 min, followed by washing with 1× phosphate-buffered saline (PBS). The tissue sections were evenly covered with 3% bovine serum albumin and incubated at room temperature for 30 min. The sections were then incubated with the rabbit EFTUD2 polyclonal antibody (Abcam Cat# ab72456, RRID: AB_1268731) at 4°C overnight. The dilution of the EFTUD2 antibody for IHC staining is 1:200. After three PBS washes, the sections were incubated with a goat antirabbit secondary antibody conjugated with poly-horseradish peroxidase at room temperature for 50 min and visualized using a 3,3’-diaminobenzidine chromogen substrate. The sections were counterstained with hematoxylin for 3 min, dehydrated, air-dried, and finally, sealed with a neutral resin. Two independent pathologists (GX Fu and YF Xu) specializing in LUAD evaluated all sections.
EFTUD2 expression was calculated according to the tumor cell staining intensity and staining positivity rate. Staining intensities were rated as follows: 0, negative staining; 1, weak staining; 2, moderate staining; and 3, strong staining. Subsequently, the final IHC score for each sample was obtained by summing the range of positive cells and the staining intensity of the EFTUD2 protein. Moreover, positivity rates were scored from 0 to 4 as follows: 0, 0%; 1, 1%–25%; 2, 26%–50%; 3, 51%–75%; and 4, >75%. The final scores were a sum of the two aforementioned scores and categorized as follows: negative, <3; weak, 3; moderate, 4; and strong, ≥5 (25).
The GSE32863 (26), GSE43458 (27), and GSE75037 (28) datasets from the Gene Expression Omnibus (GEO) database (29) were downloaded to analyze EFTUD2 expression in LUAD and normal samples. The criteria for selecting the GSE32863, GSE43458, and GSE75037 datasets is as follows: (1) LUAD tissue derived from human species; (2) Like the TCGA dataset, LUAD patients are from the USA; (3) The number of cancer samples is greater than 50, and the combined number of cancer and adjacent normal samples is greater than 100. EFTUD2 expression was also assessed in TCGA datasets (30) by using the web-based tool Gene Expression Profiling Interactive Analysis (GEPIA; version 2.0). Clinical factors, including age, sex, and pathologic (tumor: T, node: N, and metastasis: M) stages et al., were obtained from TCGA and used to group the samples. In the TNM staging system, T represents the size of the tumor and the extent of the primary tumor, N indicates the involvement of regional lymph nodes, and M refers to the presence of distant metastasis. The Kruskal–Wallis test was used to compare EFTUD2 expression among different clinical factor groups in R (version 4.1.2; RRID: SCR_001905). The diagnostic and prognostic value of EFTUD2 in patients with LUAD was assessed using receiver operating characteristic (ROC) curve and Kaplan–Meier (K–M) survival analyses. The mutation MAF data for LUAD samples were downloaded from the Genomic Data Commons (GDC, version 2.15.5). The Tumor Mutation Burden (TMB) and Fraction of Genome Altered (FGA) for these samples were then calculated using maftools (version 2.6.05) in R (version 4.3.1). Subsequently, the cor function (version 4.1.2) in R was used to calculate the correlations between TMB, FGA, and the expression levels of EFTUD2.
Based on the median staining scores, immunohistochemical (IHC) staining results of the all patient clinical samples were categorized into high and low EFTUD2 expression groups (n = 91 and 83, respectively). Subsequently, two clinical characteristic data categorical variables were obtained, using the high and low expression levels of EFTUD2 as the classification criteria. The correlation between clinical characteristics and EFTUD2 expression was analyzed by the univariate chi-square test. The clinical characteristics of the study include: Sex, Age, Smoking history, Visceral pleural invasion, Intravascular tumor embolism, TNM stages, and levels of LUAD-related biomarkers (CA125: carbohydrate antigen 125; CEA: carcinoembryonic antigen; CYFRA-21-1: cytokeratin-19 fragment antigen 21-1; Pro-GRP: pro-gastrin releasing peptide precursor). Moreover, and TCGA samples were divided into high- and low-expression groups based on their median EFTUD2 expression. Then, we used Fisher’s exact test to compare each clinical factor’s distribution between the two groups in R (version 4.1.2).
TCGA gene expression profiles based on the Illumina HiSeq 2000 platform were downloaded from the UCSC-Xena database (31), which yielded 559 samples, including 501 LUAD tumor and 58 normal control samples. Differential expression analysis was then performed on the LUAD and control groups using the R package limma (version 3.56.2). Genes with a false discovery rate (FDR) of <0.05 and |log2 fold change (FC)| of >1 were considered significantly differentially expressed.
GSEA of LUAD genes was performed using GSEA (version 4.3.2) (32) based on the median EFTUD2 expression, with the screening thresholds set to FDR (q) < 0.05 and p < 0.001.
We constructed a protein–protein interaction (PPI) network of EFTUD2 with the screened differentially expressed genes (DEGs), cGAS-STING pathway–related genes, and m6A modification–related genes by using the STRING database (version 12.0) (33). The network was visualized using Cytoscape (version 3.9.0). This EFTUD2 PPI was then analyzed for hub genes by using the cytoHubba plugin (version 0.1) of Cytoscape (3.9.0), based on these 12 topological analysis algorithms: maximal clique centrality, degree-based maximal neighborhood centrality, maximal neighborhood centrality, edge percolated centrality, Degree, BottleNeck, Closeness, Eccentricity, Betweenness, Radiality, Stress, and Clustering Coefficient. The genes commonly selected by at least nine of the algorithms were retained as the final hub genes. The comparison results were displayed using the R package UpSetR (version 1.4.0).
We performed correlation analysis to evaluate the relationships of EFTUD2 with the hub genes, immune cells, ESTIMATE scores, immune-related genes, cGAS-STING pathway–related genes, and m6A modification–related genes using the cor function in R. The Gene-Corr module of TIMER (version 2.0) (34) was used to assess correlations between EFTUD2 and glycolytic genes in LUAD.
ROC analysis (35) and Cox analysis (36) are widely used and recognized as common single-gene independent diagnostic methods, making them highly suitable for assessing the diagnostic and prognostic value of EFTUD2 in LUAD. The diagnostic value of EFTUD2 and the hub genes was assessed using ROC curve analysis in R package pROC (version 1.12.1). The survival of EFTUD2, immune cells, immune scores, immune genes, cGAS-STING pathway–related genes, and m6A modification–related genes was analyzed using the R package survival (version 2.41-1). Based on the clinical information from the TCGA dataset samples and the median grouping of EFTUD2 gene expression levels, Cox univariate and multivariate regression analyses were performed using the survival package (Version 2.41-1) in R (version 4.1.2).
Immune cell proportions in the TCGA tumor samples were assessed using CIBERSORT (RRID: SCR_016955) (37), followed by the calculation of ESTIMATE scores, immune scores, stromal scores, and tumor purity by using the R package estimate (version 1.0.13). Finally, the distributions of immune cells, ESTIMATE scores, immune scores, stromal scores, and tumor purity were compared between the high- and low-expression groups.
Immune scores with differential EFTUD2 distribution were obtained on the basis of EFTUD2 expression levels. Subsequently, the correlation between these differential associated immune scores and the abovementioned DEG was assessed using the cor function in R (version 4.1.2). All selected immune-related genes associated with EFTUD2 had p < 0.05 and |cor| > 0.3. These immune-related genes were then subjected to Gene Ontology (GO) and Kyoto Encyclopedia of Genes and Genomes (KEGG) enrichment analysis based on DAVID (version 6.86) (38, 39), with FDR < 0.05 as the selection threshold.
Expression data for genes related to m6A modification and the cGAS-STING pathway were extracted from the TCGA LUAD expression profile. The included genes were related to methylation (METTL3, METTL14, METTL15, WTAP, VIRMA, RBM15, RBM15B, and ZC3H13), demethylation (FTO and ALKBH5), m6A regulation (RBMX, YTHDC1, YTHDC2, IGF2BP1, IGF2BP2, IGF2BP3, YTHDF1, YTHDF2, YTHDF3, HNRNPA2B1, and HNRNPC), and the cGAS-STING pathway (SAMHD1, DDX41, IRF3, PRKDC, XRCC5, XRCC6, TRIM21, TBK1, DTX4, STAT6, IFI16, and NLRC3). The limma package (version 3.56.2) was used to compare the gene expression levels between the LUAD and normal control groups. To assess whether genes associated with EFTUD2 expression are influenced by their own copy number variations, mutation analysis, including CNV and SNV, was performed on the EFTUD2-related differentially expressed genes in the TCGA-LUAD dataset using the cBioPortal online platform (version 6.0.23).
MRC-5 (RRID: CVCL_0440), A549 (RRID: CVCL_0023), H1299 (RRID: CVCL_0060), and PC9 (RRID: CVCL_B260) cell lines (all from American Type Culture Collection) were cultured in Dulbecco’s modified Eagle medium (C11995500BT; Gibco, USA) supplemented with 10% fetal bovine serum (FBS; 164210; Pricella, China) and penicillin–streptomycin (BL505A; Labgic, China) at 37°C in a humidified incubator containing 5% CO2 and 95% air. Small interfering RNA (siRNA) targeting EFTUD2 (GenePharma, China) and Lipofectamine 2000 (11668019; Invitrogen, USA) were separately diluted in OPTI-MEM (31985070; Gibco, USA), followed by incubation for 5 min. Then, the two solutions were mixed, followed by incubation for an additional 15 min. This mixture was added to the cells in a six-well plate, followed by incubation for 6–8 h. The final concentration of siRNA used for transfection was 100 nM. Finally, the transfection medium was replaced with the regular culture medium. Subsequently, the transfected cells were cultured in a 37°C incubator with 5% CO2 for 48 h. All EFTUD2-targeting siRNA sequences are listed in the Supplementary Table S2.
Total RNA was extracted using a TRIzol reagent kit (9109; Takara Bio, Japan). The extracted RNA was then reverse-transcribed into cDNA using a reverse transcription kit (RR047A; Takara Bio, Japan). Reverse transcription real-time polymerase chain reaction (qRT-PCR) was then performed using TB Green qPCR mix (RR420; Takara Bio, Japan), according to the manufacturer’s instructions. All primers used here, synthesized by Tsingke (China), are presented in the Supplementary Table S1. The qRT-PCR results were analyzed using the 2−ΔΔCT method.
Prepared cells were lysed in a cell lysis buffer (Cell Signaling Technology, Danvers, USA) at 4°C. Protein quantification was performed using a bicinchoninic acid protein assay kit (P1511; Applygen, China). Western blotting was performed in a sodium dodecyl sulfate–polyacrylamide gel electrophoresis system. The following primary antibodies were used: rabbit EFTUD2 polyclonal antibody (Abcam Cat# ab72456, RRID: AB_1268731, dilution factor: 1: 2000), rabbit anti-GAPDH polyclonal antibody (Cell Signaling Technology Cat# 2118, RRID: AB_561053, dilution factor: 1: 1000), rabbit anti-PKM2-specific antibody (Proteintech Cat# 15822-1-AP, RRID: AB_1851537, dilution factor: 1: 2000), rabbit anti-ALDOB polyclonal antibody (Cohesion Biosciences Cat# CPA3123, RRID: AB_3106870, dilution factor: 1: 1000), and rabbit anti-β-actin polyclonal antibody (Cell Signaling Technology Cat# 4970, RRID: AB_2223172, dilution factor: 1: 1000). TBST (Tris Buffered Saline with Tween-20) supplemented with 5% fetal bovine serum (FBS) was used as the antibody diluent. The dilution of the antibodies was determined according to the manufacturer’s instructions.
Flow cytometry was used to analyze the cell cycle (40). Cells were prepared and digested with 0.25% trypsin without ethylenediaminetetraacetic acid to obtain single-cell suspensions at concentrations of 1 × 10⁵ to 5 × 10⁵ cells/mL. The cells were then washed twice with PBS, and the supernatant was discarded. Cell-cycle analysis was conducted using a Cell Cycle kit (C543; Dojindo, Japan), according to the manufacturer’s instructions. The flow cytometry results for the cell cycle were analyzed and plotted using Flowjo (version 7.6).
Prepared single cells were seeded into a six-well plate at a density of 1,000 cells per well and cultured for 10–12 days. Cell culture was terminated when visible clones appeared, and the supernatant was discarded. The cells were then gently washed twice with PBS and fixed in 4% paraformaldehyde for 15 min, followed by three PBS washes. Subsequently, the cells were exposed to an appropriate amount of 0.1% crystal violet for 3 min. The plates were photographed, and clone numbers were calculated using ImageJ (version 1.54h).
The treated cell suspensions were seeded at a density of 5,000 cells in 100 μL per well in a 96-well plate. The CCK-8 solution (CCK-8; C543; Dojindo, Japan) was mixed with a serum-free medium at a 1:10 ratio and used to replace the cell culture medium, followed by incubation at 37°C for 1–4 h. The optical density was measured at 450 nm on an MRX II microplate reader (Dynex, USA). Each experiment was performed independently in three replicates.
Matrigel (1567ML005; Neofroxx, Germany) was first diluted and then added to the upper chamber of a transwell plate. Next, a single-cell suspension was added to the upper chamber of the transwell plate, whereas a medium containing 10% FBS was added to the lower chamber. This was followed by incubation at 37°C for 48 h, fixing with 4% paraformaldehyde for 30 min, and finally, staining with 0.1% crystal violet for 3 min. Cells that did not pass through the Matrigel in the upper chamber were gently wiped away with a wet cotton swab. Images were captured under a fluorescence microscope (Olympus, Tokyo, Japan).
Cells were seeded at a density of approximately 3 × 10⁵ cells per well in a 6-well plate, with 2 mL of DMEM medium containing 5% FBS added to each well. After incubation for 12 h in a 37°C incubator with 5% CO2, scratches were made in each well using a 10 μL pipette tip along a sterile ruler. The detached cells were removed by washing with sterile 1 × PBS, and 2 mL of serum-free medium was added to each well. The plates were then placed back in a 37°C incubator with 5% CO2. Microscopic images were taken at the same location at 0 and 48 h. The scratch width was measured using ImageJ (version 1.54h).
For the tumor xenograft experiments, 4-week-old male Balb/c nude mice weighing 18 ± 2 g were selected. The mice were housed in a specific pathogen-free (SPF) sterile environment, maintained at a constant temperature of 25°C with a 12-h light-dark cycle, and provided with ample food and water. The nude mice were randomly divided into two groups: a control group (si-NC) and an EFTUD2 knockdown group (si-EFTUD2), with 5 mice in each group, totaling 10 mice. A549 cells were used for modeling in the animal experiments, and the cell culture conditions were the same as described in section 2.14. A549 cells were digested with trypsin, collected by centrifugation at 1000 rpm for 5 min, and resuspended in PBS. The cells were washed twice by centrifugation and resuspension. Cell counting was performed, and the cell density was adjusted to 1×10⁶ cells/mL. The cell suspension was divided into 100 μL portions, and each portion was injected into the right axilla of the forelimb of each mouse. After cell inoculation, the mice were returned to normal housing. Once the tumor xenograft masses became palpable, the diameter of the tumors was recorded every 3 days, and growth curves for body weight and tumor size were plotted.
When the tumor xenograft diameter reached 5-7 mm, the knockdown group mice were treated with a mixture of 15 µg EFTUD2 siRNA and 5 μL Lipofectamine 2000 (11668019; Invitrogen, USA) every 3 days via an intratumoral multi-point injection method. The EFTUD2 siRNA used in the animal experiments was modified with 3’Cholesterol and 2’OMe, and the nucleotide sequence was the same as shown in Supplementary Table S2. The control group was injected with negative siRNA and 5 µL Lipofectamine 2000, with all other treatment conditions being the same as those for the knockdown group. Before euthanasia, blood samples were taken from the mice. At the end of the experiment, the mice were euthanized by cervical dislocation, and their appearance was photographed for records. Tumor xenografts were then excised, photographed, measured, and recorded.
The Lactate Assay Kit (BC2235; Solarbio, China) was used to measure lactate levels in serum and tumor xenografts. The specific steps were performed according to the protocol provided with the kit.
The mouse tumor xenografts were placed into dehydration cassettes and dehydrated using a dehydration machine (Donatello; DIAPATH, China) according to the following program: 75% ethanol for 4 h, 85% ethanol for 2 h, 90% ethanol for 2 h, 95% ethanol for 1 h, anhydrous ethanol I for 30 min, anhydrous ethanol II for 30 min, ethanol-xylene for 5 min, xylene I for 5 min, xylene II for 5 min, melted paraffin I at 65°C for 1 h, melted paraffin II at 65°C for 1 h, and melted paraffin III at 65°C for 1 h. The tumor xenografts were then placed in embedding molds with the melted wax, and before the wax solidified, the embedding molds were placed on a -20°C cold plate to cool. After the wax solidified, the wax blocks were removed from the molds and sectioned. The IHC and HE staining procedures for the mouse tumor xenograft specimens are described in sections 2.2 and 2.3. The IHC results from the animal experiments are expressed as the percentage of positive cells. The antibodies used for IHC staining of the mouse tumor xenografts, including EFTUD2, GAPDH, PKM2, and ALDOB, are the same as those used in the section 2.16.
On sections of the mouse tumor xenograft, 100 µL of proteinase K solution (E00492; Fermentas, Canada) at a concentration of 20 µg/mL was added and incubated at room temperature for 20 min. Afterward, the sections were washed with PBS for 3 min, repeating this step 3 times. The treated samples were placed in a humidified box to maintain moisture. Then, 100 µL of 3% H2O2 solution was applied to completely cover each sample and incubated at room temperature for 5 min. The samples were then rinsed with PBS and air-dried. The TUNEL reaction mixture (G1507; Servicebio, China) was prepared, and TUNEL staining was performed according to the instructions provided with the kit. After completing the TUNEL staining, the samples were counterstained with hematoxylin. The samples were immersed in hematoxylin (G1004; Servicebio, China) for 5 min, rinsed with distilled water, treated with hematoxylin differentiator (from the hematoxylin kit) for 2 s, rinsed again with distilled water, and then treated with hematoxylin bluing solution (from the hematoxylin kit) for 5 s, followed by another rinse with distilled water. The samples were immersed in absolute ethanol for dehydration 4 times, each for 5 min; immersed in xylene for 5 min, then transferred to fresh xylene for another 5 min. Finally, the slices were sealed with neutral gum. The samples were examined under a brightfield microscope. The nuclei of apoptotic cells appeared brownish-yellow, while the nuclei of normal cells appeared blue.
Public data from the TCGA and GEO databases were statistically processed and analyzed using R (version 4.1.2). Graphs and charts were created using both GraphPad Prism (version 9.0) and R (version 4.1.2). The overall survival (OS) was analyzed using the log-rank test. Relationships between two continuous variables were assessed using Pearson or Spearman analysis. Moreover, between-group comparisons were performed using Student’s t test or one-way analysis of variance, and categorical data were analyzed using the chi-square test. Cox univariate and multivariate analyses were used to investigate the independent prognostic value of EFTUD2 in LUAD. ImageJ (version 1.54h) was used for quantitative analysis of protein band intensities in Western blotting. All quantitative data are expressed as means ± standard deviations (SDs). Each experiment was independently performed at least three times to ensure reproducibility. Significant differences were defined based on a p value or FDR of <0.05.
To determine EFTUD2 mRNA expression profiles, we analyzed the GEO datasets GSE32863, GSE43458, and GSE75037. Compared with the normal tissues in GEO datasets, the LUAD tissues demonstrated significantly higher EFTUD2 expression (GSE32863: p < 0.001, GSE43458: p < 0.001, and GSE75037: p < 001; Figure 1A). Elevated EFTUD2 expression was also verified in TCGA LUAD dataset (Figure 1B). Among clinical samples, the HE staining results demonstrated that LUAD tumor cells exhibited an irregular glandular invasive growth pattern, with weakly eosinophilic or clear cytoplasm (Figure 1C). Their nuclei were enlarged and irregular with uneven chromatin distribution and had visible mitotic figures (Figure 1C). Their stroma was accompanied by a desmoplastic fibrotic tissue reaction and showed chronic inflammatory cell infiltration (Figure 1C). Next, EFTUD2 expression in 174 paraffin-embedded primary LUAD tissues was assessed through IHC staining. The heatmap in Figure 1D illustrates differences in EFTUD2 expression between LUAD tissues and adjacent normal tissues in every sample: EFTUD2 expression was significantly higher in the LUAD tissues than in the adjacent tissues (Figure 1E), and the high expression group demonstrated significantly higher median EFTUD2 expression than the low-expression group (Figure 1F). The distribution of EFTUD2 expression in LUAD patients harboring EFTUD2 mutations was assessed. The findings revealed a very low frequency of EFTUD2 SNVs in LUAD patients (n = 4), and no significant differences in EFTUD2 expression were observed between the missense and non-mutated groups (Supplementary Figure S1A). In contrast, EFTUD2 mRNA expression was more markedly influenced by CNVs, with significantly elevated expression levels in the Gain and Amplification groups compared to the diploid group, and the Amplification group exhibiting the most pronounced increase (Supplementary Figure S1B). While a few Shallow Deletion mutations were detected in LUAD patients, the number of affected individuals was minimal. Furthermore, EFTUD2 expression in LUAD demonstrated a significant positive correlation with the TMB (Supplementary Figure S1C) and FGA (Supplementary Figure S1D).

Figure 1. Significant prognostic and diagnostic value of elevated EFTUD2 expression in LUAD. (A) Comparative analysis of EFTUD2 expression in normal and LUAD tissues across the GEO datasets GSE32863 (normal: n=58; tumor: n=28), GSE43458 (normal: n=30; tumor: n=80), and GSE75037 (normal: n=83; tumor: n=83). FDR < 0.05. (B) EFTUD2 expression in normal lung and LUAD tissues from TCGA dataset (normal: n=59; tumor: n=483). (C) HE and IHC staining of LUAD and adjacent normal tissue sections. (D) Heatmap of EFTUD2 IHC scores in LUAD and adjacent normal tissue sections. (E) Histogram of EFTUD2 expression levels in normal and tumor tissues. (F) High and low EFTUD2 expression groups divided based on median IHC scores. (G) EFTUD2 expression across clinical factors (TNM stage, pathology, and smoking history) analyzed using Kruskal–Wallis test (H) ROC curve analysis for EFTUD2 diagnosis. (I) OS analysis of low (blue) and high (red) EFTUD2 expression groups. ***p < 0.001, ****p < 0.0001.
To explore whether high EFTUD2 expression is correlated with clinical characteristics and tumor biomarkers (20), we divided the collected patient samples into two groups according to median EFTUD2 expression and found that age (p = 0.0093), N classification (p = 0.0163), visceral pleural invasion (VPI; p = 0.0270), and intravascular tumor embolism (p = 0.0092) were significantly associated with EFTUD2 upregulation (Table 1). Moreover, EFTUD2 upregulation was also closely associated with cytokeratin-19 fragment antigen 21-1 (CYFRA-21-1), an independent prognostic factor in patients with LUAD (p = 0.0319; Table 2) (41). In addition to our clinical study, the TCGA results also demonstrated significant differences in EFTUD2 expression across the subgroups of pathologic N stage (N1 vs. N0), cancer stage (III vs. I), and smoking history (current smoker vs. previous smoker; Figure 1G). Significant distribution differences were noted in age, N stage, and smoking history between groups with high and low EFTUD2 expression (Table 3)—consistent with results presented in Table 1. The ROC curve for EFTUD2 from the TCGA-LUAD dataset demonstrated that EFTUD2 had an area under the ROC curve (AUC) of 0.873 (Figure 1H). The K–M survival analysis revealed that high EFTUD2 expression is associated with poor OS (Figure 1I). Cox analysis was performed for both univariate and multivariate analyses based on EFTUD2 expression levels and clinical characteristics to evaluate the independent prognostic value of EFTUD2 in LUAD. As shown in Table 4, the univariate analysis revealed that EFTUD2, TNM staging, and pathological staging exhibited good prognostic performance with HR > 1. However, the multivariate analysis results for EFTUD2 were not significant, suggesting that the prognostic value of EFTUD2 in LUAD may be related to the progression of the disease. Thus, EFTUD2 may be a LUAD biomarker, and its upregulation may predict poor prognosis.
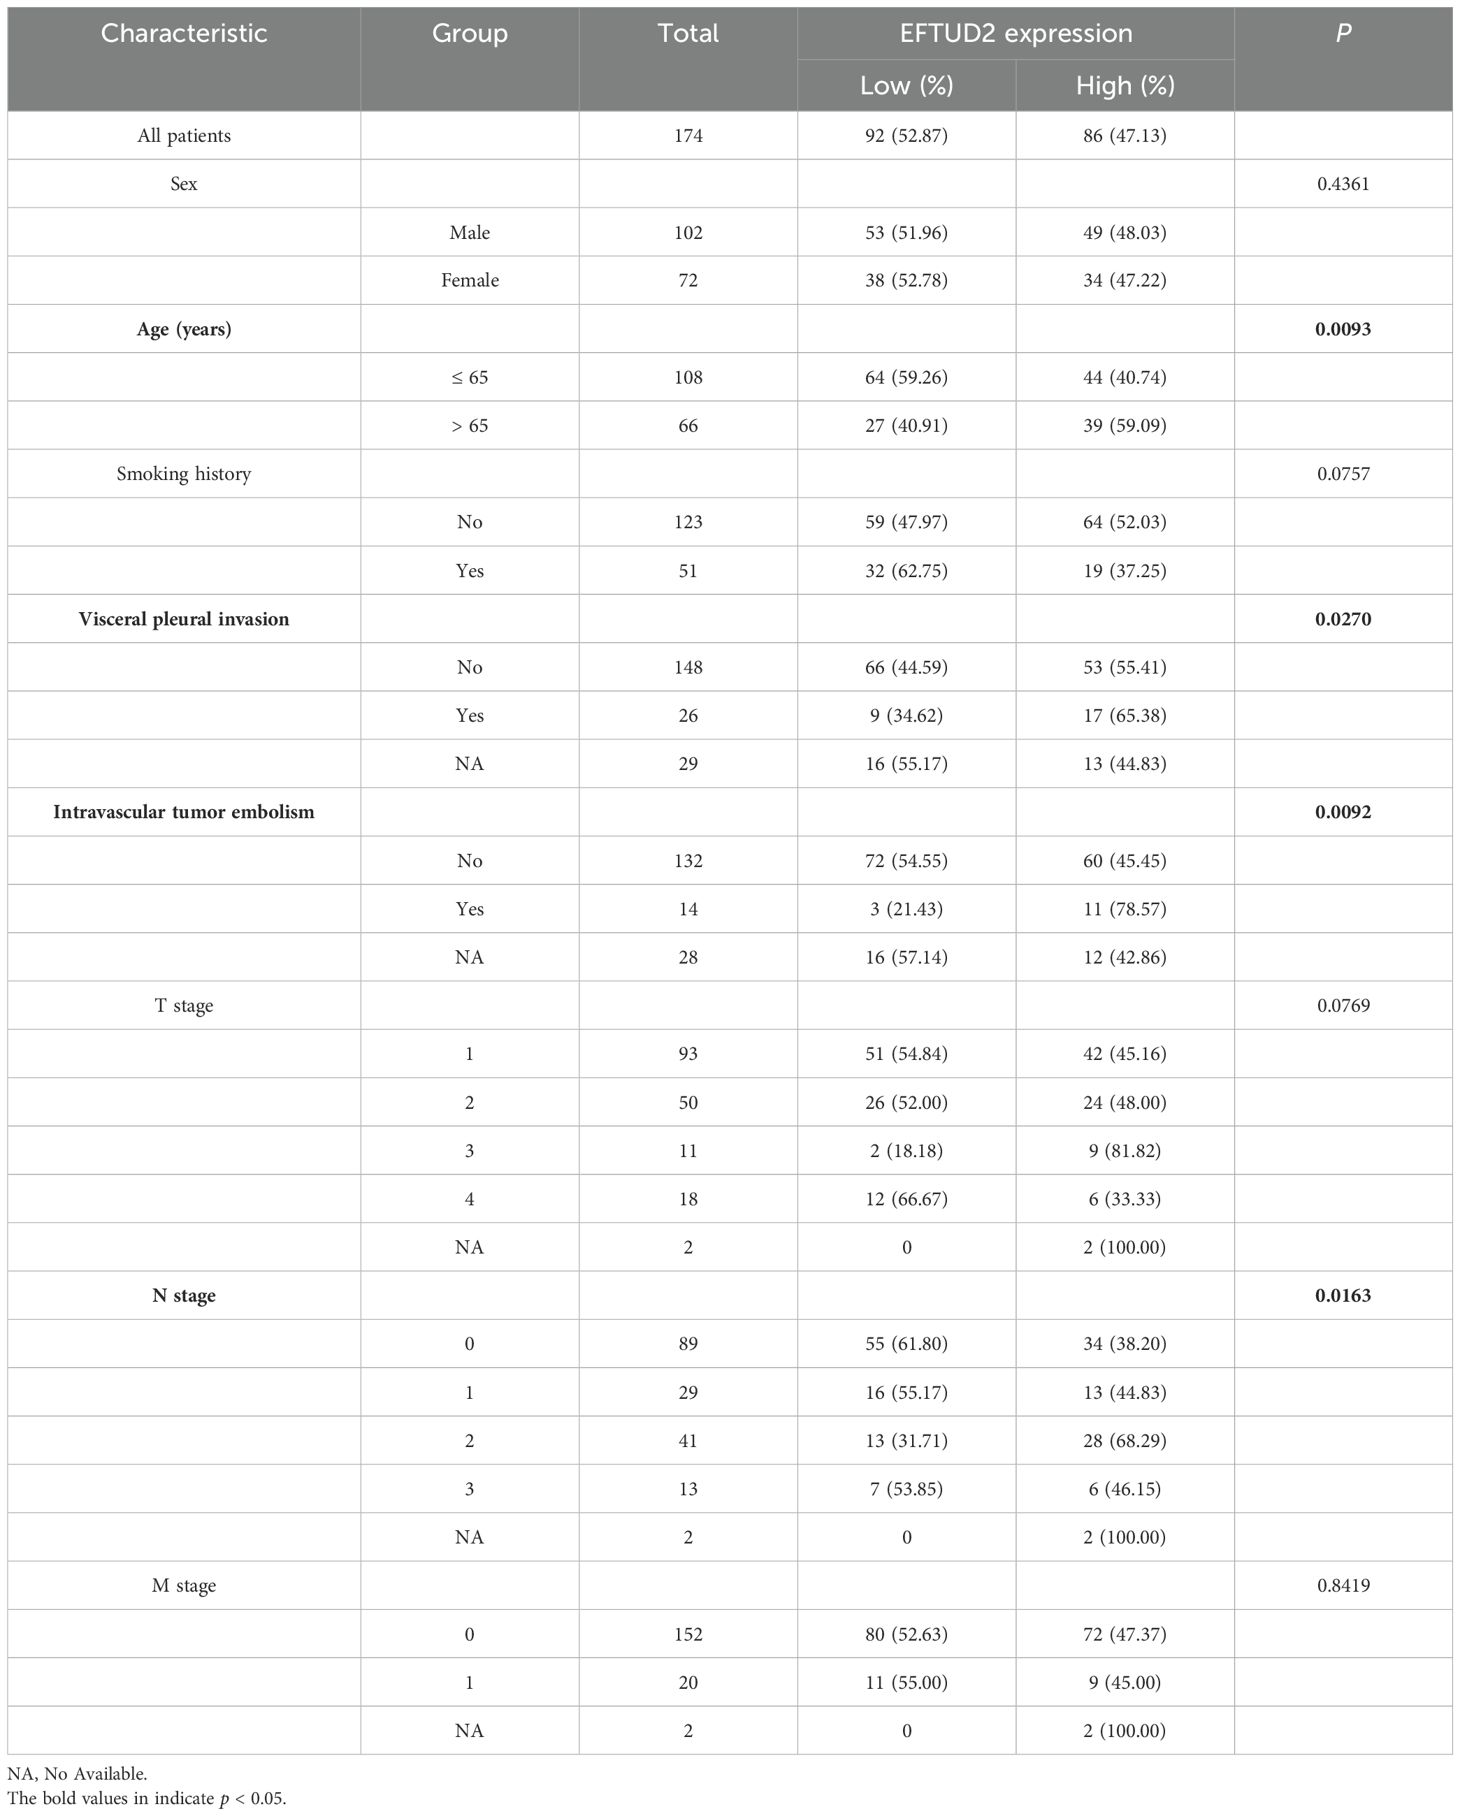
Table 1. Relationship between EFTUD2 expression and clinical characteristics in patients with LUAD.
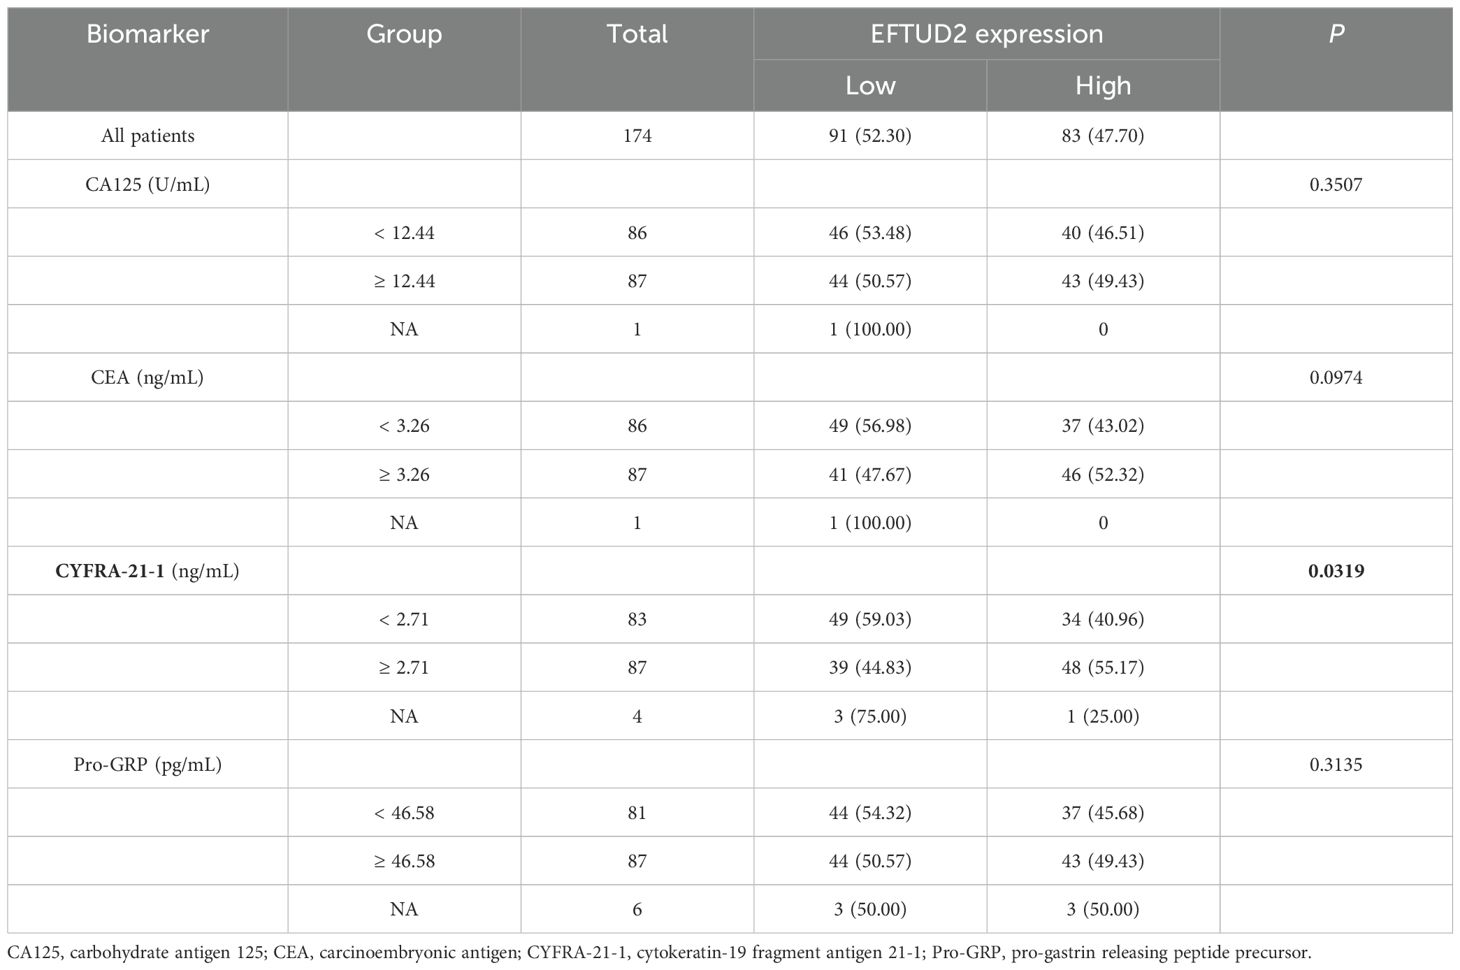
Table 2. Relationship between EFTUD2 expression and LUAD-related biomarkers.
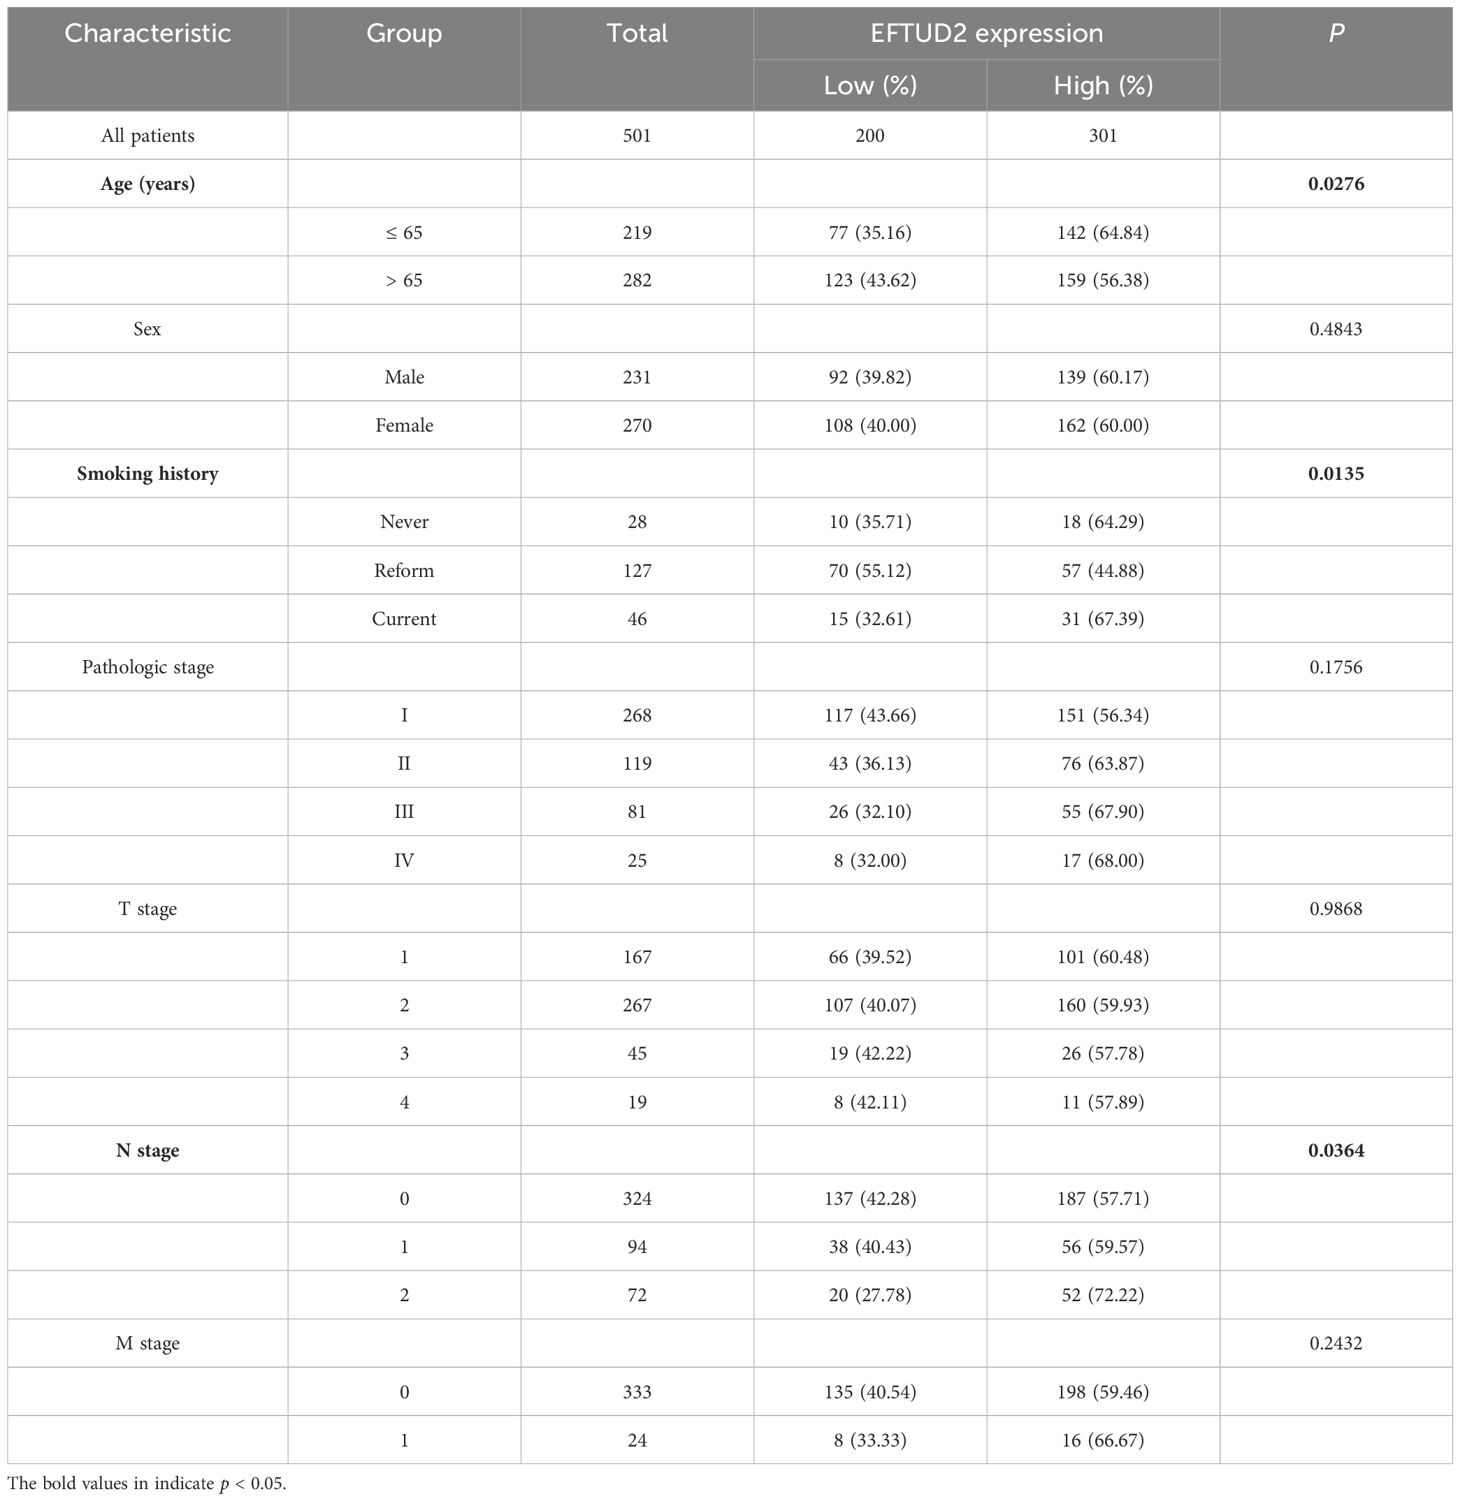
Table 3. Relationship between EFTUD2 expression and clinical characteristics of patients with LUAD in TCGA.
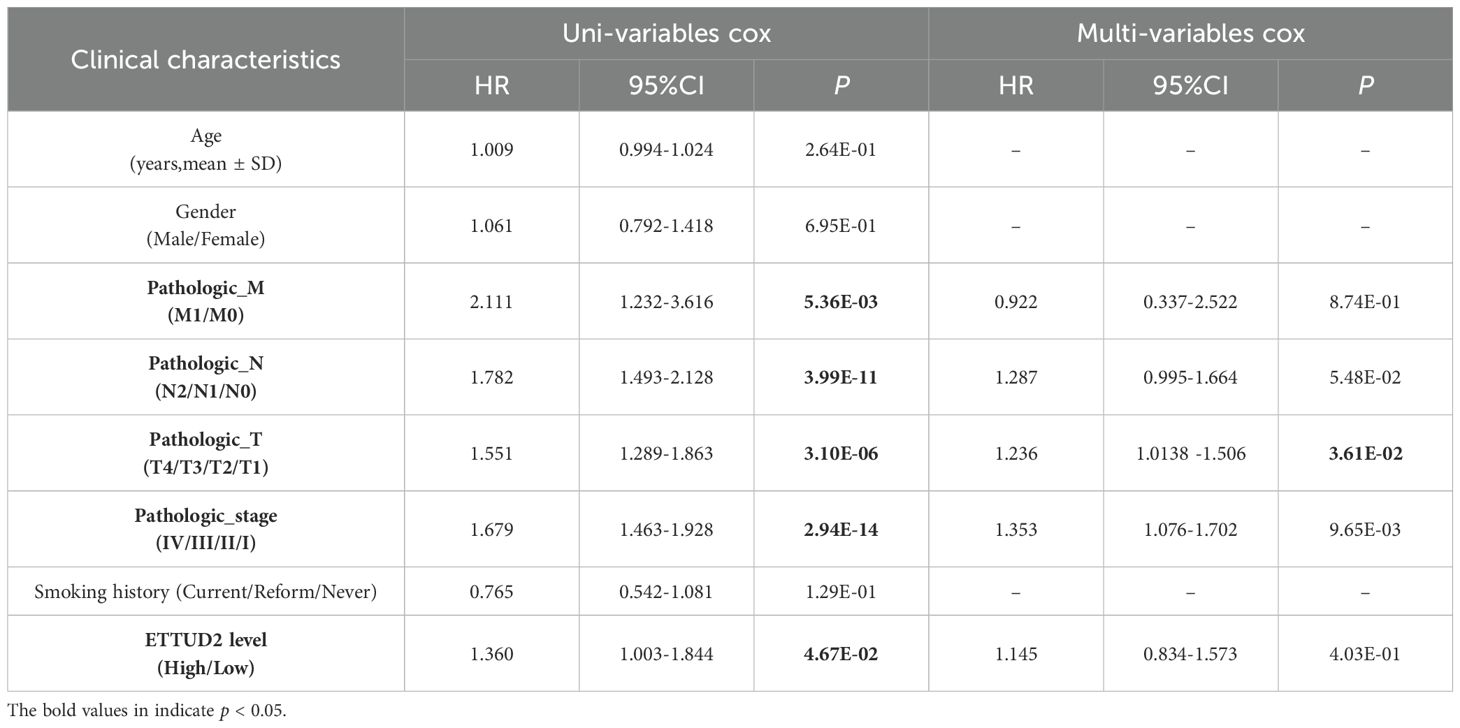
Table 4. Univariate and multivariate Cox regression analysis of clinical characteristics.
To determine the molecular mechanism associated with EFTUD2, we screened DEGs between 58 normal donors and 501 patients with LUAD from the TCGA dataset. The volcano plot results included 344 downregulated and 354 upregulated DEGs; one of these upregulated DEGs was EFTUD2 (Figure 2A). Then, the interactions between EFTUD2 and the screened DEGs were analyzed by using the STRING database; the results demonstrated 51 (red) and 13 (blue) proteins having strong positive and negative interactions with EFTUD2, respectively (Figure 2B). Hub genes related to EFTUD2 in the PPI network were further identified using 12 topology analysis algorithms, whereby the genes simultaneously identified by nine or more algorithms were retained as hub genes. In total, 16 hub genes were found to meet the screening criteria (Figure 2C). We next performed univariate Cox regression analysis on these 16 hub genes. The hazard ratios for all 16 hub genes were >1 (Figure 2D), indicating that they can be independent prognostic factors for LUAD. Moreover, EFTUD2 was significantly and positively correlated with all 16 hub genes (all p < 0.05; Figure 2E). The five genes most positively related to EFTUD2 were KIF23, BUB1, BUB1B, ANLN, and MYBL2 (Figure 2F). CNV analysis was performed on 16 hub genes to investigate whether the expression levels of EFTUD2 and the hub genes are influenced by genetic mutations. The results indicated that, among the 16 hub genes, the expression of BUB1 (Spearman: 0.15) and TRIP13 (Spearman: 0.13) may be somewhat affected by copy number variations, while the correlation coefficients were comparatively weak (Supplementary Figure S1E). The survival analysis results demonstrated that strong expression of these five genes suggested poor OS in patients with LUAD (Figure 2G). The AUCs of all these five genes were >0.9 (Figure 2H), suggesting the significant diagnostic value of EFTUD2 in LUAD. The diagnostic and prognostic value of EFTUD2-related hub genes in LUAD indicated the crucial role of EFTUD2 in LUAD diagnosis and prognosis.
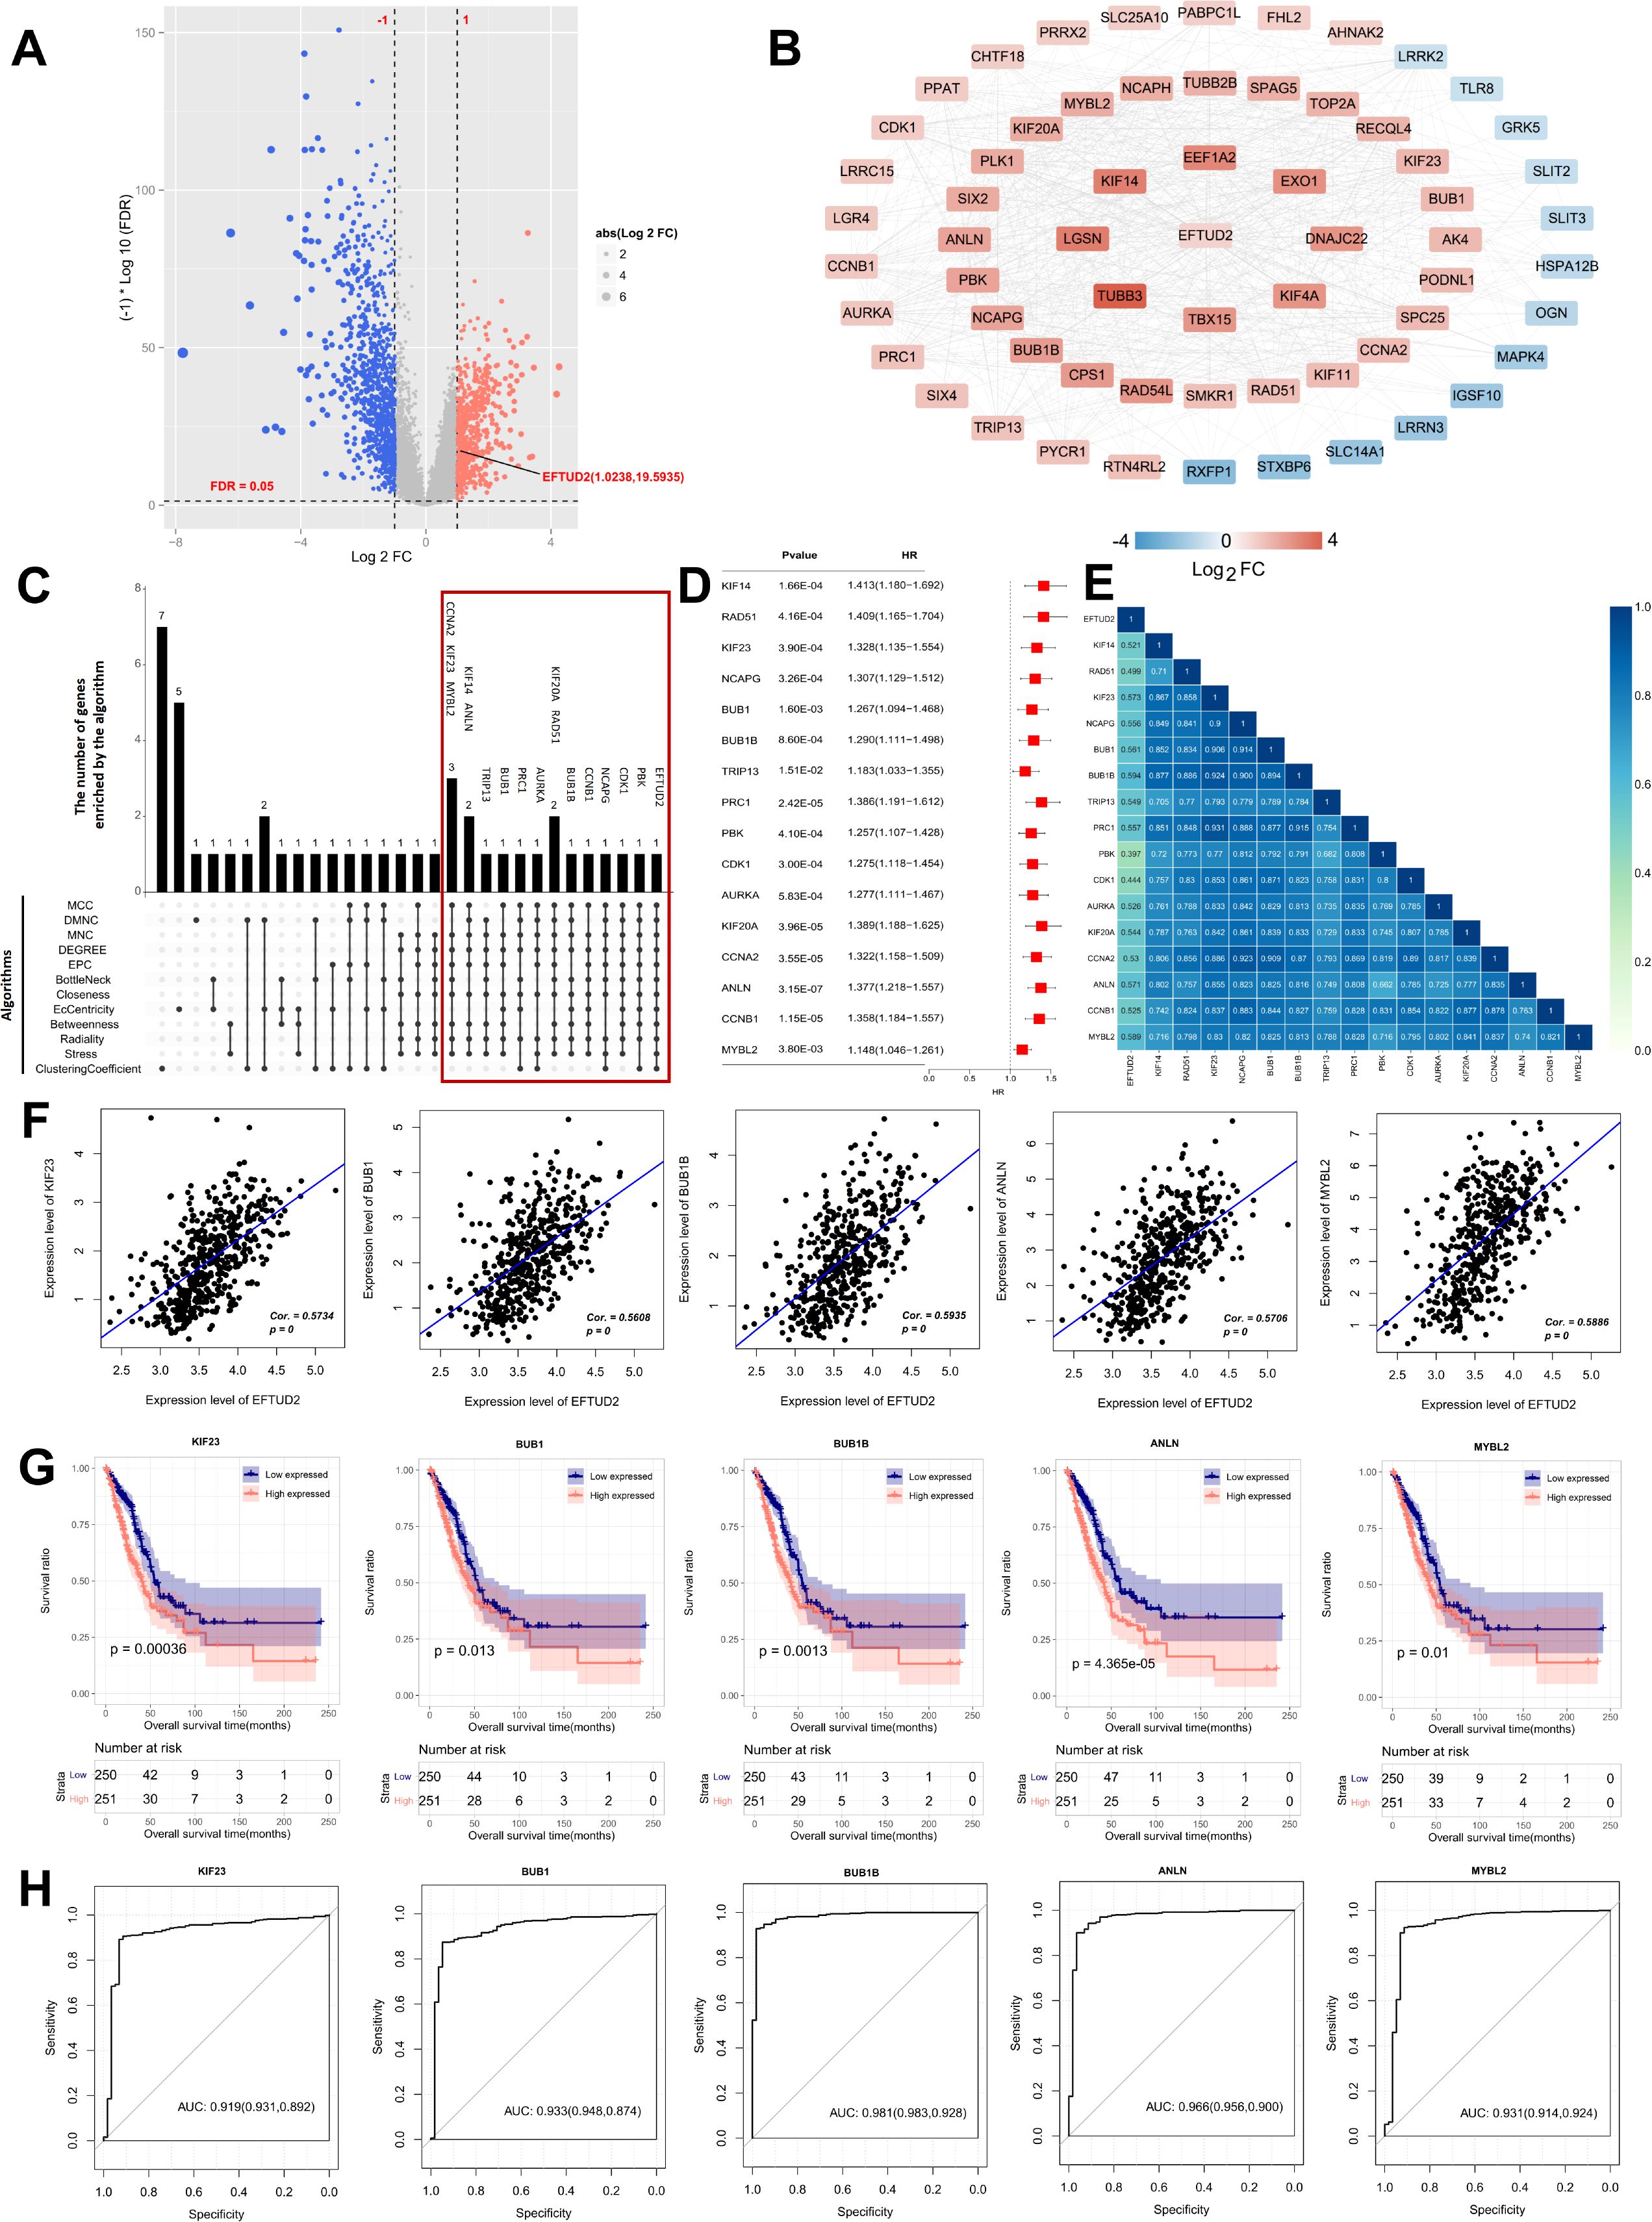
Figure 2. Screening of EFTUD2 coexpressed hub genes in LUAD, and evaluation of their clinical diagnostic and prognostic value. (A) Volcano plot of DEGs in LUAD versus normal lung tissues in TCGA dataset (p < 0.05, |log2FC| ≥ 1). (B) PPI network of EFTUD2-related DEGs in LUAD, with connection scores > 0.4. (C) Venn diagram of candidate hub genes screened by 12 algorithms. (D) Forest plot of univariate Cox regression analysis for the 16 EFTUD2-related hub genes identified in LUAD. (E) Heatmap of correlations between the 16 EFTUD2-related hub genes and EFTUD2. (F) Correlation analysis of significant EFTUD2-related hub genes. (G) Survival analysis of significant EFTUD2-related hub genes. (H) ROC curves of EFTUD2-related hub genes with AUC > 0.9.
Considering the close relationship of EFTUD2 with the immune system (17, 42), we assessed the association of EFTUD2 with LUAD TIME. First, we analyzed the association between EFTUD2 and immune cell subtypes based on LUAD expression profiles in the TCGA. Compared with patients with low EFTUD2 expression, patients with high EFTUD2 expression demonstrated significantly lower abundance of memory B cells, resting memory CD4+T cells, resting myeloid dendritic cells, and activated mast cells but significantly higher abundance of activated memory CD4+T cells, M0 macrophages, M1 macrophages, and resting mast cells (Figure 3A). This suggests that EFTUD2 may regulate the infiltration levels of memory B cells, T cells, macrophages, and mast cells in LUAD tumors. However, EFTUD2 expression was noted to be correlated negatively with activated mast cell, resting memory CD4+T cell, memory B cell, and resting myeloid dendritic cell abundance but positively with resting mast cell, macrophage M0, activated memory CD4+ T cell, and M1 macrophage abundance (Figure 3C). In terms of the TIME scores, EFTUD2 was correlated significantly and positively with TumorPurity but negatively with StromalScore, ImmuneScore, and ESTIMATEScore (Figure 3C). However, StromalScore, ImmuneScore, and ESTIMATEScore values were significantly lower but TumorPurity scores were higher in patients with high EFTUD2 expression than in patients with low EFTUD2 expression (Figure 3B). Survival analysis revealed that LUAD patients with low ESTIMATEScore and ImmuneScore values or high TumorPurity scores had shorter OS (Figure 3D). Moreover, patients with low memory B cell abundance had a worse prognosis (Figure 3D). High expression of EFTUD2 reduces the abundance of memory B cells in LUAD tissues, suggesting that EFTUD2 may lower patient prognosis by affecting the infiltration levels of memory B cells. The GO enrichment analysis results demonstrated that EFTUD2 expression was strongly associated with immune pathways, including those related to cell adhesion, chemotaxis, immune response, and cell surface receptor signaling. KEGG enrichment analysis results showed that EFTUD2 was strongly associated with the PI3K-Akt signaling, chemokine signaling, extracellular matrix receptor binding, and focal adhesion pathways (Figure 3E). The five immune-related genes most strongly associated with EFTUD2 are depicted in Figure 3E; of them, CHRDL1, SLIT3, and DNASE1L3 were negatively correlated with EFTUD2, whereas MTO19 was positively correlated with EFTUD2 (Figure 3F). Survival analysis revealed that patients with lower CHRDL1, SLIT3, and DNASE1L3 expression or higher MTO19 expression had significantly poorer prognosis (Figure 3G). These data suggest that EFTUD2 upregulation is strongly associated with an immune suppressive TIME.
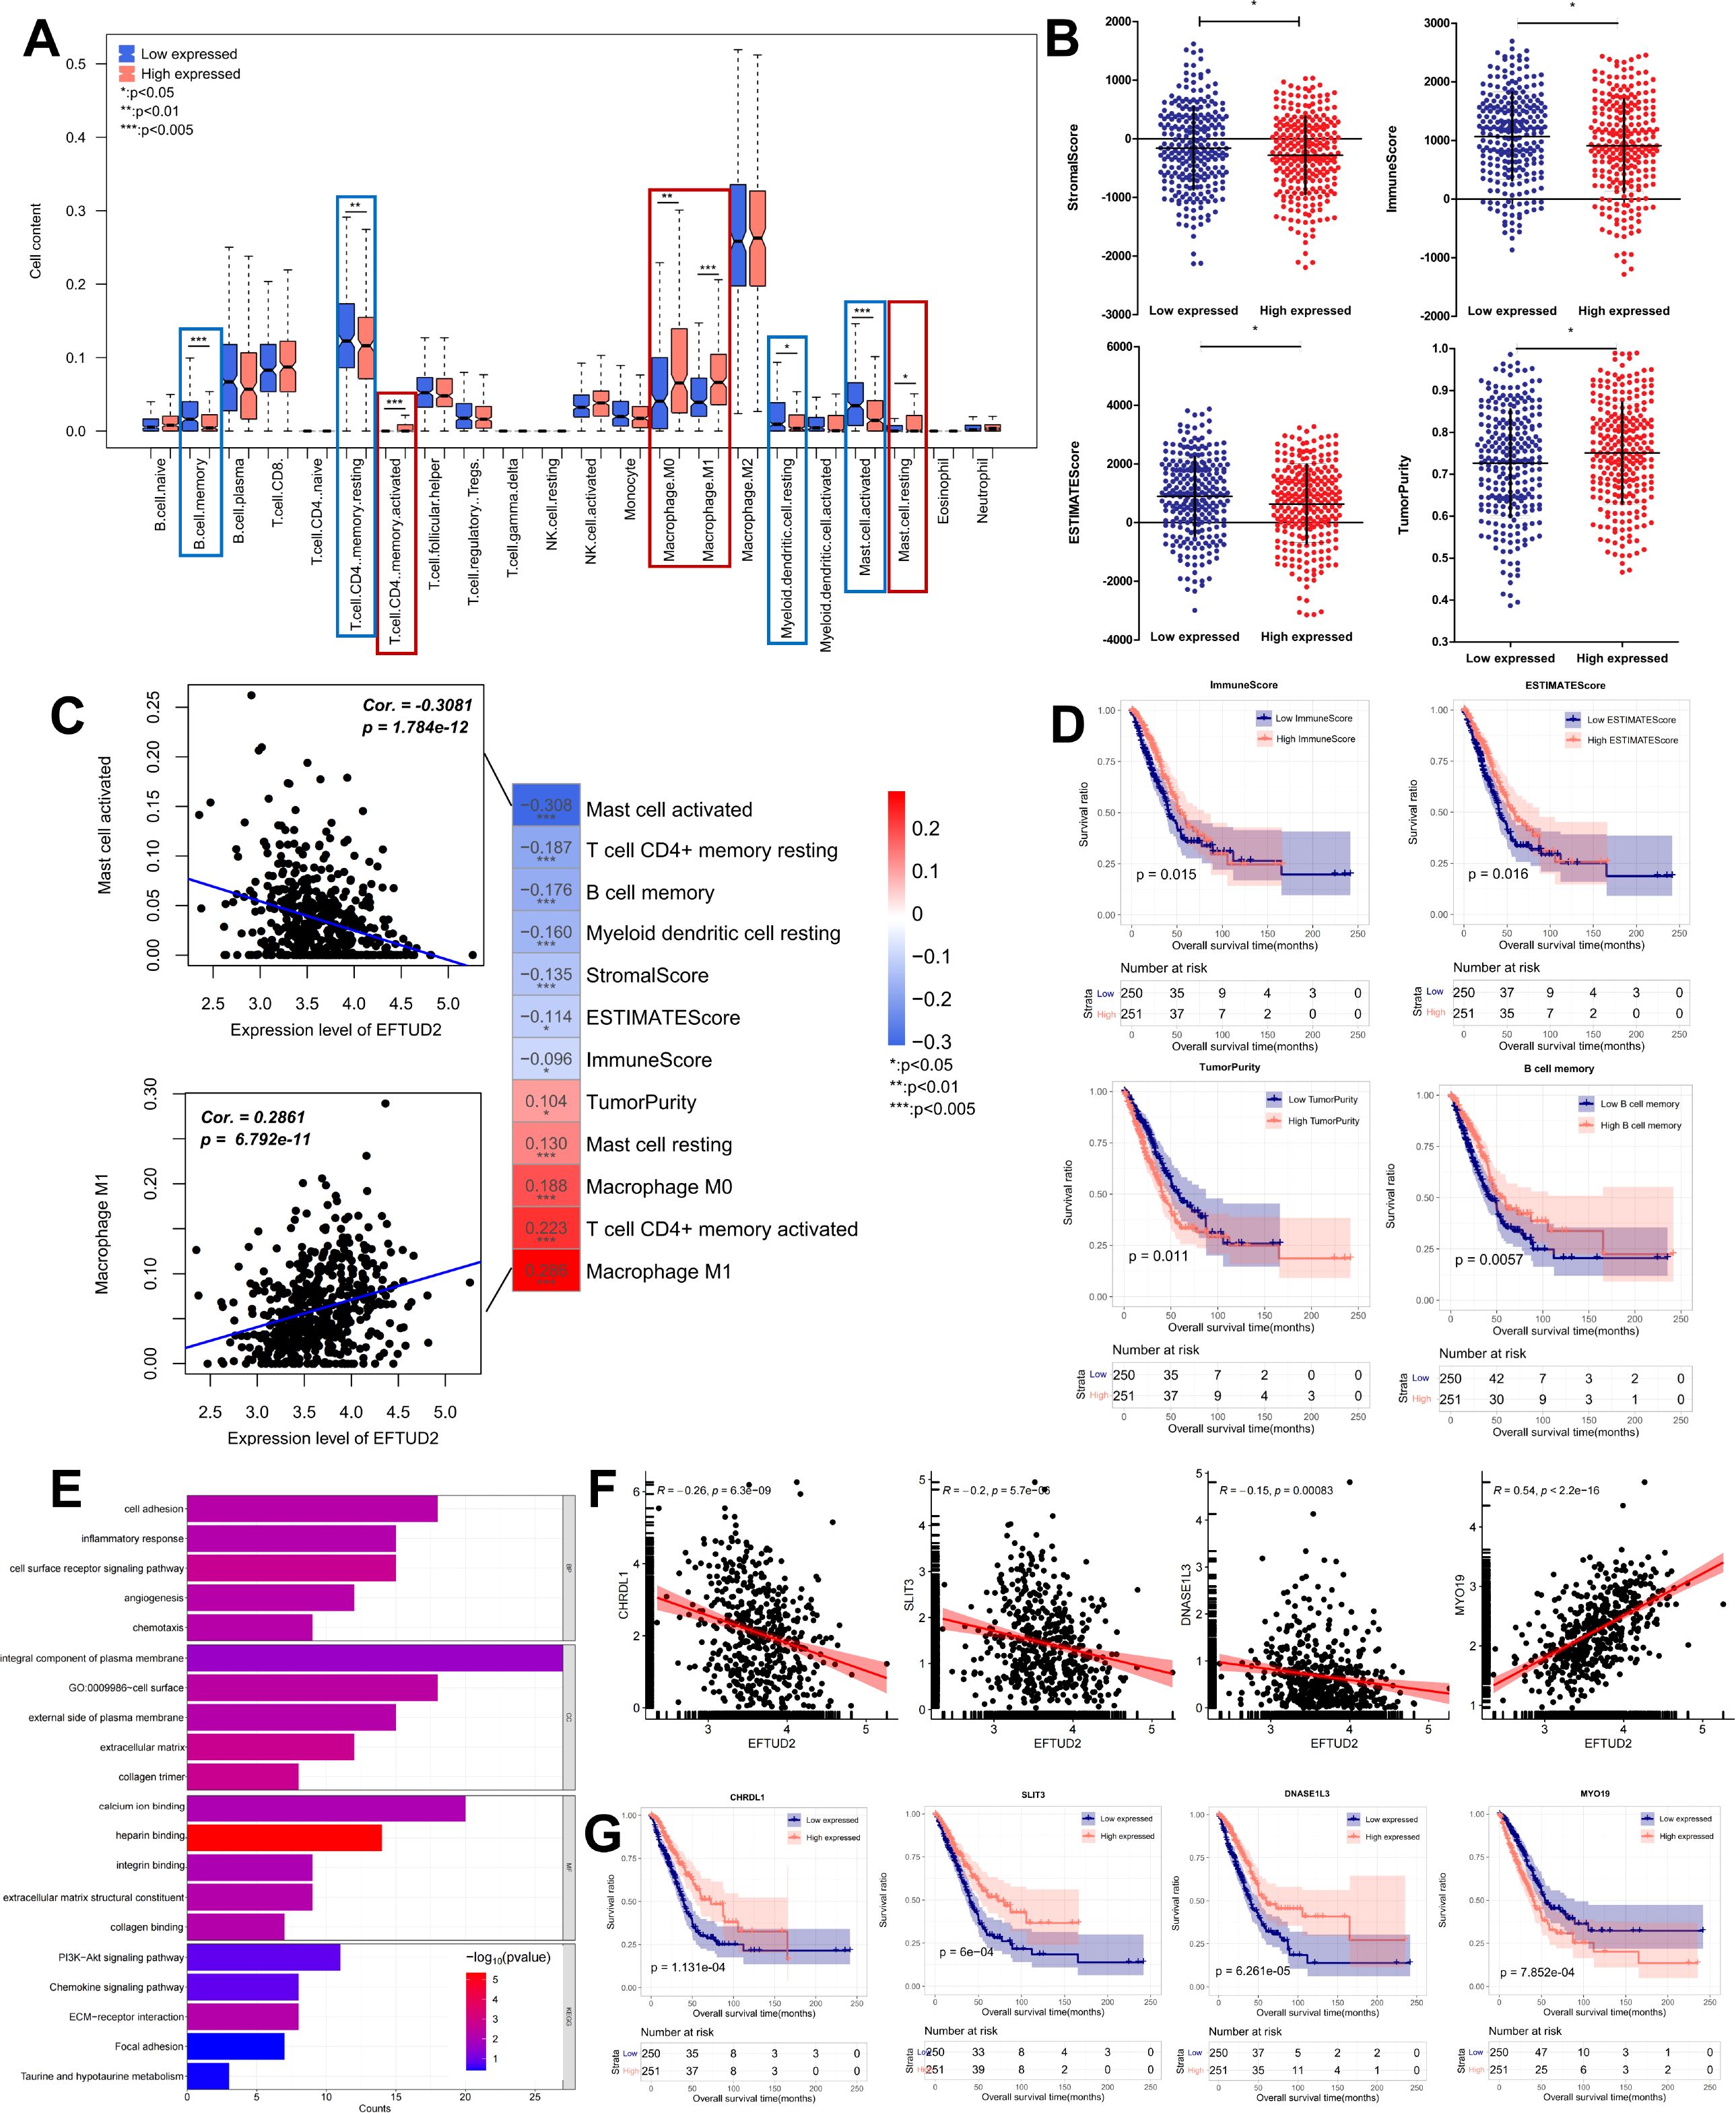
Figure 3. Impact of EFTUD2 on the TIME. (A) Immune cell distribution in LUAD tissues with high and low EFTUD2 expression. (B) ESTIMATE scores (TumorPurity, StromalScore, ImmuneScore, and ESTIMATEScore) in LUAD tissues with high and low EFTUD2 expression. (C) Correlation analysis of EFTUD2 with eight immune cell subtypes and ESTIMATE scores. (D) Survival analysis of memory B cells, ImmuneScore, ESTIMATEScore, and TumorPurity in LUAD. (E) GO and KEGG enrichment analyses of immune genes related to EFTUD2 (FDR < 0.05). (F) Correlation between EFTUD2 and related immune genes. (G) Survival analysis of EFTUD2-related immune genes in LUAD. *p < 0.05, **p < 0.01, ***p < 0.001.
EFTUD2 is involved in innate immune responses (43). Given the complex relationship between the cGAS-STING pathway and innate immunity, we explored whether EFTUD2 is associated with the cGAS-STING pathway. We first analyzed the expression of m6A-related genes between normal and LUAD tissues and found that SAMHD1, DTX4, TRIM21, and STAT6 expression was significantly lower and TBK1, IFI16, XRCC6, XRCC5, DDX41, IRF3, and PRKDC expression significantly higher in LUAD tissues (Figure 4A). Correlation analysis revealed that EFTUD2 was correlated positively with IFI16, SAMHD1, TBK1, DDX41, XRCC6, XRCC5, and PRKDC expression and negatively with STAT6 and DTX4 expression (Figure 4B). In addition, based on CNV analysis, we found that the expression levels of EFTUD2 were weakly positively correlated with the copy number variations of TBK1(Spearman: 0.15) and SAMHD1(Spearman: 0.18), whereas other genes did not show the same trend (Supplementary Figure S1F). This suggests that the elevated expression of TBK1 and SAMHD1 observed when EFTUD2 is upregulated may be partially influenced by copy number variations. The PPI demonstrated the presence of significant interactions between EFTUD2 and the aforementioned genes (Figure 4C). Moreover, our K–M survival analysis on these EFTUD2-related genes revealed that patients with high XRCC6 and XRCC5 expression had poor prognoses (Figure 4D). Thus, EFTUD2 may be involved in cGAS-STING pathway regulation.
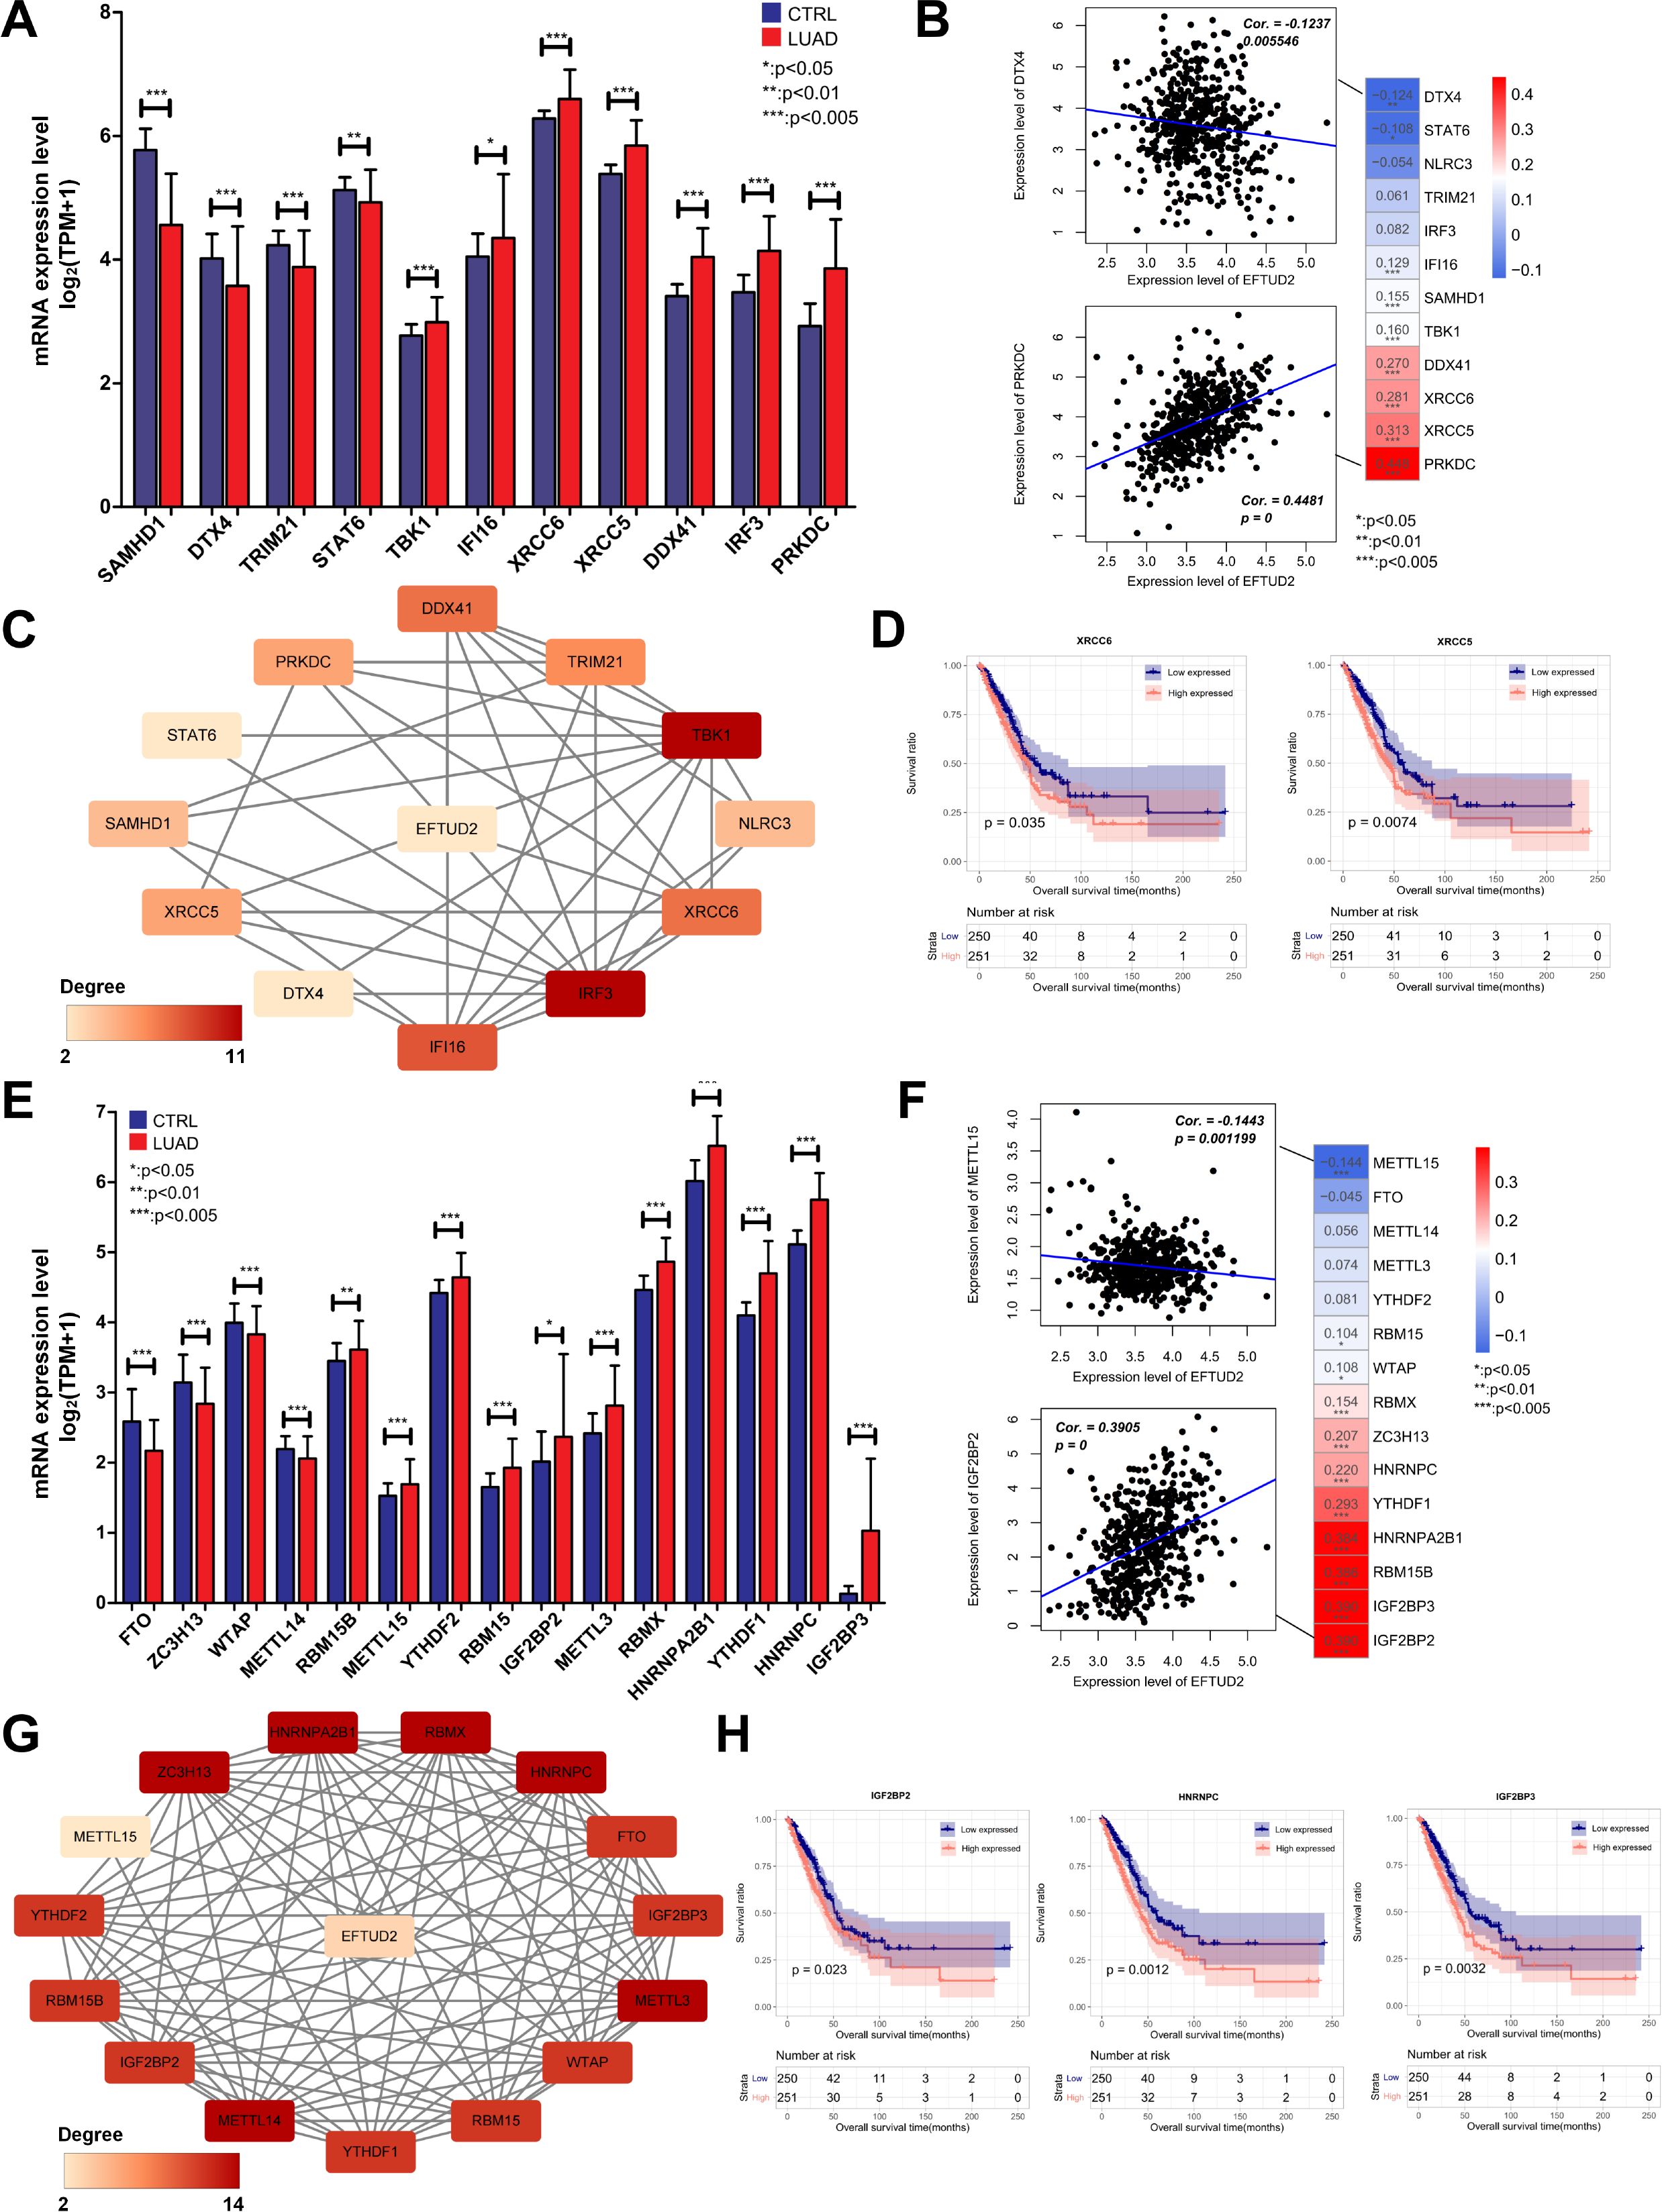
Figure 4. Correlation analysis of EFTUD2 with the cGAS-STING pathway and m6A modification in LUAD. (A) Expression of cGAS-STING pathway–related genes in normal and LUAD tissues. (B) Correlation of EFTUD2 with LUAD-specific cGAS-STING pathway genes. (C) PPI network of EFTUD2 and LUAD-specific cGAS-STING pathway genes. (D) Survival analysis for the cGAS-STING pathway genes XRCC6 and XRCC5. (E) Expression of m6A modification–related genes in normal and LUAD tissues. (F) Correlation of EFTUD2 with LUAD-specific m6A modification genes. (G) PPI network of EFTUD2 and LUAD-specific m6A modification genes. (H) Survival analysis of the m6A modification genes IGF2BP2, IGF2BP3, and HNRNPC. *p < 0.05, **p < 0.01, ***p < 0.001.
Because m6A modification orchestrates mRNA precursor processing, EFTUD2 is involved in spliceosome activation (8). Thus, we explored associations between EFTUD2 and m6A modification and compared the differential expression of m6A-related genes in normal and LUAD tissues. The results demonstrated that METTL14, RBM15B, METTL15, YTHDF2, RBM15, IGF2BP2, METTL3, RBMX, HNRNPA2B1, YTHDF1, HNRNPC, and IGF2BP3 were significantly overexpressed in LUAD tissues, whereas FTO, ZC3H13, and WTAP were significantly underexpressed (Figure 4E). We then analyzed the correlations between EFTUD2 and the aforementioned genes in patients with LUAD, and the results demonstrated that EFTUD2 expression was correlated positively with RBM15, WTAP, RBMX, ZC3H13, HNRNPC, YTHDF1, HNRNPA2B1, RBM15B, IGF2BP3, and IGF2BP2 expression and negatively with METTL15 expression (Figure 4F). Similarly, to assess whether changes in the expression levels of m6A genes were influenced by genetic mutations, we conducted CNV analysis. The results indicated that, among the m6A genes potentially affected by EFTUD2 levels, the mRNA levels of IGFBP2 (Spearman: 0.19), WTAP (Spearman: 0.12), and METTL15 (Spearman: -0.10) may be influenced by copy number variations to some extent; however, the correlation coefficients were relatively low (Supplementary Figure S1G). We also analyzed the interactions between EFTUD2 and the aforementioned m6A-associated genes and noted a robust correlation of EFTUD2 with the genes (Figure 4G). The K–M survival analysis revealed that IGF2BP2, HNRNPC, and IGF2BP3 expression—positively correlated with EFTUD2—were associated with poor prognosis in patients with LUAD (Figure 4H). These results indicated that m6A modification is strongly associated with EFTUD2.
To elucidate the biological functions of EFTUD2 in LUAD, we first detected EFTUD2 mRNA and protein expression in the LUAD cell lines A549, H1299, and PC9 and the normal lung fibroblasts cell line MRC-5. The results demonstrated that EFTUD2 expression was significantly higher in the LUAD cells than in the normal cells (Figure 5A). We knocked down EFTUD2 expression in the LUAD cells by using three siRNAs targeting distinct sequences and then detected EFTUD2 protein levels (Figure 5B). The results demonstrated that both si-EFTUD2#1 and si-EFTUD2#3 significantly interfered with EFTUD2 expression. Compared to si-EFTUD2#1, si-EFTUD2#3 achieved the most effective knockdown in A549 cells while exhibiting relatively consistent knockdown efficiency in PC9 and H1299 cells (Figure 5C). Therefore, we selected si-EFTUD2#3 for subsequent experiments. CCK-8 assays revealed that the proliferation of the three LUAD cell lines significantly decreased after EFTUD2 knockdown (Figure 5E). The transwell assay results demonstrated that in all three cell lines, compared with the negative control, si-EFTUD2#3 reduced cell invasion considerably (Figures 5 D, G). The wound healing assay results demonstrated that EFTUD2 knockdown significantly attenuated wound healing in LUAD cells compared with the control group. (Figures 5F, H). Moreover, PC9 and A549 cells transfected with si-EFTUD2#3 demonstrated significant decreases in their colony formation ability, indicating that EFTUD2 downregulation significantly weakened the tumorigenicity of LUAD cells (Figures 5I, J). Flow cytometry assays revealed that EFTUD2 knockdown led to cell-cycle arrest at the G0/G1 phase in H1299 cells (Figure 5K) and A549 cells (Figure 5L). Thus, EFTUD2 knockdown can inhibit proliferation, migration, invasion, tumorigenicity, and cell-cycle progression in LUAD cells.
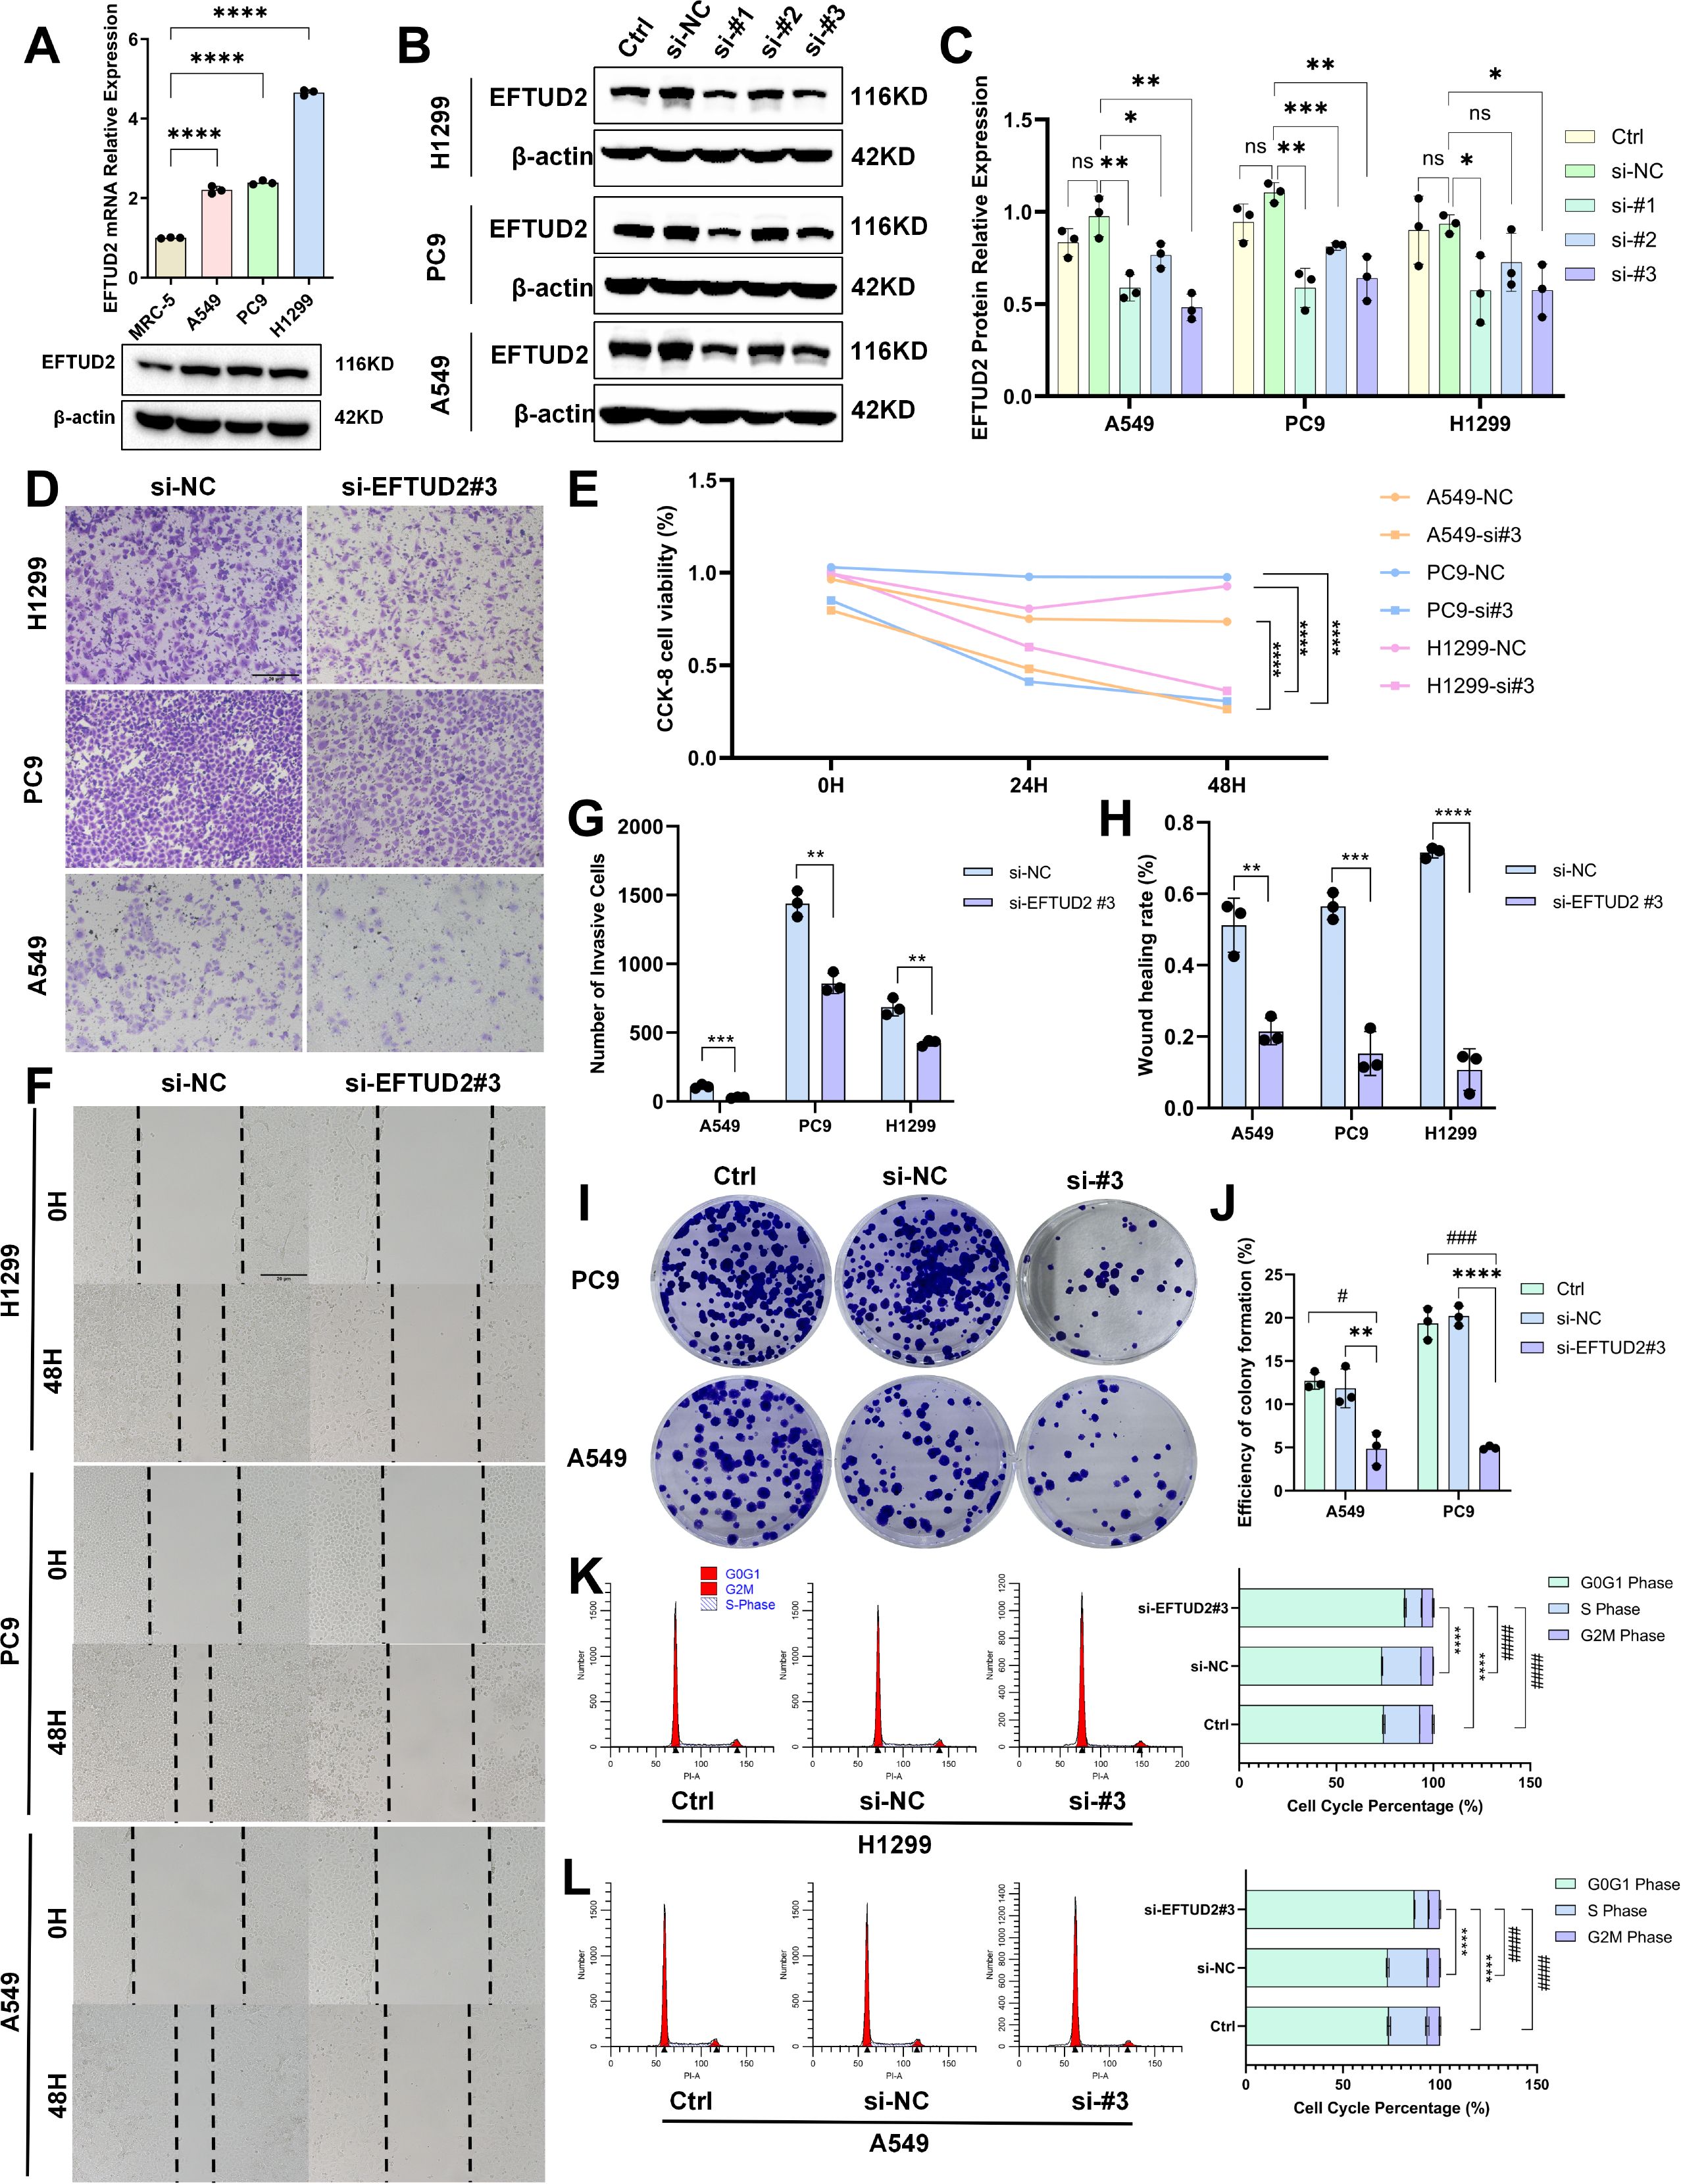
Figure 5. Impact of EFTUD2 knockdown on the proliferation, migration, invasion, tumorigenicity, and cell cycle progression of LUAD cells. (A) mRNA and protein expression of EFTUD2 in MRC-5, A549, PC9, and H1299 cells. (B) EFTUD2 protein expression in A549, PC9, and H1299 cells transfected with siRNA targeting EFTUD2 or negative control siRNA. (C) The quantitative results of EFTUD2 protein expression in A549, PC9, and H1299 cells transfected with three different siRNAs targeting EFTUD2, presented as means ± SDs. (D) A549, PC9, and H1299 cell invasion 48 h after transfection. (E) Cell proliferation of A549, PC9, and H1299 0, 24, and 48 h after transfection. (F) A549 and PC9 cell wound healing after EFTUD2 knockdown. (G) Numbers of invasive cells, presented as means ± SDs. (H) Numbers of migrating cells in wound healing assays, presented as means ± SDs. (I) Plate colony formation of A549 and PC9 cells transfected with siRNA targeting EFTUD2 or negative control siRNA. (J) Efficiency of colony formation (%), presented as means ± SDs. (K, L) Cell cycle in H1299 and A549 cells after EFTUD2 knockdown; * denotes the S phase, and # denotes the G0/G1 phase. *p < 0.05, **p < 0.01, ***p < 0.001, ****p < 0.0001, #p < 0.05, ###p < 0.001, ####p < 0.0001, and ns, not significant (p > 0.05).
To investigate the possible molecular mechanisms of EFTUD2 in LUAD, we performed GSEA on genes in the low and high EFTUD2 expression groups of patients with LUAD from TCGA. The results demonstrated that EFTUD2 upregulation is correlated with a prevalent enrichment of gene signatures across several pathways: the cell cycle, glycolysis, insulin signaling, MAPK, RIG-I-like receptor, wnt signaling, RNA degradation, and autophagy regulation (Figure 6A). Because glycolysis is a crucial metabolic process, providing energy to cancer cells, we examined the correlation between EFTUD2 and key enzymes involved in glycolysis in LUAD by using TIMER and identified significant associations between EFTUD2 and various regulatory enzymes including ENO1, glyceraldehyde 3-phosphate dehydrogenase (GAPDH), GPI, HK2, LDHA, PFKM, pyruvate kinase M2 (PKM2), PGAM1, PGK1, TPI1, and aldolase B (ALDOB; Figure 6B). We further investigated whether EFTUD2 is involved in glycolysis in the LUAD cell line A549. The results demonstrated that EFTUD2 knockdown led to a significant decrease in PKM2 and GAPDH protein expression but a significant increase in ALDOB protein expression (Figures 6C, D).
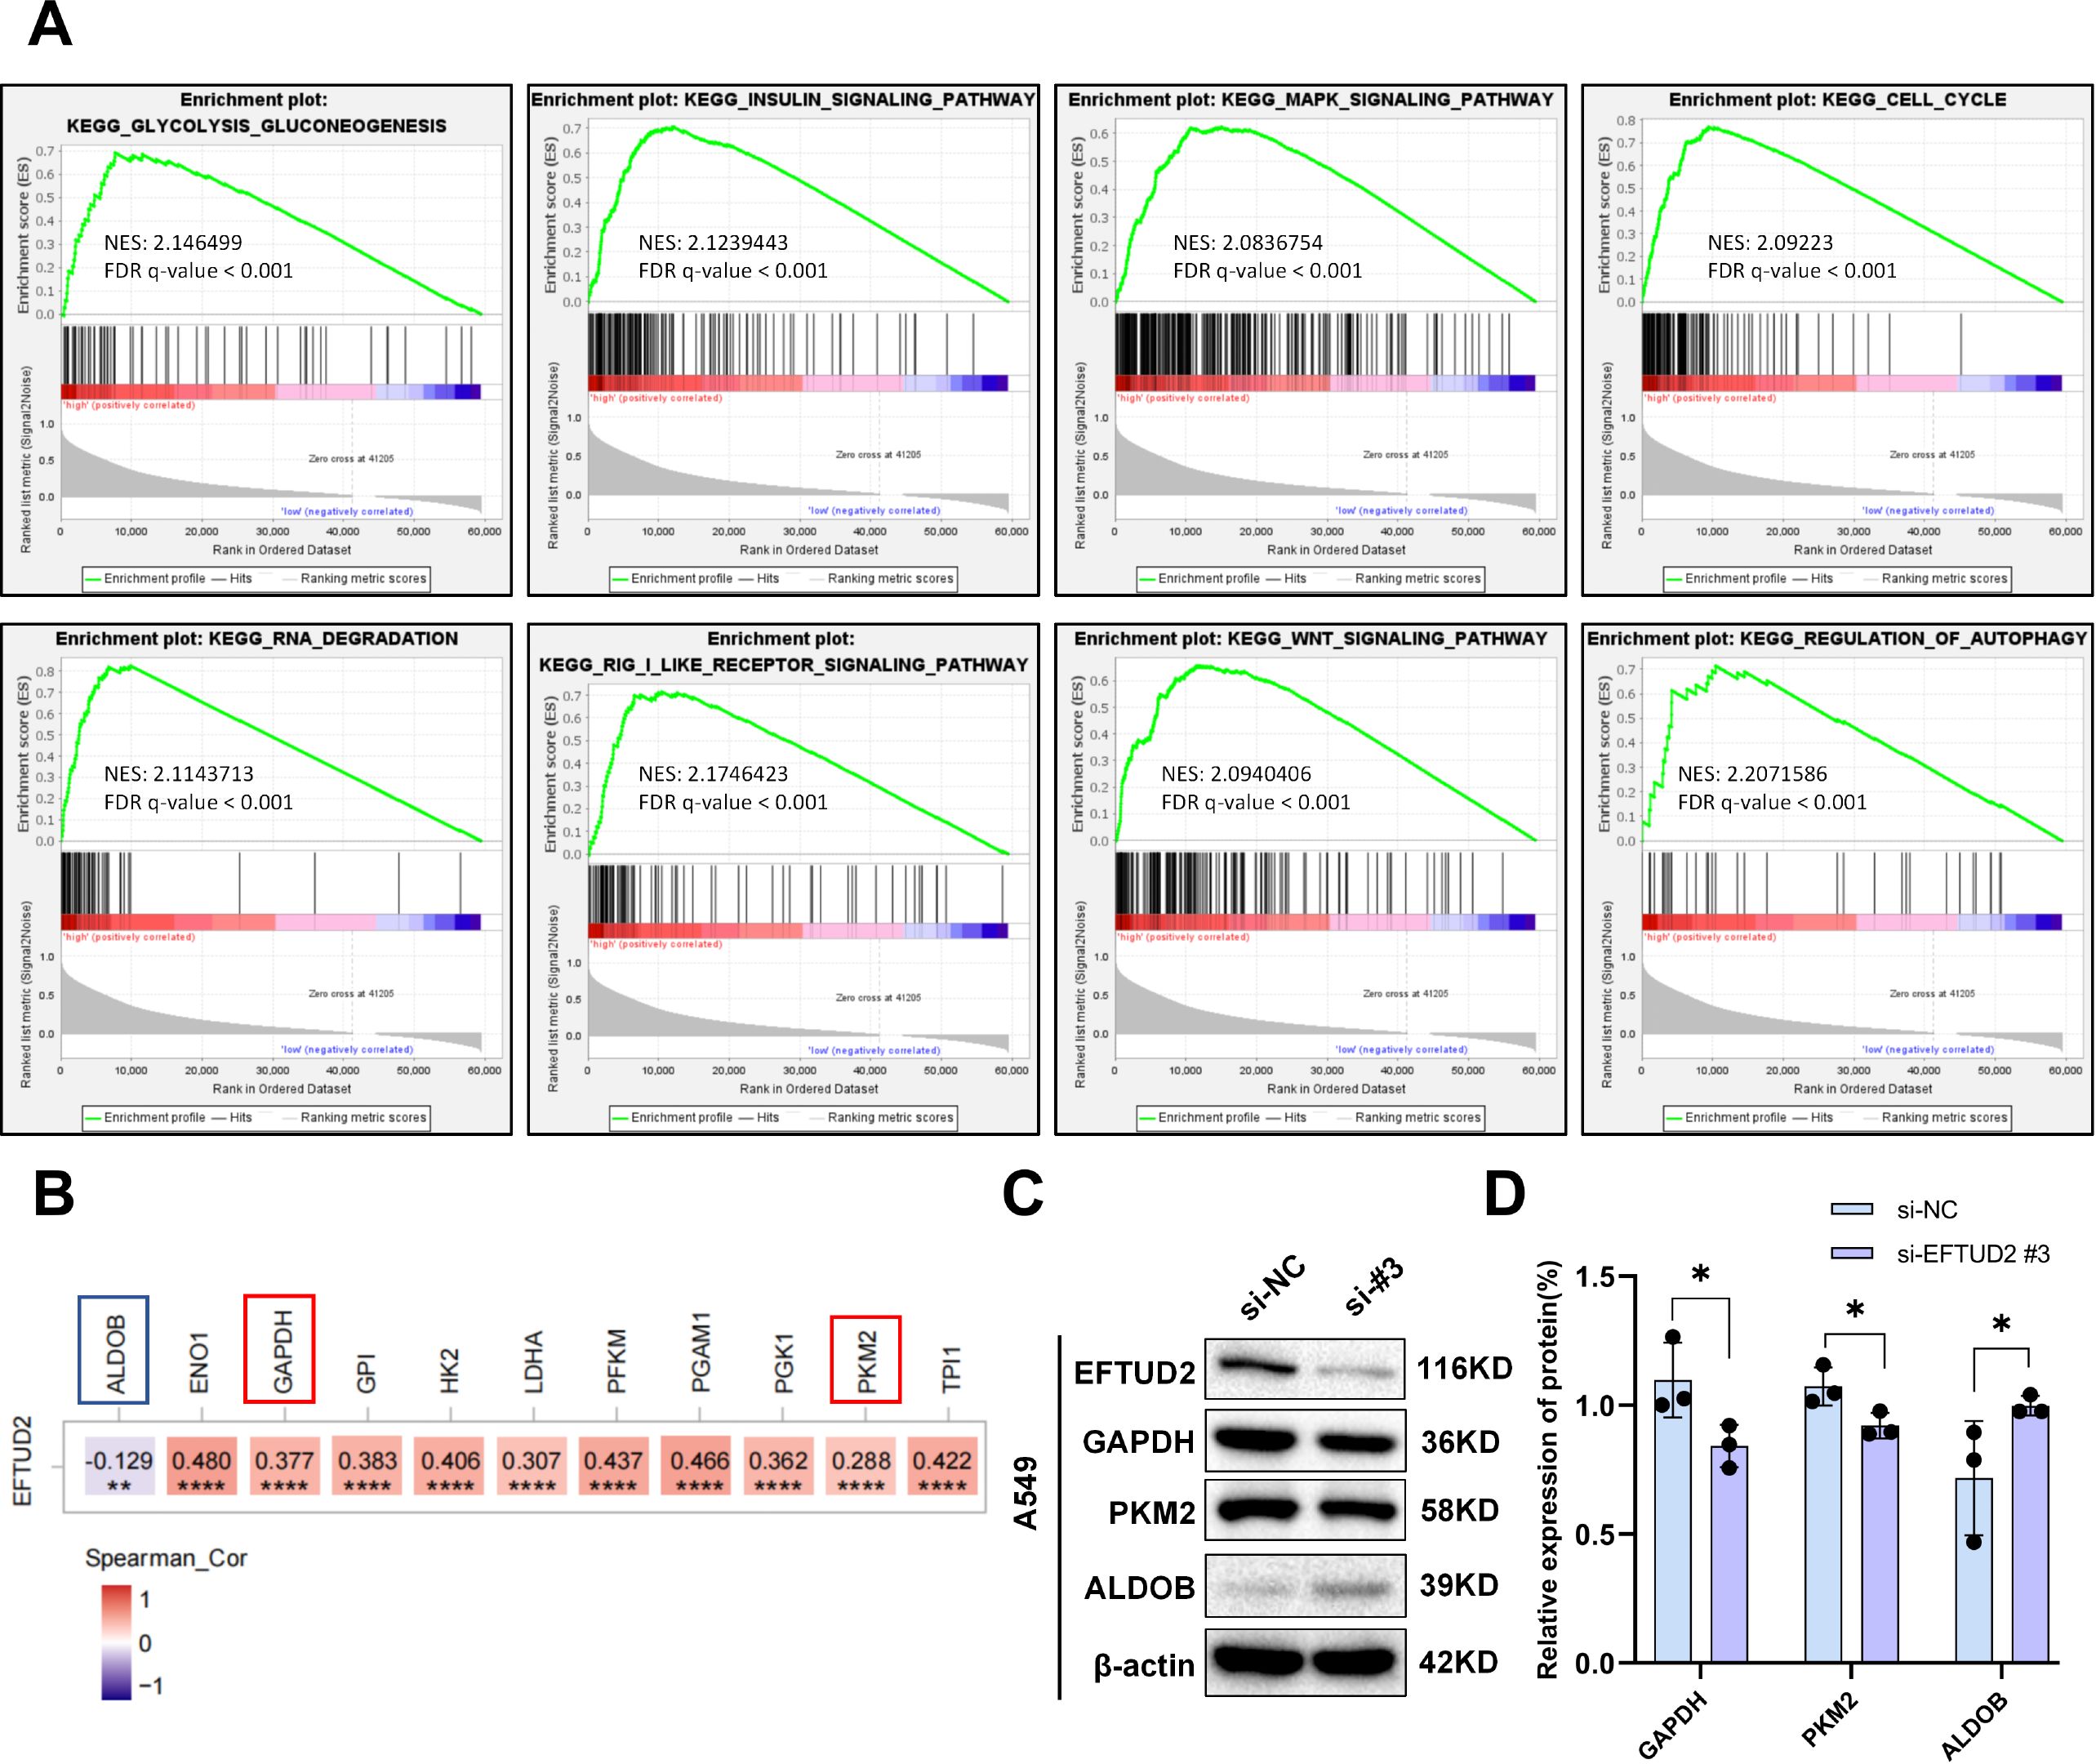
Figure 6. EFTUD2 involvement in multiple tumor-associated pathways in LUAD development and its promotion of tumor aerobic glycolysis. (A) GSEA based on EFTUD2 levels in LUAD. (B) Heatmap of correlation between EFTUD2 and key glycolytic enzymes in LUAD based on TCGA data from TIMER. (C) GAPDH, PKM2, and ALDOB protein expression in A549 cells after EFTUD2 knockdown. (D) GAPDH, PKM2, and ALDOB protein levels, presented as means ± SDs, in A549 cells after EFTUD2 knockdown. *p < 0.05, **p < 0.01, ****p < 0.0001.
We established a tumor xenograft model to investigate the role of EFTUD2 in mediating LUAD tumor growth in vivo. There was no significant difference in body weight between the control and knockdown groups throughout the mice’s growth period (Figure 7C). Over time, the growth of tumor volume in the EFTUD2 knockdown group gradually slowed down (Figure 7D). By day 16, the tumor volume and weight in the knockdown group were significantly lower than those in the control group (Figures 7 A, B). HE staining of the tumor xenografts revealed abundant microvessels and active tumor cell proliferation in the control group. In contrast, the EFTUD2 knockdown group displayed tumor necrosis foci, a reduced number of microvessels, and diminished tumor cell proliferation (Figure 7E).
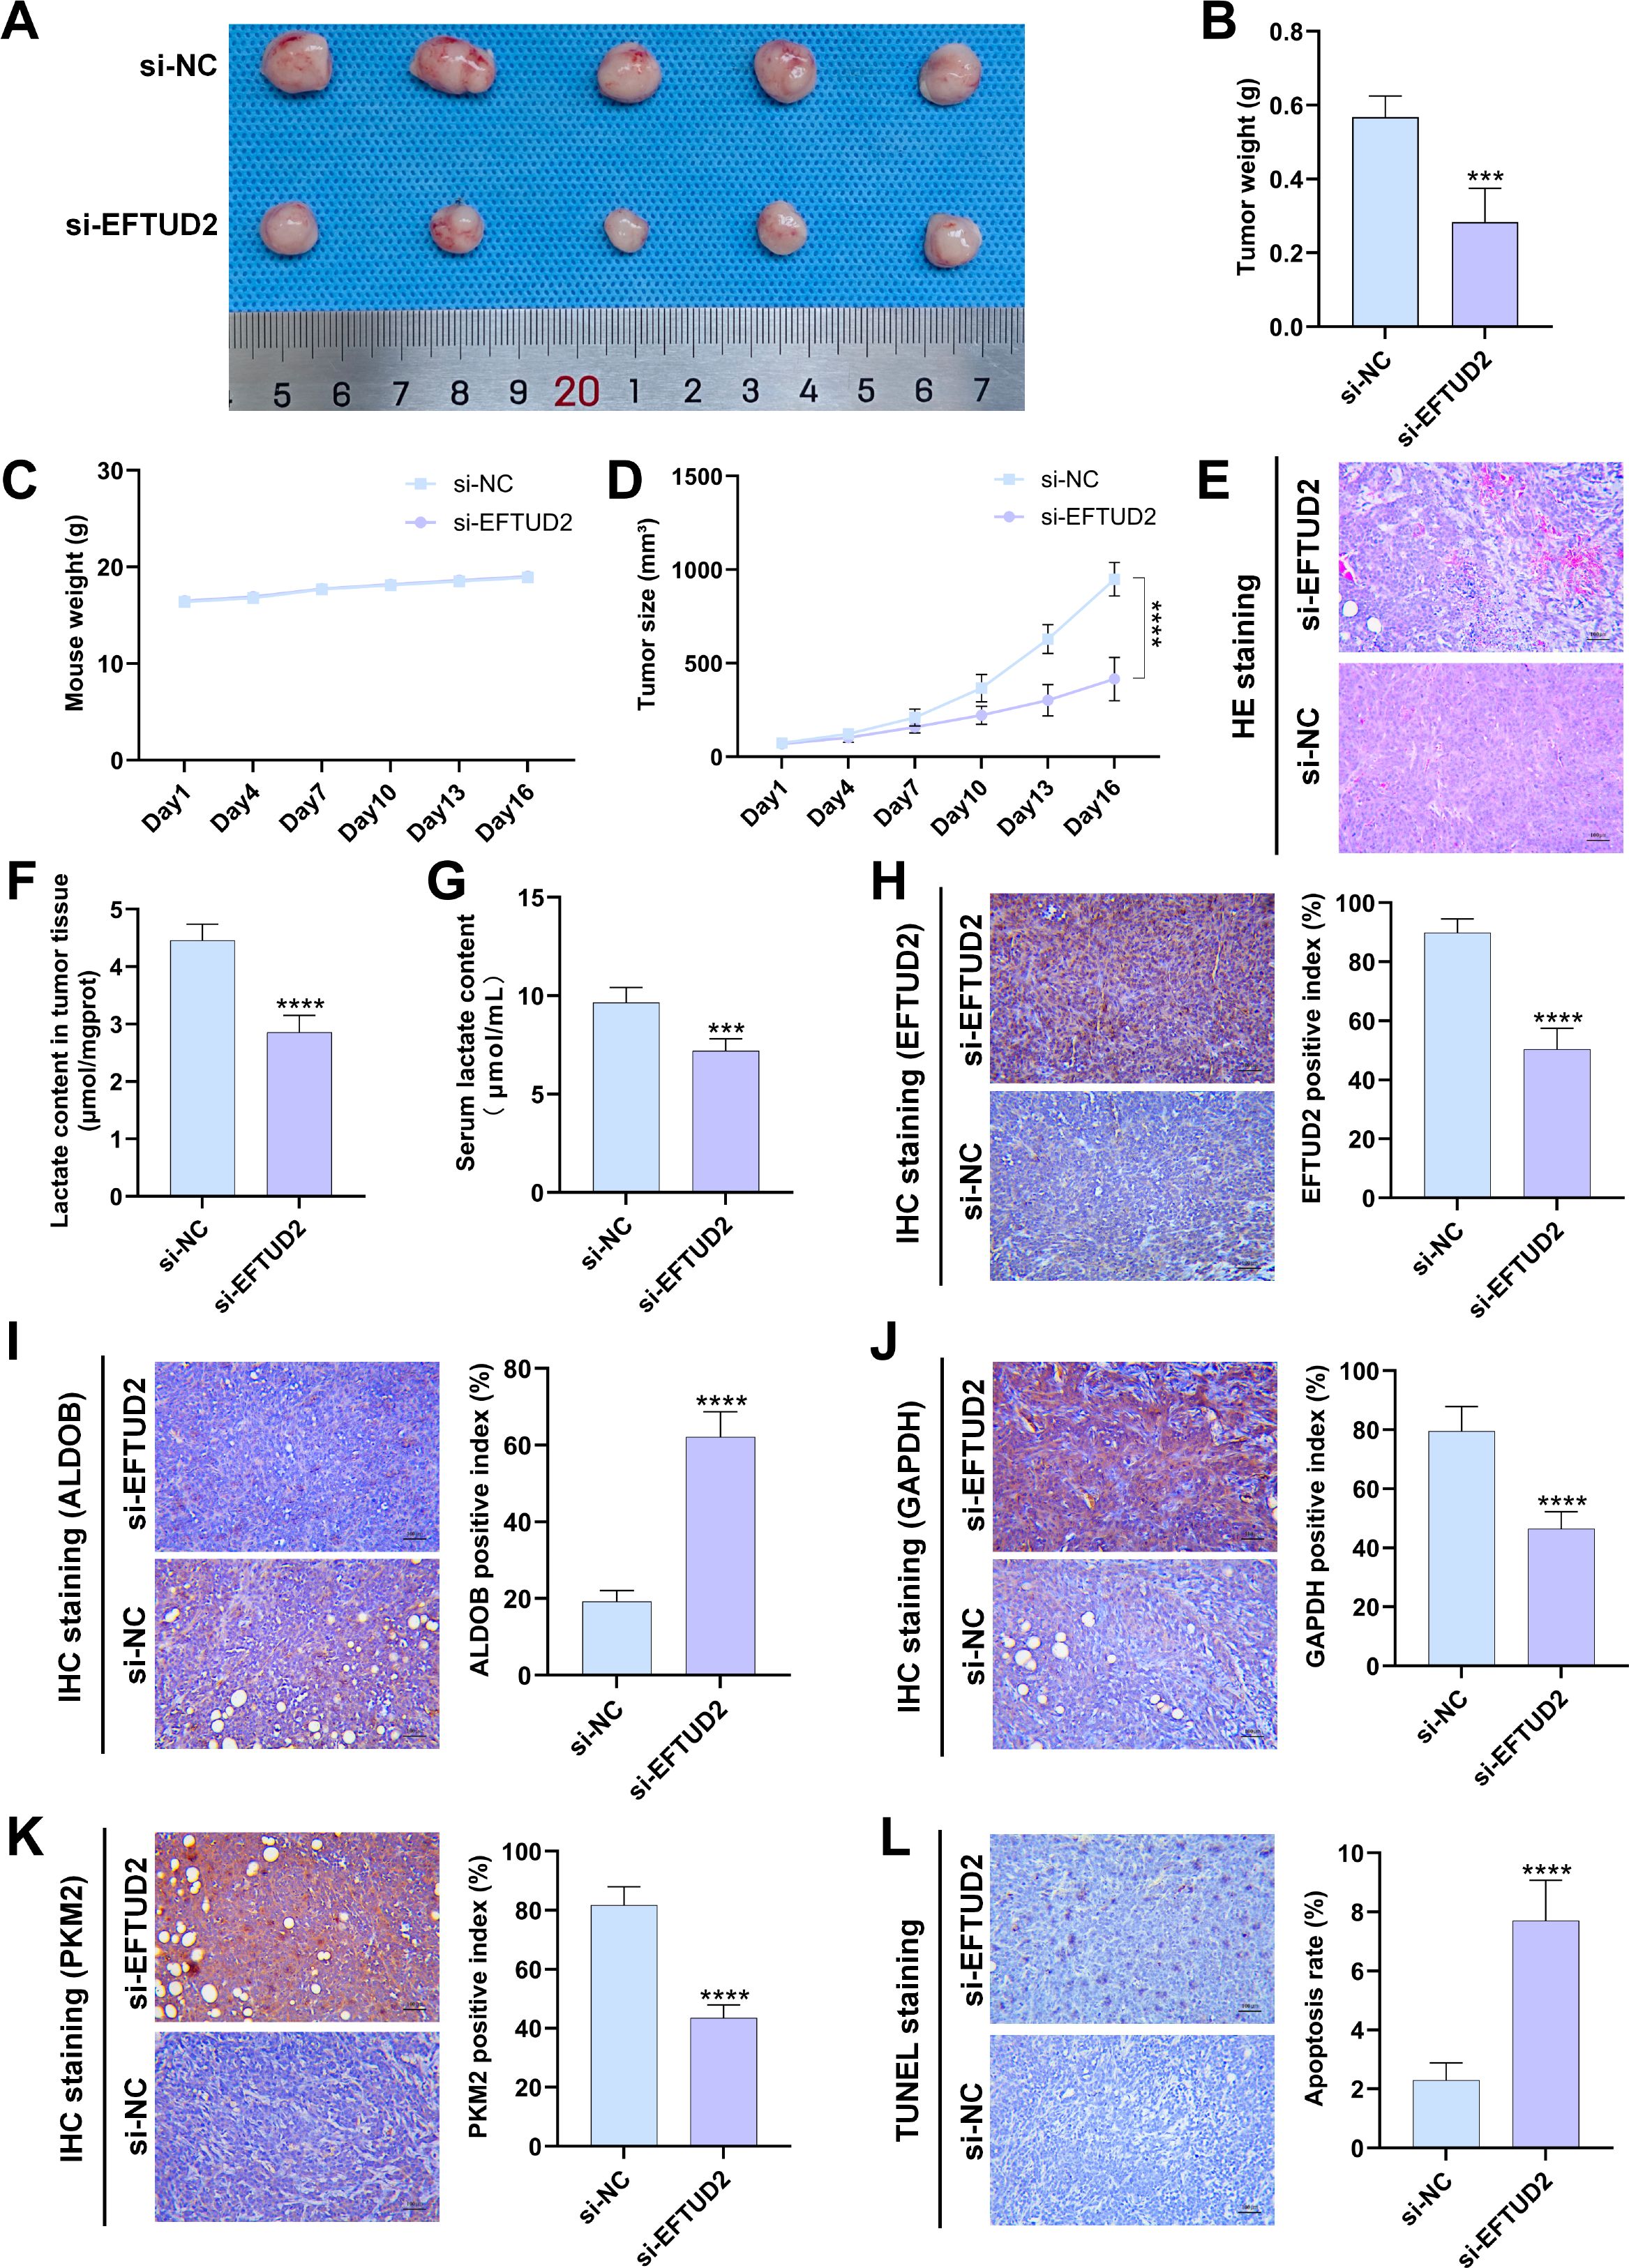
Figure 7. Effects of EFTUD2 knockdown on LUAD tumor growth, glycolysis, and apoptosis in vivo. (A) Photos of LUAD xenografts in the control and EFTUD2 knockdown groups. (B) Tumor weight of LUAD xenografts after EFTUD2 knockdown. (C) The tumor volume change curves of LUAD xenografts in the control and EFTUD2 knockdown groups. (D) The body weight change curves of mice bearing LUAD xenografts after EFTUD2 knockdown. (E) HE staining images of tumors after EFTUD2 knockdown. (F) Lactate content in tumor tissues after EFTUD2 knockdown. (G) Lactate content in the serum of mice after EFTUD2 knockdown before euthanasia. (H-K) IHC staining results of EFTUD2 (H), ALDOB (I), GAPDH (J), and PKM2 (K) in tumor tissues after EFTUD2 knockdown. (L) Cell apoptosis level in LUAD tumor xenograft tissues after EFTUD2 knockdown. Data represent the mean ± SDs. n = 5 per group. ***p < 0.001, ****p < 0.0001.
We measured lactate levels in the serum and tumor tissues of the collected mouse samples. The results revealed that, compared to the control group, lactate levels in both serum and tumor tissues of the EFTUD2 knockdown mice were significantly reduced (Figures 7F, G). We further evaluated the effect of EFTUD2 on key glycolytic enzymes using IHC staining. Following EFTUD2 knockdown, the protein expression of the glycolytic enzymes GAPDH and PKM2 decreased, while the expression of the negative regulator ALDOB increased (Figures 7H–K). These findings are consistent with the results from the cell experiments shown in Figure 6C. Additionally, TUNEL assays on tumor samples revealed that, compared to tumors from control mice, the tumor regions in the EFTUD2 knockdown group exhibited increased apoptosis (Figure 7L). These data suggest that knocking down EFTUD2 inhibits LUAD tumor growth in mice and suppresses glycolytic activity. Conversely, overactivation of EFTUD2 may promote LUAD tumor proliferation and elevate lactate metabolism levels in both the tumors and the host.
In the present study, we noted that EFTUD2 was strongly expressed in LUAD tissues by using data from online databases and confirmed these results in patient LUAD tissue samples and cell lines—consistent with its expression patterns in colorectal (24), hepatocellular (22), and endometrial (23) cancers. This suggests that EFTUD2 may be an important potential risk factor in cancer development. Analysis of bioinformatics data and clinical characteristics both revealed that elevated EFTUD2 expression in LUAD is correlated with age and N classification (i.e., local lymph node metastasis). Clinical characteristic analysis revealed that elevated EFTUD2 may contribute to pleural invasion and intravascular tumor thrombosis in LUAD patients. In addition, the bioinformatics analysis results demonstrated that strong EFTUD2 expression is related to smoking history. The discrepancy between bioinformatics and clinical data analyses might be due to an insufficient clinical specimen sample size. High EFTUD2 expression was also closely related to CYFRA-21-1, which has a significant diagnostic and prognostic value in LUAD (41, 44). Consistent with those for HCC (20) and endometrial cancer (23), our results also demonstrated that EFTUD2 not only functions as a poor prognosis indicator but also has a substantial diagnostic value in LUAD. In vivo tumor xenograft experiments showed that after EFTUD2 knockdown, the TUNEL-positive cell rate increased, indicating enhanced cell apoptosis. Moreover, reducing elevated EFTUD2 expression in LUAD cells led to considerable reductions in LUAD cell proliferation and tumorigenicity. Thus, high EFTUD2 expression is a potential biomarker of LUAD and may play an auxiliary role in its diagnosis and targeted therapy. Building on this, future research should focus on validating EFTUD2 in larger patient cohorts to confirm its clinical relevance and prognostic value.
Among EFTUD2-related hub genes, BUB1 and BUB1B are spindle assembly checkpoint genes that play pivotal roles in cell-cycle regulation (45), whereas KIF23 encodes mitotic kinesin-like protein 1, essential for cytokinesis (46). Thus, EFTUD2 may be closely associated with the cell cycle; this was confirmed through flow cytometry: EFTUD2 knockdown led LUAD cells to become arrested in the G0/G1 phase of the cell cycle, suggesting that high EFTUD2 expression promotes cell-cycle progression in LUAD. The GSEA analysis results also showed that EFTUD2 positively regulates the cell cycle pathway, providing strong evidence for its role in the cell cycle. Moreover, BUB1 is a potential biomarker for predicting outcomes in liver intrahepatic cholangiocarcinoma and gauging the condition’s immune profile (47). Increased BUB1B expression, achieved through m6A modification, can restore the malignant characteristics, self-renewal capabilities, and resistance to immune responses in cancer stem cells (48). Similarly, ANLN exhibits increased expression across various cancers and thus is considered an oncoimmunological biomarker (49). MYBL2 is overexpressed in various cancers, and it regulates proliferation, progression, and immune infiltration in all cancers (50–52). Elevated KIF23 expression has been linked to poorer cancer outcomes, and it is correlated with immune cell permeation and reaction to immunotherapeutic treatments (53, 54). The close relationship of these EFTUD2-associated genes with immune infiltration and responses in cancer cells suggests that in LUAD, strong EFTUD2 expression may have a complex relationship with immune responses.
Through CIBERSORT analysis, we noted that altered EFTUD2 expression affects the recruitment of various immune cells, such as memory B cells, memory CD4+T cells, resting myeloid dendritic cells, mast cells, and macrophages. Thus, EFTUD2 may influence both innate and adaptive immunity. Liu H et al. also explored the tumor microenvironment by studying immune cell infiltration. They validated the impact of breast cancer-associated genes on the TIME through CD8+ T cells (55). Among patients with decreased memory B cell infiltration, the prognosis is poorer. EFTUD2 expression is negatively correlated with the infiltration level of memory B cells. This suggests that when EFTUD2 is abnormally highly expressed, memory B cell infiltration is reduced, which may negatively impact the prognosis of LUAD patients. Notably, patients with high EFTUD2 expression demonstrated a decrease in activated mast cell infiltration but a significant increase in quiescent mast cell infiltration. Activated mast cells are among the first immune cell types recruited to the vicinity of tumors, capable of releasing various active chemokines and cytokines, further promoting immune cell infiltration (56, 57). Our findings suggested that elevated EFTUD2 expression suppresses mast cell activation or infiltration, subsequently affecting the infiltration of other immune cells.
The stromal and immune scores were employed to assess the degrees of stromal and immune cell infiltration, respectively—which provided a foundation for the ESTIMATE score to determine tumor purity within tumor tissues (58). In our ESTIMATE analysis, the high EFTUD2 expression group demonstrated lower StromalScore, ImmuneScore, and ESTIMATEScore values but higher TumorPurity scores; in other words, higher EFTUD2 expression may lead to the formation of a microenvironment with fewer immune and stromal cells and more tumor cells, which is consistent with the result that stromal and immune cell mixtures are negatively correlated TumorPurity scores (58–60). Immune score, a quantitative metric based on two lymphocyte populations, has been proposed to be a major prognostic factor in patients with cancer (61), whereas stromal score is also a valuable predictor of outcomes in patients with cancer (62). Here, we found that low StromalScore, ImmuneScore, and ESTIMATEScore values and high TumorPurity scores were associated with poor LUAD prognosis, indicating that EFTUD2 overexpression may shape a microenvironment detrimental to LUAD prognosis through alterations in immune, stromal, and tumor cell abundance.
The GO and KEGG enrichment analysis of EFTUD2-related immune genes demonstrated that these genes were mainly associated with cell adhesion, chemotaxis, and cell surface receptor binding. The chemotaxis of chemokines and cell adhesion molecules regulates various cancer development stages such as invasion and metastasis (63, 64). The binding of cell surface receptors to their ligands regulates intercellular communication and signal transduction between cancer and stromal cells, affecting cancer cell phenotypes in the tumor microenvironment (65). Therefore, we speculated that EFTUD2 controls LUAD cell invasion. Our in vitro invasion and wound-healing assays demonstrated that high EFTUD2 expression promoted LUAD cell invasion; however, the detailed underlying mechanisms warrant further analysis. Among the four immune genes most closely associated with EFTUD2, high expression levels of CHRDL1, SLIT3, and DNASE1L3 are associated with better prognosis in LUAD patients. However, the expression patterns of these genes in LUAD are opposite to that of EFTUD2. This precisely indicates that when EFTUD2 is highly expressed, the reduced levels of CHRDL1, SLIT3, and DNASE1L3 can have a poorer prognosis for LUAD patients. In contrast, the expression patterns and prognostic value of MYO19 are consistent with those of EFTUD2 in LUAD. CHRDL1 and SLIT3 downregulation contributes to the invasive behavior and progression of colorectal cancer cells and thyroid malignancies (66, 67), and decreased DNASE1L3 expression may be a novel diagnostic and prognostic biomarker associated with immune infiltrates in LUAD (68); these results are consistent with our findings. In contrast to our results, Ren et al. discovered that high MYO19 expression is negatively associated with tumor metastasis (69), which is a discrepancy potentially arising from MYO19 playing different roles in distinct types of cancer. Sheng M et al. recently reported that MYO19 is upregulated in non-small cell lung cancer (NSCLC) and can enhance cancer cell migration, promoting the expression of EMT markers (70). This is in strong agreement with our research findings. Thus, EFTUD2 overexpression may influence signaling transduction between cells and the matrix through interactions with these immune genes, thereby creating a microenvironment that facilitates LUAD cell migration and invasion.
In a study, time-course RNA-seq profiling of mouse embryonic fibroblasts revealed that EFTUD2 is associated with the cGAS-STING pathway (43). However, whether EFTUD2 is associated with the cGAS-STING pathway in LUAD remains unclear. Here, we screened nine cGAS-STING pathway–related DEGs between LUAD and normal tissues; of them, XRCC6, XRCC5, PRKDC, DDX41, IFI16, SAMHD1, and TBK1 were correlated positively with EFTUD2, whereas STAT6 and DTX4 were correlated negatively with EFTUD2. Further correlation analysis revealed that in patients with LUAD, shorter OS with higher XRCC6 and XRCC5 expression, indicating that EFTUD2 is closely associated with the cGAS-STING pathway in LUAD. The XRCC5-XRCC6 dimer, along with PRKDC, forms a small subunit combining with the HDP-RNP complex to serve as an IRF3 activation platform (71, 72). SAMHD1 inhibits cGAS-STING pathway–mediated innate and adaptive immunity, and the absence of SAMHD1 reduces tumor-free survival (73). TBK1, a key fraction of the type I interferon signaling pathway, is activated by various DNA and RNA sensors, including IFI16 (74) and DDX41 (75). Cui et al. reported that NLRP4-DTX4 activates TBK1 for ubiquitination and degradation (76). Because DTX4 demonstrated a significant negative correlation with EFTUD2 expression, we hypothesized that EFTUD2 maintains TBK1 expression by inhibiting DTX4 expression; however, further investigation to confirm the underlying mechanisms is warranted. STAT6 expression triggers a suite of chemokines, including CCL20 (77) and CCL2 (78), which attract various immune cells such as B cells, T cells, macrophages, and dendritic cells and facilitate their infiltration. Thus, elevated EFTUD2 expression and its engagement with the aforementioned cGAS-STING pathway–related genes may foster an inflammatory and immunological context favoring LUAD progression.
m6A is a prevalent form of posttranscriptional RNA modification, and m6A dysregulation plays a role in lung tumor development and progression (79). The expression patterns of m6A regulators are correlated with the immune landscape in LUAD (80). Diao et al. have reported that EFTUD2 interacts with and mediates the ubiquitination of the m6A regulator YTHDF3 (81). Here, we noted that EFTUD2 mainly exhibited significant positive correlations with the m6a regulators RBM15, WTAP, RBMX, ZC3H13, HNRNPC, YTHDF1, HNRNPA2B1, RBM15B, IGF2BP3, and IGF2BP2. Moreover, LUAD patients with higher IGF2BP2, HNRNPC, and IGF2BP3 expression demonstrated poorer prognoses. As an m6A methylation reader, IGF2BP2 triggers endothelial cell activation, facilitating angiogenesis and metastatic spread of LUAD cells (82), and IGF2BP2 is considered a potential immune biomarker in head and neck squamous cell carcinoma (83). Enhanced HNRNPC expression is strongly associated with tumor stage advancement and metastasis development (84), and HNRNPC is considered a predictor for the response to immunotherapy in non-small cell lung cancer cells (85). IGF2BP3, an oncogene involved in LUAD (86, 87), mediates m6A modification, promoting epithelial–mesenchymal transition and LUAD metastasis (88). Blocking IGF2BP3 boosted antitumor immune responses by facilitating T-cell activation, countering exhaustion, and promoting infiltration via the programmed death ligand 1 pathway (89, 90). EFTUD2 is positively correlated with the expression of the above genes, suggesting that EFTUD2 may be involved in the positive regulation of these cellular activities in LUAD and contribute to a poorer prognosis for patients. Taken together, our findings, along with those reported previously, indicated that EFTUD2 overexpression may interact with m6A regulators to form a TIME that promotes LUAD cell metastasis.
Notably, both HNRNPC and IGF2BP2 promote tumor aerobic glycolysis (91, 92), and our GSEA revealed that EFTUD2 upregulation was significantly and positively correlated with glycolysis. Cancer cells have developed numerous strategies to boost glycolysis, forming the core of their metabolic processes. Oncogenic signals accelerate metabolic functions of glycolytic enzymes, primarily by increasing the enzyme expression or altering the enzymes after synthesis (93). In the current in vitro and in vivo study, EFTUD2 knockdown led to a significant decrease in the expression of key glycolytic enzymes GAPDH and PKM2 but an increase in ALDOB expression, suggesting that EFTUD2 influences glycolysis in LUAD cells by regulating glycolytic enzyme expression. PKM2, a pyruvate kinase subtype, is a key enzyme limiting the glycolysis rate and significantly modulating tumor inflammatory metabolism (94). PKM2, a prognostic biomarker for LUAD, controls the TIME by regulating immune infiltration (95). GAPDH, typically recognized as a housekeeping gene, might play oncogenic roles across various cancers (96). Serotonylation of GAPDH prompts a metabolic reorientation toward glycolysis in CD8+T cells, bolstering their contribution to antitumor immunity (97). ALDOB facilitates a reversible metabolic process in which fructose-1,6-bisphosphate is transformed into dihydroxyacetone phosphate and glyceraldehyde-3-phosphate in glycolysis. Recently, ALDOB has been reported to be a tumor growth inhibitor (98, 99). A decrease in ALDOB expression is negatively associated with the presence of CD8+T cells in HCC tumor tissues, potentially allowing cancer cells to elude immune detection and affecting their susceptibility to immunotherapy (100). By monitoring the lactate levels in tumor tissues and serum in the later stages after tumor xenograft implantation in mice, we found that lactate levels in both serum and tumor tissues decreased following EFTUD2 knockdown. This is consistent with the aforementioned results, suggesting that the effect of EFTUD2 knockdown on glycolysis extends beyond key enzyme proteins and directly impacts lactate metabolism. Therefore, overexpressed EFTUD2 may participate in glycolysis by regulating PKM2, GAPDH, and ALDOB expression, thereby allowing LUAD cells to evade immune surveillance. In addition to the glycolysis pathway, GSEA analysis also showed that EFTUD2 is involved in regulating the insulin signaling pathway, which may be related to promoting glucose uptake by cells, thereby providing substrates for glycolysis.
Currently, tumor biomarkers explored from different perspectives of cancer using bioinformatic approaches encompass tumor diagnosis, prognosis, and therapy (101–104). Our study emphasizes the promoting role of elevated EFTUD2 expression in the progression of LUAD, and also includes its diagnostic and prognostic value for the tumor. The TCGA provides large-scale genomic data, but such large-scale data may also be affected by technical and biological biases (105). Further multi-omics studies are crucial for exploring the clinical value of EFTUD2 in LUAD (106). As an important splicing factor protein, EFTUD2 may indirectly promote the progression of LUAD by affecting the RNA splicing of other tumor-related genes. Similar mechanisms have been reported in tumor such as colitis-associated cancer (CAC) (24). Therefore, future studies should consider these alternative mechanisms to more comprehensively reveal the potential role of EFTUD2 in LUAD. Although our results suggest that EFTUD2 has significant value in the diagnosis and prognosis of LUAD, with the Cox univariate analysis showing a significant prognostic association (HR > 1), the multivariate analysis did not yield significant results. This indicates that the prognostic value of EFTUD2 in LUAD may be more closely related to disease progression. Furthermore, our study primarily focuses on the expression of EFTUD2 in LUAD tissues, but this approach may have limitations in both the study and clinical application of EFTUD2 in LUAD.
In this study, we first analyzed EFTUD2 expression and its relationship with the TIME, the cGAS-STING pathway, m6A modification, and glycolysis in LUAD. We noted that LUAD tissues demonstrate increased EFTUD2 expression, indicating its potential as a prognostic and diagnostic marker for LUAD. Moreover, high EFTUD2 expression was noted to be correlated with immune infiltration and influence the TIME to promote metastasis in LUAD. The interactions of EFTUD2 with genes related to the cGAS-STING pathway and m6A modification form an immunological context favoring LUAD progression and metastasis. Furthermore, EFTUD2 may promote the development of a tumor immune microenvironment (TIME) that facilitates immune escape in LUAD tumor cells by regulating the expression of glycolytic enzymes. In the future, additional in vitro and in vivo experiments clarifying the molecular mechanisms underlying EFTUD2 expression in relation to LUAD immunity and glycolysis further are warranted.
The original contributions presented in the study are included in the article/Supplementary Material. Further inquiries can be directed to the corresponding authors.
The studies involving humans were approved by the Ethics Committee of Sir Run Run Shaw Hospital, affiliated with Zhejiang University. The studies were conducted in accordance with the local legislation and institutional requirements. The ethics committee/institutional review board waived the requirement of written informed consent for participation from the participants or the participants’ legal guardians/next of kin because The study was a retrospective analysis and did not require written informed consent from participants, in accordance with national laws and institutional policies. The animal study was approved by Laboratory Animal Welfare Ethics Committee, Zhejiang Academy of Traditional Chinese Medicine. The study was conducted in accordance with the local legislation and institutional requirements.
AY: Investigation, Validation, Visualization, Writing – original draft. YX: Formal Analysis, Resources, Writing – original draft. XS: Data curation, Software, Writing – original draft. RW: Visualization, Writing – original draft. ZZ: Data curation, Writing – original draft. YC: Investigation, Visualization, Writing – original draft. LH: Investigation, Writing – original draft. GF: Resources, Writing – review & editing. WW: Supervision, Writing – review & editing. JW: Conceptualization, Funding acquisition, Resources, Writing – review & editing.
The author(s) declare that financial support was received for the research and/or publication of this article. This study was supported by the National Natural Science Foundation of China (Grant No. 82004007).
The authors declare that the research was conducted in the absence of any commercial or financial relationships that could be construed as a potential conflict of interest.
All claims expressed in this article are solely those of the authors and do not necessarily represent those of their affiliated organizations, or those of the publisher, the editors and the reviewers. Any product that may be evaluated in this article, or claim that may be made by its manufacturer, is not guaranteed or endorsed by the publisher.
The Supplementary Material for this article can be found online at: https://www.frontiersin.org/articles/10.3389/fonc.2025.1499217/full#supplementary-material
1. Chen Z, Fillmore CM, Hammerman PS, Kim CF, Wong KK. Non-small-cell lung cancers: A heterogeneous set of diseases. Nat Rev Cancer. (2014) 14:535–46. doi: 10.1038/nrc3775
2. Siegel RL, Giaquinto AN, Jemal A. Cancer statistics, 2024. CA Cancer J Clin. (2024) 74:12–49. doi: 10.3322/caac.21820
3. Force USPST, Krist AH, Davidson KW, Mangione CM, Barry MJ, Cabana M, et al. Screening for lung cancer: us preventive services task force recommendation statement. JAMA. (2021) 325:962–70. doi: 10.1001/jama.2021.1117
4. Liberatore E, Emmolo I. Cystic medullary thyroid cancer. Surgery. (1996) 120:903. doi: 10.1016/s0039-6060(96)80104-8
5. Yin X, Yang J, Wang H, Luo Y, Qin Z, Deng L, et al. Non-coding genome in small cell lung cancer between theoretical view and clinical applications. Semin Cancer Biol. (2022) 86:237–50. doi: 10.1016/j.semcancer.2022.03.024
6. Shi YX, Sheng DQ, Cheng L, Song XY. Current landscape of epigenetics in lung cancer: focus on the mechanism and application. J Oncol. (2019) 2019:8107318. doi: 10.1155/2019/8107318
7. Dai S, Liu T, Liu YY, He Y, Liu T, Xu Z, et al. Long non-coding rnas in lung cancer: the role in tumor microenvironment. Front Cell Dev Biol. (2021) 9:795874. doi: 10.3389/fcell.2021.795874
8. Bartels C, Klatt C, Luhrmann R, Fabrizio P. The ribosomal translocase homologue snu114p is involved in unwinding U4/U6 rna during activation of the spliceosome. EMBO Rep. (2002) 3:875–80. doi: 10.1093/embo-reports/kvf172
9. Gordon CT, Petit F, Oufadem M, Decaestecker C, Jourdain AS, Andrieux J, et al. Eftud2 haploinsufficiency leads to syndromic esophageal atresia. J Med Genet. (2012) 49:737–46. doi: 10.1136/jmedgenet-2012-101173
10. Pandya-Jones A, Bhatt DM, Lin CH, Tong AJ, Smale ST, Black DL. Splicing kinetics and transcript release from the chromatin compartment limit the rate of lipid a-induced gene expression. RNA. (2013) 19:811–27. doi: 10.1261/rna.039081.113
11. de Bruin RG, Shiue L, Prins J, de Boer HC, Singh A, Fagg WS, et al. Quaking promotes monocyte differentiation into pro-atherogenic macrophages by controlling pre-mrna splicing and gene expression. Nat Commun. (2016) 7:10846. doi: 10.1038/ncomms10846
12. Smigiel R, Bezniakow N, Jakubiak A, Bloch M, Patkowski D, Obersztyn E, et al. Phenotype analysis of polish patients with mandibulofacial dysostosis type guion-almeida associated with esophageal atresia and choanal atresia caused by eftud2 gene mutations. J Appl Genet. (2015) 56:199–204. doi: 10.1007/s13353-014-0255-4
13. Voigt C, Megarbane A, Neveling K, Czeschik JC, Albrecht B, Callewaert B, et al. Oto-facial syndrome and esophageal atresia, intellectual disability and zygomatic anomalies - expanding the phenotypes associated with eftud2 mutations. Orphanet J Rare Dis. (2013) 8:110. doi: 10.1186/1750-1172-8-110
14. Beauchamp MC, Djedid A, Bareke E, Merkuri F, Aber R, Tam AS, et al. Mutation in eftud2 causes craniofacial defects in mice via mis-splicing of mdm2 and increased P53. Hum Mol Genet. (2021) 30:739–57. doi: 10.1093/hmg/ddab051
15. Lines MA, Huang L, Schwartzentruber J, Douglas SL, Lynch DC, Beaulieu C, et al. Haploinsufficiency of a spliceosomal gtpase encoded by eftud2 causes mandibulofacial dysostosis with microcephaly. Am J Hum Genet. (2012) 90:369–77. doi: 10.1016/j.ajhg.2011.12.023
16. Gandomi SK, Parra M, Reeves D, Yap V, Gau CL. Array-cgh is an effective first-tier diagnostic test for eftud2-associated congenital mandibulofacial dysostosis with microcephaly. Clin Genet. (2015) 87:80–4. doi: 10.1111/cge.12328
17. De Arras L, Laws R, Leach SM, Pontis K, Freedman JH, Schwartz DA, et al. Comparative genomics rnai screen identifies eftud2 as a novel regulator of innate immunity. Genetics. (2014) 197:485–96. doi: 10.1534/genetics.113.160499
18. Cai J, Li Y, Hu P, Xu R, Yuan H, Zhang W, et al. Plerixafor and resatorvid inhibit hepatitis B virus in vitro by upregulating elongation factor tu gtp-binding domain containing 2. Front Cell Infect Microbiol. (2023) 13:1118801. doi: 10.3389/fcimb.2023.1118801
19. Zhu C, Xiao F, Hong J, Wang K, Liu X, Cai D, et al. Eftud2 is a novel innate immune regulator restricting hepatitis C virus infection through the rig-I/mda5 pathway. J Virol. (2015) 89:6608–18. doi: 10.1128/JVI.00364-15
20. Lv C, Li XJ, Hao LX, Zhang S, Song Z, Ji XD, et al. Over-activation of eftud2 correlates with tumor propagation and poor survival outcomes in hepatocellular carcinoma. Clin Transl Oncol. (2022) 24:93–103. doi: 10.1007/s12094-021-02673-y
21. Zhou W, Chen Y, Luo R, Li Z, Jiang G, Ou X. Identification of biomarkers related to immune cell infiltration in hepatocellular carcinoma using gene co-expression network. Pathol Oncol Res. (2021) 27:601693. doi: 10.3389/pore.2021.601693
22. Tu M, He L, You Y, Li J, Yao N, Qu C, et al. Eftud2 maintains the survival of tumor cells and promotes hepatocellular carcinoma progression via the activation of stat3. Cell Death Dis. (2020) 11:830. doi: 10.1038/s41419-020-03040-5
23. Beyer S, Muller L, Mitter S, Keilmann L, Meister S, Buschmann C, et al. High rig-I and eftud2 expression predicts poor survival in endometrial cancer. J Cancer Res Clin Oncol. (2023) 149:4293–303. doi: 10.1007/s00432-022-04271-z
24. Lv Z, Wang Z, Luo L, Chen Y, Han G, Wang R, et al. Spliceosome protein eftud2 promotes colitis-associated tumorigenesis by modulating inflammatory response of macrophage. Mucosal Immunol. (2019) 12:1164–73. doi: 10.1038/s41385-019-0184-y
25. Yuan L, Wu X, Zhang L, Yang M, Wang X, Huang W, et al. Sftpa1 is a potential prognostic biomarker correlated with immune cell infiltration and response to immunotherapy in lung adenocarcinoma. Cancer Immunol Immunother. (2022) 71:399–415. doi: 10.1007/s00262-021-02995-4
26. Selamat SA, Chung BS, Girard L, Zhang W, Zhang Y, Campan M, et al. Genome-scale analysis of DNA methylation in lung adenocarcinoma and integration with mrna expression. Genome Res. (2012) 22:1197–211. doi: 10.1101/gr.132662.111
27. Kabbout M, Garcia MM, Fujimoto J, Liu DD, Woods D, Chow CW, et al. Ets2 mediated tumor suppressive function and met oncogene inhibition in human non-small cell lung cancer. Clin Cancer Res. (2013) 19:3383–95. doi: 10.1158/1078-0432.CCR-13-0341
28. Girard L, Rodriguez-Canales J, Behrens C, Thompson DM, Botros IW, Tang H, et al. An expression signature as an aid to the histologic classification of non-small cell lung cancer. Clin Cancer Res. (2016) 22:4880–9. doi: 10.1158/1078-0432.CCR-15-2900
29. Barrett T, Wilhite SE, Ledoux P, Evangelista C, Kim IF, Tomashevsky M, et al. Ncbi geo: archive for functional genomics data sets–update. Nucleic Acids Res. (2013) 41:D991–5. doi: 10.1093/nar/gks1193
30. Cancer Genome Atlas Research N, Weinstein JN, Collisson EA, Mills GB, Shaw KR, Ozenberger BA, et al. The cancer genome atlas pan-cancer analysis project. Nat Genet. (2013) 45:1113–20. doi: 10.1038/ng.2764
31. Goldman MJ, Craft B, Hastie M, Repecka K, McDade F, Kamath A, et al. Visualizing and interpreting cancer genomics data via the xena platform. Nat Biotechnol. (2020) 38:675–8. doi: 10.1038/s41587-020-0546-8
32. Subramanian A, Tamayo P, Mootha VK, Mukherjee S, Ebert BL, Gillette MA, et al. Gene set enrichment analysis: A knowledge-based approach for interpreting genome-wide expression profiles. Proc Natl Acad Sci U.S.A. (2005) 102:15545–50. doi: 10.1073/pnas.0506580102
33. Szklarczyk D, Gable AL, Nastou KC, Lyon D, Kirsch R, Pyysalo S, et al. The string database in 2021: customizable protein-protein networks, and functional characterization of user-uploaded gene/measurement sets. Nucleic Acids Res. (2021) 49:D605–D12. doi: 10.1093/nar/gkaa1074
34. Li T, Fu J, Zeng Z, Cohen D, Li J, Chen Q, et al. Timer2.0 for analysis of tumor-infiltrating immune cells. Nucleic Acids Res. (2020) 48:W509–W14. doi: 10.1093/nar/gkaa407
35. Liu H, Weng J. A pan-cancer bioinformatic analysis of rad51 regarding the values for diagnosis, prognosis, and therapeutic prediction. Front Oncol. (2022) 12:858756. doi: 10.3389/fonc.2022.858756
36. Liu H, Weng J. A comprehensive bioinformatic analysis of cyclin-dependent kinase 2 (Cdk2) in glioma. Gene. (2022) 822:146325. doi: 10.1016/j.gene.2022.146325
37. Chen B, Khodadoust MS, Liu CL, Newman AM, Alizadeh AA. Profiling tumor infiltrating immune cells with cibersort. Methods Mol Biol. (2018) 1711:243–59. doi: 10.1007/978-1-4939-7493-1_12
38. Huang da W, Sherman BT, Lempicki RA. Bioinformatics enrichment tools: paths toward the comprehensive functional analysis of large gene lists. Nucleic Acids Res. (2009) 37:1–13. doi: 10.1093/nar/gkn923
39. Huang da W, Sherman BT, Lempicki RA. Systematic and integrative analysis of large gene lists using david bioinformatics resources. Nat Protoc. (2009) 4:44–57. doi: 10.1038/nprot.2008.211
40. Liu H, Dilger JP, Lin J. The role of transient receptor potential melastatin 7 (Trpm7) in cell viability: A potential target to suppress breast cancer cell cycle. Cancers (Basel). (2020) 12(1):131. doi: 10.3390/cancers12010131
41. Park SY, Lee JG, Kim J, Park Y, Lee SK, Bae MK, et al. Preoperative serum cyfra 21-1 level as a prognostic factor in surgically treated adenocarcinoma of lung. Lung Cancer. (2013) 79:156–60. doi: 10.1016/j.lungcan.2012.11.006
42. Lee J, Rho JH, Roehrl MH, Wang JY. Dermatan sulfate is a potential regulator of igh via interactions with pre-bcr, gtf2i, and bip er complex in pre-B lymphoblasts. Front Immunol. (2021) 12:680212. doi: 10.3389/fimmu.2021.680212
43. Sun J, Li L, Hu J, Gao Y, Song J, Zhang X, et al. Time-course rna-seq profiling reveals isoform-level gene expression dynamics of the cgas-sting pathway. Comput Struct Biotechnol J. (2022) 20:6490–500. doi: 10.1016/j.csbj.2022.11.044
44. Lin Q, Chen XY, Liu WF, Zhu PW, Shi WQ, Li B, et al. Diagnostic value of ca-153 and cyfra 21-1 in predicting intraocular metastasis in patients with metastatic lung cancer. Cancer Med. (2020) 9:1279–86. doi: 10.1002/cam4.2354
45. Bolanos-Garcia VM, Blundell TL. Bub1 and bubr1: multifaceted kinases of the cell cycle. Trends Biochem Sci. (2011) 36:141–50. doi: 10.1016/j.tibs.2010.08.004
46. Iolascon A, Heimpel H, Wahlin A, Tamary H. Congenital dyserythropoietic anemias: molecular insights and diagnostic approach. Blood. (2013) 122:2162–6. doi: 10.1182/blood-2013-05-468223
47. Qi W, Bai Y, Wang Y, Liu L, Zhang Y, Yu Y, et al. Bub1 predicts poor prognosis and immune status in liver hepatocellular carcinoma. APMIS. (2022) 130:371–82. doi: 10.1111/apm.13219
48. Hu S, Yan X, Bian W, Ni B. The M6a reader igf2bp1 manipulates bub1b expression to affect Malignant behaviors, stem cell properties, and immune resistance of non-small-cell lung cancer stem cells. Cytotechnology. (2023) 75:517–32. doi: 10.1007/s10616-023-00594-y
49. Liu K, Cui L, Li C, Tang C, Niu Y, Hao J, et al. Pan-cancer analysis of the prognostic and immunological role of anln: an onco-immunological biomarker. Front Genet. (2022) 13:922472. doi: 10.3389/fgene.2022.922472
50. Qiu X, He H, Zeng H, Tong X, Zhang C, Liu Y, et al. Integrative transcriptome analysis identifies mybl2 as a poor prognosis marker for osteosarcoma and a pan-cancer marker of immune infiltration. Genes Dis. (2024) 11:101004. doi: 10.1016/j.gendis.2023.04.035
51. Musa J, Aynaud MM, Mirabeau O, Delattre O, Grunewald TG. Mybl2 (B-myb): A central regulator of cell proliferation, cell survival and differentiation involved in tumorigenesis. Cell Death Dis. (2017) 8:e2895. doi: 10.1038/cddis.2017.244
52. Jiao M, Zhang F, Teng W, Zhou C. Mybl2 is a novel independent prognostic biomarker and correlated with immune infiltrates in prostate cancer. Int J Gen Med. (2022) 15:3003–30. doi: 10.2147/IJGM.S351638
53. Liu H, Chen C, Fehm T, Cheng Z, Neubauer H. Identifying mitotic kinesins as potential prognostic biomarkers in ovarian cancer using bioinformatic analyses. Diagnostics (Basel). (2022) 12(2):470. doi: 10.3390/diagnostics12020470
54. Bai M, Liu X. Diagnostic biomarker kif23 is associated with immune infiltration and immunotherapy response in gastric cancer. Front Oncol. (2023) 13:1191009. doi: 10.3389/fonc.2023.1191009
55. Liu H, Dong A, Rasteh AM, Wang P, Weng J. Identification of the novel exhausted T cell cd8 + Markers in breast cancer. Sci Rep. (2024) 14:19142. doi: 10.1038/s41598-024-70184-1
56. Liang X, Yin G, Ma Y, Xu K, Liu J, Li J. The critical role of mast cell-derived hypoxia-inducible factor-1alpha in regulating mast cell function. J Pharm Pharmacol. (2016) 68:1409–16. doi: 10.1111/jphp.12622
57. da Silva EZ, Jamur MC, Oliver C. Mast cell function: A new vision of an old cell. J Histochem Cytochem. (2014) 62:698–738. doi: 10.1369/0022155414545334
58. Yoshihara K, Shahmoradgoli M, Martinez E, Vegesna R, Kim H, Torres-Garcia W, et al. Inferring tumor purity and stromal and immune cell admixture from expression data. Nat Commun. (2013) 4:2612. doi: 10.1038/ncomms3612
59. Chen D, Zhang H, Zhao L, Liu X, Xue S, Wu P, et al. Prognostic value of rilpl2 and its correlation with tumor immune microenvironment and glycolysis in non-small cell lung cancer. Cell Cycle. (2023) 22:841–57. doi: 10.1080/15384101.2022.2159203
60. Liu L, Wang C, Li S, Qu Y, Xue P, Ma Z, et al. Ero1l is a novel and potential biomarker in lung adenocarcinoma and shapes the immune-suppressive tumor microenvironment. Front Immunol. (2021) 12:677169. doi: 10.3389/fimmu.2021.677169
61. Sidaway P. Immunoscore provides a more accurate prognosis. Nat Rev Clin Oncol. (2018) 15:471. doi: 10.1038/s41571-018-0050-y
62. Xu X, Xu Y, Hu W, Hong W, Wang Y, Zhang X, et al. Stromal score is a promising index in tumor patients’ Outcome determination. Heliyon. (2023) 9:e22432. doi: 10.1016/j.heliyon.2023.e22432
63. Yang Y, Li J, Lei W, Wang H, Ni Y, Liu Y, et al. Cxcl12-cxcr4/cxcr7 axis in cancer: from mechanisms to clinical applications. Int J Biol Sci. (2023) 19:3341–59. doi: 10.7150/ijbs.82317
64. Smart JA, Oleksak JE, Hartsough EJ. Cell adhesion molecules in plasticity and metastasis. Mol Cancer Res. (2021) 19:25–37. doi: 10.1158/1541-7786.MCR-20-0595
65. Sato A, Rahman NIA, Shimizu A, Ogita H. Cell-to-cell contact-mediated regulation of tumor behavior in the tumor microenvironment. Cancer Sci. (2021) 112:4005–12. doi: 10.1111/cas.15114
66. Li J, Jiang Z, He J, Yang K, Chen J, Deng Q, et al. Effect of chrdl1 on angiogenesis and metastasis of colorectal cancer cells via tgf-beta/vegf pathway. Mol Carcinog. (2024) 63:1092–105. doi: 10.1002/mc.23711
67. Guan H, Wei G, Wu J, Fang D, Liao Z, Xiao H, et al. Down-regulation of mir-218-2 and its host gene slit3 cooperate to promote invasion and progression of thyroid cancer. J Clin Endocrinol Metab. (2013) 98:E1334–44. doi: 10.1210/jc.2013-1053
68. Chen J, Ding J, Huang W, Sun L, Chen J, Liu Y, et al. Dnase1l3 as a novel diagnostic and prognostic biomarker for lung adenocarcinoma based on data mining. Front Genet. (2021) 12:699242. doi: 10.3389/fgene.2021.699242
69. Ren X, Shi P, Su J, Wei T, Li J, Hu Y, et al. Loss of myo19 increases metastasis by enhancing microenvironmental ros gradient and chemotaxis. EMBO Rep. (2024) 25:971–90. doi: 10.1038/s44319-023-00052-y
70. Sheng M, Wang Q, Lou Y, Xiao Y, Wu X. Myl9 binding with myo19 suppresses epithelial-mesenchymal transition in non-small-cell lung cancer. Physiol Genomics. (2025) 57:1–7. doi: 10.1152/physiolgenomics.00119.2024
71. Shao Z, Flynn RA, Crowe JL, Zhu Y, Liang J, Jiang W, et al. DNA-pkcs has ku-dependent function in rrna processing and hematopoiesis. Nature. (2020) 579:291–6. doi: 10.1038/s41586-020-2041-2
72. Morchikh M, Cribier A, Raffel R, Amraoui S, Cau J, Severac D, et al. Hexim1 and neat1 long non-coding rna form a multi-subunit complex that regulates DNA-mediated innate immune response. Mol Cell. (2017) 67:387–99.e5. doi: 10.1016/j.molcel.2017.06.020
73. Schumann T, Ramon SC, Schubert N, Mayo MA, Hega M, Maser KI, et al. Deficiency for samhd1 activates mda5 in a cgas/sting-dependent manner. J Exp Med. (2023) 220(1):e20220829. doi: 10.1084/jem.20220829
74. Unterholzner L, Keating SE, Baran M, Horan KA, Jensen SB, Sharma S, et al. Ifi16 is an innate immune sensor for intracellular DNA. Nat Immunol. (2010) 11:997–1004. doi: 10.1038/ni.1932
75. Zhang Z, Yuan B, Bao M, Lu N, Kim T, Liu YJ. The helicase ddx41 senses intracellular DNA mediated by the adaptor sting in dendritic cells. Nat Immunol. (2011) 12:959–65. doi: 10.1038/ni.2091
76. Cui J, Li Y, Zhu L, Liu D, Songyang Z, Wang HY, et al. Nlrp4 negatively regulates type I interferon signaling by targeting the kinase tbk1 for degradation via the ubiquitin ligase dtx4. Nat Immunol. (2012) 13:387–95. doi: 10.1038/ni.2239
77. Nakayama T, Watanabe Y, Oiso N, Higuchi T, Shigeta A, Mizuguchi N, et al. Eotaxin-3/cc chemokine ligand 26 is a functional ligand for cx3cr1. J Immunol. (2010) 185:6472–9. doi: 10.4049/jimmunol.0904126
78. Yadav A, Saini V, Arora S. Mcp-1: chemoattractant with a role beyond immunity: A review. Clin Chim Acta. (2010) 411:1570–9. doi: 10.1016/j.cca.2010.07.006
79. Diao MN, Zhang XJ, Zhang YF. The critical roles of M6a rna methylation in lung cancer: from mechanism to prognosis and therapy. Br J Cancer. (2023) 129:8–23. doi: 10.1038/s41416-023-02246-6
80. Wan RJ, Bai L, Jiang J, Hu CP, Chen Q, Zhao BR, et al. N6-methyladenosine (M6a) regulator expression pattern correlates with the immune landscape in lung adenocarcinoma. Gene. (2022) 836:146639. doi: 10.1016/j.gene.2022.146639
81. Zhou R, Ni W, Qin C, Zhou Y, Li Y, Huo J, et al. A functional loop between yth domain family protein ythdf3 mediated M(6)a modification and phosphofructokinase pfkl in glycolysis of hepatocellular carcinoma. J Exp Clin Cancer Res. (2022) 41:334. doi: 10.1186/s13046-022-02538-4
82. Fang H, Sun Q, Zhou J, Zhang H, Song Q, Zhang H, et al. M(6)a methylation reader igf2bp2 activates endothelial cells to promote angiogenesis and metastasis of lung adenocarcinoma. Mol Cancer. (2023) 22:99. doi: 10.1186/s12943-023-01791-1
83. Li S, Wu Q, Liu J, Zhong Y. Identification of two M6a readers ythdf1 and igf2bp2 as immune biomarkers in head and neck squamous cell carcinoma. Front Genet. (2022) 13:903634. doi: 10.3389/fgene.2022.903634
84. Yan M, Sun L, Li J, Yu H, Lin H, Yu T, et al. Rna-binding protein khsrp promotes tumor growth and metastasis in non-small cell lung cancer. J Exp Clin Cancer Res. (2019) 38:478. doi: 10.1186/s13046-019-1479-2
85. Gu Z, Yang Y, Ma Q, Wang H, Zhao S, Qi Y, et al. Hnrnpc, a predictor of prognosis and immunotherapy response based on bioinformatics analysis, is related to proliferation and invasion of nsclc cells. Respir Res. (2022) 23:362. doi: 10.1186/s12931-022-02227-y
86. Guo W, Huai Q, Wan H, Guo L, Song P, Gao S, et al. Prognostic impact of igf2bp3 expression in patients with surgically resected lung adenocarcinoma. DNA Cell Biol. (2021) 40:316–31. doi: 10.1089/dna.2020.6136
87. Chen X, Zhu X, Shen X, Liu Y, Fu W, Wang B. Igf2bp3 aggravates lung adenocarcinoma progression by modulation of pi3k/akt signaling pathway. Immunopharmacol Immunotoxicol. (2023) 45:370–7. doi: 10.1080/08923973.2022.2150636
88. Yang X, Bai Q, Chen W, Liang J, Wang F, Gu W, et al. M(6) a-dependent modulation via igf2bp3/mcm5/notch axis promotes partial emt and luad metastasis. Adv Sci (Weinh). (2023) 10:e2206744. doi: 10.1002/advs.202206744
89. Wan W, Ao X, Chen Q, Yu Y, Ao L, Xing W, et al. Mettl3/igf2bp3 axis inhibits tumor immune surveillance by upregulating N(6)-methyladenosine modification of pd-L1 mrna in breast cancer. Mol Cancer. (2022) 21:60. doi: 10.1186/s12943-021-01447-y
90. Huang W, Zhu L, Huang H, Li Y, Wang G, Zhang C. Igf2bp3 overexpression predicts poor prognosis and correlates with immune infiltration in bladder cancer. BMC Cancer. (2023) 23:116. doi: 10.1186/s12885-022-10353-5
91. He P, Liu X, Yu G, Wang Y, Wang S, Liu J, et al. Mettl3 facilitates prostate cancer progression via inducing hoxc6 M6a modification and stabilizing its expression through igf2bp2-dependent mechanisms. Mol Cell Biochem. (2024) 479:1707–20. doi: 10.1007/s11010-024-05023-y
92. Weng H, Huang F, Yu Z, Chen Z, Prince E, Kang Y, et al. The M(6)a reader igf2bp2 regulates glutamine metabolism and represents a therapeutic target in acute myeloid leukemia. Cancer Cell. (2022) 40:1566–82 e10. doi: 10.1016/j.ccell.2022.10.004
93. Paul S, Ghosh S, Kumar S. Tumor glycolysis, an essential sweet tooth of tumor cells. Semin Cancer Biol. (2022) 86:1216–30. doi: 10.1016/j.semcancer.2022.09.007
94. Wang J, Yang P, Yu T, Gao M, Liu D, Zhang J, et al. Lactylation of pkm2 suppresses inflammatory metabolic adaptation in pro-inflammatory macrophages. Int J Biol Sci. (2022) 18:6210–25. doi: 10.7150/ijbs.75434
95. Yin L, Shi J, Zhang J, Lin X, Jiang W, Zhu Y, et al. Pkm2 is a potential prognostic biomarker and related to immune infiltration in lung cancer. Sci Rep. (2023) 13:22243. doi: 10.1038/s41598-023-49558-4
96. Wang J, Yu X, Cao X, Tan L, Jia B, Chen R, et al. Gapdh: A common housekeeping gene with an oncogenic role in pan-cancer. Comput Struct Biotechnol J. (2023) 21:4056–69. doi: 10.1016/j.csbj.2023.07.034
97. Wang X, Fu SQ, Yuan X, Yu F, Ji Q, Tang HW, et al. A gapdh serotonylation system couples cd8(+) T cell glycolytic metabolism to antitumor immunity. Mol Cell. (2024) 84:760–75.e7. doi: 10.1016/j.molcel.2023.12.015
98. Peng C, Yang X, Li X, Ye Z, Wang J, Wu W. Aldob plays a tumor-suppressive role by inhibiting akt activation in gastric cancer. J Cancer. (2023) 14:2255–62. doi: 10.7150/jca.83456
99. Shao Y, Wu B, Yang Z, Liu Z, Ma Y, Huang H, et al. Aldob represents a potential prognostic biomarker for patients with clear cell renal cell carcinoma. Transl Androl Urol. (2023) 12:549–71. doi: 10.21037/tau-22-743
100. Yin C, Zhang C, Wang Y, Liu G, Wang N, Liang N, et al. Aldob/kat2a interactions epigenetically modulate tgf-beta expression and T cell functions in hepatocellular carcinogenesis. Hepatology. (2023) 81(1):77–93. doi: 10.1097/HEP.0000000000000704
101. Liu H, Dilger JP, Lin J. A pan-cancer-bioinformatic-based literature review of trpm7 in cancers. Pharmacol Ther. (2022) 240:108302. doi: 10.1016/j.pharmthera.2022.108302
102. Liu H, Weng J, Huang CL, Jackson AP. Is the voltage-gated sodium channel beta3 subunit (Scn3b) a biomarker for glioma? Funct Integr Genomics. (2024) 24:162. doi: 10.1007/s10142-024-01443-7
103. Liu H, Weng J, Huang CL, Jackson AP. Voltage-gated sodium channels in cancers. biomark Res. (2024) 12:70. doi: 10.1186/s40364-024-00620-x
104. Liu H, Karsidag M, Chhatwal K, Wang P, Tang T. Single-cell and bulk rna sequencing analysis reveals cenpa as a potential biomarker and therapeutic target in cancers. PloS One. (2025) 20:e0314745. doi: 10.1371/journal.pone.0314745
105. Liu H, Li Y, Karsidag M, Tu T, Wang P. Technical and biological biases in bulk transcriptomic data mining for cancer research. J Cancer. (2025) 16:34–43. doi: 10.7150/jca.100922
Keywords: lung adenocarcinoma, EFTUD2, prognosis, immune infiltration, glycolysis
Citation: Yin A, Xu Y, Su X, Wang R, Zhang Z, Chen Y, Han L, Fu G, Wang W and Wang J (2025) EFTUD2 is a promising diagnostic and prognostic indicator involved in the tumor immune microenvironment and glycolysis of lung adenocarcinoma. Front. Oncol. 15:1499217. doi: 10.3389/fonc.2025.1499217
Received: 20 September 2024; Accepted: 14 March 2025;
Published: 01 April 2025.
Edited by:
Zaki A. Sherif, Howard University, United StatesReviewed by:
Hengrui Liu, University of Cambridge, United KingdomCopyright © 2025 Yin, Xu, Su, Wang, Zhang, Chen, Han, Fu, Wang and Wang. This is an open-access article distributed under the terms of the Creative Commons Attribution License (CC BY). The use, distribution or reproduction in other forums is permitted, provided the original author(s) and the copyright owner(s) are credited and that the original publication in this journal is cited, in accordance with accepted academic practice. No use, distribution or reproduction is permitted which does not comply with these terms.
*Correspondence: Juan Wang, d2FuZ2p1YW56anVAMTYzLmNvbQ==; Wei Wang, d2FuZ3dlaWh6OEAxNjMuY29t; Guoxiang Fu, MzIwMTAxM0B6anUuZWR1LmNu
†These authors have contributed equally to this work and share first authorship
Disclaimer: All claims expressed in this article are solely those of the authors and do not necessarily represent those of their affiliated organizations, or those of the publisher, the editors and the reviewers. Any product that may be evaluated in this article or claim that may be made by its manufacturer is not guaranteed or endorsed by the publisher.
Research integrity at Frontiers
Learn more about the work of our research integrity team to safeguard the quality of each article we publish.