
94% of researchers rate our articles as excellent or good
Learn more about the work of our research integrity team to safeguard the quality of each article we publish.
Find out more
ORIGINAL RESEARCH article
Front. Oncol., 07 March 2025
Sec. Gastrointestinal Cancers: Hepato Pancreatic Biliary Cancers
Volume 15 - 2025 | https://doi.org/10.3389/fonc.2025.1492599
This article is part of the Research TopicImpact of the Inflammatory Microenvironment on Immune Infiltration in Colorectal and Liver Cancers: Insights for New Immunotherapeutic StrategiesView all 4 articles
 Mingchao Liang1†Tianqi Lai2,3†Zhen Li1†Wei Yu2Mingrong Cao2
 Nan Yao4
 Youzhu Hu1,2*
 Tongzheng Liu5*
 Junjie Liang2*
GINS1 is correlated with a poor prognosis in numerous cancers including liver hepatocellular carcinoma (LIHC). Here, efforts have been made to explore the function and underlying mechanism in LIHC through bioinformatics analysis. The mRNA and protein expression data of GINS1 were downloaded from The Cancer Genome Atlas (TCGA) database, the Clinical Proteomic Tumor Analysis Consortium (CPTAC), the University of Alabama at Birmingham CANcer Data Analysis Portal (UALCAN), and the Human Protein Atlas (HPA) database. Moreover, the protein expression of GINS1 was further substantiated by immunohistochemistry staining from 116 clinical samples. Subsequently, the diagnostic and prognostic role of GINS1 in LIHC patients were determined using receiver operating characteristic (ROC) analysis and the Kaplan-Meier plotter (KM-plotter) database. GeneMANIA and STRING databases were respectively used to construct gene and protein-protein interaction (PPI) networks of GINS1. Enrichment analyses were conducted to investigate the functions of GINS1. To assess the genetic alterations, methylation, and prognostic value, cBioPortal, and MethSurv databases were utilized. Additionally, Tumor Immune Estimation Resource (TIMER), Tumor-Immune System Interaction Database (TISIDB), and Gene Expression Profiling Interactive Analysis (GEPIA) were used to explore the correlation with tumor immune. Differential expression analyses validated the upregulation of GINS1 in LIHC. Furthermore, the prognostic and diagnostic values of GINS1 were substantiated by the ROC curve, Kaplan-Meier plotters, and forest plots. Further enrichment, methylation, and tumor immune microenvironment analyses showed an intimate connection with GINS1. In conclusion, GINS1 which is correlated with methylation and immune escape may predict the prognosis of LIHC.
Liver cancer, the sixth most common cancer, has already become the third leading cause of cancer death worldwide (1). Except for the hepatitis virus, risk factors for liver cancer also include alcohol, smoking, obesity, and diabetes (2, 3). Strikingly, more than 1 million patients will die of liver cancer in 2030 (4), and the metastasis or recurrence rate of liver cancer in 5 years is reported more than 70% (5). In the past decades, comprehensive diagnosis, monitoring, prevention, and treatment techniques have been employed to prevent and suppress this disease efficaciously (6). Notably, molecular targeted therapy has recently been investigated as a breakthrough in liver cancer treatment (7, 8). Therefore, a better comprehension of the molecular mechanisms in liver hepatocellular carcinoma (LIHC) is an essential prerequisite for the development of potential therapeutic strategies.
Interestingly, the tumor microenvironment is a dynamic system and is significantly related to poor prognosis in LIHC patients (9). Besides, tumor progression, invasion, metastasis, and recurrence are profoundly affected by the immune microenvironment of liver cancer (9, 10). Consequently, it is feasible to understand the mechanisms and promote the development of immunotherapy by studying the role of immune-related genes and the immune microenvironment.
GINS1 (PSF1), the constituent of eukaryotic DNA replication machinery, participates in regulating DNA replication (11). Within replisome progression complexes, the GINS tetrameric complex maintains the interaction with the MCM2-7 complex and CDC45 (12, 13). Meanwhile, the GINS tetrameric complex is required for cell growth and chromosomal DNA replication (12, 13). It is widely known that these multiple complexes (CDC45/MCM2-7/GINS) recruit DNA polymerases to regulate the initiation and progression phases of DNA replication (14–16). With high expression in stem cells and progenitor cells related to high proliferation potential, GINS1 promotes tumor growth (17). Reportedly, dysregulation of GINS1 has been demonstrated in association with an ominous prognosis and the progression of cancers (18). Nonetheless, the innate role of GINS1 in LIHC requires further elucidation.
Abnormal DNA methylation in tumors can occur before or after a cell mutation, which regulates gene expression in tumors by recruiting proteins involved in gene suppression or inhibiting the binding of transcription factors to DNA (19, 20). Additionally, it is reported that GINS1 deficiency underlined chronic neutropenia and NK cell deficiency (21). However, the relationship between GINS1, methylation and immune escape is not been fully known yet.
In this study, multiple public databases were employed to validate GINS1 as a novel prognostic biomarker that was correlated with methylation and immune escape in LIHC.
The TCGA datasets of GINS1 from UCSC Xena (https://tcga.xenahubs.net) were utilized to analyze the expression of GINS1 in 33 types of human cancer. The correlation was evaluated between the expression level of GINS1 and the expression of m6A-related genes (22) in LIHC. In addition, the datasets from TCGA were employed to ascertain the correlation with immune checkpoints in LIHC. The p-value<0.05 was considered statistically significant.
The protein expression of GINS1 with LIHC datasets was obtained from the CPTAC database (https://proteomics.cancer.gov/data-portal) by using UALCAN (http://ualcan.path.uab.edu). Analysis of protein expression of GINS1 in normal liver tissues and LIHC tissues was conducted with HPA (https://www.proteinatlas.org). Paired samples were collected from 116 patients with pathologically diagnosed LIHC from the First Affiliated Hospital of Jinan University (JNUH) for immunohistochemical staining. The protocol was performed according to the guidelines outlined in the Declaration of Helsinki and approved by the Ethics Committee and Institutional Review Board.
Survival and prognostic analysis was conducted using KM-plotter (http://kmplot.com/analysis). The correlations between GINS1 expression and the overall survival (OS), progression-free survival (PFS), disease specific survival (DSS), and relapse-free survival (RFS) in LIHC were analyzed with associated patient samples separated into two groups by median expression. The hazard ratio (HR) with 95% confidence intervals and log-rank p-value were also contained.
GeneMANIA (http://www.genemania.org) (23) and STRING (https://string-preview.org) were applied to construct gene-gene interaction and PPI networks of GINS1. The GO analysis is a powerful bioinformatics tool to explore on functions of genes in 3 categories, including biological processes (BPs), cellular components (CCs), and molecular functions (MFs). Besides, the top 300 genes most positively and negatively associated with GINS1 from the TCGA database were selected for GO term enrichment and KEGG pathway analyses to investigate the functions of GINS1 in LIHC. GO enrichment and KEGG pathway analyses of co-expression genes were performed by the EnrichGO and EnrichKEGG function in the R package “ClusterProfiler” and visualized by the package “ggplot2”, with the enrichment value set top < 0.05.
The cBioPortal (https://www.cbioportal.org) was employed to identify the genetic alterations of GINS1 in 8 datasets, including Peking University, Cancer Cell 2019; INSERM, Cancer Cell 2014; MSK, Clin Cancer Res 2018; INSERM, Nat Genet 2015; MSK, PLOS One 2018; AMC, Hepatology 2014; RIKEN, Nat Genet 2012; TCGA, Firehose Legacy. KM plots for survival outcomes including OS and DFS of GINS1 alterations were contained, and the log-rank test was performed. In addition, MethSurv (https://biit.cs.ut.ee/methsurv), a web portal providing univariable and multivariable survival analysis based on methylation biomarkers using TCGA datasets, was conducted to analyze the methylation sites of GINS1 and evaluated the predictive value of corresponding methylation. The HR with 95% confidence intervals of the overall survival was computed and p<0.05 was considered statically significant.
TIMER (http://timer.cistrome.org) database was used for the analysis of the correlation between the expression of GINS1 and immune infiltration. Consequently, the correlation was investigated between the expression of GINS1 and 6 tumor-infiltrating immune cells including B cells, CD8+ T cells, CD4+ T cells, macrophages, neutrophils, and dendritic cells (DCs). In addition, the next step focused on the correlation with particular immune infiltrating cell subset markers, including markers of CD8+ T cells, T cells (general), B cells, monocytes, tumor-associated macrophages (TAMs), M1 macrophages, M2 macrophages, neutrophils, natural killer cells (NKs), dendritic cells, T-helper 1 (Th1) cells, T-helper 2 (Th2) cells, follicular helper T (Tfh) cells, T-helper 17 (Th17) cells, Tregs, and exhausted T cells (24–26). Scatter plots were generated to demonstrate the relationships with the particular gene expression, and Spearman’s correlation and statistical significance were estimated.
The expression of GINS1 and 28 types of tumor-infiltrating lymphocytes (TILs) across human cancers were identified using the TISIDB (http://cis.hku.hk/TISIDB) database (27). In addition, TISIDB was utilized for analysis of the correlation between the abundance of TILs and the expression of GINS1, and Spearman’s test was conducted.
GEPIA (http://gepia.cancer-pku.cn) is a web portal for cancer and normal gene-expression profiling and interactive analyses based on TCGA and the Genotype-Tissue Expression (GTEx) datasets. It was employed to assess the link with particular markers associated with immune cell infiltration of tumors, including markers of Monocyte, TAMs, M1 macrophages, and M2 macrophages. The Spearman’s test was conducted to determine the correlation coefficient, and statistical significance was estimated.
The statistical analysis calculated by the online database in this study was mentioned above. ROC curve was performed to identify the cutoff value of GINS1 using the R software package “pROC”. The heat maps of the correlations between GINS1 and the top 50 positively or negatively associated genes were generated by the R software package “heatmap”. The p-value < 0.05 or log-rank p-value < 0.05 was considered as statistically significant.
The mRNA expression of GINS1 was investigated across 33 types of different tumors relative to normal tissues with the TCGA database. Compared with normal tissues, the expression of GINS1 was significantly upregulated in tumors including bladder urothelial carcinoma (BLCA), breast invasive carcinoma (BRCA), cervical squamous cell carcinoma (CESC), cholangiocarcinoma (CHOL), colon adenocarcinoma (COAD), esophageal carcinoma (ESCA), glioblastoma (GBM), head and neck squamous cell carcinoma (HNSC), kidney renal clear cell carcinoma (KIRC), kidney renal papillary cell carcinoma(KIRP), liver hepatocellular carcinoma (LIHC), lung adenocarcinoma (LUAD), lung squamous cell carcinoma (LUSC), rectum adenocarcinoma (READ), stomach adenocarcinoma (STAD), thyroid carcinoma (THCA) and uterine corpus endometrial carcinoma (UCEC), but was significantly down-regulated in kidney chromophobe (KICH) (Figure 1A). Both paired and unpaired sample analyses revealed that the mRNA expression of GINS1 was significantly higher in LIHC tissues than in the adjacent normal tissues (p < 0.001) (Figures 1B, C). To explore the protein expression of GINS1, the data in CPTAC using UALCAN were investigated, and no significant difference could be found in normal tissues (n = 165, p = 0.114) (Figure 1D). In addition, immunohistochemical staining in the HPA database and clinical LIHC samples both confirmed that the protein level of GINS1 in LIHC tissues was higher than that in normal tissues (Figures 1E, F). These results substantiated upregulated mRNA and protein expression of GINS1 in LIHC tissues.
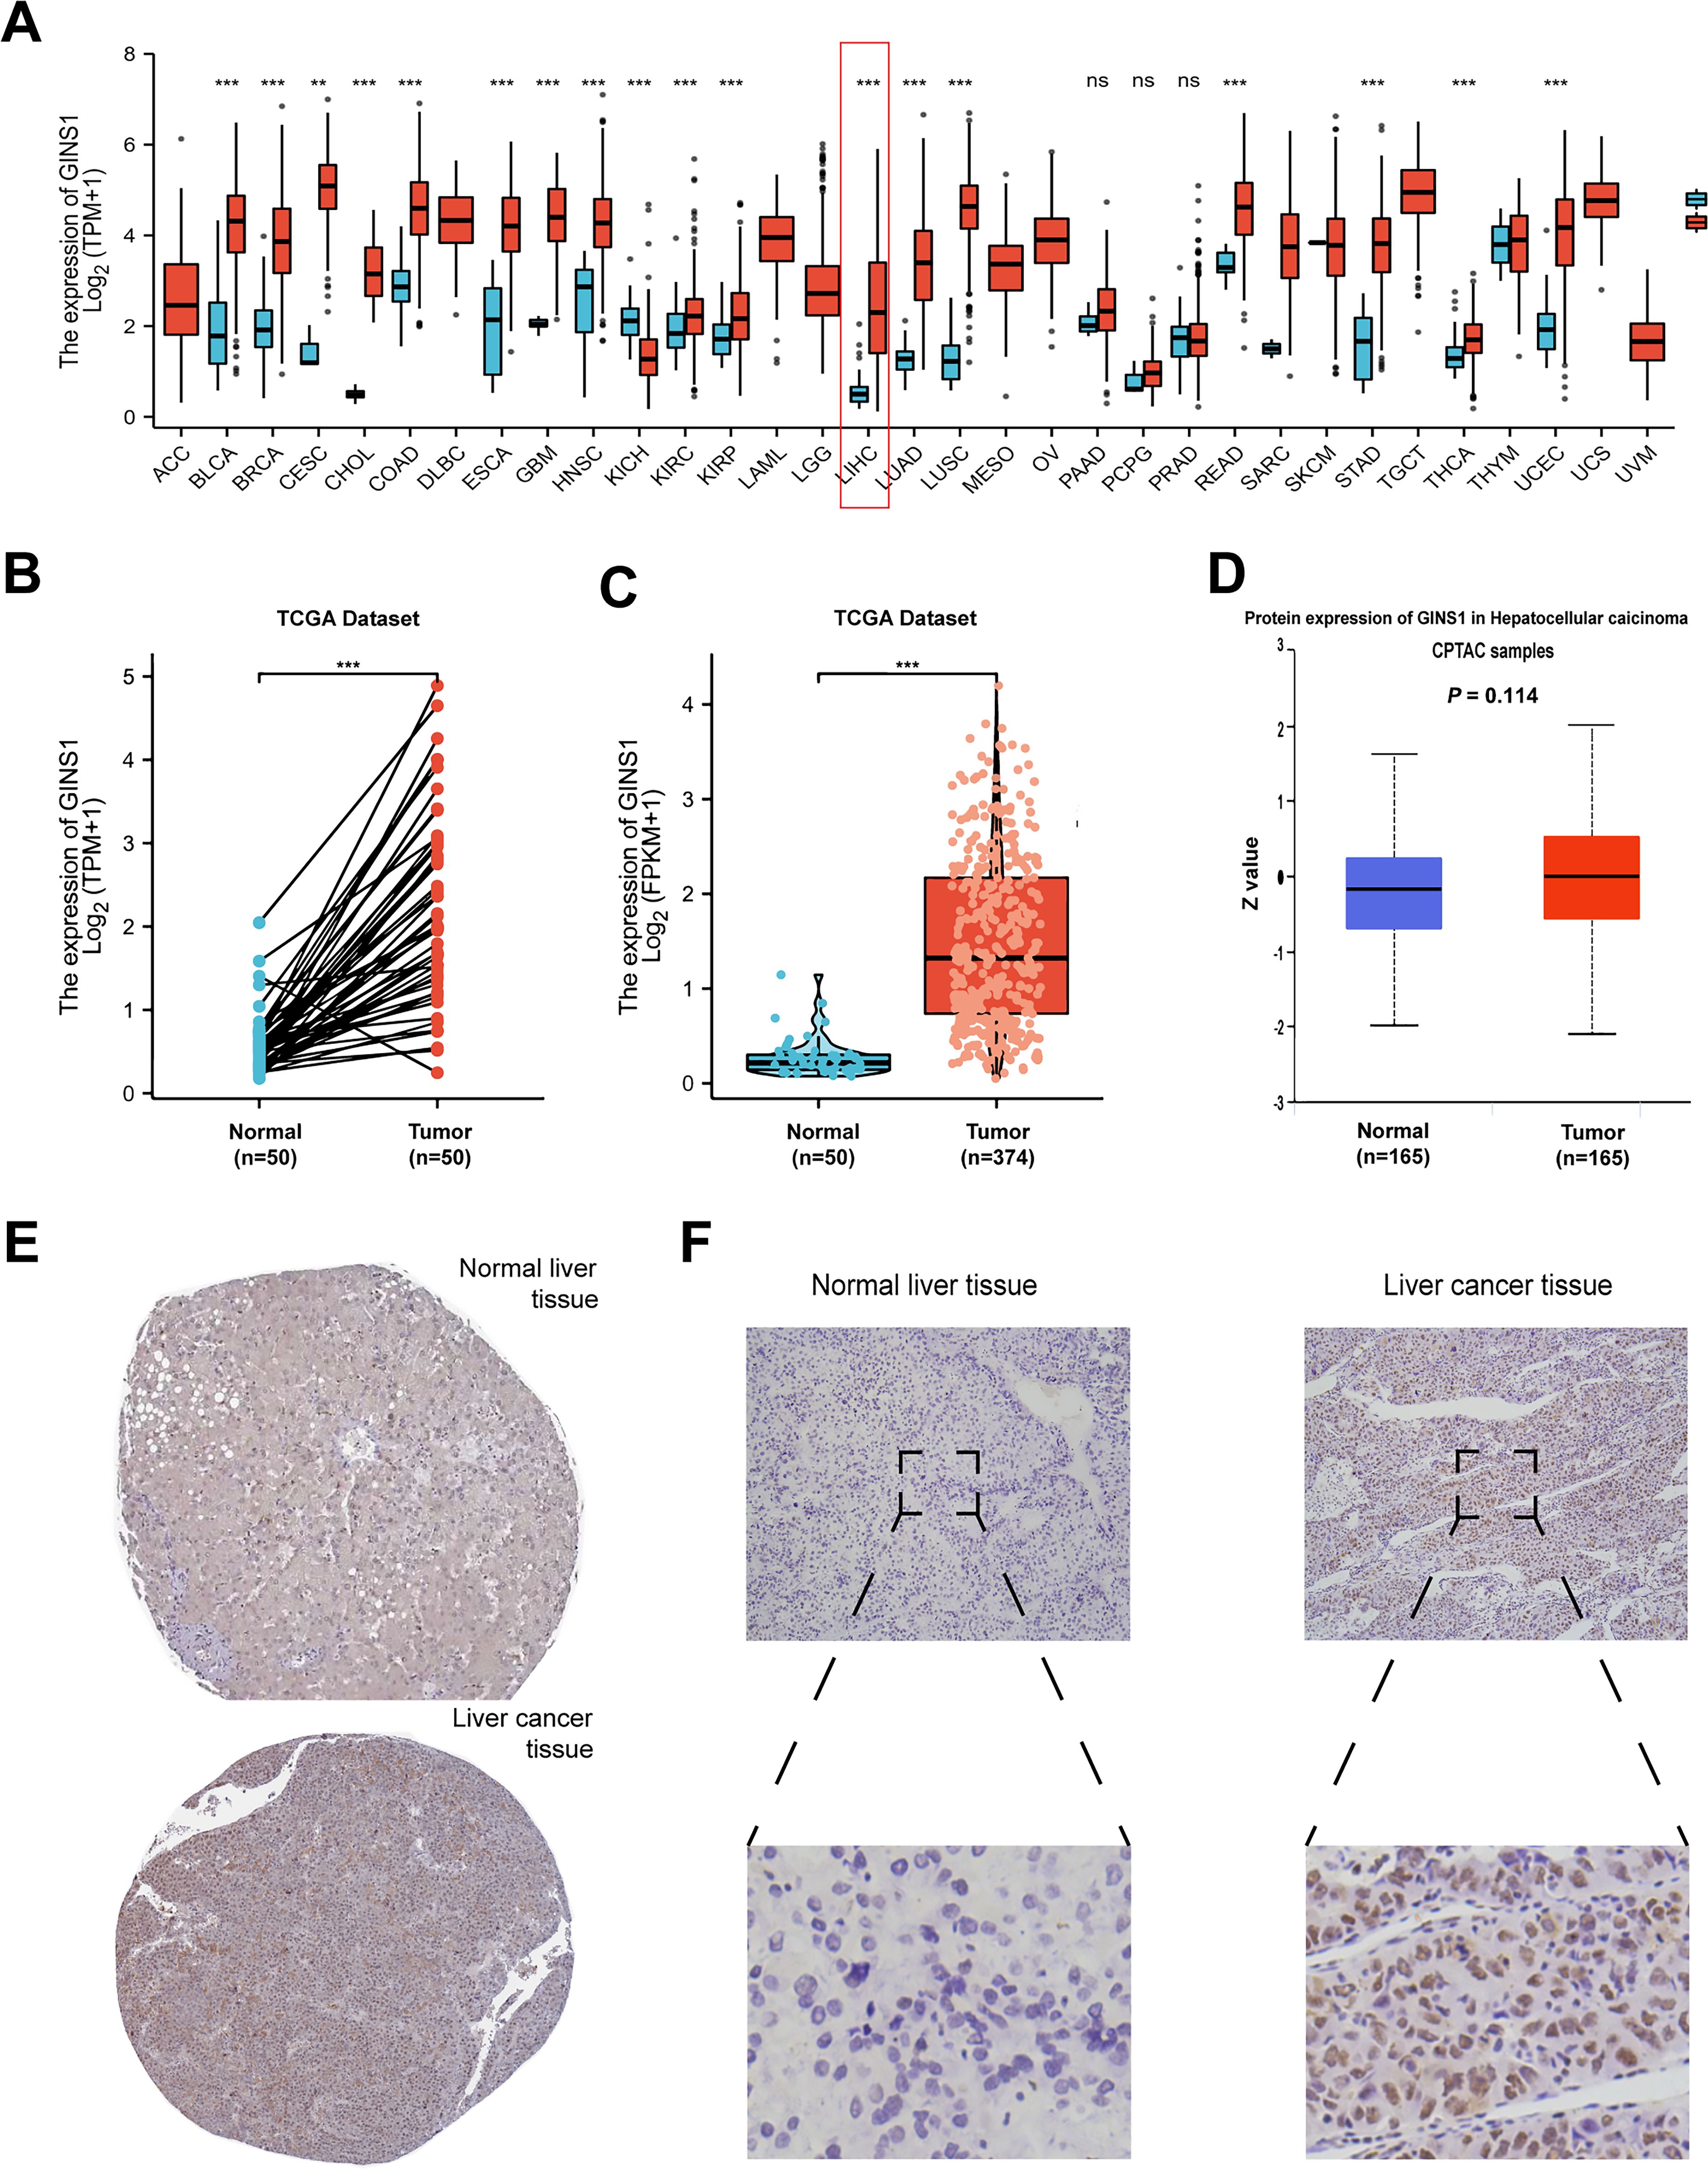
Figure 1. The analysis of GINS1 expression. (A) Expression pattern of GINS1 in pan-cancer perspective by TCGA database. (B) Expression of GINS1 in 50 LIHC and matched-adjacent normal paired samples. (C) Expression of GINS1 in 374 LIHC and 50 normal unpaired samples. (D) The protein expression level of GINS1 were analyzed based on CPTAC using UALCAN. (E) The protein levels of GINS1 in normal liver tissues and liver cancer tissues (Antibody HPA051185) from the HPA database. (D) Immunohistochemical staining of GINS1 in clinical LIHC samples. ** means p<0.01; *** means p<0.001; ns means no significance.
The Mann-Whitney U-test was performed to determine the correlation between the expression of GINS1 and clinicopathological parameters of LIHC patients. Results revealed that the expression of GINS1 was significantly elevated in patients with higher T classification (p = 0.007) and younger age (p = 0.020) (Table 1). However, other clinicopathological parameters including N and M classification showed no statistically significant association (Table 1).
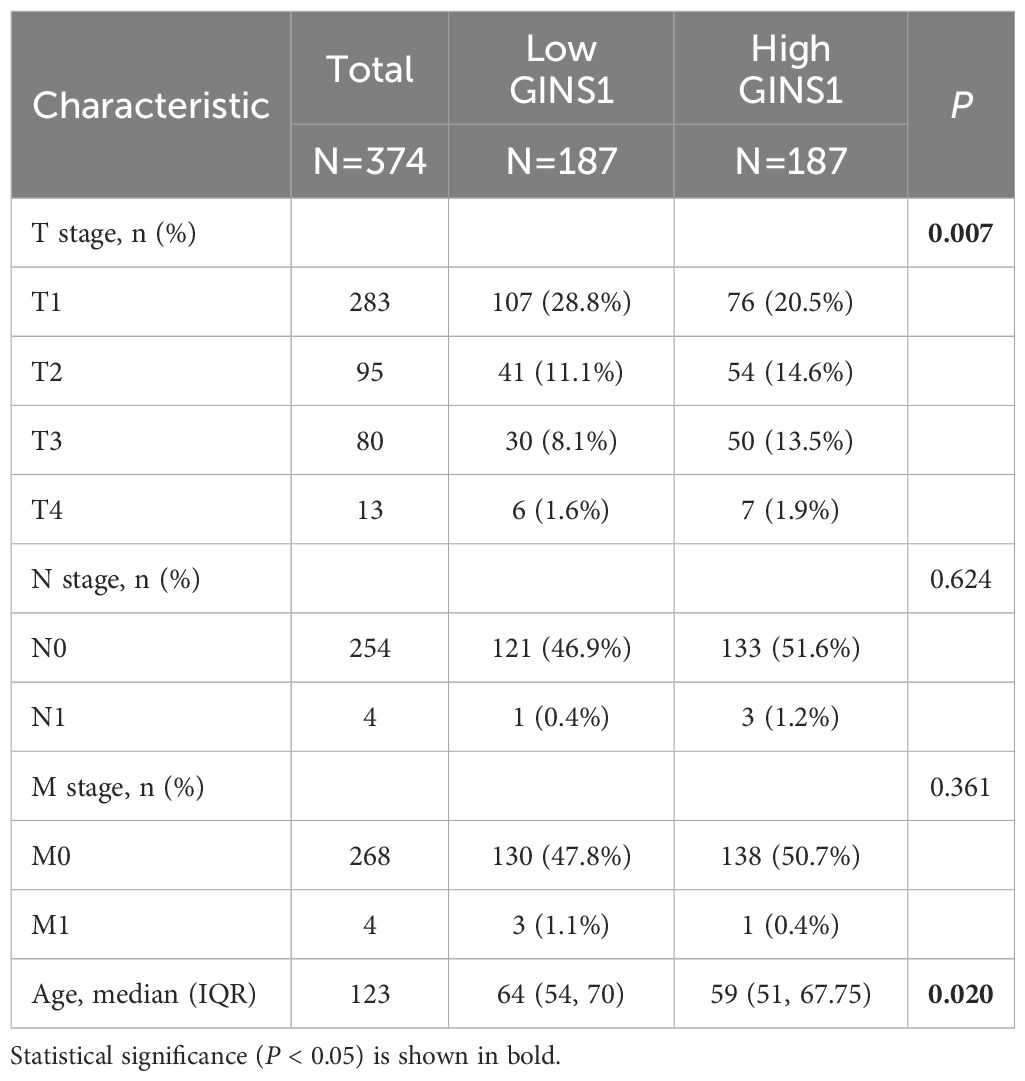
Table 1. Clinical characteristics of the patients (TCGA).
ROC curve analysis was conducted to ascertain the value of GINS1 in distinguishing LIHC samples from normal samples. Result uncovered that the value of AUC was 0.950 (95% CI: 0.924-0.976) (Figure 2A). This result divulged that GINS1 could be considered a potential biomarker for distinguishing LIHC tissues from normal tissues. Consequently, the correlation with prognosis in LIHC patients was assessed by using the KM-plotter. It was divulged that higher expression of GINS1 in LIHC patients was significantly correlated with poorer OS, PFS, DSS, and RFS (all p < 0.001) (Figures 2B-E). To better understand the prognostic value of GINS1 expression, further effort was made for the correlation with prognosis in LIHC patients based on clinicopathological parameters in the KM-plotter database. In LIHC patients, higher expression of GINS1 was associated with poorer OS in Stage 1 + 2, Grade 1-3, T 1-2, males, white people, Asians, no alcohol consumption, and no hepatitis virus, and poorer PFS in Stage 1 + 2, Grade 2-3, T 1, white people, Asians, no vascular invasion, and no hepatitis virus (Figure 2F). Coherently, these results implied that GINS1 could be a promising biomarker to diagnose LIHC and predict the prognosis of LIHC.
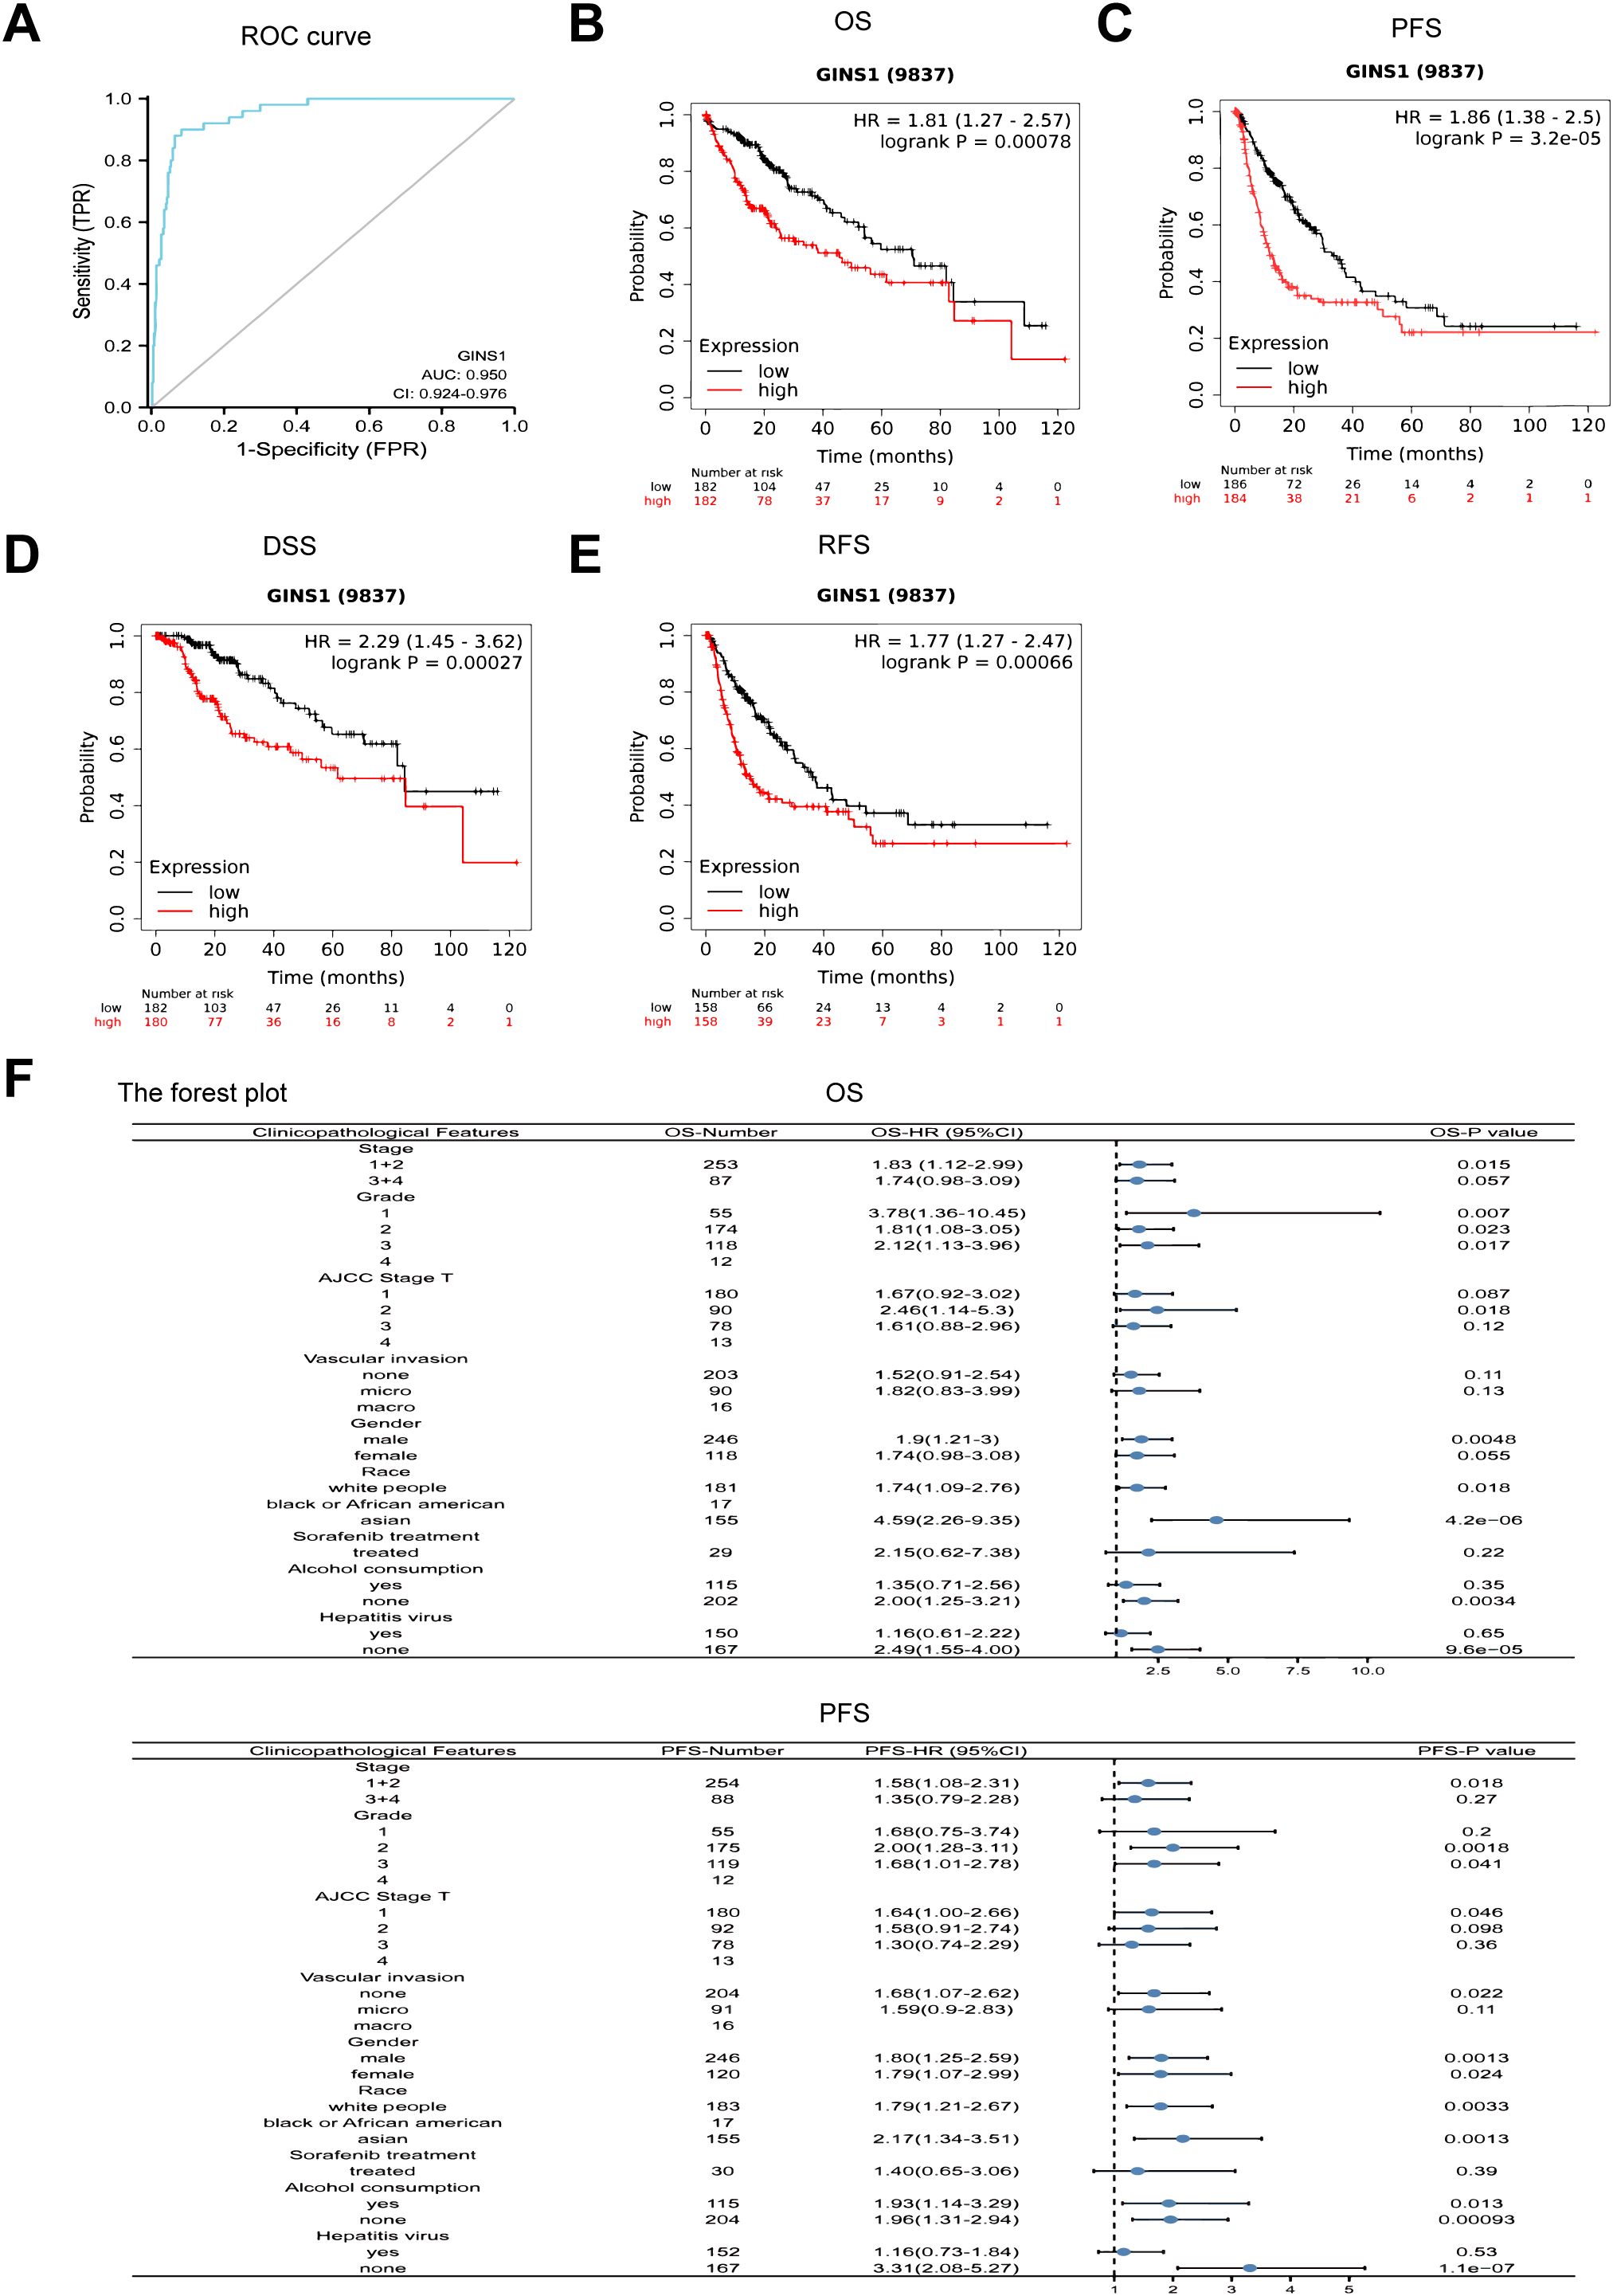
Figure 2. ROC and Kaplan-Meier curves evaluating the prognostic value of GINS1. (A) ROC curve of GINS1 in LIHC patients. (B–E) Kaplan-Meier analysis of OS, PFS, DSS, and RFS. (F) Forest plots of the correlation between GINS1 expression and clinicopathological parameters in LIHC patients. OS, overall survival; PFS, progression-free survival; DSS, disease specific survival; RFS, relapse-free survival.
GeneMania and STRING databases were applied to construct gene-gene interaction and PPI networks of GINS1, respectively. As shown in Figure 3A, the 20 most frequently altered genes were closely associated with GINS1, including GINS4, GINS2, and GINS3. Functional analysis revealed that these genes were significantly related to DNA replication (Figure 3A). Moreover, the PPI networks for GINS1 showed 55 edges and 11 nodes, including MCM5, GINS2, and MCM4 (Figure 3B). The co-expression genes in the PPI networks of GINS1 were explored via data mining from the TCGA database. Subsequently, the top 50 genes that were positively and negatively correlated with GINS1 in LIHC were discovered (Figures 3C, D). GO enrichment, and KEGG pathway analyses were performed using the top 300 positive related genes. The top 20 significant terms of BPs, MFs, and CCs enrichment analyses were presented (Figures 3E–G). In terms of BPs, MFs, and CCs, GINS1 was enriched in the initiation and progression of DNA replication, DNA unwinding and replication, and chromosomal replication processes. Moreover, the top 14 KEGG pathways for GINS1 and related genes were presented (Figure 3H). Among these pathways, many DNA replication and cell cycle-related pathways were highly associated with GINS1. Based on the above results, GINS1 was conjectured that it played a certain role in the progression of LIHC and could be a potential therapeutic target of LIHC.
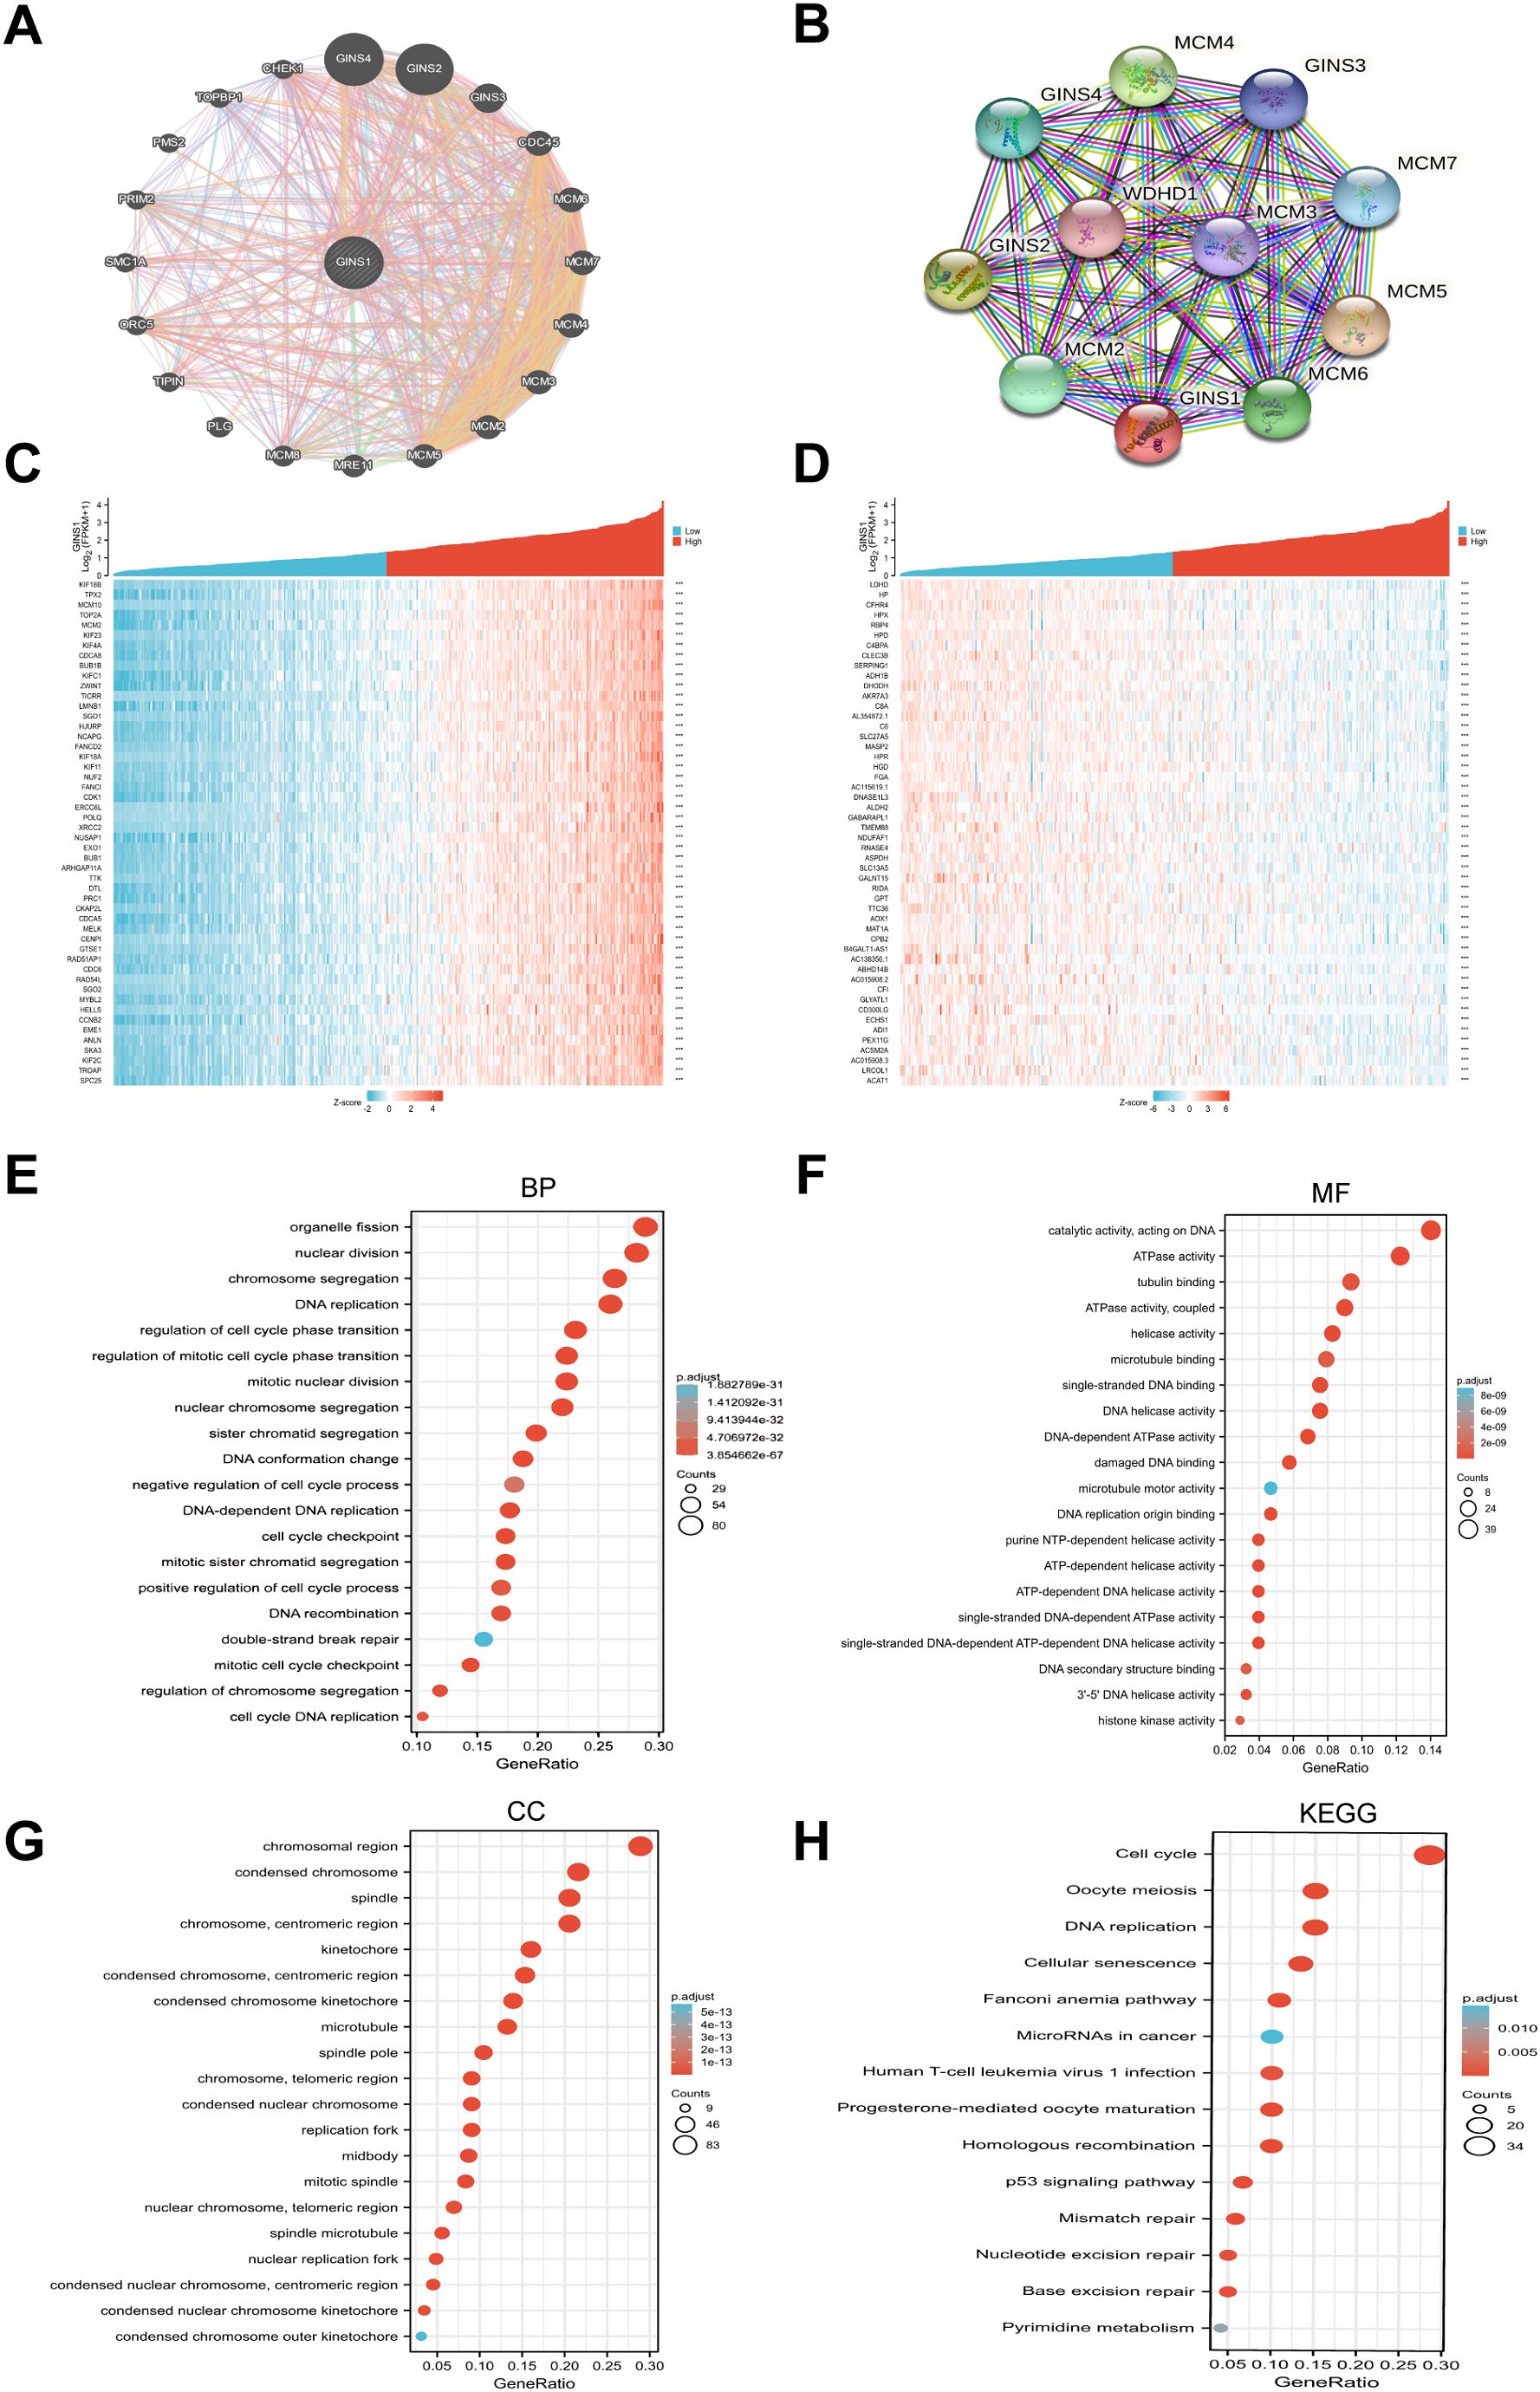
Figure 3. Gene-Gene, PPI network, and functional enrichment analysis of GINS1. (A) The gene-gene interaction network of GINS1 by GeneMania. (B) The PPI network of GINS1 by STRING. (C) Heat maps show the top 50 genes positively correlated with GINS1 in LIHC. (D) Heat maps show the top 50 genes negatively correlated with GINS1 in LIHC. (E–G) Top 20 enrichment terms in BP, MF, and CC categories in LIHC. (H) Top 14 KEGG enrichment pathways in LIHC. BP, biological processe; CC, cellular component; MF, molecular function; KEGG, Kyoto Encyclopedia of Genes and Genomes.
The genetic alteration frequency of GINS1 in LIHC was analyzed using a total of 1245 patients with LIHC from 8 datasets. Firstly, the percentage of GINS1 genetic alteration in LIHC was 0.2% (Figure 4A). Besides, the incidence rate of mutation was 1.16% (2/173), while the incidence rate of amplification was 0.27% (1/377) (Figure 4B). Meanwhile, the analysis of the KM-plotter found no statistically significant difference between the genetic alteration of GINS1 and OS or PFS, which was probably the result of the insufficient samples (Figures 4C, D). In addition, MethSurv was employed to evaluate the DNA methylation sites of GINS1 and the prognostic value of corresponding CpG methylation. 12 methylations of CpG sites were observed, and cg19063768 had the highest DNA methylation (Figure 4E). High methylation of cg07062412 was associated with a worse OS in LIHC, while high methylation of cg02802871, cg17542545, cg24001719, ch.20.546216F was associated with a better OS (all p < 0.05) (Table 2). Next, TCGA datasets were utilized to estimate the correlation with 20 m6A-related genes in LIHC. Results exposed positive correlation of the expression of GINS1 with 17 m6A-related genes in LIHC, including METTL3 (r = 0.544), YTHDC1 (r = 0.457), YTHDC2 (r = 0.271), RBM15 (r = 0.431), RBM15B (r = 0.617), IGF2BP1 (r = 0.442), IGF2BP2 (r = 0.489), IGF2BP3 (r = 0.536), VIRMA (r = 0.395), WTAP (r = 0.491), YTHDF1 (r = 0.663), YTHDF2 (r = 0.408), YTHDF3 (r = 0.136), HNRNPA2B1 (r = 0.675), HNRNPC (r = 0.614), RBMX (r = 0.684), and ALKBH5 (r = 0.154) (all p < 0.05) (Figure 4F). The highest correlation coefficient of 7 m6A-related genes was also demonstrated as scatter plots (Figure 4G). Notably, 424 LIHC samples were divided into two groups by median expression of GINS1, and higher expression of 18 m6A-related genes was observed in the high GINS1 expression group compared with the low GINS1 expression group (Figure 4H). Collectively, these results demonstrated that GINS1 was closely related to genetic alteration and methylation which could cause tumor proliferation and migration in LIHC.
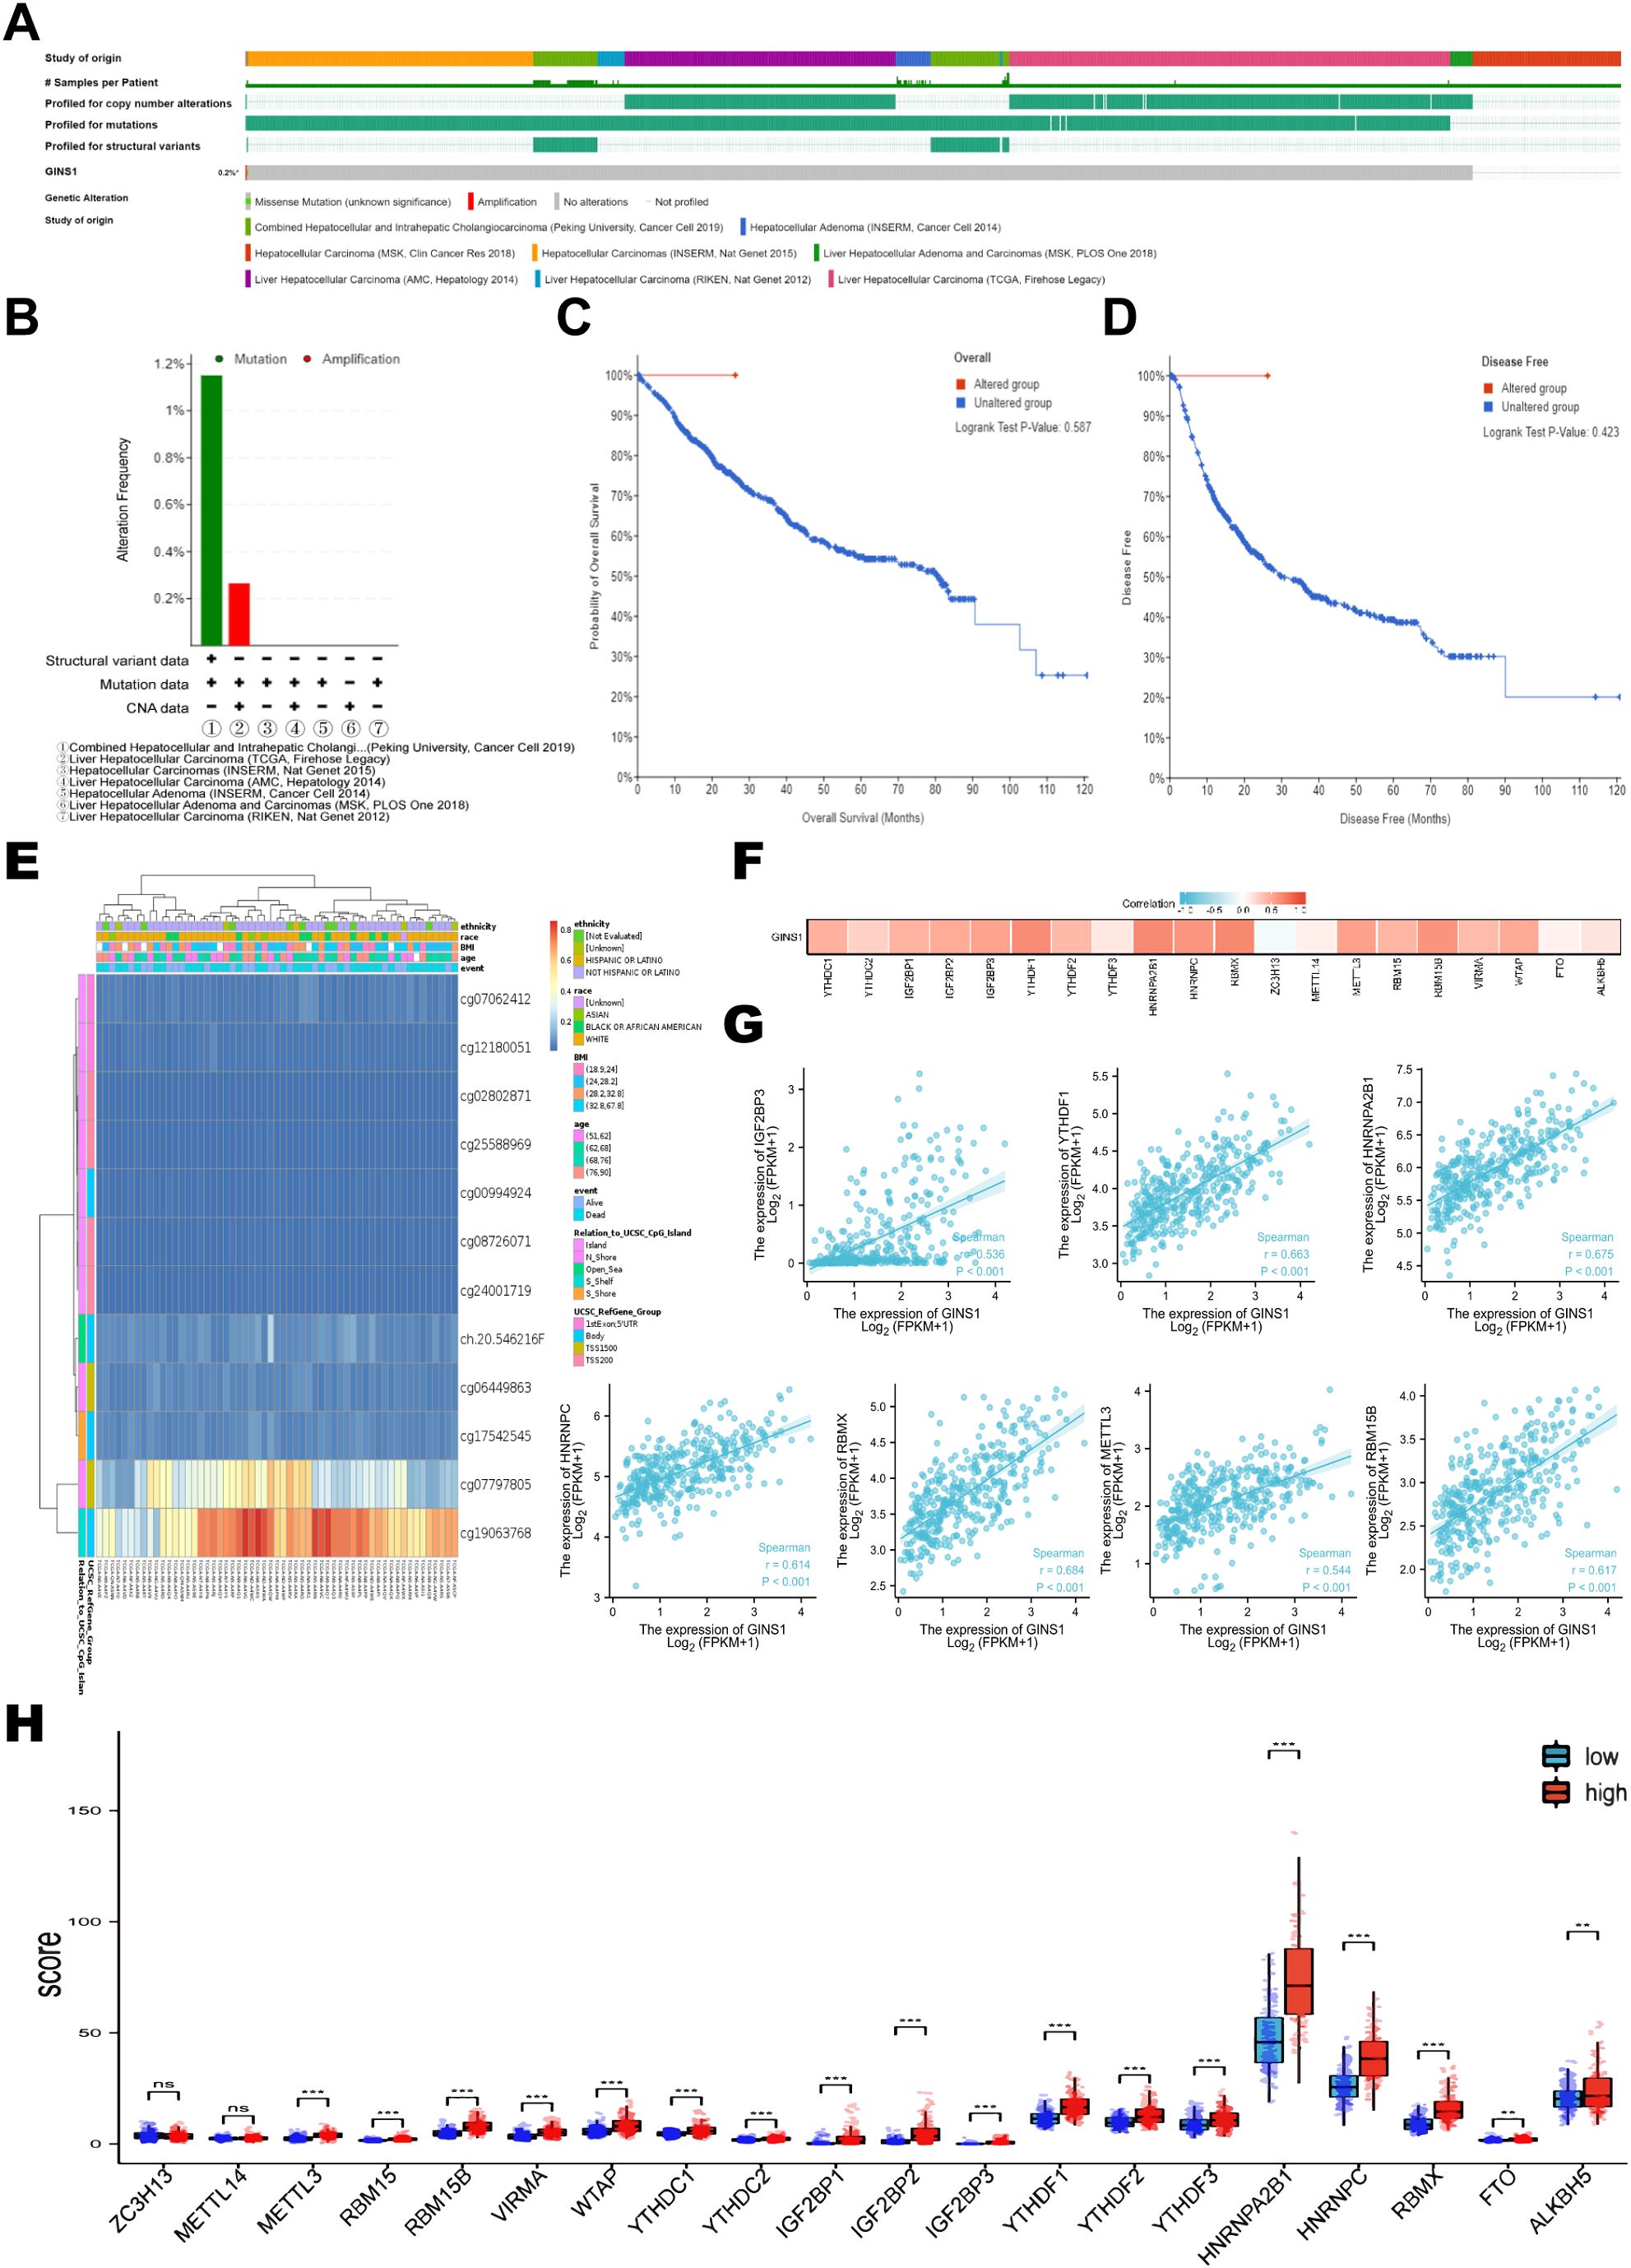
Figure 4. Genetic alteration and methylation analysis of GINS1 in LIHC. (A) Genetic alteration of GINS1 in LIHC. (B) Summary of GINS1 genetic alteration in LIHC from seven datasets. (C, D) Kaplan-Meier plots of OS and DFS in patients with or without genetic alteration of GINS1 in LIHC. (E) Visualization of the CpG methylation sites of GINS1 in LIHC. (F) The correlation between GINS1 expression and m6A-related genes in LIHC based on TGCA datasets. (G) The scatter plots of the correlation between GINS1 and the 7 m6A-related genes with the highest correlation coefficient. (H) The differential expression of m6A-related genes in the high and low GINS1 expression groups in LIHC. ** means p<0.01; *** means p<0.001; ns means no significance.
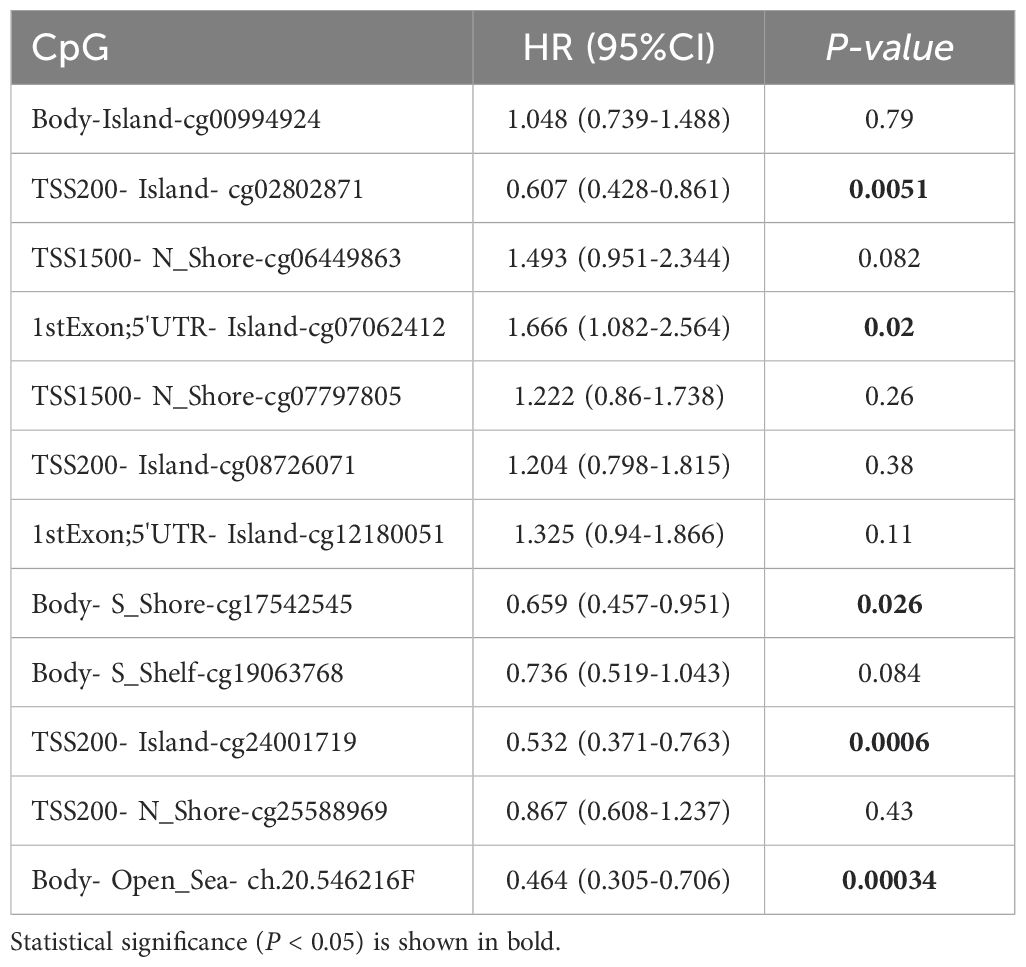
Table 2. Effect of hypermethylation level on prognosis in LIHC.
Correlation between GINS1 expression and 6 types of tumor-infiltrating immune cells was analyzed using TIMER database. Results showed that the expression of GINS1 was correlated with tumor purity (r = 0.179), B cell (r = 0.479), CD8+ T cell (r = 0.335), CD4+ T cell (r = 0.344), macrophage (r = 0.46), neutrophil (r = 0.373), dendritic cell (r = 0.480) (all p < 0.05) (Figure 5A). Relations between the expression of GINS1 and 28 types of TILs across human cancers in TISIDB database were shown in Figure 5B. Results suggested significant correlation with abundance of monocyte cell (r = -0.369), activated CD4 cell (r = 0.591), eosinophil cell (r = -0.344), immature dendritic cell (r = -0.257), plasmacytoid dendritic cell (r =-0.282), effector mem-CD8 cell (r = -0.237), type 1 T helper cell (r = -0.264), type 2 T helper cell (r = 0.311) (all p < 0.05) (Figure 5C). The above results indicated that GINS1 played a specific role in immune infiltration in LIHC.
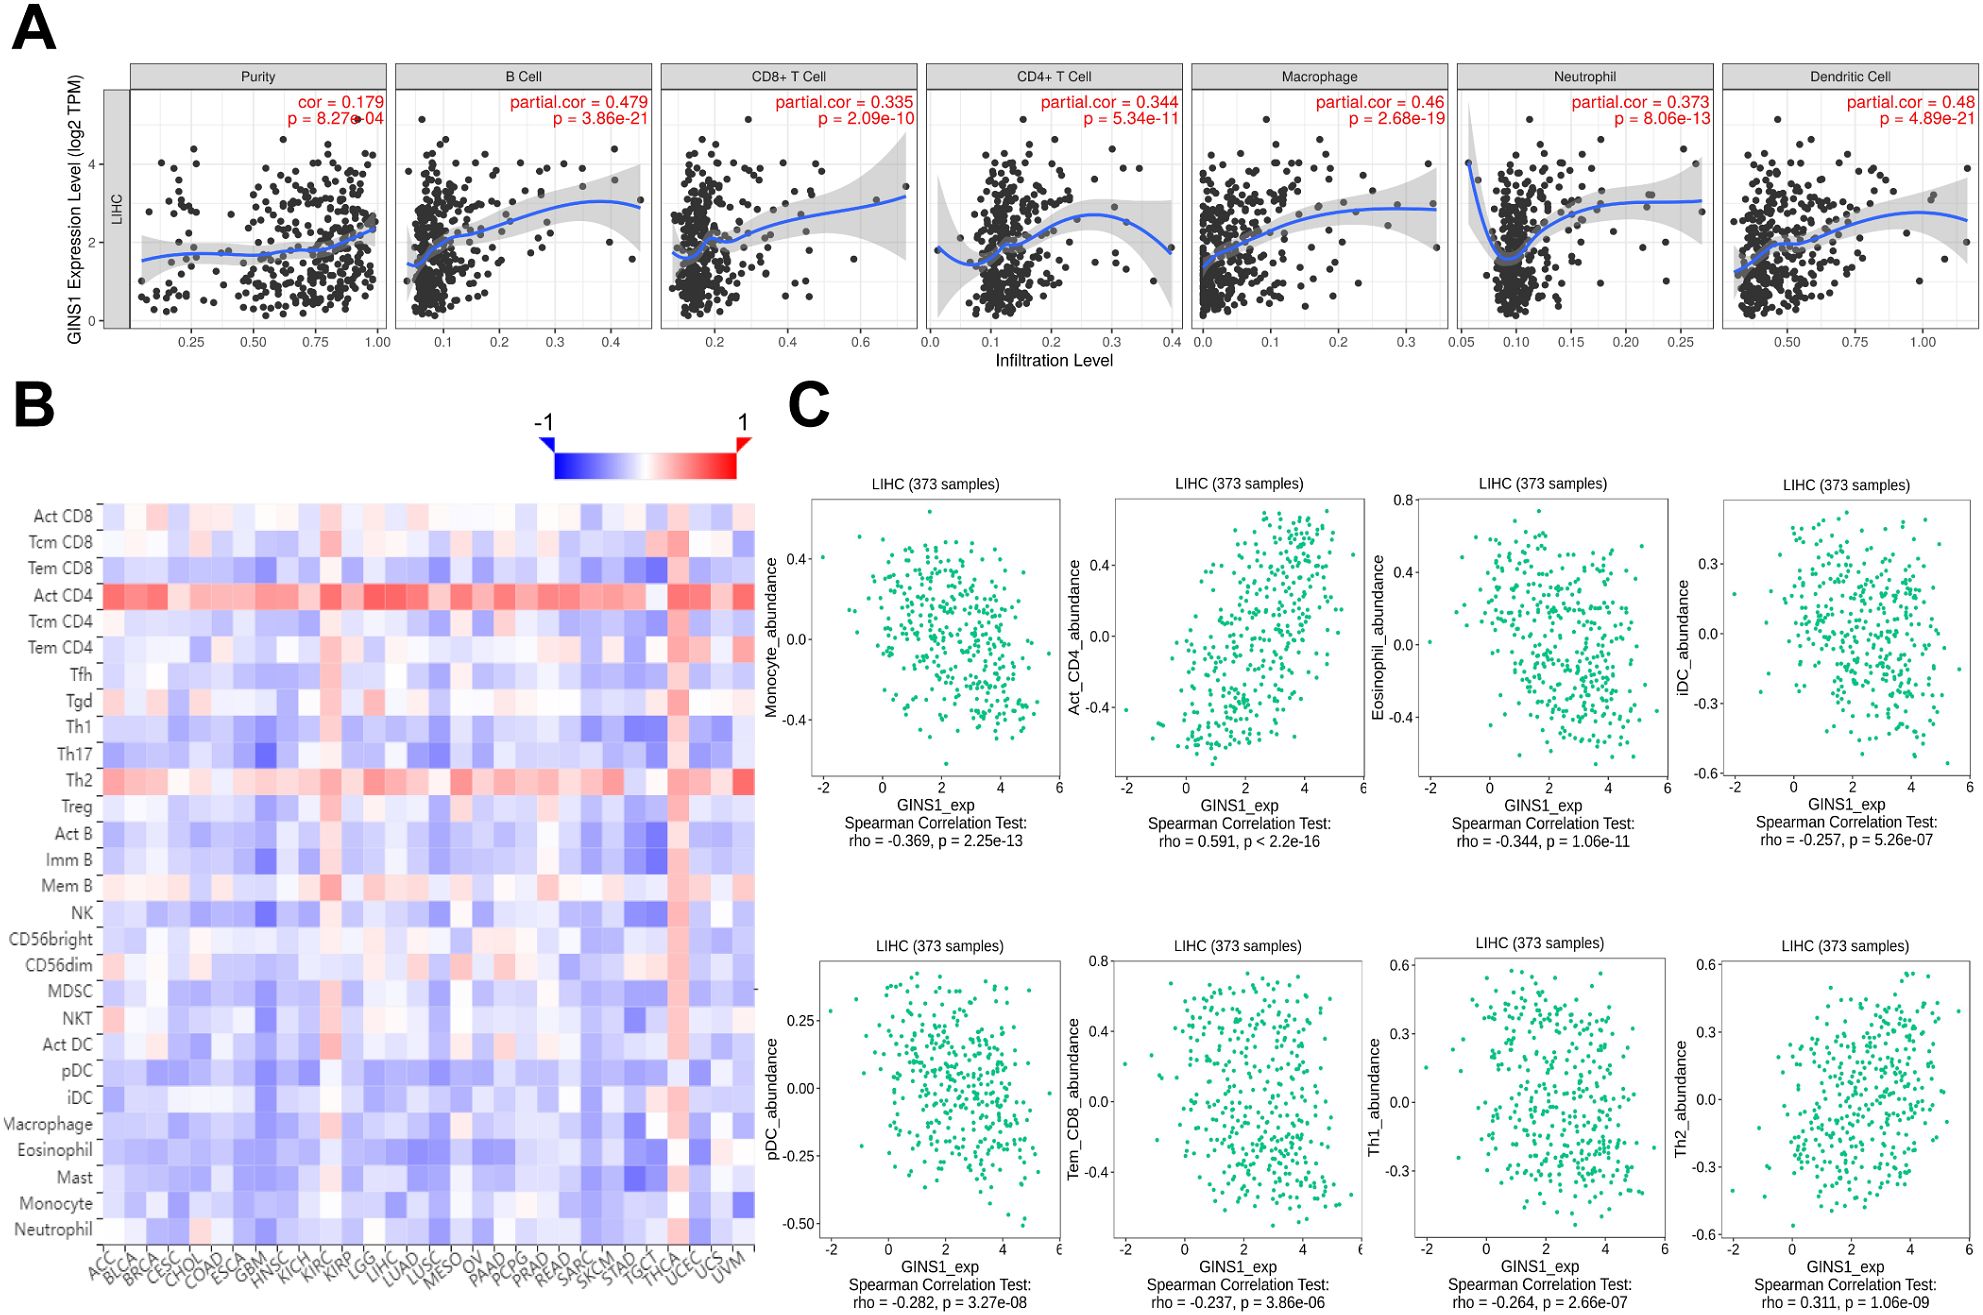
Figure 5. Correlation between GINS1 expression and immune cell infiltration in LIHC. (A) The correlation between GINS1 expression and tumor-infiltrating immune cells from TIMER database. (B) The correlation between GINS1 expression and 28 types of TILs across human cancers from TISIDB database. (C) The correlation between GINS1 expression and the abundance of TILs in LIHC.
Further exploration was concentrated on the correlation between the expression of GINS1 and immune marker sets of various immune cells of LIHC in the TIMER and GEPIA databases. Immune marker genes of different immune cells were procured for the correlation analysis with adjustments based on tumor purity (Table 3). In particular, the expression of GINS1 was significantly correlated with B cell markers (CD19, CD79A), CD8+ T markers (CD8A, CD8B), T cell markers (CD3D, CD3E, CD2), monocyte markers (CD86, CD115), TAM markers (CCL2, CD68, IL10), M1 macrophage markers (IRF5, COX2) and M2 macrophage markers (CD163, VSIG4, MS4A4A) in LIHC (all p < 0.0001) (Figures 6A–G). In addition, the relationship with these immune markers in LIHC was further investigated using the GEPIA database to confirm the similar association with immune markers of CD8+ T cell, T cell, monocytes, B cell, TAM, M1 macrophage, and M2 macrophages (Table 4). Surprisingly, the above results substantiated that GINS1 might be capable of regulating the polarization of macrophages in LIHC. Upregulated GINS1 was also associated with increased DC markers, which indicated a closed relationship between GINS1 and tumor DC penetration. Moreover, there was a significant correlation between GINS1 and markers of Treg and exhausted T cells, implying that GINS1 might play an important role in immune escape in LIHC.

Table 3. Correlation analysis between GINS1 and related genes and markers of immune cells in TIMER.
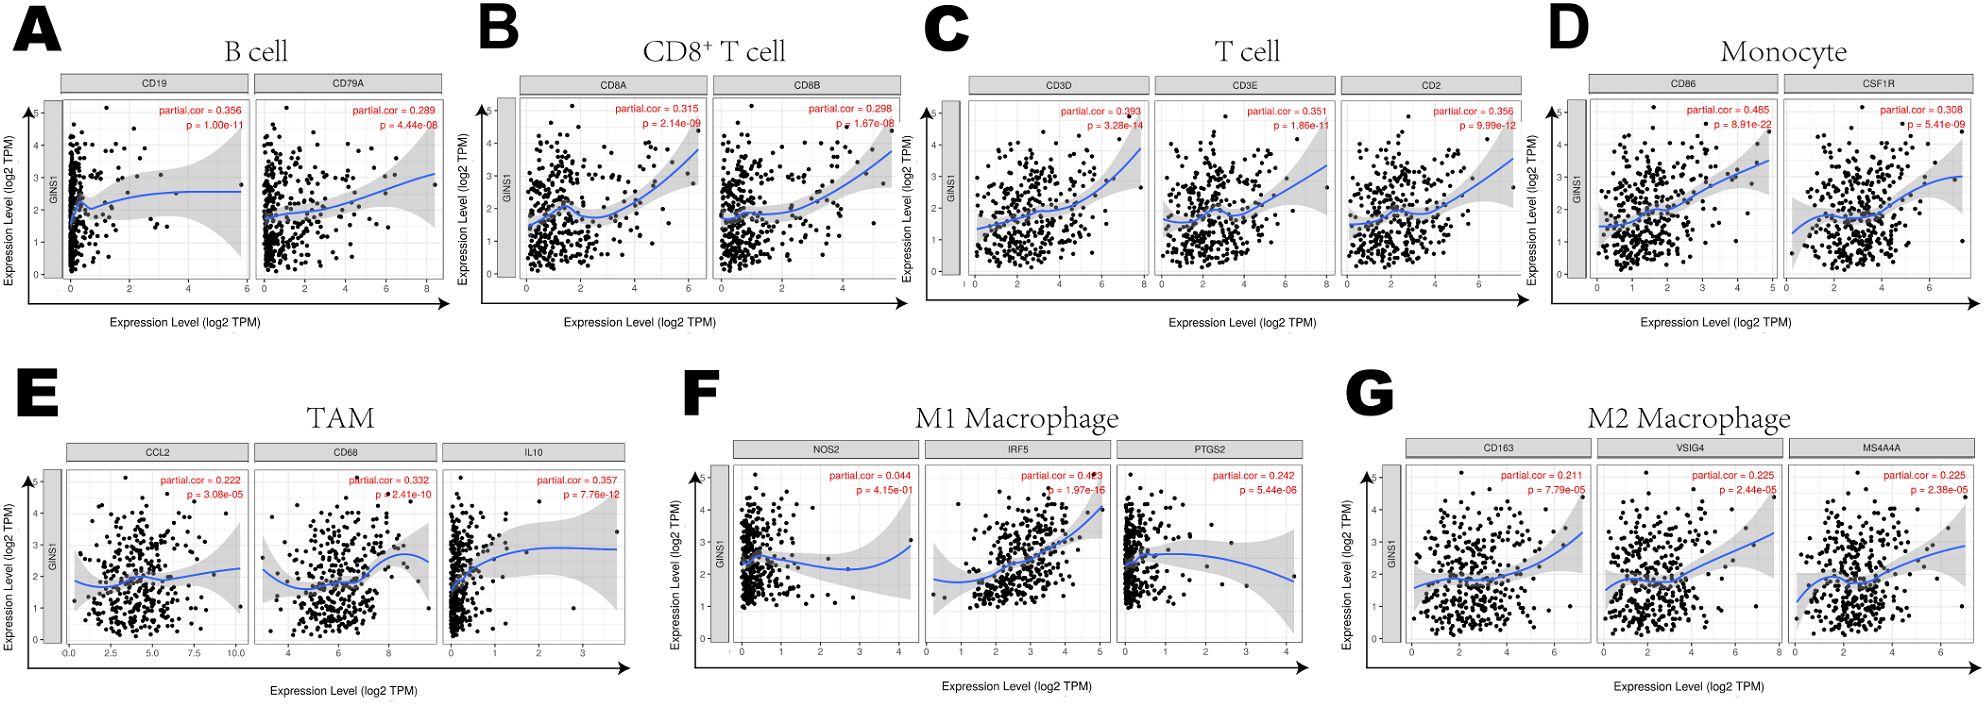
Figure 6. Correlation Between expression of GINS1 and immune markers including (A–G) B cell markers (CD19, CD79A), CD8+ T markers (CD8A, CD8B), T cell markers (CD3D, CD3E, CD2), monocyte markers (CD86, CD115), TAM markers (CCL2, CD68, IL10), M1 macrophage markers (IRF5, COX2) and M2 macrophage markers (CD163, VSIG4, MS4A4A) in LIHC.
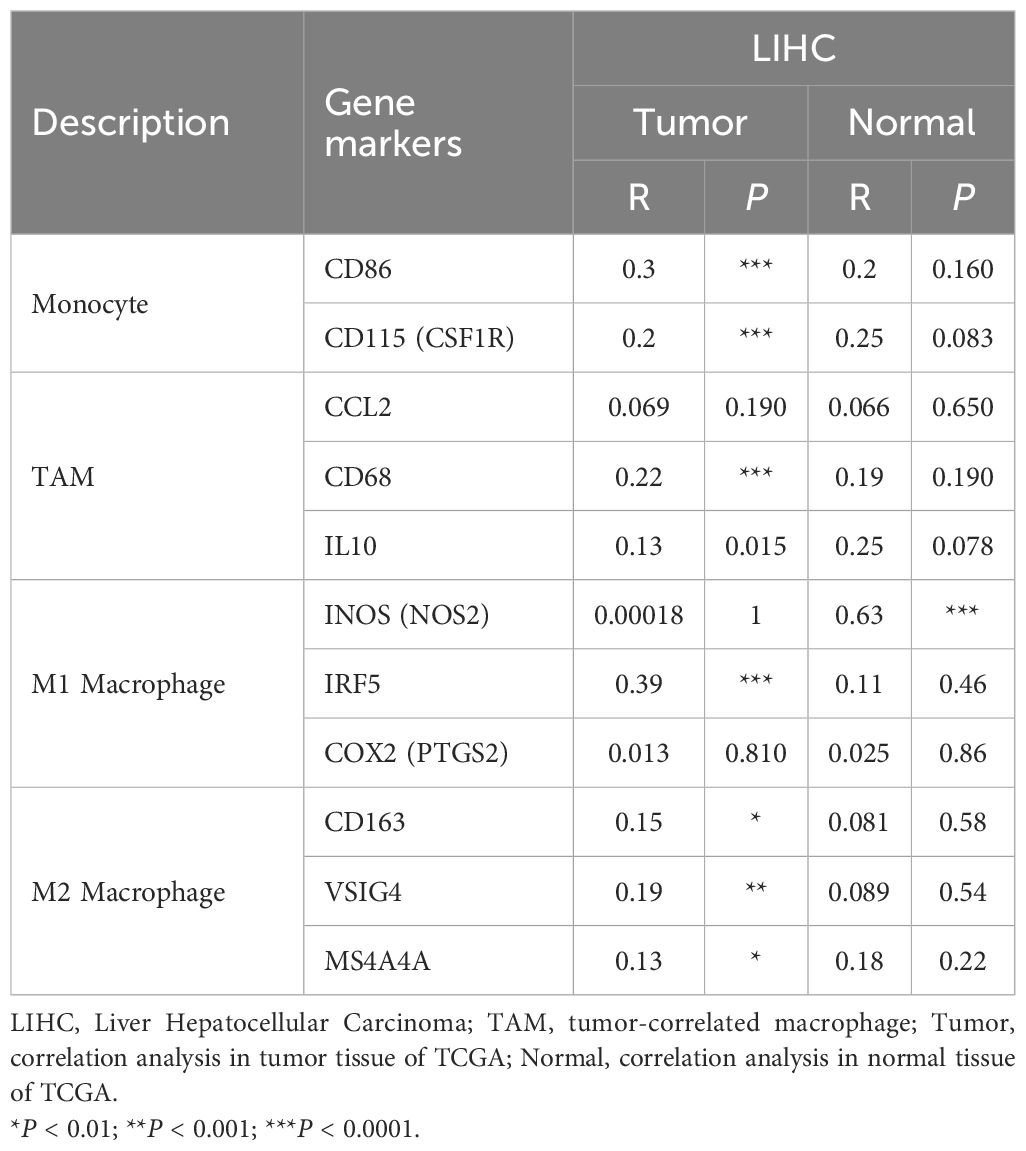
Table 4. Correlation analysis between GINS1 and related genes and markers of monocyte, TAM and macrophages in GEPIA.
To further evaluate the association between GINS1 and immune escape, the TCGA datasets were utilized to explore the correlation between GINS1 and immune checkpoint genes including PDCD1 (PD-1), CD274 (PD-L1), PDCD1LG2 (PD-L2), LAG3, CTLA4, and HAVCR2 (TIM3). Heatmap and scatter plots demonstrated significant positive correlations with immune checkpoints above (Figures 7A–G), which indicated the unignorable effect of immune escape in GINS1-mediated carcinogenesis of LIHC.
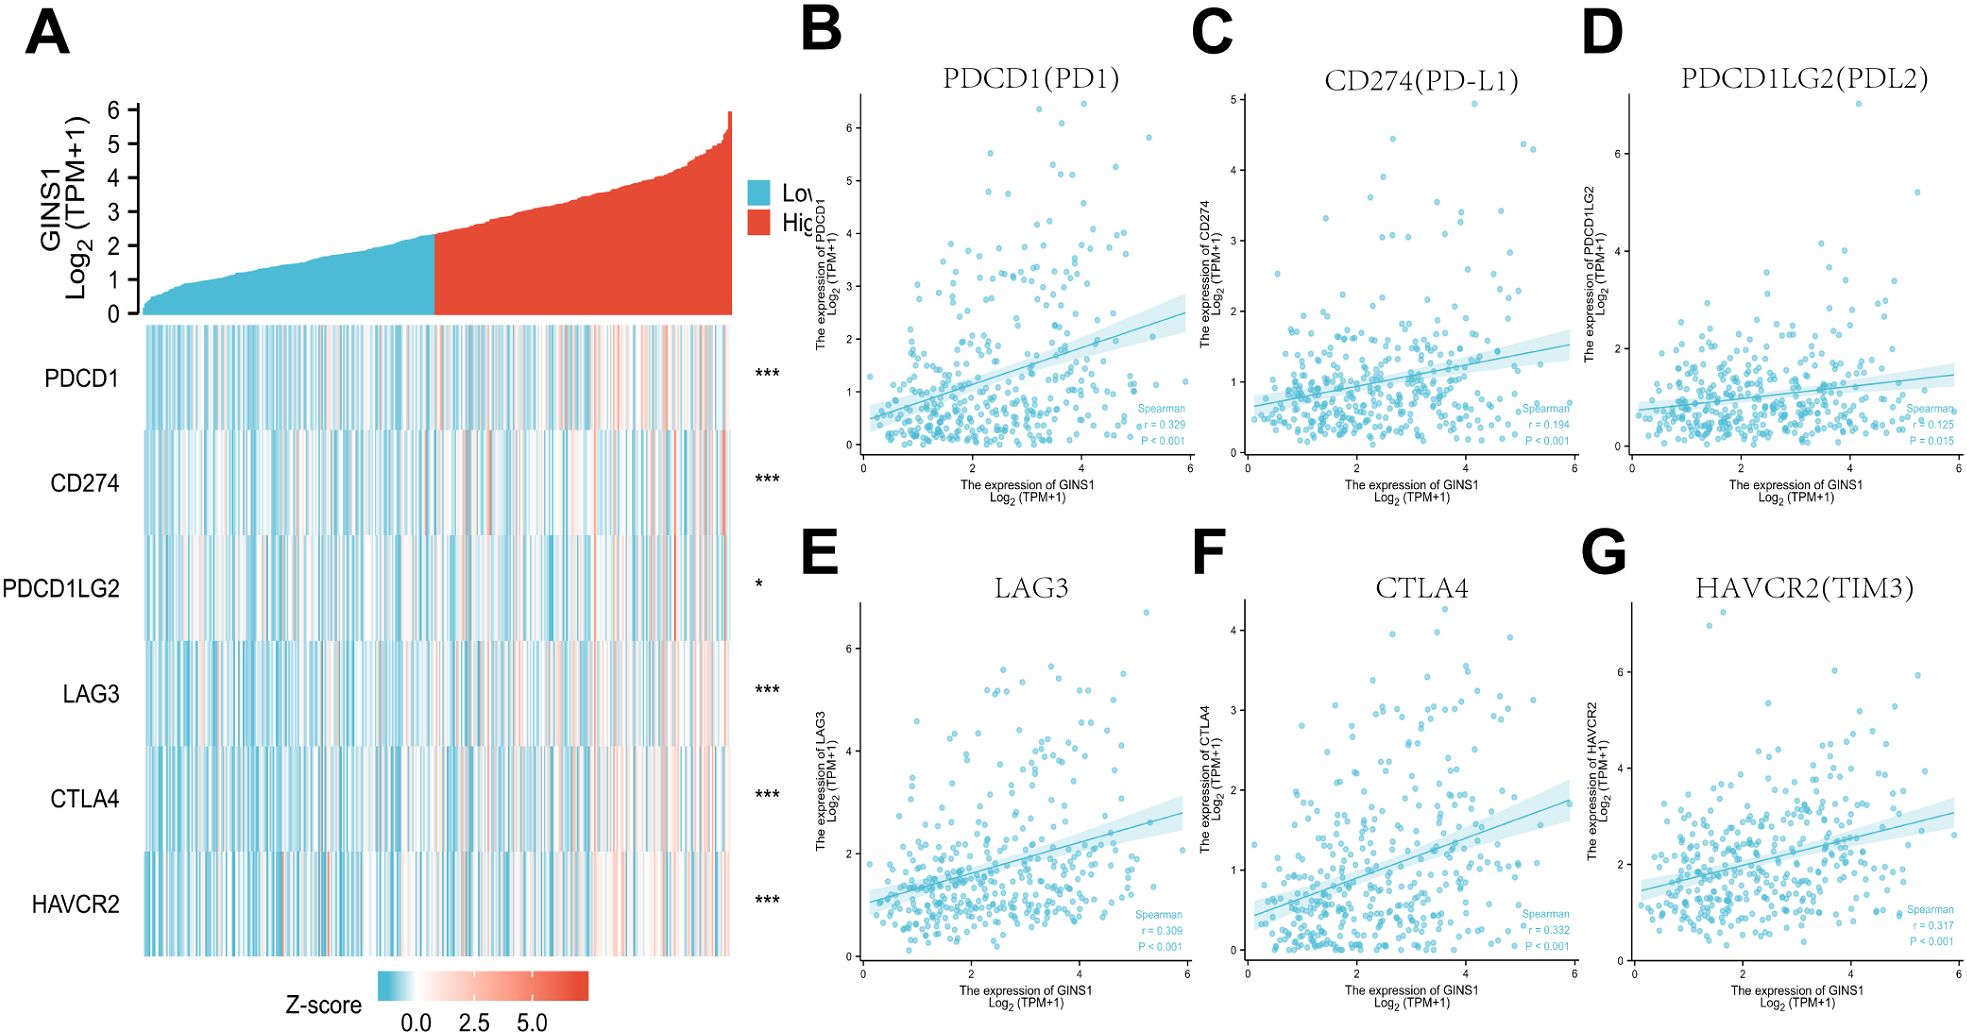
Figure 7. Correlation between GINS1 expression and immune checkpoints in LIHC. (A) Heat map of immune checkpoints genes including PDCD1 (PD-1), CD274 (PD-L1), PDCD1LG2 (PD-L2), LAG3, CTLA4, and HAVCR2 (TIM3) based on GINS1 expression. (B–G) Scatter plots of the correlation between GINS1 expression and immune checkpoints in LIHC. * means p<0.05; *** means p<0.001.
GINS1 is a member of the GINS complex (28) and has been divulged as a component of the eukaryotic DNA replication machinery (11). The oncogenic role of GINS1 in human cancers has been mentioned in many recent studies (28, 29). Moreover, dysregulation of GINS1 has been demonstrated in association with a poor prognosis and the progression of malignant tumors (18, 30). Prior studies discovered that GINS1 could be a target of anlotinib which suppressed the proliferation of synovial sarcoma cells (31). Other trials substantiated that GINS1 might be a target of sorafenib which significantly prolonged the PSF and induced durable responses among patients with progressive, refractory, or symptomatic desmoid tumors (28, 32). However, the role of GINS1 in LIHC has not been fully comprehended. Here, GINS1 was found aberrantly expressed in diverse cancers based on pan-cancer analysis. Our study also confirmed that GINS1 was significantly upregulated in LIHC. High mRNA expression of GINS1 was found positively correlated with a high T stage and younger age. These findings indicated that GINS1 might be a potential biomarker to identify LIHC with poor clinical outcomes. To elucidate the clinical diagnostic value of GINS1 in LIHC, ROC curve analysis was conducted. The results showed that GINS1 had a significantly high AUC value, with 90.0% in sensitivity and 91.7% in specificity. According to the findings above, GINS1 was concluded as a promising diagnostic biomarker to distinguish LIHC from normal liver tissues.
The RAS/RAF/MAPK signaling pathway has been reported to be involved in GINS1-mediated tumor progression (28, 33), and could be regulated by microRNA-340 to suppress the tumorigenic phenotype in melanoma (34). In breast cancer, black rice anthocyanins could suppress metastasis by targeting the RAS/RAF/MAPK pathway (35). In this study, the co-expression analysis showed that the expression of GINS1 was significantly correlated with GINS4, GINS2, GINS3, and MCM2-8. Meanwhile, GO enrichment and KEGG pathway analyses discovered that many pathways related to DNA replication and cell cycle were highly associated with GINS1, including cell cycle, DNA replication, and cellular senescence. The above results substantiated that GINS1 played a certain role in the progression of LIHC and could be a potential therapeutic target of LIHC. However, this needs to be verified by in-depth experiments in the future.
It is widely known that gene mutation is closely related to tumor progression and poor prognosis. In the present study, the percentage of GINS1 genetic alteration in LIHC was only 0.2%, and there was no statistically significant difference between the genetic alteration of GINS1 and OS or PFS. Such results might be the result of insufficient sample size. Aberrant DNA methylation in tumors can occur before or after cellular mutation, and aberrant DNA methylation regulates gene expression in tumors by recruiting proteins involved in gene repression or by inhibiting the binding of transcription factors to DNA (19, 20). Therefore, the relationship was investigated between the DNA methylation levels of GINS1 and the prognosis of LIHC patients. High methylation of cg07062412 was associated with a worse OS in LIHC, however, high methylation of the other 4 CpG was associated with a better OS, which indicated that the DNA methylation level of GINS1 was associated with the prognosis of patients. M6A methylation, which is known as the most important and abundant form of internal modifications in eukaryotic cells, plays a pivotal role in promoting tumor proliferation, migration, and invasion (36). Qi et al. discovered that high expression of m6A-related genes was associated with poor OS of LIHC, except for ZC3H13 (37). Chen et al. found that WTAP was related to m6A modification, contributing to the development of LIHC through the HuR-ETS1-p21/p27 axis (38). The key m6A-related genes METTL3 and METTL14 were reported to be active components of the m6A methyltransferase complex and correlated with tumor proliferation, differentiation, tumorigenesis, invasion, and metastasis (39, 40). In this study, efforts were made to investigate whether GINS1 expression was associated with m6A modification in LIHC. Expression levels of METTL3, RBM15, RBM15B, VIRMA, WTAP, YTHDC1, YTHDC2, IGF2BP1, IGF2BP2, IGF2BP3, YTHDF1, YTHDF2, YTHDF3, HNRNPA2B1, HNRNPC, RBMX, FTO and ALKBH5 increased in the high GINS1 expression group. Thus, we speculated that the GINS1 expression was closely related to m6A modification which promoted the proliferation, migration, and metastasis of LIHC.
The correlation with tumor immune microenvironment in LIHC has not been fully investigated yet. Analysis from the TIMER database unveiled that the expression of GINS1 in LIHC was correlated with several tumor-infiltrating immune cells including B cell, CD8+ T cell, CD4+ T cell, macrophage, neutrophil, and dendritic cell. These results substantiated that GINS1 played a specific role in immune infiltration in LIHC, which could be a potential target for immunotherapy. The next exploration focused on the correlation with immune marker sets of various immune cells of LIHC. Results showed significant correlations with markers of B cell, CD8+ T, T cell, monocyte, TAM, M1 macrophage and M2 macrophage. Moreover, upregulated GINS1 was also associated with increased DC markers. These results revealed that GINS1 might be capable of regulating the polarization of macrophages and tumor DC penetration. There was a significant correlation with markers of Treg and exhausted T cell, and correlation analysis showed significant positive correlations with PDCD1 (PD-1), CD274 (PD-L1), PDCD1LG2 (PD-L2), LAG3, CTLA4, and HAVCR2 (TIM3), indicating the unignorable effect of immune escape in GINS1-mediated carcinogenesis of LIHC.
Admittedly, although the current study includes the verification of immunohistochemical staining experiments, it is only a preliminary exploration in the early stage, and there is a temporary lack of more in-depth experimental verification. However, these research results can preliminarily clarify the feasibility of the research, and are very cost-effective, and provide a theoretical basis for subsequent in-depth research. In the future, we can further verify the relationships between GINS1, methylation and immune microenvironment through relevant experiments, and explore its detailed mechanisms.
In conclusion, the expression of GINS1 was significantly upregulated in LIHC. The ROC curve, KM-plotter, and forest plot showed the prognostic and diagnostic value of GINS1. Further enrichment, methylation, and tumor immune microenvironment analyses showed an intimate connection with GINS1.
The raw data supporting the conclusions of this article will be made available by the authors, without undue reservation.
The studies involving humans were approved by The Ethics Committee and Institutional Review Board of the First Affiliated Hospital of Jinan University. The studies were conducted in accordance with the local legislation and institutional requirements. The participants provided their written informed consent to participate in this study.
ML: Conceptualization, Data curation, Investigation, Writing – original draft. TiL: Conceptualization, Data curation, Formal Analysis, Investigation, Writing – original draft. ZL: Conceptualization, Data curation, Formal Analysis, Writing – original draft. WY: Formal Analysis, Investigation, Methodology, Writing – original draft. MC: Formal Analysis, Methodology, Validation, Writing – original draft. NY: Methodology, Validation, Visualization, Writing – original draft. YH: Funding acquisition, Resources, Supervision, Validation, Writing – review & editing. ToL: Funding acquisition, Resources, Software, Validation, Visualization, Writing – review & editing. JL: Funding acquisition, Project administration, Supervision, Validation, Visualization, Writing – review & editing.
The author(s) declare that financial support was received for the research, authorship, and/or publication of this article. This study was supported by grants from the Major Talent Program of Guangdong Province (No. 2019QN01Y933), the Fundamental Research Funds for the Central Universities (No. 21622102), the Medical Joint Fund of Jinan University (No. YXJC2022006, No.YXZY2024018), the Project of State Key Laboratory of Functions and Applications of Medicinal Plants, Guizhou Medicinal University (No. QJJ(2022)420), and the Science and Technology Project of Guangzhou (No. 2025A03J4261).
The authors gratefully acknowledge the public databases and web portals such as TCGA, CPTAC, HPA, KM-plotter, STRING, cBioPortal, TIMER, TISIDB, GEPIA, and GTEx for offering convenient access to datasets and online analysis.
The authors declare that the research was conducted in the absence of any commercial or financial relationships that could be construed as a potential conflict of interest.
All claims expressed in this article are solely those of the authors and do not necessarily represent those of their affiliated organizations, or those of the publisher, the editors and the reviewers. Any product that may be evaluated in this article, or claim that may be made by its manufacturer, is not guaranteed or endorsed by the publisher.
1. Bray F, Laversanne M, Sung H, Ferlay J, Siegel RL, Soerjomataram I, et al. Global cancer statistics 2022: GLOBOCAN estimates of incidence and mortality worldwide for 36 cancers in 185 countries. CA Cancer J Clin. (2024) 74:229–63. doi: 10.3322/caac.21834
2. Villanueva A. Hepatocellular carcinoma. N Engl J Med. (2019) 380:1450–62. doi: 10.1056/NEJMra1713263
3. Center MM, Jemal A. International trends in liver cancer incidence rates. Cancer Epidemiol Biomarkers Prev. (2011) 20:2362–8. doi: 10.1158/1055-9965.EPI-11-0643
5. Yoh T, Seo S, Taura K, Iguchi K, Ogiso S, Fukumitsu K, et al. Surgery for recurrent hepatocellular carcinoma: achieving long-term survival. Ann Surg. (2021) 273:792–9. doi: 10.1097/SLA.0000000000003358
6. European Association for the Study of the Liver, Electronic address:ZWFzbG9mZmljZUBlYXNsb2ZmaWNlLmV1. EASL Clinical Practice Guidelines on the management of hepatocellular carcinoma. J Hepatol. (2025) 82:315–74. doi: 10.1016/j.jhep.2024.08.028
7. Limousin W, Laurent-Puig P, Ziol M, Ganne-Carrié N, Nahon P, Ait-Omar A, et al. Molecular-based targeted therapies in patients with hepatocellular carcinoma and hepato-cholangiocarcinoma refractory to atezolizumab/bevacizumab. J Hepatol. (2023) 79:1450–8. doi: 10.1016/j.jhep.2023.08.017
8. Huang A, Yang XR, Chung WY, Dennison AR, Zhou J. Targeted therapy for hepatocellular carcinoma. Signal Transduct Target Ther. (2020) 5:146. doi: 10.1038/s41392-020-00264-x
9. He H, Chen S, Fan Z, Dong Y, Wang Y, Li S, et al. Multi-dimensional single-cell characterization revealed suppressive immune microenvironment in AFP-positive hepatocellular carcinoma. Cell Discovery. (2023) 9:60. doi: 10.1038/s41421-023-00563-x
10. Rizvi S, Wang J, El-Khoueiry AB. Liver cancer immunity. Hepatology. (2021) 73 Suppl 1:86–103. doi: 10.1002/hep.31416
11. Labib K, Gambus A. A key role for the GINS complex at DNA replication forks. Trends Cell Biol. (2007) 17:271–8. doi: 10.1016/j.tcb.2007.04.002
12. Gambus A, Jones RC, Sanchez-Diaz A, Kanemaki M, van Deursen F, Edmondson RD, et al. GINS maintains association of Cdc45 with MCM in replisome progression complexes at eukaryotic DNA replication forks. Nat Cell Biol. (2006) 8:358–66. doi: 10.1038/ncb1382
13. Takayama Y, Kamimura Y, Okawa M, Muramatsu S, Sugino A, Araki H. GINS, a novel multiprotein complex required for chromosomal DNA replication in budding yeast. Genes Dev. (2003) 17:1153–65. doi: 10.1101/gad.1065903
14. Kanemaki M, Sanchez-Diaz A, Gambus A, Labib K. Functional proteomic identification of DNA replication proteins by induced proteolysis. vivo. Nat. (2003) 423:720–4. doi: 10.1038/nature01692
15. Moyer SE, Lewis PW, Botchan MR. Isolation of the Cdc45/Mcm2-7/GINS (CMG) complex, a candidate for the eukaryotic DNA replication fork helicase. Proc Natl Acad Sci U.S.A. (2006) 103:10236–41. doi: 10.1073/pnas.0602400103
16. Pacek M, Tutter AV, Kubota Y, Takisawa H, Walter JC. Localization of MCM2-7, Cdc45, and GINS to the site of DNA unwinding during eukaryotic DNA replication. Mol Cell. (2006) 21:581–7. doi: 10.1016/j.molcel.2006.01.030
17. Nagahama Y, Ueno M, Miyamoto S, Morii E, Minami T, Mochizuki N, et al. PSF1, a DNA replication factor expressed widely in stem and progenitor cells, drives tumorigenic and metastatic properties. Cancer Res. (2010) 70:1215–24. doi: 10.1158/0008-5472.CAN-09-3662
18. Bu F, Zhu X, Yi X, Luo C, Lin K, Zhu J, et al. Expression profile of GINS complex predicts the prognosis of pancreatic cancer patients. Onco Targets Ther. (2020) 13:11433–44. doi: 10.2147/OTT.S275649
19. Moore LD, Le T, Fan G. DNA methylation and its basic function. Neuropsychopharmacology. (2013) 38:23–38. doi: 10.1038/npp.2012.112
20. Klutstein M, Nejman D, Greenfield R, Cedar H. DNA methylation in cancer and aging. Cancer Res. (2016) 76:3446–50. doi: 10.1158/0008-5472.CAN-15-3278
21. Cottineau J, Kottemann MC, Lach FP, Kang YH, Vely F, Deenick EK, et al. Inherited GINS1 deficiency underlies growth retardation along with neutropenia and NK cell deficiency. J Clin Invest. (2017) 127:1991–2006. doi: 10.1172/JCI90727
22. Li Y, Xiao J, Bai J, Tian Y, Qu Y, Chen X, et al. Molecular characterization and clinical relevance of m(6)A regulators across 33 cancer types. Mol Cancer. (2019) 18:137. doi: 10.1186/s12943-019-1066-3
23. Franz M, Rodriguez H, Lopes C, Zuberi K, Montojo J, Bader GD, et al. GeneMANIA update 2018. Nucleic Acids Res. (2018) 46:W60–W4. doi: 10.1093/nar/gky311
24. Danaher P, Warren S, Dennis L, D’Amico L, White A, Disis ML, et al. Gene expression markers of Tumor Infiltrating Leukocytes. J Immunother Cancer. (2017) 5:18. doi: 10.1186/s40425-017-0215-8
25. Siemers NO, Holloway JL, Chang H, Chasalow SD, Ross-MacDonald PB, Voliva CF, et al. Genome-wide association analysis identifies genetic correlates of immune infiltrates in solid tumors. PloS One. (2017) 12:e0179726. doi: 10.1371/journal.pone.0179726
26. Sousa S, Maatta J. The role of tumour-associated macrophages in bone metastasis. J Bone Oncol. (2016) 5:135–8. doi: 10.1016/j.jbo.2016.03.004
27. Ru B, Wong CN, Tong Y, Zhong JY, Zhong SSW, Wu WC, et al. TISIDB: an integrated repository portal for tumor-immune system interactions. Bioinformatics. (2019) 35:4200–2. doi: 10.1093/bioinformatics/btz210
28. Li S, Wu L, Zhang H, Liu X, Wang Z, Dong B, et al. GINS1 induced sorafenib resistance by promoting cancer stem properties in human hepatocellular cancer cells. Front Cell Dev Biol. (2021) 9:711894. doi: 10.3389/fcell.2021.711894
29. Zhu W, Wu C, Liu Z, Zhao S, Huang J. OTU deubiquitinase, ubiquitin aldehyde binding 2 (OTUB2) modulates the stemness feature, chemoresistance, and epithelial-mesenchymal transition of colon cancer via regulating GINS complex subunit 1 (GINS1) expression. Cell Commun Signal. (2024) 22:420. doi: 10.1186/s12964-024-01789-2
30. Fu Q, Zheng H, Wang X, Tang F, Yu H, Wang H, et al. GINS1 promotes the initiation and progression of bladder cancer by activating the AKT/mTOR/c-Myc signaling pathway. Exp Cell Res. (2024) 440:114125. doi: 10.1016/j.yexcr.2024.114125
31. Shen G, Zheng F, Ren D, Du F, Dong Q, Wang Z, et al. Anlotinib: a novel multi-targeting tyrosine kinase inhibitor in clinical development. J Hematol Oncol. (2018) 11:120. doi: 10.1186/s13045-018-0664-7
32. Gounder MM, Mahoney MR, Van Tine BA, Ravi V, Attia S, Deshpande HA, et al. Sorafenib for advanced and refractory desmoid tumors. N Engl J Med. (2018) 379:2417–28. doi: 10.1056/NEJMoa1805052
33. Dimri M, Satyanarayana A. Molecular signaling pathways and therapeutic targets in hepatocellular carcinoma. Cancers (Basel). (2020) 12:491. doi: 10.3390/cancers12020491
34. Poenitzsch Strong AM, Setaluri V, Spiegelman VS. MicroRNA-340 as a modulator of RAS-RAF-MAPK signaling in melanoma. Arch Biochem Biophys. (2014) 563:118–24. doi: 10.1016/j.abb.2014.07.012
35. Chen XY, Zhou J, Luo LP, Han B, Li F, Chen JY, et al. Black rice anthocyanins suppress metastasis of breast cancer cells by targeting RAS/RAF/MAPK pathway. BioMed Res Int. (2015) 2015:414250. doi: 10.1155/2015/414250
36. Deng X, Qing Y, Horne D, Huang H, Chen J. The roles and implications of RNA m6A modification in cancer. Nat Rev Clin Oncol. (2023) 20:507–26. doi: 10.1038/s41571-023-00774-x
37. Qi LW, Jia JH, Jiang CH, Hu JM. Contributions and prognostic values of N6-methyladenosine RNA methylation regulators in hepatocellular carcinoma. Front Genet. (2020) 11:614566. doi: 10.3389/fgene.2020.614566
38. Chen XY, Zhang J, Zhu JS. The role of m(6)A RNA methylation in human cancer. Mol Cancer. (2019) 18:103. doi: 10.1186/s12943-019-1033-z
39. Wang Y, Wang Y, Patel H, Chen J, Wang J, Chen ZS, et al. Epigenetic modification of m6A regulator proteins in cancer. Mol Cancer. (2023) 22:102. doi: 10.1186/s12943-023-01810-1
Keywords: GINS1, biomarkers, prognosis, methylation, immune escape, liver hepatocellular carcinoma
Citation: Liang M, Lai T, Li Z, Yu W, Cao M, Yao N, Hu Y, Liu T and Liang J (2025) GINS1 is a prognostic biomarker and correlated with methylation and immune escape in liver hepatocellular carcinoma. Front. Oncol. 15:1492599. doi: 10.3389/fonc.2025.1492599
Received: 07 September 2024; Accepted: 19 February 2025;
Published: 07 March 2025.
Edited by:
Liang Qiao, The University of Sydney, AustraliaReviewed by:
Shi-Jie Zhang, Cancer Hospital, National Cancer Center, Beijing, ChinaCopyright © 2025 Liang, Lai, Li, Yu, Cao, Yao, Hu, Liu and Liang. This is an open-access article distributed under the terms of the Creative Commons Attribution License (CC BY). The use, distribution or reproduction in other forums is permitted, provided the original author(s) and the copyright owner(s) are credited and that the original publication in this journal is cited, in accordance with accepted academic practice. No use, distribution or reproduction is permitted which does not comply with these terms.
*Correspondence: Youzhu Hu, ZHJoeXpAaG90bWFpbC5jb20=; Tongzheng Liu, bGl1dG9uZ3poZW5nQGpudS5lZHUuY24=; Junjie Liang, ampsaWFuZ0BqbnUuZWR1LmNu
†These authors have contributed equally to this work and share first authorship
Disclaimer: All claims expressed in this article are solely those of the authors and do not necessarily represent those of their affiliated organizations, or those of the publisher, the editors and the reviewers. Any product that may be evaluated in this article or claim that may be made by its manufacturer is not guaranteed or endorsed by the publisher.
Research integrity at Frontiers
Learn more about the work of our research integrity team to safeguard the quality of each article we publish.