 Xiaoling Liu1†
 Chen Yang
 Dong Tian
 Xiachuan Qin
95% of researchers rate our articles as excellent or good
Learn more about the work of our research integrity team to safeguard the quality of each article we publish.
Find out more
ORIGINAL RESEARCH article
Front. Oncol. , 21 March 2025
Sec. Head and Neck Cancer
Volume 15 - 2025 | https://doi.org/10.3389/fonc.2025.1485393
This article is part of the Research Topic Advancing Cancer Imaging Technologies: Bridging the Gap from Research to Clinical Practice Volume II View all 4 articles
Objective: This study aimed to evaluate the diagnostic value of two-step ultrasound radiomics models in distinguishing parotid malignancies from pleomorphic adenomas (PAs) and Warthin’s tumors (WTs).
Methods: A retrospective analysis was conducted on patients who underwent parotidectomy at our institution between January 2015 and December 2022. Radiomics features were extracted from two-dimensional (2D) ultrasound images using 3D Slicer. Feature selection was performed using the Mann–Whitney U test and seven additional selection methods. Two-step LASSO-BNB and voting ensemble learning modeling algorithm with recursive feature elimination feature selection method (RFE-Voting) models were then applied for classification. Model performance was assessed using the area under the receiver operating characteristic curve (AUC), and internal validation was conducted through fivefold cross-validation.
Results: A total of 336 patients were included in the study, comprising 73 with malignant tumors and 263 with benign lesions (118 WT and 145 PA). The LASSO-NB model demonstrated excellent performance in distinguishing between benign and malignant parotid lesions, achieving an AUC of 0.910 (95% CI, 0.907–0.914), with an accuracy of 86.8%, sensitivity of 92.5%, and specificity of 66.7%, significantly outperforming experienced sonographers (accuracy of 61.90%). The RFE-Voting model also showed outstanding performance in differentiating PA from WT, with an AUC of 0.962 (95% CI, 0.959–0.963), accuracy of 83.0%, sensitivity of 84.0%, and specificity of 92.1%, exceeding the diagnostic capability of experienced sonographers (accuracy of 65.39%).
Conclusion: The two-step LASSO-BNB and RFE-Voting models based on ultrasound imaging performed well in distinguishing glandular malignant tumors from PA and WT and have good predictive capabilities, which can provide more useful information for non-invasive differentiation of parotid gland tumors before surgery.
Parotid gland tumors are mostly benign, of which pleomorphic adenoma (PA) and Warthin’s tumor (WT) account for the vast majority, accounting for 85.7% (1), and the risk of malignant tumors (MTs) is 7%–15%. Therefore, the identification of PA and WT in benign parotid tumors, as well as their identification in MTs, has become the main content of daily ultrasound diagnosis of parotid tumors. Accurately distinguishing between benign and malignant tumors, as well as differentiating between PA and WT, can help radiologists solve over 90% of parotid gland tumor diagnosis problems such as the physiological function of the parotid gland and the anatomical structure of the parotid gland area are complex, the capsule of the parotid gland tumor is incomplete, the tissue cutting biopsy of the thick needle is prone to tumor implantation and metastasis, and the scar formed after the biopsy easily increases the risk of intraoperative facial nerve injury. Therefore, the parotid gland tumor is generally not cut before surgery. Biopsy for preoperative diagnosis depends on patient signs and imaging findings. The parotid glands may be quickly and inexpensively examined using sonography; in ultrasound, the pleomorphic adenoma displays smooth margins, often with lobules and either homogeneous or heterogenic parenchyma. Doppler sonography typically shows little vascularization. Calcifications as well as necrosis tend to appear as the tumor becomes larger (2). However, given the overlap and atypicality of imaging characteristics, the accuracy of using ultrasound alone to diagnose PA is approximately 64% and 82% for Warthin’s tumor. This presents a significant challenge in distinguishing between benign and malignant parotid tumors, as well as their common subtypes, based solely on clinical and imaging evaluations (3).
Radiomics is an emerging technology that is defined as transforming medical images into high-throughput features to quantitatively evaluate tumor phenotypes (4, 5). High-throughput features that cannot be directly observed by the naked eye can be quantitatively extracted from single or multiple medical images and then applied to machine learning methods to construct classification or prediction models. This method can more objectively evaluate tumor status and distinguish malignant from benign tumors or nodules (6, 7). Therefore, we attempted to use a ternary classification method (8) based on ultrasound radiomics analysis to improve the diagnostic confidence of radiologists in the diagnosis of parotid nodules, which is helpful for physicians to formulate more accurate treatment plans before surgery, shorten the operation time of patients, predict the outcome of the disease, and provide a more accurate and non-invasive preoperative diagnosis for the clinic.
The study was approved by the Institutional Ethics Review Committee, which waived the requirement for informed consent. It involved only anonymous imaging datasets, and no individual patient data or human tissue samples were collected.
A total of 336 patients who underwent parotid gland mastectomy in Nanchong Central Hospital from January 2015 to December 2022 were retrospectively analyzed. The clinicopathological and ultrasound data of the patients were retrospectively analyzed. The inclusion criteria were as follows: 1) patients underwent surgery and pathological results, 2) underwent routine ultrasound examination within 1 week before surgery, and 3) had complete imaging data. The exclusion criteria were as follows: 1) patients receiving neoadjuvant therapy (chemotherapy, immunotherapy, or radiotherapy) and 2) were uncooperative during an ultrasound examination or had an image quality that was poor and not suitable for analysis.
The ultrasound (US) instruments employed to acquire the images used in this study included Mindray Resona 7 (Shenzhen Mindray Bio-Medical Electronics Co., Ltd., Shenzhen, China), Esaote MyLab (Esaote, Genoa, Italy), and linear array probe frequency (8–12 MHz). Considering that the corresponding diagnostic results of transverse and longitudinal assessments may overlap and that the longitudinal section is less disturbed, our study selected the longitudinal section of the tumor.
All images were anonymized and measured using the 3D Slicer software (version 4.10.2, https://www.slicer.org). The measurement was completed by two physicians with more than 5 years of experience in ultrasound diagnosis who were blinded to the pathological results.
The feature extraction was implemented using the open-source python package “Pyradiomics V3.0.1” (http://www.radiomics.io/pyradiomics.html). Then, a total of 474 radiomics features were extracted.
We standardized the gray value of all ultrasound images to ensure that the gray value range was consistent and did not need resampling because ultrasound is a two-dimensional (2D) image and does not contain three-dimensional (3D) spatial information. After we ensured that the mask matched the image, we used the same radiomics feature extractor for feature extraction to ensure that the extracted radiomics feature extraction was consistent and reliable.
Similar methods were used in other studies by our team (9). All clinical features (15) and radiomics features (474)were selected using the Mann–Whitney U test after z-score normalization, and then seven feature selection methods (least absolute shrinkage and selection operator, analysis of variance, mutual information, recursive feature elimination, forward selection, random forest, and logistic regression) were used for further selection. The adjustment parameter (λ) in the LASSO model was selected using fivefold cross-validation, and the grid search method was used to adjust the parameters to obtain the LASSO coefficient spectrum of radiomics and clinical features. Subsequently, 11 modeling algorithms were used to model the features selected by each feature screening method. A total of 77 models were established, and heatmaps showing the area under the curve of each model were obtained.
Mutual information (MI) is a measure of the degree of interdependence between two random variables. It is based on the concept of entropy in information theory, indicating how much uncertainty of one variable can be reduced by another variable. MI is not limited to linear relationships; it can capture any type of statistical dependence, including non-linear relationships. This method is simple and efficient and can quickly screen out features related to disease diagnosis and reduce the complexity of the model.
ANOVA is mainly used to compare the mean values between three or more groups to determine that there is a significant difference between the mean values of at least one group and other groups. Because our clinical data and omics data are mostly continuous variables, this method is selected. Through ANOVA, the features that have a significant impact on disease diagnosis can be screened out, and the accuracy and generalization ability of the model can be improved.
Recursive feature elimination (RFE): By recursively training the model, the least important features are removed until a predetermined number of features are reached. RFE can dynamically select features based on the performance of the model, ensuring that the final selected features significantly improve the predictive ability of the model.
Forward search (FS) is suitable for the case where the number of features is large and the computing resources are limited. This method starts with a basic model without any features and then adds a feature in turn until there is no more improvement. It provides an effective method to reduce the feature dimension while maintaining the predictive performance of the model as much as possible.
LASSO belongs to the method of L1 regularization (LASSO Regression): by adding L1 norm terms to the loss function, the weights of certain features become zero, thereby achieving feature selection. L1 regularization can not only reduce the number of features but also improve the sparsity and interpretability of the model.
Feature importance from tree-based models: Feature importance scores from random forest tree models are used to select important features. The tree model can automatically evaluate the importance of features and select the features that contribute the most to disease diagnosis.
The fivefold cross-validation method was used to test the best model performance for differentiating benign from MT and differentiating PA from WT; the area under the curve (AUC), sensitivity, specificity, positive predictive value (PPV), negative predictive value (NPV), and accuracy of the two models were obtained.
The receiver operating characteristic (ROC) curve and decision curve analysis (DCA) were used to evaluate the optimal model for differentiating benign tumors from MT, as well as PA from WT.
Two expert radiologists (with 13 and 20 years of experience in ultrasound diagnosis of parotid gland diseases) studied the images. Neither of the radiologists knew the patients’ clinical features and pathological results. First, 263 cases of benign and 73 cases of malignant lesions were differentiated among all cases, and the benign and malignant cases were determined by ultrasound images. Furthermore, 118 cases of WT and 145 cases of PA in benign lesions were differentiated and diagnosed. If there was any disagreement, both parties reached a consensus through discussion. The results were compared with those of the best model. In case of differences, a consensus was reached through mutual discussion. The results were compared with those of the best model.
Statistical analysis was performed using SPSS 25.0 (IBM, Armonk, NY, USA). First, the Kolmogorov–Smirnov test was used to evaluate whether the count data were normally distributed. The independent samples t-test was used when the normal distribution was met, and the Mann–Whitney U test was used when the normal distribution was not met. Continuous variables were described as mean ± SD, and enumeration data were compared among groups using χ2 test or Fisher’s exact probability. ROC curve was used to evaluate the accuracy, sensitivity, specificity, and AUC value of the two best models. p < 0.05 was considered to be statistically significant.
In this study, there were 336 patients with parotid tumors: 263 benign and 73 malignant. In the benign cases, there were 118 cases of WT and 145 cases of PA. The clinical features and ultrasonographic features of benign and malignant parotid tumors are shown in Table 1. The clinical characteristics and ultrasound manifestations of benign parotid gland tumors—pleomorphic adenoma and Warthin’s tumor—are shown in Table 2.
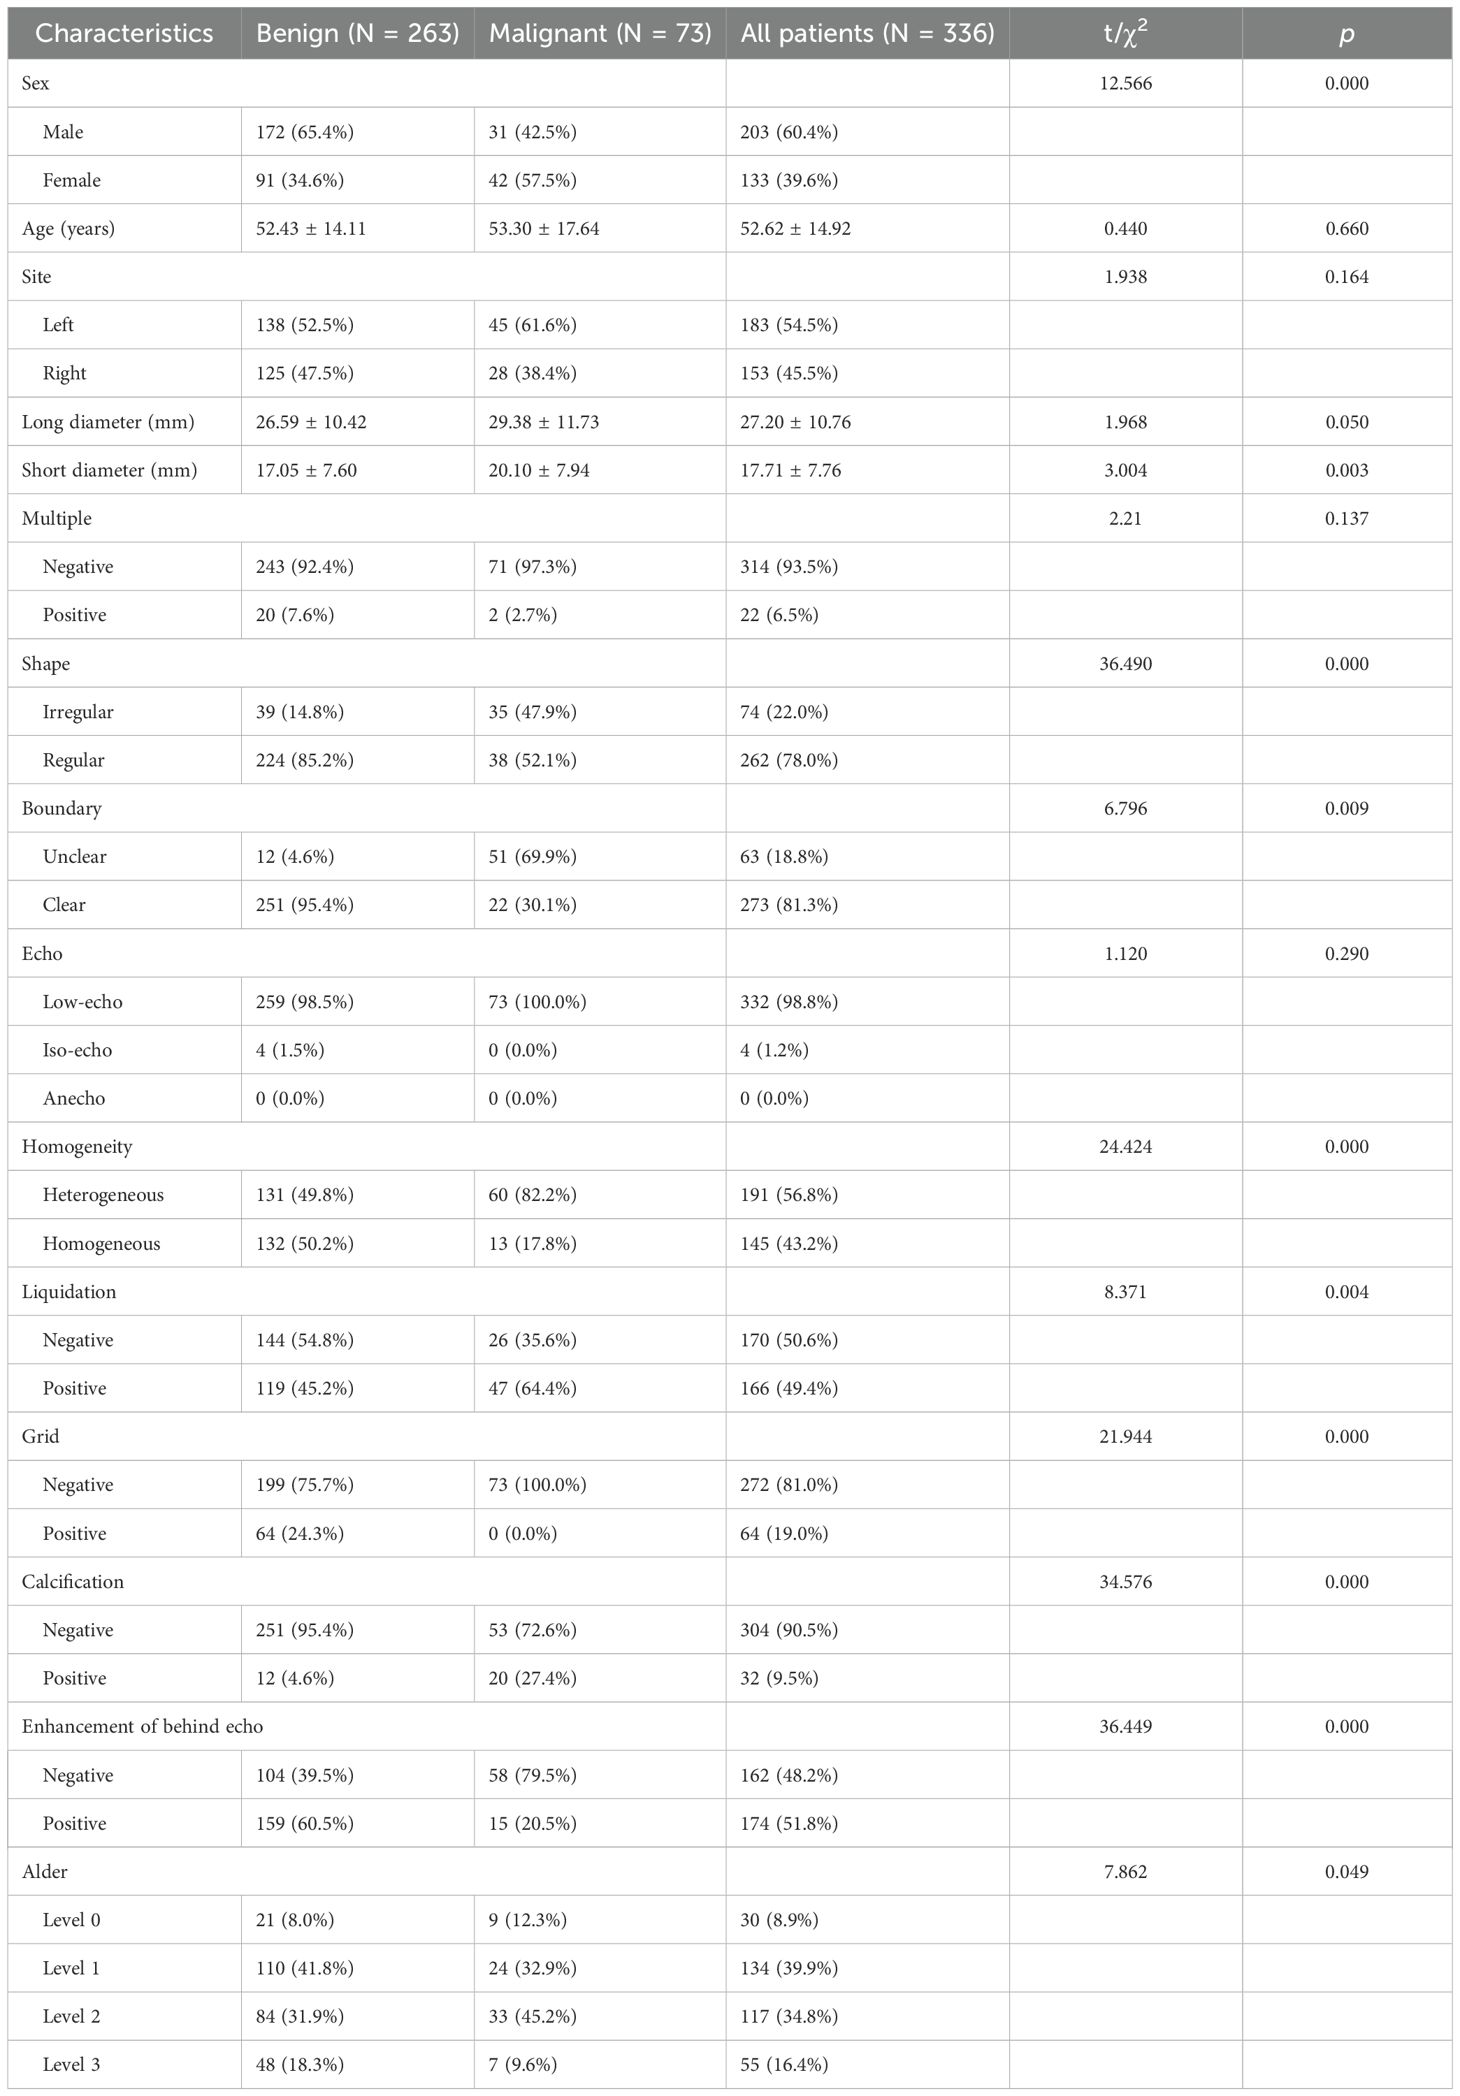
Table 1. Baseline clinical characteristics of all patients.
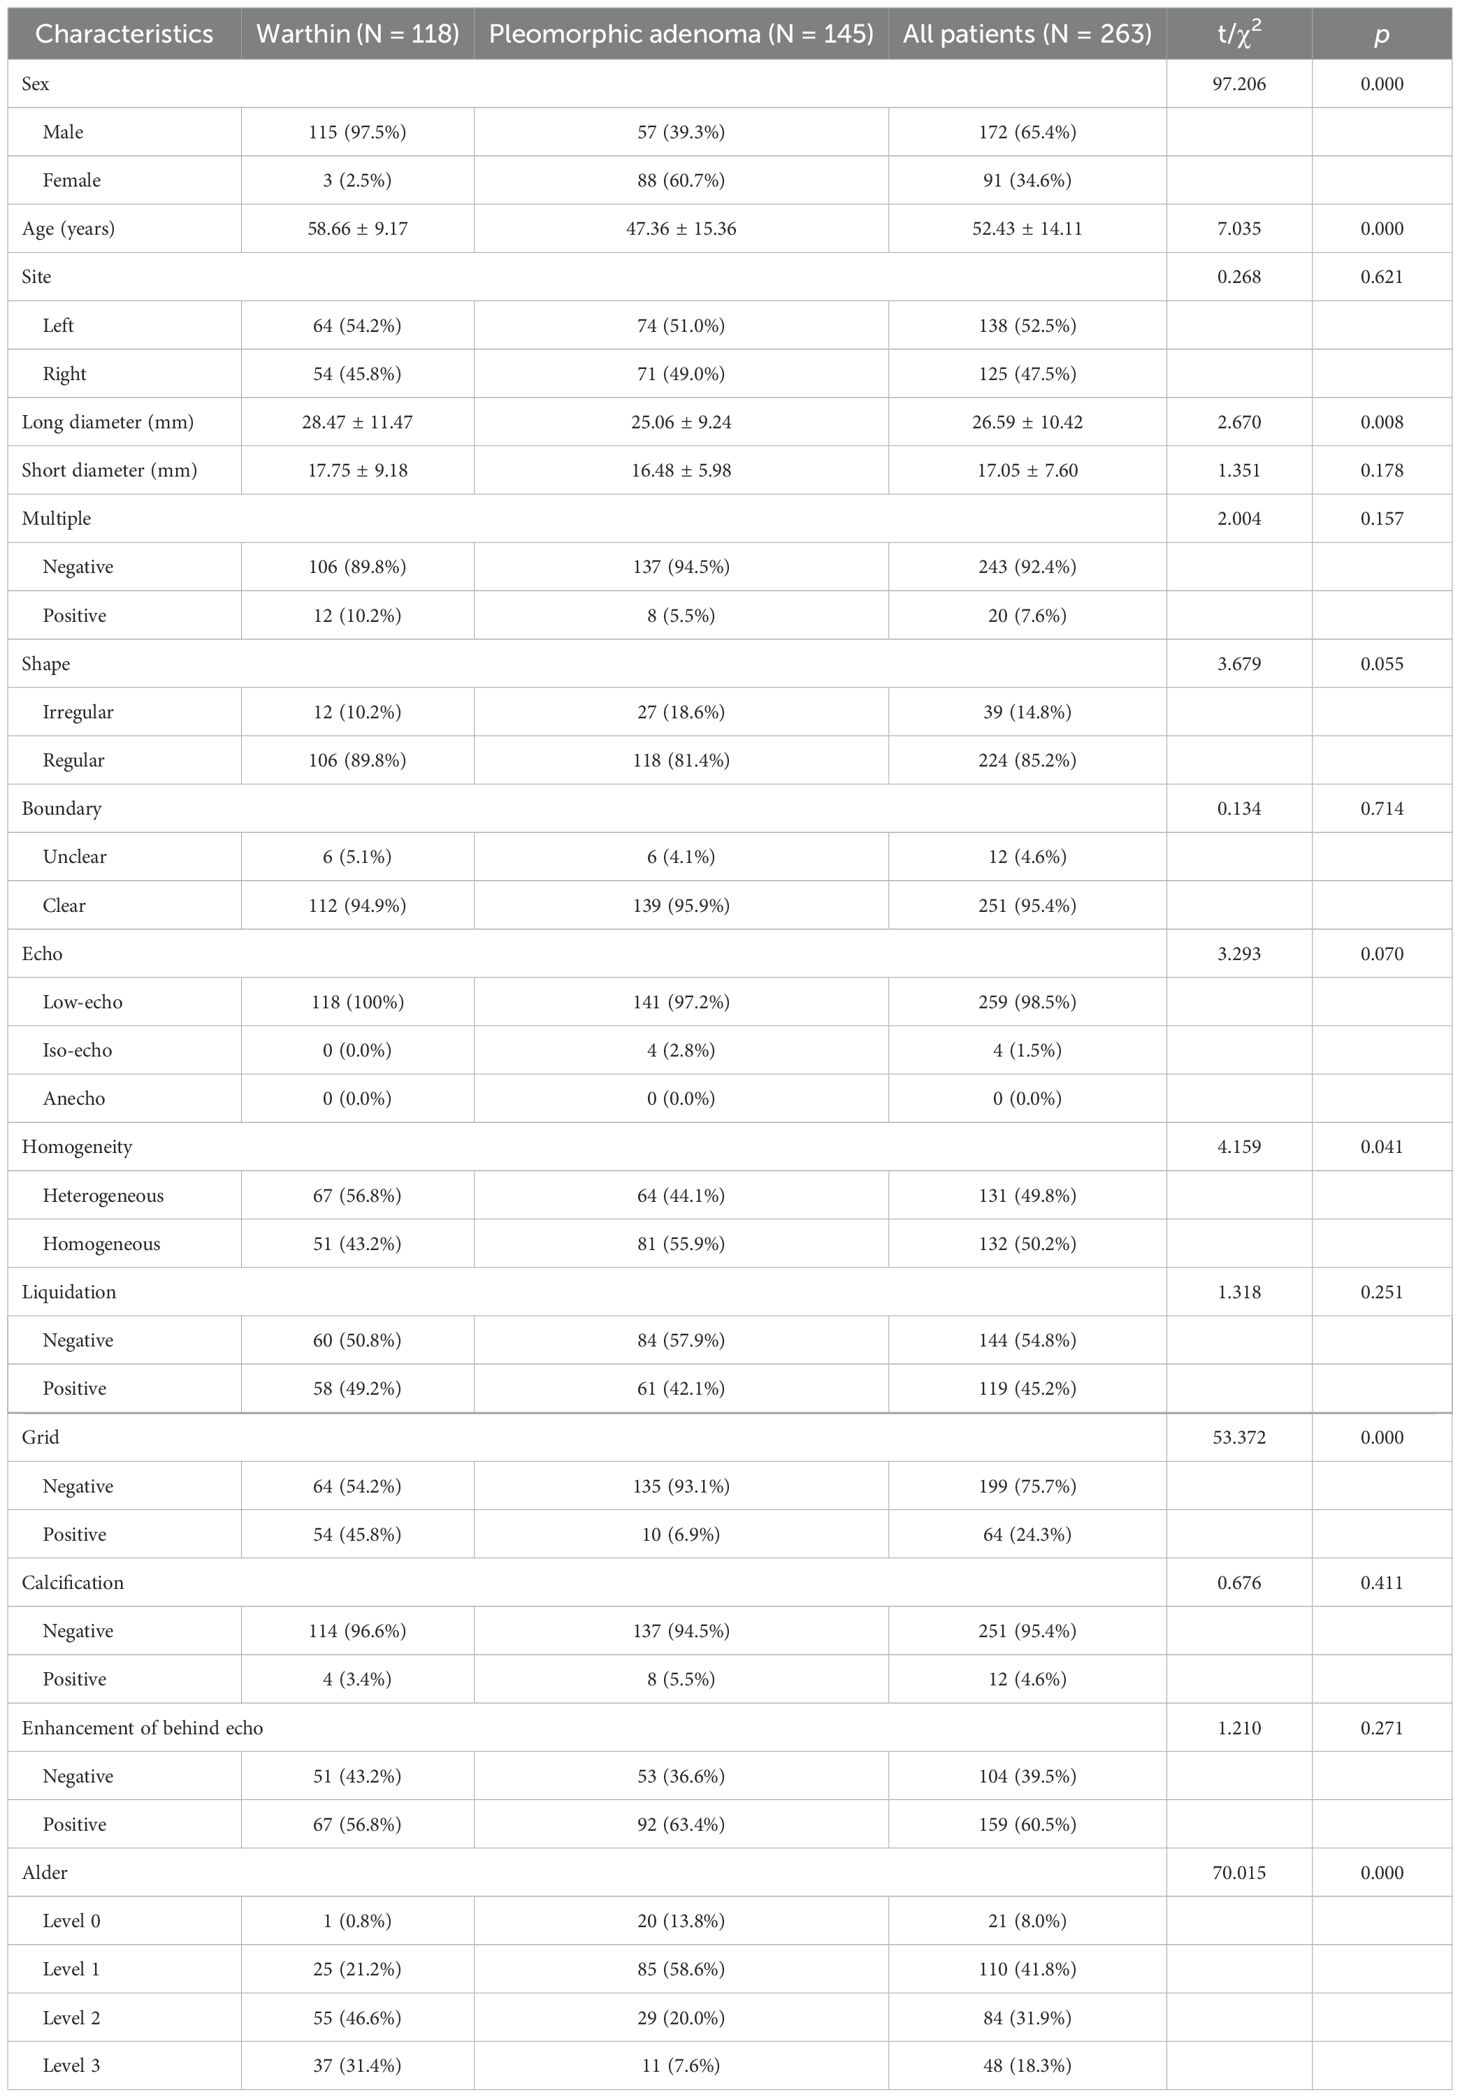
Table 2. Baseline clinical characteristics of all patients with benign parotid gland.
A total of 474 radiomics features were extracted as follows: a) Shape 2D-based features (n = 9), b) first-order statistical features (n = 18), c) gray-level co-occurrence matrix (GLCM)-based features (n = 24), d) gray-level dependence matrix (GLDM)-based features (n = 14), e) gray-level run-length matrix (GLRLM)-based features (n = 16), f) gray-level size zone matrix (GLSZM)-based features (n = 16), g) neighboring gray-tone difference matrix (NGTDM)-based features (n = 5), and (h) transform-filtered features (including wavelet) (n = 372).
The optimal λ value of the log (λ) function of MSE was 0.019 by LASSO regression cross-validation, and the LASSO coefficient spectrum was obtained, as shown in Figure 1.
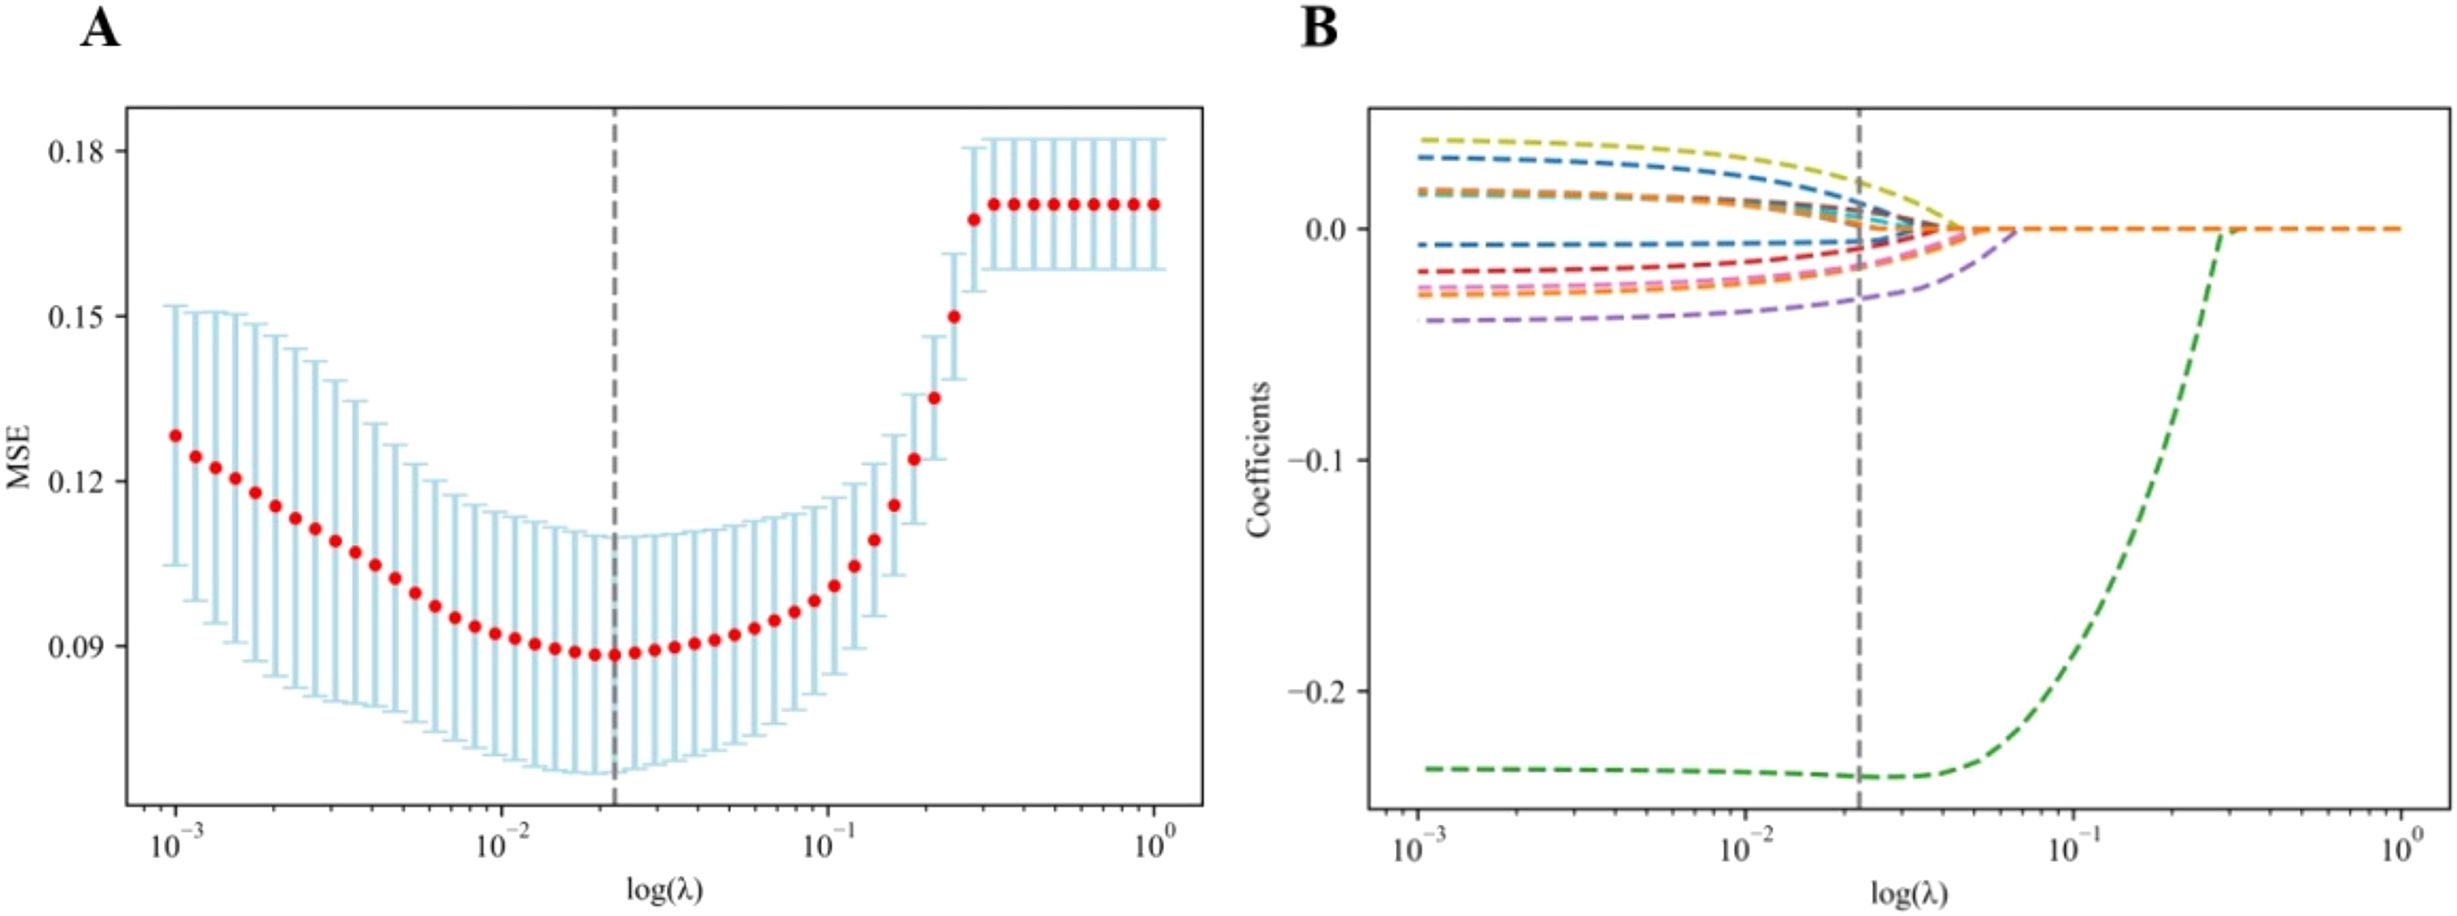
Figure 1. Flowchart of radiomics and clinical feature selection. (A) Selection of the tuning parameter (λ) in the LASSO model via the fivefold cross-validation. MSE on each fold from the LASSO regression cross-validation procedure was plotted as a function of log (λ). The optimal λ value of 0.019 was selected. (B) LASSO coefficient profiles of the 474 radiomics features and 15 clinical features. A vertical line was drawn at the value identified via the fivefold cross-validation, at which the optimal λ resulted in 12 non-zero coefficients. LASSO, least absolute shrinkage and selection operator.
Based on 77 models integrating radiomics and clinical features, the heatmaps of the area under the curve (as shown in Figure 2) showed that the LASSO-BNB model was superior to other models in differentiating benign from malignant parotid lesions (AUC 0.910). Voting ensemble learning modeling algorithm with recursive feature elimination feature selection method (RFE-Voting) showed the best performance in the differential diagnosis of benign parotid PA and WT (AUC 0.962). The LASSO-BNB and RFE-Voting models were modeled using 12 and 13 features, respectively. The detailed features are shown in Supplementary Tables 1, 2.
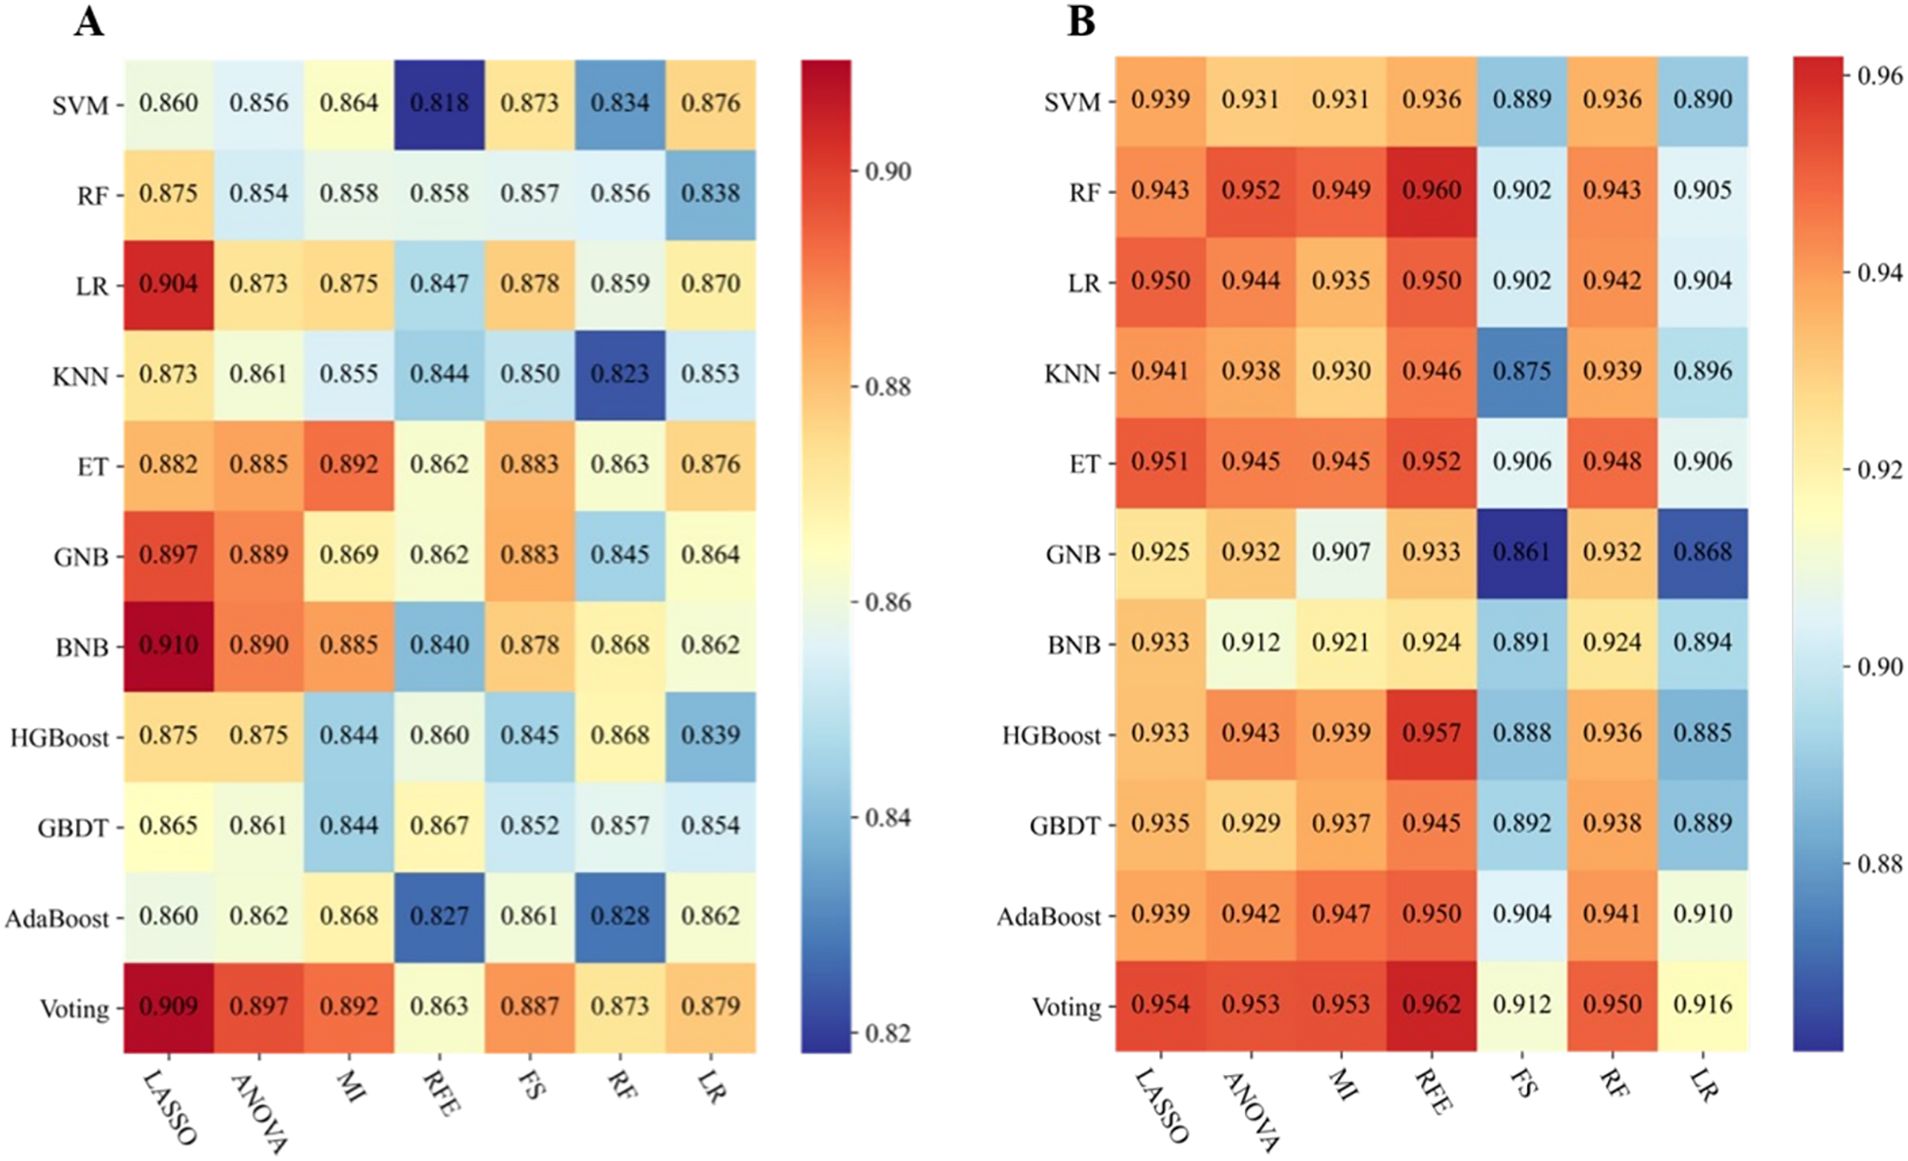
Figure 2. Performance of 77 models incorporating radiomics and clinical features via the fivefold cross-validation. (A) Performance of benign and malignant models. (B) Performance of Warthin and pleomorphic adenoma models. The heatmaps show the area under the curve of each modeling algorithm (columns) with each feature selection method (rows). SVM, support vector machine; RF, random forest; LR, logistic regression; KNN, k-nearest neighbors; ET, extremely randomized trees; GNB, Gaussian naive Bayes; BNB, Bernoulli naive Bayes; HGBoost, histogram-based gradient boosting; GBDT, gradient boosted decision trees; AdaBoost, adaptive boosting; Voting, voting classifier; LASSO, least absolute shrinkage and selection operator; ANOVA, analysis of variance; MI, mutual information; RFE, recursive feature elimination; FS, forward selection.
The AUC of LASSO-BNB was 0.910 (CI 0.907–0.914) as shown in Figure 3A, sensitivity was 92.5%, specificity was 66.7%, PPV was 90.4%, NPV was 71.4%, and accuracy was 86.8%. The AUC of RFE-Voting was 0.962 (CI 0.959–0.963) as shown in Figure 4A, sensitivity was 84.0%, specificity was 82.1%, PPV was 80.8%, NPV was 85.2%, and accuracy was 83.0%, as shown in Table 3.
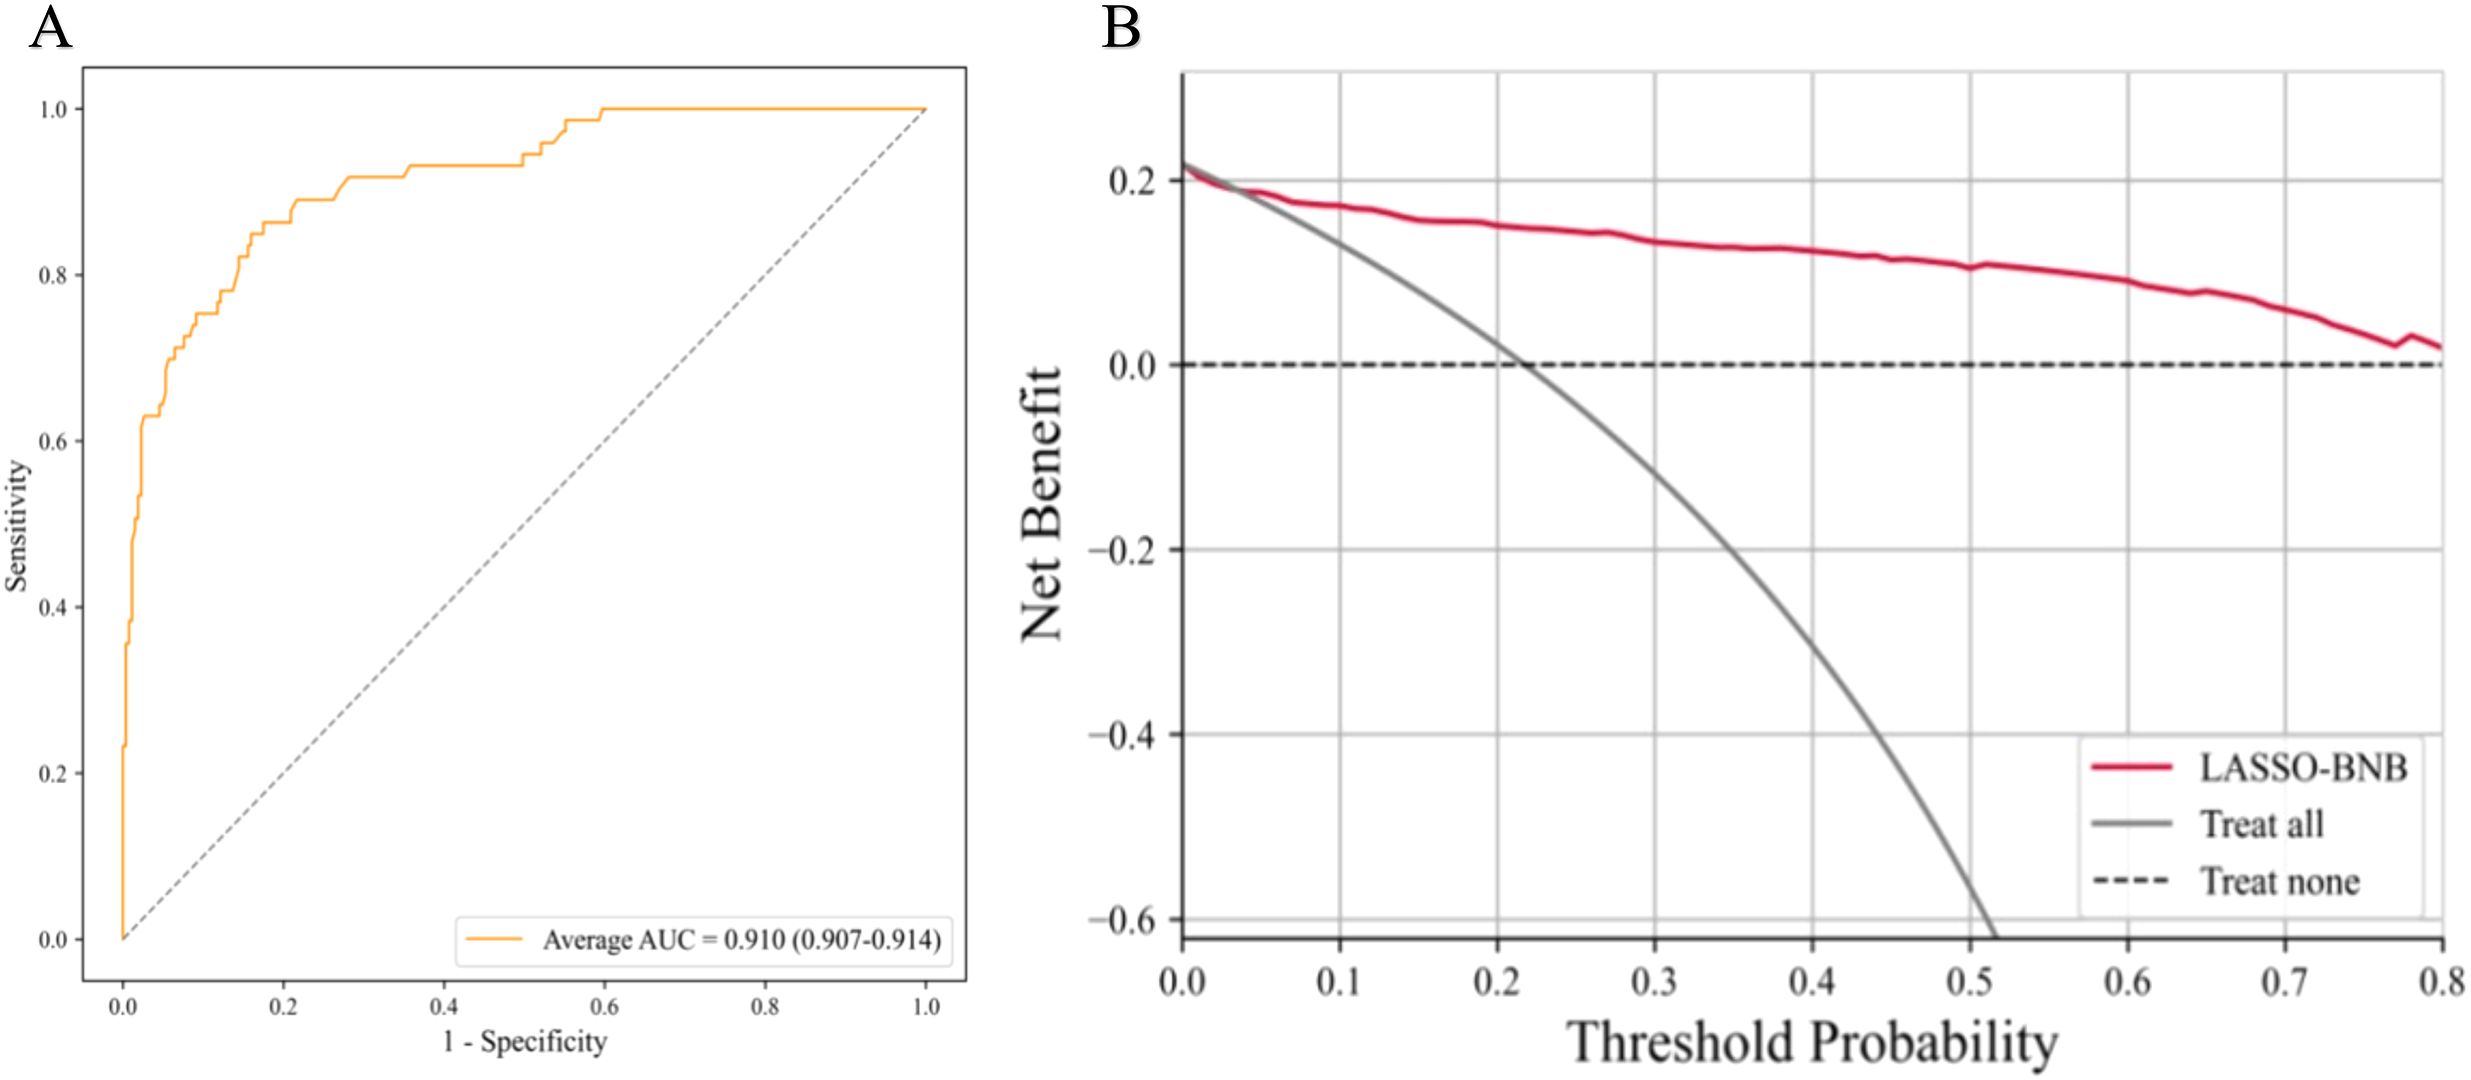
Figure 3. The best model for distinguishing benign and malignant parotid glands is LASSO-BNB. (A) The ROC analysis of radiomics and clinical model via the fivefold cross-validation. (B) The decision curve analysis of the best performance model. LASSO-BNB, Bernoulli naive Bayes modeling algorithm with least absolute shrinkage and selection operator feature selection method; ROC, receiver operating characteristic curve.
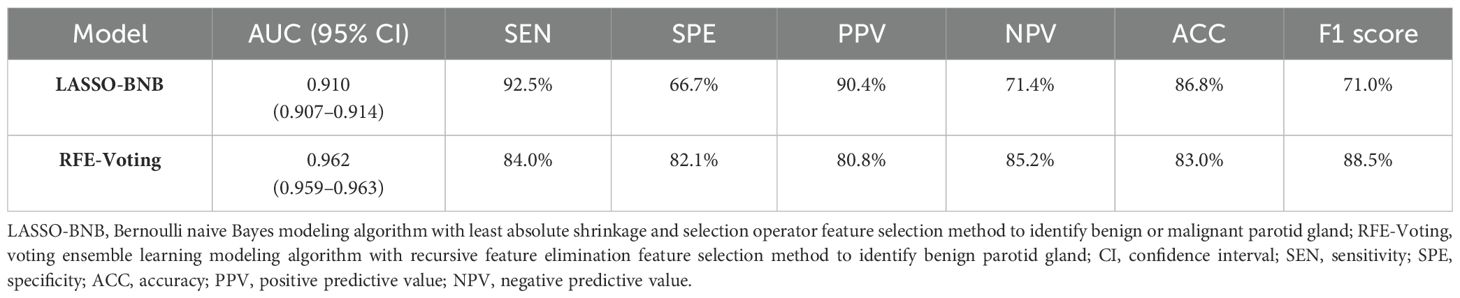
Table 3. Performance of two best models.
The ROC curve based on the best model for distinguishing benign and malignant parotid glands (LASSO-BNB model) is shown in Figure 3A. The ROC curve based on the best model for distinguishing benign parotid glands (RFE-Voting model) is shown in Figure 4A. The decision curve for evaluating the model is shown in Figure 3B and Figure 4B.
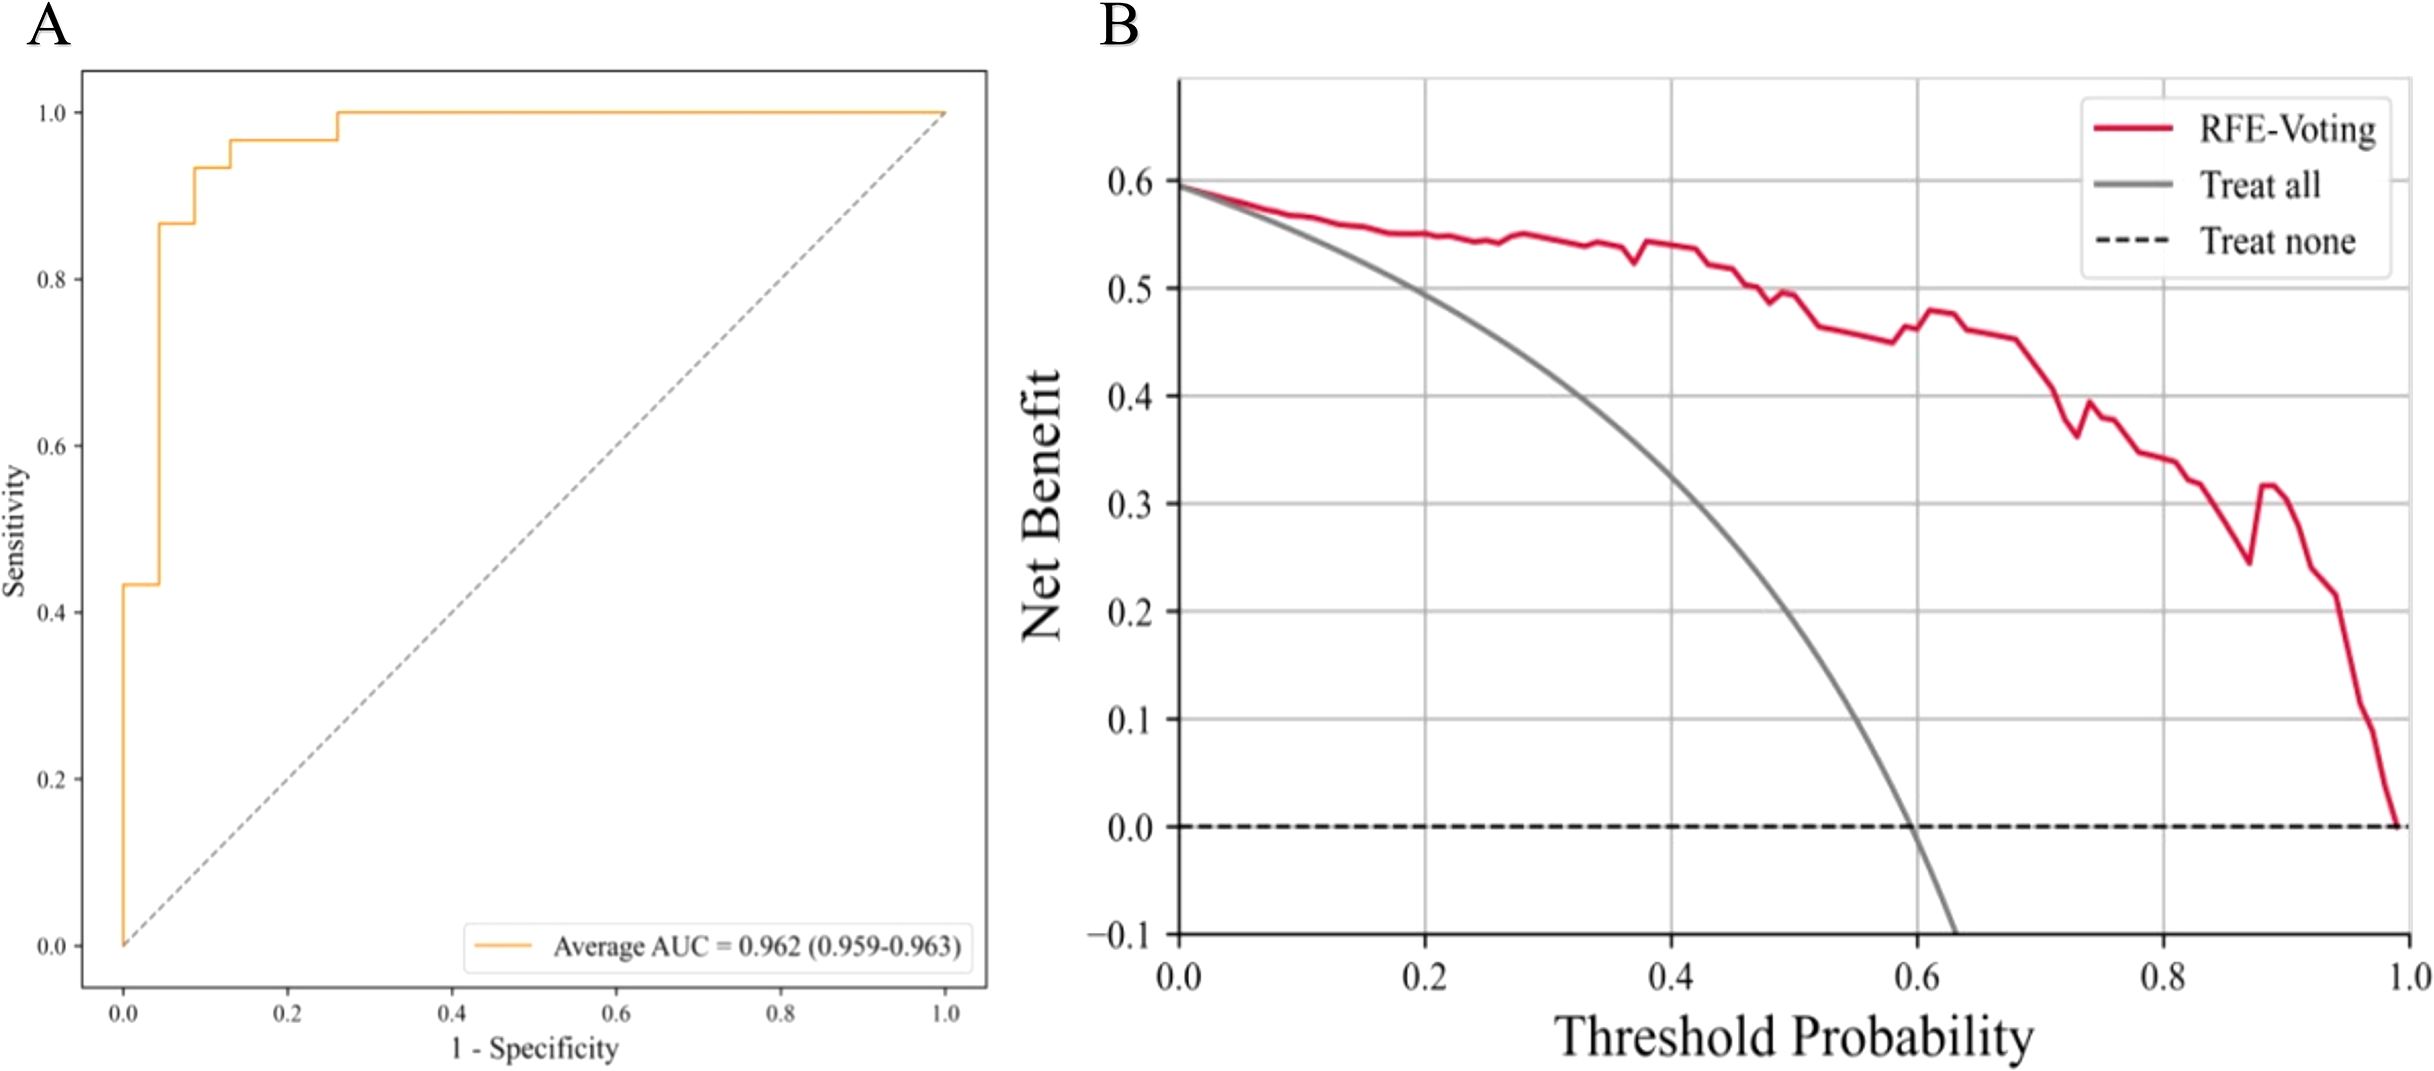
Figure 4. The best model for distinguishing benign parotid glands is RFE-Voting. (A) The ROC analysis of radiomics and clinical model via the fivefold cross-validation. (B) The decision curve analysis of the best performance model. RFE-Voting, voting ensemble learning modeling algorithm with recursive feature elimination feature selection method. The voting ensemble learning model consists of RFE-RF, RFE-ET, and RFE-HGBoost. RFE-RF, random forest modeling algorithm with recursive feature elimination feature selection method; RFE-ET, extremely randomized trees modeling algorithm with recursive feature elimination feature selection method; RFE-HGBoost, histogram-based gradient boosting modeling algorithm with recursive feature elimination feature selection method; ROC, receiver operating characteristic curve.
The accuracy (ACC) of experienced radiologists for distinguishing benign and malignant parotid glands was 61.9%, and for the diagnosis of PA and WT, it was 65.4%.
The tissue composition of parotid gland tumors is complex and lacks clinical symptoms and indicators. Imaging findings can provide some value (10–13), but in the actual operation process, it is susceptible to the subjective judgment and experience of doctors, thus affecting the diagnostic results. As the preferred examination method for parotid tumors, ultrasonography is widely used in the diagnosis of parotid diseases. With the development of some new technologies such as elastography and contrast-enhanced ultrasound, some useful information has been provided for the diagnosis of parotid tumors from the aspects of morphology and blood perfusion (14–17). However, the overlap of ultrasonographic features of benign and malignant parotid tumors and different pathological types of benign lesions leads to some controversy in its clinical application value (18). Ultrasound radiomics features reflect the heterogeneity of the tumor by reflecting the texture information of the tumor, which makes it possible to transform traditional images into image analysis that can mine high-dimensional data information. It can better quantify the lesion features that cannot be distinguished by the naked eye (19–21) and also reduces the subjectivity brought by the diagnostic doctor, which also provides ideas for the differential diagnosis of parotid tumors by ultrasonic image texture analysis.
The proportion of parotid malignant tumors is relatively small, and half of the lesions have no obvious clinical manifestations. Preoperative fine-needle aspiration cytology is considered to be a reliable method, but it is an invasive operation, and the number of cells taken out is limited, so it is not suitable for deep tumors. However, the malignant transformation rate of PA as a benign tumor is 2%–25%, and the recurrence rate after simple lesion resection is 15% (22). WT rarely has malignant transformation and recurrence. Clinically, conservative treatment or simple lesion enucleation can be used. Different tumors have different surgical methods and treatment methods. Therefore, preoperative non-invasive qualitative diagnosis is very important.
According to the literature, there is no report on the simultaneous identification of benign and malignant parotid tumors and PA and WT by ultrasound radiomics. In our study, we combined 474 radiomics features and 15 clinical features extracted from gray-scale ultrasound images and established 77 models after further screening. We observed and compared the diagnostic efficacy of each model. We obtained the best model LASSO-BNB for differentiating benign from malignant tumors. The AUC of the model reached 0.910, and the accuracy was 92.5%, which was much higher than that of clinical ultrasound physician diagnosis and previous conventional ultrasonographic feature analysis. The best model for differentiating benign PA from WT is RFE-Voting. The AUC of this model reached 0.962, and its accuracy was 83.0%. It shows that the radiomics analysis of gray-scale ultrasound images shows sufficient prediction efficiency in differential diagnosis, which provides more confidence for non-invasive diagnosis of parotid tumors before clinical surgery. Compared with the logistic regression conducted by other research (23), our LASSO-BNB model performance is basically the same (AUC: 0.910 vs. 0.914).
The present study has several limitations that require further consideration. First, this was a single-center study with a small sample size, so more center data should be collected in subsequent studies. Second, we only studied the two-dimensional ultrasound of the parotid gland. The multimodal analysis that should be included in subsequent studies may further improve the accuracy.
The dependence on the operator is inevitable, so all our model results were obtained using the method of fivefold cross-validation to find the average value, and the influence of random number seeds on the performance results of the model was reduced as much as possible. This method may be superior to the simple division of the training set and test set.
This two-step integrated model of ultrasound radiomics and clinical features has achieved outstanding performance in the three-category diagnosis of MT, PA, and WT. It is superior to skilled ultrasound diagnosticians and provides an effective diagnostic reference for clinical routine parotid tumor identification. This method may become a new non-invasive preoperative evaluation method for clinical application.
The original contributions presented in the study are included in the article/Supplementary Material. Further inquiries can be directed to the corresponding authors.
The studies involving humans were approved by Nanchong Central Hospital (review 2023-N0.023). The studies were conducted in accordance with the local legislation and institutional requirements. The study was approved by the Institutional Ethics Review Committee, which waived the requirement for informed consent. It involved only anonymous imaging datasets, and no individual patient data or human tissue samples were collected.
XL: Conceptualization, Data curation, Writing – original draft, Writing – review & editing. WX: Conceptualization, Writing – original draft, Writing – review & editing, Formal Analysis, Methodology. CY: Formal Analysis, Methodology, Writing – original draft, Data curation, Project administration, Validation. ZW: Data curation, Methodology, Project administration, Validation, Writing – original draft, Conceptualization, Resources. DT: Project administration, Resources, Writing – original draft, Visualization. GW: Supervision, Validation, Visualization, Writing – original draft, Writing – review & editing. XQ: Visualization, Writing – original draft, Writing – review & editing, Conceptualization, Data curation, Formal Analysis, Funding acquisition, Methodology, Resources.
The author(s) declare that no financial support was received for the research and/or publication of this article.
The authors declare that the research was conducted in the absence of any commercial or financial relationships that could be construed as a potential conflict of interest.
All claims expressed in this article are solely those of the authors and do not necessarily represent those of their affiliated organizations, or those of the publisher, the editors and the reviewers. Any product that may be evaluated in this article, or claim that may be made by its manufacturer, is not guaranteed or endorsed by the publisher.
The Supplementary Material for this article can be found online at: https://www.frontiersin.org/articles/10.3389/fonc.2025.1485393/full#supplementary-material
MSE: mean square error
MT: malignant tumor
PA: pleomorphic adenoma
WT: Warthin’s tumor
ROC: receiver operating characteristic
DCA: decision curve analysis
AUC: area under the curve
SVM: support vector machine
RF: random forest
LR: logistic regression
KNN: k-nearest neighbors
ET: extremely randomized trees
GNB: Gaussian naive Bayes
BNB: Bernoulli naive Bayes
HGBoost: histogram-based gradient boosting
GBDT: gradient boosted decision trees
AdaBoost: adaptive boosting
Voting: voting classifier
LASSO: least absolute shrinkage and selection operator
ANOVA: analysis of variance
MI: mutual information
RFE: recursive feature elimination
FS: forward selection
LASSO-BNB: Bernoulli naive Bayes modeling algorithm with least absolute shrinkage and selection operator feature selection method
RFE-Voting: voting ensemble learning modeling algorithm with recursive feature elimination feature selection method
RFE-RF: random forest modeling algorithm with recursive feature elimination feature selection method
RFE-ET: extremely randomized trees modeling algorithm with recursive feature elimination feature selection method
RFE-HGBoost: histogram-based gradient boosting modeling algorithm with recursive feature elimination feature selection method
CI: confidence interval
PPV: positive predictive value
NPV: negative predictive value
1. Bradley PJ, McGurk M. Incidence of salivary gland neoplasms in a defined UK population. Br J Oral Maxillofac Surg. (2013) 51:399–403. doi: 10.1016/j.bjoms.2012.10.002
2. Johnson F, Kloppenburg M, Hofauer B, Wollenberg B, Hoch CC, Stögbauer F, et al. Novel detection of pleomorphic adenomas via analysis of (68)Ga-DOTATOC PET/CT imaging. Cancers (Basel). (2024) 16:2624. doi: 10.3390/cancers16152624
3. Harb JL, Zaro C, Nassif SJ, Dhingra JK. Point-of-care ultrasound scan as the primary modality for evaluating parotid tumors. Laryngoscope Investig Otolaryngol. (2022) 7:1402–6. doi: 10.1002/lio2.v7.5
4. Lambin P, Rios-Velazquez E, Leijenaar R, Carvalho S, Van Stiphout RG, Granton P, et al. Radiomics: extracting more information from medical images using advanced feature analysis. Eur J Cancer. (2012) 48:441–6. doi: 10.1016/j.ejca.2011.11.036
5. Mukherjee S, Patra A, Khasawneh H, Korfiatis P, Rajamohan N, Suman G, et al. Radiomics-based machine-learning models can detect pancreatic cancer on prediagnostic computed tomography scans at a substantial lead time before clinical diagnosis. Gastroenterology. (2022) 163:1435–46.e3. doi: 10.1053/j.gastro.2022.06.066
6. Cao Y, Zhong X, Diao W, Mu J, Cheng Y, Jia Z. Radiomics in differentiated thyroid cancer and nodules: explorations, application, and limitations. Cancers (Basel). (2021) 13:2436. doi: 10.3390/cancers13102436
7. Li R, Li L, Xu Y, Yang J. Machine learning meets omics: applications and perspectives. Brief Bioinform. (2022) 23:bbab460. doi: 10.1093/bib/bbab460
8. Pan Z, Hu G, Zhu Z, Tan W, Han W, Zhou Z, et al. Predicting invasiveness of lung adenocarcinoma at chest CT with deep learning ternary classification models. Radiology. (2024) 311:e232057. doi: 10.1148/radiol.232057
9. Yan HJ, Zhao JS, Zuo HD, Zhang JJ, Deng ZQ, Yang C, et al. Dual-region computed tomography radiomics-based machine learning predicts subcarinal lymph node metastasis in patients with non-small cell lung cancer. Ann Surg Oncol. (2024) 31:5011–20. doi: 10.1245/s10434-024-15197-w
10. Yu Y, Zhang WB, Soh HY, Sun ZP, Yu GY, Peng X. Efficacy of computed tomography features in the differentiation of basal cell adenoma and Warthin tumor in the parotid gland. Oral Surg Oral Med Oral Pathol Oral Radiol. (2021) 132:589–96. doi: 10.1016/j.oooo.2020.12.022
11. Kamitani T, Sagiyama K, Togao O, Yamasaki Y, Hida T, Matsuura Y, et al. Amide proton transfer (APT) imaging of parotid tumors: Differentiation of Malignant and benign tumors. Eur J Radiol. (2020) 129:109047. doi: 10.1016/j.ejrad.2020.109047
12. Yamamoto T, Kimura H, Hayashi K, Imamura Y, Mori M. Pseudo-continuous arterial spin labeling MR images in Warthin tumors and pleomorphic adenomas of the parotid gland: qualitative and quantitative analyses and their correlation with histopathologic and DWI and dynamic contrast enhanced MRI findings. Neuroradiology. (2018) 60:803–12. doi: 10.1007/s00234-018-2046-9
13. Masmoudi M, Hasnaoui M, Guizani R, Lahmar R, Jerbi S, Mighri K. Performance of the magnetic resonance imaging in parotid gland tumor histopathology. Pan Afr Med J. (2021) 39:10. doi: 10.11604/pamj.2021.39.10.27813
14. Mansour N, Stock KF, Chaker A, Bas M, Knopf A. Evaluation of parotid gland lesions with standard ultrasound, color duplex sonography, sonoelastography, and acoustic radiation force impulse imaging - a pilot study. Ultraschall Med. (2012) 33:283–8. doi: 10.1055/s-0031-1299130
15. Yerli H, Eşki E. Sonoelastography, B-mode sonography, and color Doppler sonography findings of pleomorphic adenomas and Warthin tumors of parotid gland. Kulak Burun Bogaz Ihtis Derg. (2015) 25:329–36. doi: 10.5606/kbbihtisas.2015.78861
16. Saito D, Shiga K, Katagiri K, Oikawa S, Ikeda A, Tsuchida K, et al. Contrast-enhanced ultrasonography for the differential diagnosis of pleomorphic adenomas and Warthin tumors in salivary glands. Laryngoscope Investig Otolaryngol. (2021) 6:425–31. doi: 10.1002/lio2.v6.3
17. Xia F, Qin W, Feng J, Zhou X, Sun E, Xu J, et al. Differential diagnostic value of tumor morphology, long/short diameter ratio, and ultrasound gray-scale ratio for 3 parotid neoplasms. Oral Surg Oral Med Oral Pathol Oral Radiol. (2022) 134:484–91. doi: 10.1016/j.oooo.2022.05.012
18. Ryoo I, Suh S, Lee YH, Seo HS, Seol HY, Woo JS, et al. Vascular pattern analysis on microvascular sonography for differentiation of pleomorphic adenomas and warthin tumors of salivary glands. J Ultrasound Med. (2018) 37:613–20. doi: 10.1002/jum.14368
19. Ma X, Wei J, Gu D, Zhu Y, Feng B, Liang M, et al. Preoperative radiomics nomogram for microvascular invasion prediction in hepatocellular carcinoma using contrast-enhanced CT. Eur Radiol. (2019) 29:3595–605. doi: 10.1007/s00330-018-5985-y
20. Xu X, Zhang HL, Liu QP, Sun SW, Zhang J, Zhu FP, et al. Radiomic analysis of contrast-enhanced CT predicts microvascular invasion and outcome in hepatocellular carcinoma. J Hepatol. (2019) 70:1133–44. doi: 10.1016/j.jhep.2019.02.023
21. Yang L, Gu D, Wei J, Yang C, Rao S, Wang W, et al. A radiomics nomogram for preoperative prediction of microvascular invasion in hepatocellular carcinoma. Liver Cancer. (2019) 8:373–86. doi: 10.1159/000494099
22. Rong X, Zhu Q, Ji H, Li J, Huang H. Differentiation of pleomorphic adenoma and Warthin’s tumor of the parotid gland: ultrasonographic features. Acta Radiol. (2014) 55:1203–9. doi: 10.1177/0284185113515865
Keywords: parotid gland tumors, pleomorphic adenoma, Warthin’s tumor, ultrasound radiomics, classification diagnosis
Citation: Liu X, Xiao W, Yang C, Wang Z, Tian D, Wang G and Qin X (2025) Diagnosis of parotid gland tumors using a ternary classification model based on ultrasound radiomics. Front. Oncol. 15:1485393. doi: 10.3389/fonc.2025.1485393
Received: 23 August 2024; Accepted: 20 February 2025;
Published: 21 March 2025.
Edited by:
Abhishek Mahajan, The Clatterbridge Cancer Centre, United KingdomReviewed by:
Palash Ghosal, Sikkim Manipal University, IndiaCopyright © 2025 Liu, Xiao, Yang, Wang, Tian, Wang and Qin. This is an open-access article distributed under the terms of the Creative Commons Attribution License (CC BY). The use, distribution or reproduction in other forums is permitted, provided the original author(s) and the copyright owner(s) are credited and that the original publication in this journal is cited, in accordance with accepted academic practice. No use, distribution or reproduction is permitted which does not comply with these terms.
*Correspondence: Xiachuan Qin, MTEzMjY2MzZAcXEuY29t; Gang Wang, OTk3NTg1NTYxQHFxLmNvbQ==; Dong Tian, MjJ0aWFuZG9uZ0AxNjMuY29t
†These authors have contributed equally to this work
Disclaimer: All claims expressed in this article are solely those of the authors and do not necessarily represent those of their affiliated organizations, or those of the publisher, the editors and the reviewers. Any product that may be evaluated in this article or claim that may be made by its manufacturer is not guaranteed or endorsed by the publisher.
Research integrity at Frontiers
Learn more about the work of our research integrity team to safeguard the quality of each article we publish.