 Dongshen Ma1†
 Yuqing Yuan1†
 Xiaodan Miao1†
 Ying Gu1Yubo Wang1Dan Luo1Meiting Fan1
 Xiaoli Shi2Shuxue Xi2
 Binbin Ji2
 Chenxi Xiang1
 Hui Liu1,3*
- 1Department of Pathology, The Affiliated Hospital of Xuzhou Medical University, Xuzhou, China
- 2Department of Sciences, Geneis Beijing Co., Ltd., Beijing, China
- 3Department of Pathology, Xuzhou Medical University, Xuzhou, China
Introduction: Diffuse large B-cell lymphoma (DLBCL) is the most common type of non-Hodgkin lymphoma (NHL) in humans, and it is a highly heterogeneous malignancy with a 40% to 50% risk of relapsed or refractory (R/R), leading to a poor prognosis. So early prediction of R/R risk is of great significance for adjusting treatments and improving the prognosis of patients.
Methods: We collected clinical information and H&E images of 227 patients diagnosed with DLBCL in Xuzhou Medical University Affiliated Hospital from 2015 to 2018. Patients were then divided into R/R group and non-relapsed & non-refractory group based on clinical diagnosis, and the two groups were randomly assigned to the training set, validation set and test set in a ratio of 7:1:2. We developed a model to predict the R/R risk of patients based on clinical features utilizing the random forest algorithm. Additionally, a prediction model based on histopathological images was constructed using CLAM, a weakly supervised learning method after extracting image features with convolutional networks. To improve the prediction performance, we further integrated image features and clinical information for fusion modeling.
Results: The average area under the ROC curve value of the fusion model was 0.71±0.07 in the validation dataset and 0.70±0.04 in the test dataset. This study proposed a novel method for predicting the R/R risk of DLBCL based on H&E images and clinical features.
Discussion: For patients predicted to have high risk, follow-up monitoring can be intensified, and treatment plans can be adjusted promptly.
1 Introduction
Diffuse large B-cell lymphoma (DLBCL) is a highly heterogeneous malignancy, and the most common type of non-Hodgkin’s lymphoma (NHL) in humans (1, 2). Although the standard first-line treatment regimens such as R-CHOP (rituximab, cyclophosphamide, doxorubicin, vincristine, and prednisone) can cure 50% to 60% of patients, 40% to 50% of patients still experience primary refractory diseases or relapse in short period of time (3–8). Among patients with R/R disease, 15% to 25% experience disease progression during or after treatment (primary refractory disease), 20% to 30% relapse after achieving complete remission (CR), and approximately 5% experience disease progression after achieving partial remission (PR). Compared with non-relapsed and non-refractory patients, those with R/R disease have significantly worse prognoses (9). If the prognosis of patients can be assessed timely and accurately, and the treatment plan can be adjusted accordingly, the survival period of patients can be prolonged. Therefore, developing convenient and accurate prognostic evaluation methods for early risk prediction is of great significance in formulating personalized treatment strategies and improving patient prognosis. For high-risk patients, salvage treatments such as intensified induction therapy and autologous stem cell transplantation (ASCT) can be considered to improve treatment efficacy and patient survival rates (10, 11). On the other hand, after early detection of high-risk patients, more intensive monitoring and follow-up, as well as more aggressive therapeutic interventions, can be implemented, ensuring more rational and effective utilization of medical resources.
Nowadays, the prognosis of R/R DLBCL is far from reaching satisfaction even with salvage treatments (12). The main reason for patients developing R/R diseases is chemotherapy resistance to current R-CHOP treatment, which is associated with activated B-cell-like (ABC) cell-of-origin, aggressive genetic abnormalities, or an inhibitory tumor microenvironment (13). R/R DLBCLs often exhibit reduced sensitivity to a wide range of chemotherapy-based second-line regimens due to cross-resistance (14, 15), which also contributes to the poorer outcome of ASCT therapy (16, 17). Among patients receiving second-line intensive treatment, only 27% showed a response and received ASCT, with a median overall survival of only 10 months (18). Although patients who received salvage ASCT followed by chemotherapy could achieve a longer remission, the significant toxic effects of high-dose chemotherapy limited further treatment of elderly patients and those with complications (19). Furthermore, a multi-center study has demonstrated that the administration of rituximab prior to salvage therapy constitutes an adverse prognostic factor (20). If R/R patients are identified at an early stage and receive personalized treatment, such as proactive CAR-T cell therapy, it may provide a significant opportunity to improve the prognosis of this group (21). Therefore, early identification of potential R/R patients after diagnosis is crucial for selecting an intensive treatment regimen.
Currently, several biomarkers based on genetic aberrations or pathological factors have been utilized to predict the prognosis or risk of R/R disease, including MYC/BCL2 rearrangement, cell-of-origin (COO) classification, or the international prognostic index (IPI) (13). It has been reported that more intensive regimens may be warranted in double-hit patients with higher stage and high IPI, which may lead to improved outcomes (22). Moreover, novel prognostic evaluation models have been studied considering more indicators such as PET-CT findings, liver function tests, serum albumin levels, and peripheral blood cell counts (23–25). However, there is currently no model for predicting the risk of R/R disease of DLBCL patients based on H&E pathological images, nor is there a model that combines clinical features, molecular pathological features, laboratory test results, and pathological images for predicting the prognosis of DLBCL. Hematoxylin and eosin (H&E) staining is one of the commonly used staining techniques in pathology. It has been reported that nuclear morphological features extracted from H&E images provided valuable prognostic information in various malignancies (26, 27). With the advancement of artificial intelligence in the field of image recognition, computer-aided diagnosis and prognosis prediction based on ultrasound images, CT images, and H&E images have been implemented in the medical field (28). In particular, because the analysis of pathological findings only utilizes retrospective information generated during routine diagnosis, it has the advantages of being timesaving, non-invasive, and low-cost (29).
In this study, we proposed a combined deep learning model to predict the R/R risk of DLBCL patients based on clinicopathological features, laboratory test results, and whole slide H&E images. The average area under the ROC curve (AUROC) of the fusion model reached 0.71 ± 0.07 in the validation dataset and the mean AUROC was 0.70 ± 0.04 in the test set.
2 Materials and methods
2.1 Clinical data collection and preparation
We collected clinical information and H&E stained whole slide images (WSI) of patients diagnosed with DLBCL in Affiliated Hospital of Xuzhou Medical University from 2015 to 2018. All patients’ diagnoses complied with the 2016 revision of the World Health Organization classification of lymphoid neoplasms (30).
The inclusion criteria were defined as follows: patients with a confirmed diagnosis of DLBCL through biopsy; patients had complete clinical and follow-up information, as well as histological specimens. Exclusion criteria included: Cases involving transformation of other lymphoma types into DLBCL; Consultation cases, puncture specimens, etc. without wax blocks or with insufficient remaining wax block tissue, as well as cases with insufficient tumor cell content; patients with incomplete clinical information or with follow-up duration less than 36 months after completion of treatment; patients with other malignant tumors; patients with severe cognitive impairment, communication disorders, or mental illnesses. All patients underwent pathological examination, with H&E samples sourced exclusively from surgical biopsies. The detailed de-identified clinical information and H&E images were transferred to the investigators. The follow-up time of DLBCL patients in the TCGA database is relatively short and the clinical information is not comprehensive enough to determine the R/R status, so the data in the TCGA database is not included in this study.
In selecting clinical variables, we initially extracted clinical information of anonymized patients from the hospital system. Subsequently, we incorporated specific domain knowledge and insights from experts in this field, collaborating with lymphoma specialists to determine the variables to be included. This process primarily involved excluding outcome variables such as treatment response, time to first progression, and recurrence status. Furthermore, we converted some continuous variables into categorical variables based on clinical significance, for instance, converting the numerical value of white blood cell count into categories of normal, decreased, and increased white blood cell count. This ensured that our variable selection was not only statistically reasonable but also biologically or practically meaningful. Next, variables with missing values exceeding one-third were excluded. For categorical variables with missing values below one-third, we used the mode for imputation, while for continuous variables with missing values below one-third, the median was employed. Multicategory variables were subjected to One-Hot Encoding for processing.
2.2 Image acquisition and preprocessing
For patients enrolled in this study, we first collected high-resolution images (20X) of the H&E stained WSI. Since each tissue sample is prepared on a pathological glass slide, the WSI consists of tissue and white background, which is the glass surface of the pathology slide. Therefore, it is essential to automatically identify the tissue area in the WSI. For each WSI, RGB was converted to HSV to facilitate division of the tissue area and white background according to the specified color threshold (threshold=35) and unnecessary white backgrounds were not included in further processing (31). To ensure the predicted effect, we performed image smoothing on the binarization mask of the tissue region: 1). The median value of gray scale was used for filtering, which can not only remove noise but also effectively retain the edge information of the tissue, to relatively reduce the blur degree of the image. 2). Morphological opening operation was performed to remove small gaps and holes by first etching and then expanding. After that, we split the tissue area into small patches of 512 × 512 pixels and stored the coordinates of patches and WSI metadata information in hdf5 format.
We used convolutional networks to extract low-dimensional and high-order semantic features of each patch. Then, we extracted pathological features from the first 3 residual blocks of ImageNet pre-trained ResNet18 and each patch was mapped to a 1x256 feature vector (32).
2.3 Definitions
We divided the patients into two groups according to their response to treatment: 118 patients with R/R DLBCL were marked as 1, and 109 patients with non-relapsed & non-refractory DLBCL were marked as 0. Patients with relapsed DLBCL were defined as those who achieved CR after 2 or more cycles of first-line chemotherapy and relapsed after at least one month of discontinuation after 6-8 cycles of treatment. Patients with refractory DLBCL refer to those who have not achieved remission at any time during treatment, or whose disease progression is less than 1 month after achieving PR during the treatment process, or who have relapsed within 1 month after achieving CR (33).
2.4 Model construction
The dataset was divided into 70% training set, 10% validation set, and 20% testing set. The training set was used for neural network model fitting, and the test set was used to evaluate the final model. We conducted 10 repeat trials to minimize random errors.
In the process of modeling based on images, to obtain slide-level features, our method is similar to CLAM - a weak supervised method based on deep learning, which uses attention-based learning to automatically identify sub-regions with high diagnostic value, in order to accurately classify the whole slide (32, 34–36). CLAM is based on a multi-instance learning (MIL) framework-a weak supervised learning task and framework. It regards each WSI (called a “bag”) as composed of many (up to hundreds of thousands) smaller areas or patches (called “instances”). In our study, each patient has a WSI, given a bag represent patient data, which contains 256-dimensional instances (patches). We first compress each 256-dimensional patch-level through two MLP—the MLP includes a fully connected layer, a ReLU layer, and a dropout layer— to a 128-dimensional vector . The first two layers of the attention network and collectively are considered as the attention backbone shared by all classes, and is the weight parameter of the attention module, the attention score Ai of the ith patch is given by . Then, the slide-level feature is given by .
While in the process of constructing prediction models based on clinicopathologic variables, we applied the feature importance attribute of random forest (RF) to select the important features including age, gender, tumor stage, COO, LDH, et al. (37, 38). Then, we chose features that have scores to train the model.
In the process of fusion modeling, we used the compact bilinear pooling (CBP) (39) method to fusion image features and clinicopathologic features. The clinicopathologic features were put into a multilayer perceptron (MLP) to embed vector and then were fused with image features using CBP. The fused features were fed into the final classification layer to obtain the final prediction result. The whole process of fusion modeling was shown in Figure 1.
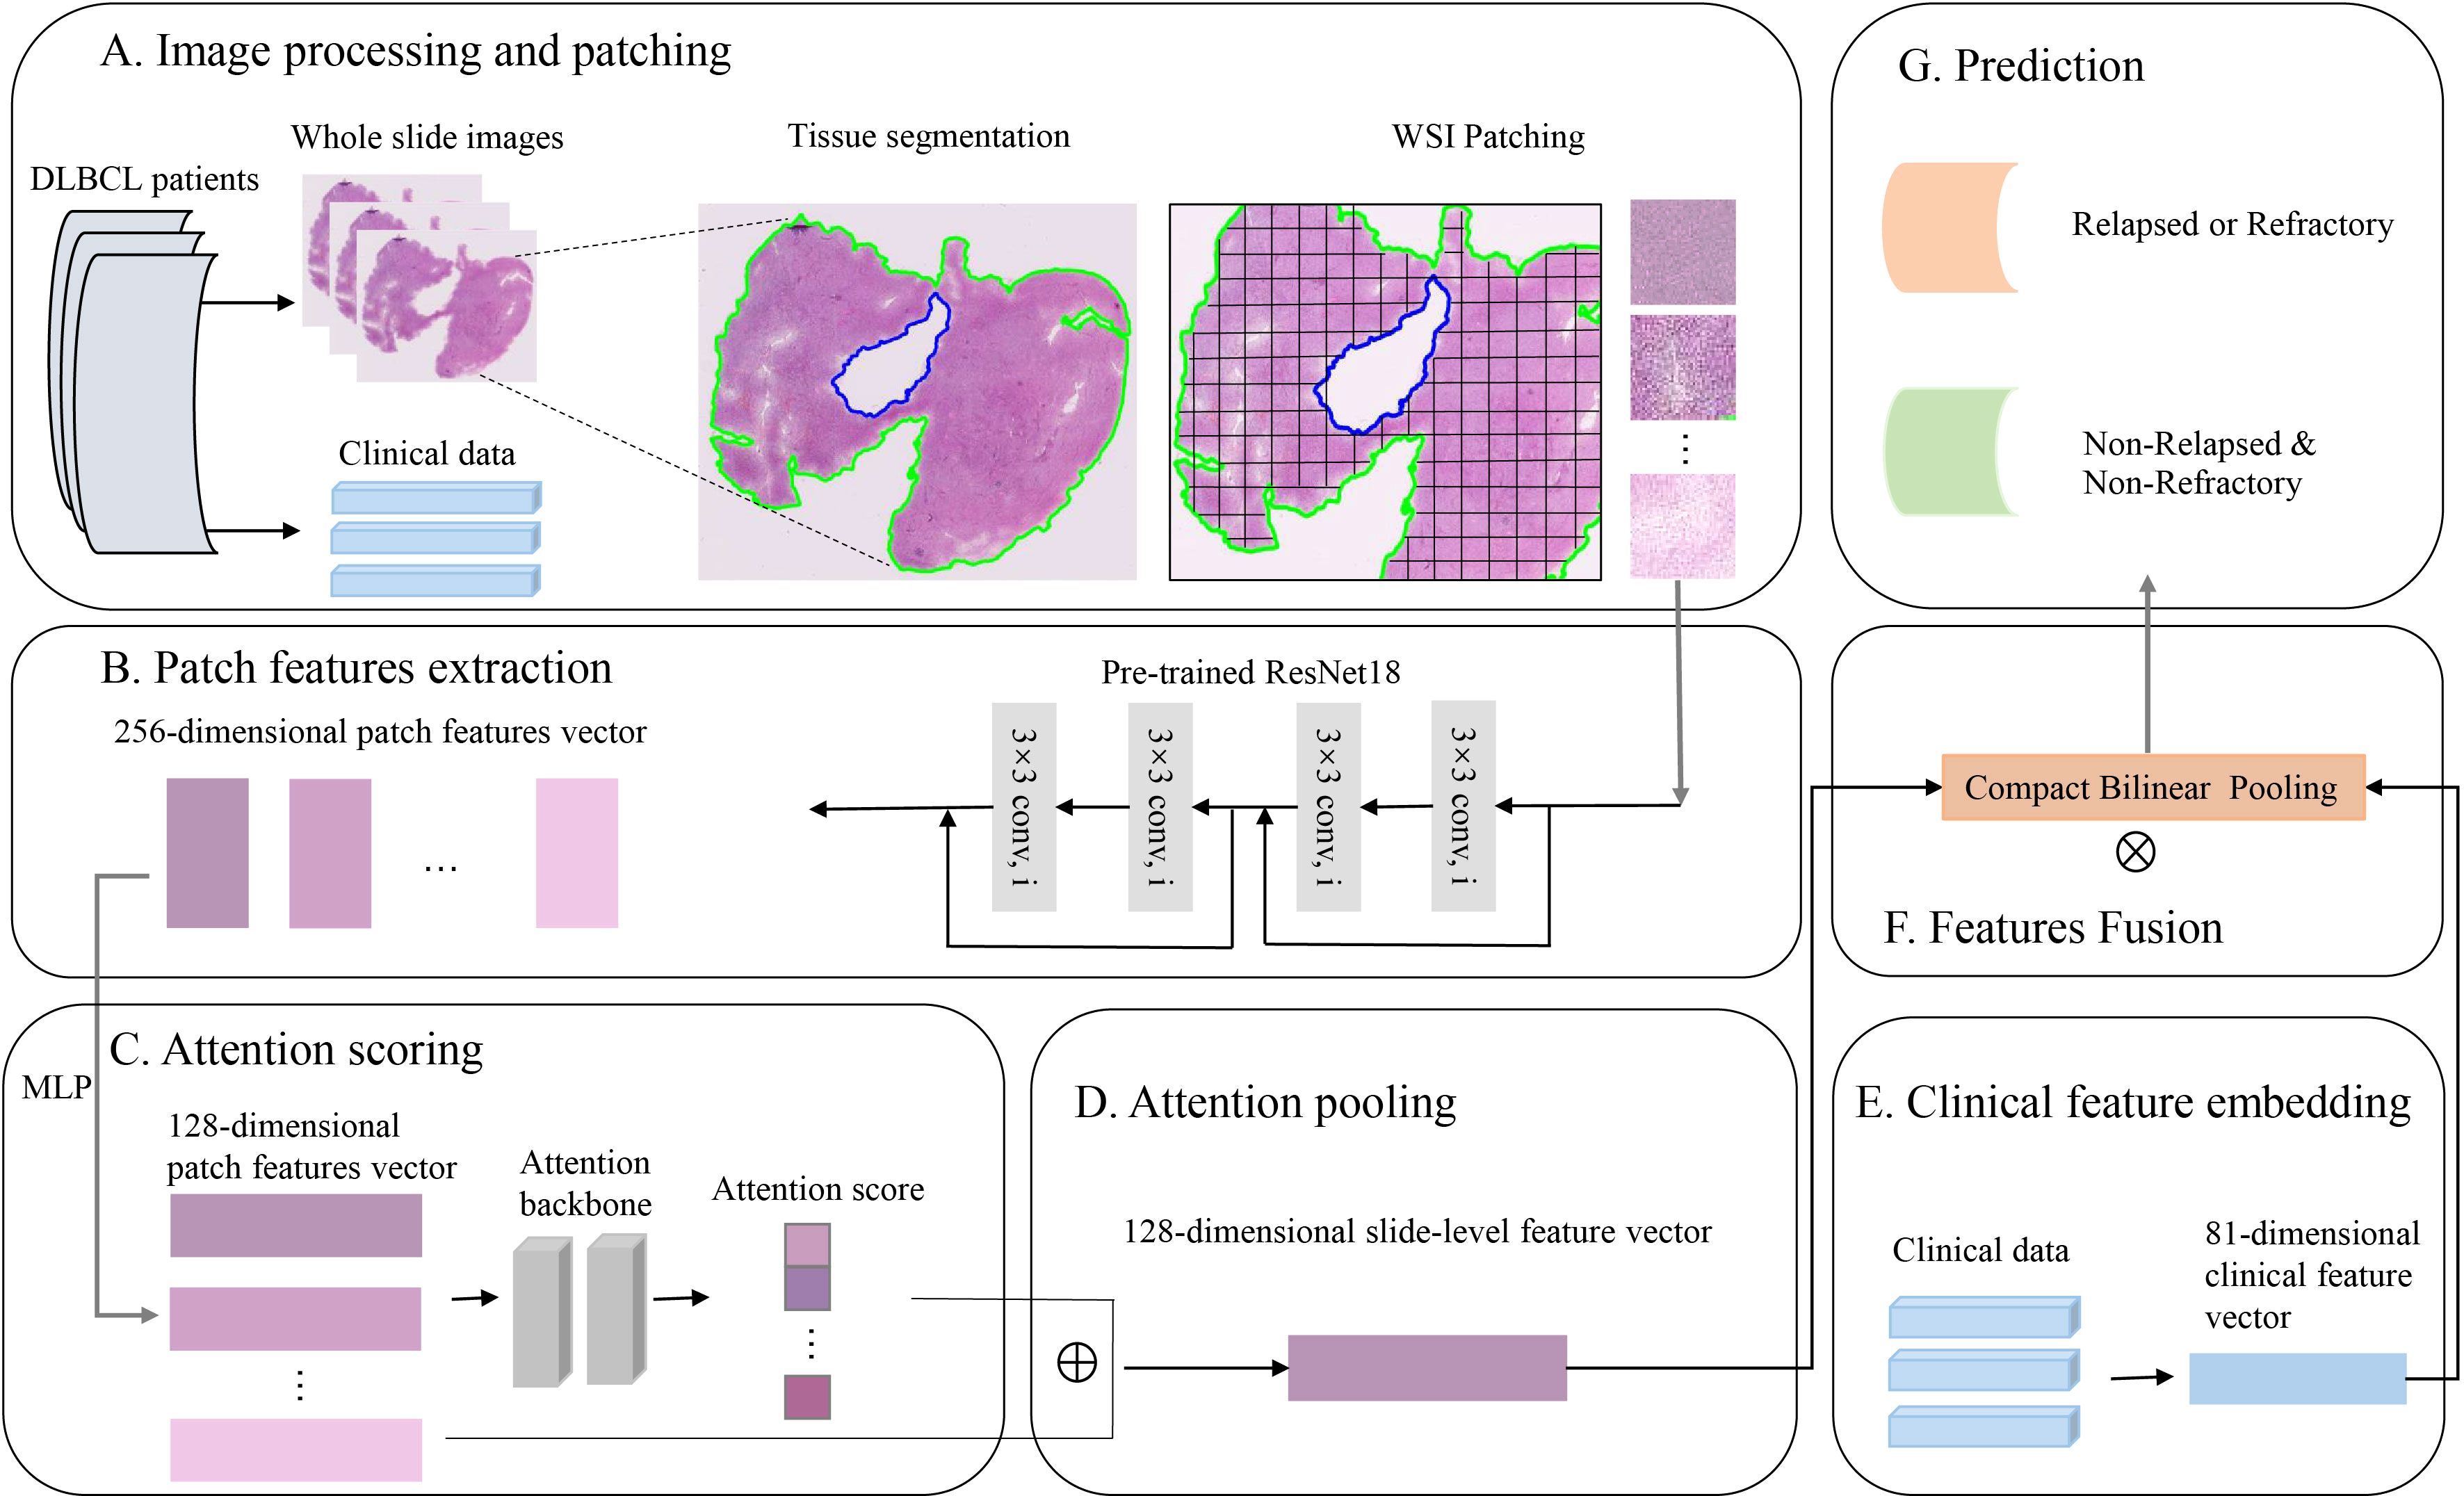
Figure 1. The process of fusion modeling. (A) H&E images preprocessing and patching. (B) Patch feature extraction using convolutional networks. (C, D) Attention scoring and pooling of images. (E) Clinicopathologic feature extraction and embedding. (F) Features fusion using compact bilinear pooling. (G) Construct a deep learning model to predict the relapsed or refractory status of patients with diffuse large B-cell lymphoma.
2.5 Model interpretability
To explain the importance of different tissue regions in predicting the final slide level, we used an attention mechanism to calculate and save the attention scores of all patches extracted from the slides. These attention scores were normalized between 0 and 1 from low to high attention. These normalized scores were converted into RGB color using the divergent color map, and mapped to the corresponding position in the original pathological image according to the coordinate for visual recognition and interpretation. The high attention areas displayed in red (which contribute significantly to model prediction compared to other patches) and the low attention areas displayed in blue (which contribute less to model prediction compared to other patches).
To quantify the distribution of the cell densities across cohort, we used a Hover Net model, which was trained on the PanNuke dataset (a dataset containing 19 different types of cancer tissues), to perform nuclear segmentation annotation on five types of cells in WSIs, containing Neoplastic, Inflammatory, Connective, Dead, and Non-Neoplastic Epithelial cells. Then we calculated the cell density of these H&E images (40).
2.6 Statistical analysis
We used the “sklearn” library for python to compute metrics such as AUROC (41), accuracy, recall and F1 score for quantitatively evaluating the performance of the classifier. In order to deeply investigate the influence of clinicopathological characteristics on patients’ survival, we used the “survival” and “survminer” packages in R to conduct analyses. The survival outcomes between subgroups with different clinicopathological characteristics were assessed by Kaplan-Meier (KM) survival analysis and log-rank test.
3 Results
3.1 Baseline characteristics of the DLBCL patients in this study
In this study, we collected 227 patients diagnosed with DLBCL in Affiliated Hospital of Xuzhou Medical University from 2015 to 2018 with median follow-up 45.5 month. All patients had complete follow-up information and H&E pathological images (Table 1). All patients received chemotherapy, and none of the patients received hematopoietic cell transplantation as second-line therapy. Among them, 53.74% of patients were male, and 52.87% of the patients were older than 60 years old. 59.91% of the patients were in stage I-II when diagnosed. The chemotherapy received by the patients included CHOP-like (57.27%), CVAD-like (7.05%), MTX based (4.41%) or EPOCH-like (20.70%) regimens and 45.37% of the patients received rituximab during first-line treatment, and 44.05% of the patients achieved remission, including 26.43% showed CR and 17.62% showed PR. 80.18% of the patients had 1 or more extranodal extension sites, and 40.97% of patients had a survival period of less than 3 years. Among these DLBCL patients, 118 cases (51.98%) were determined to be R/R according to the guidelines for the diagnosis and treatment of DLBCL, among which, 47 were refractory (20.70%) and 71 were relapsed (31.3%).
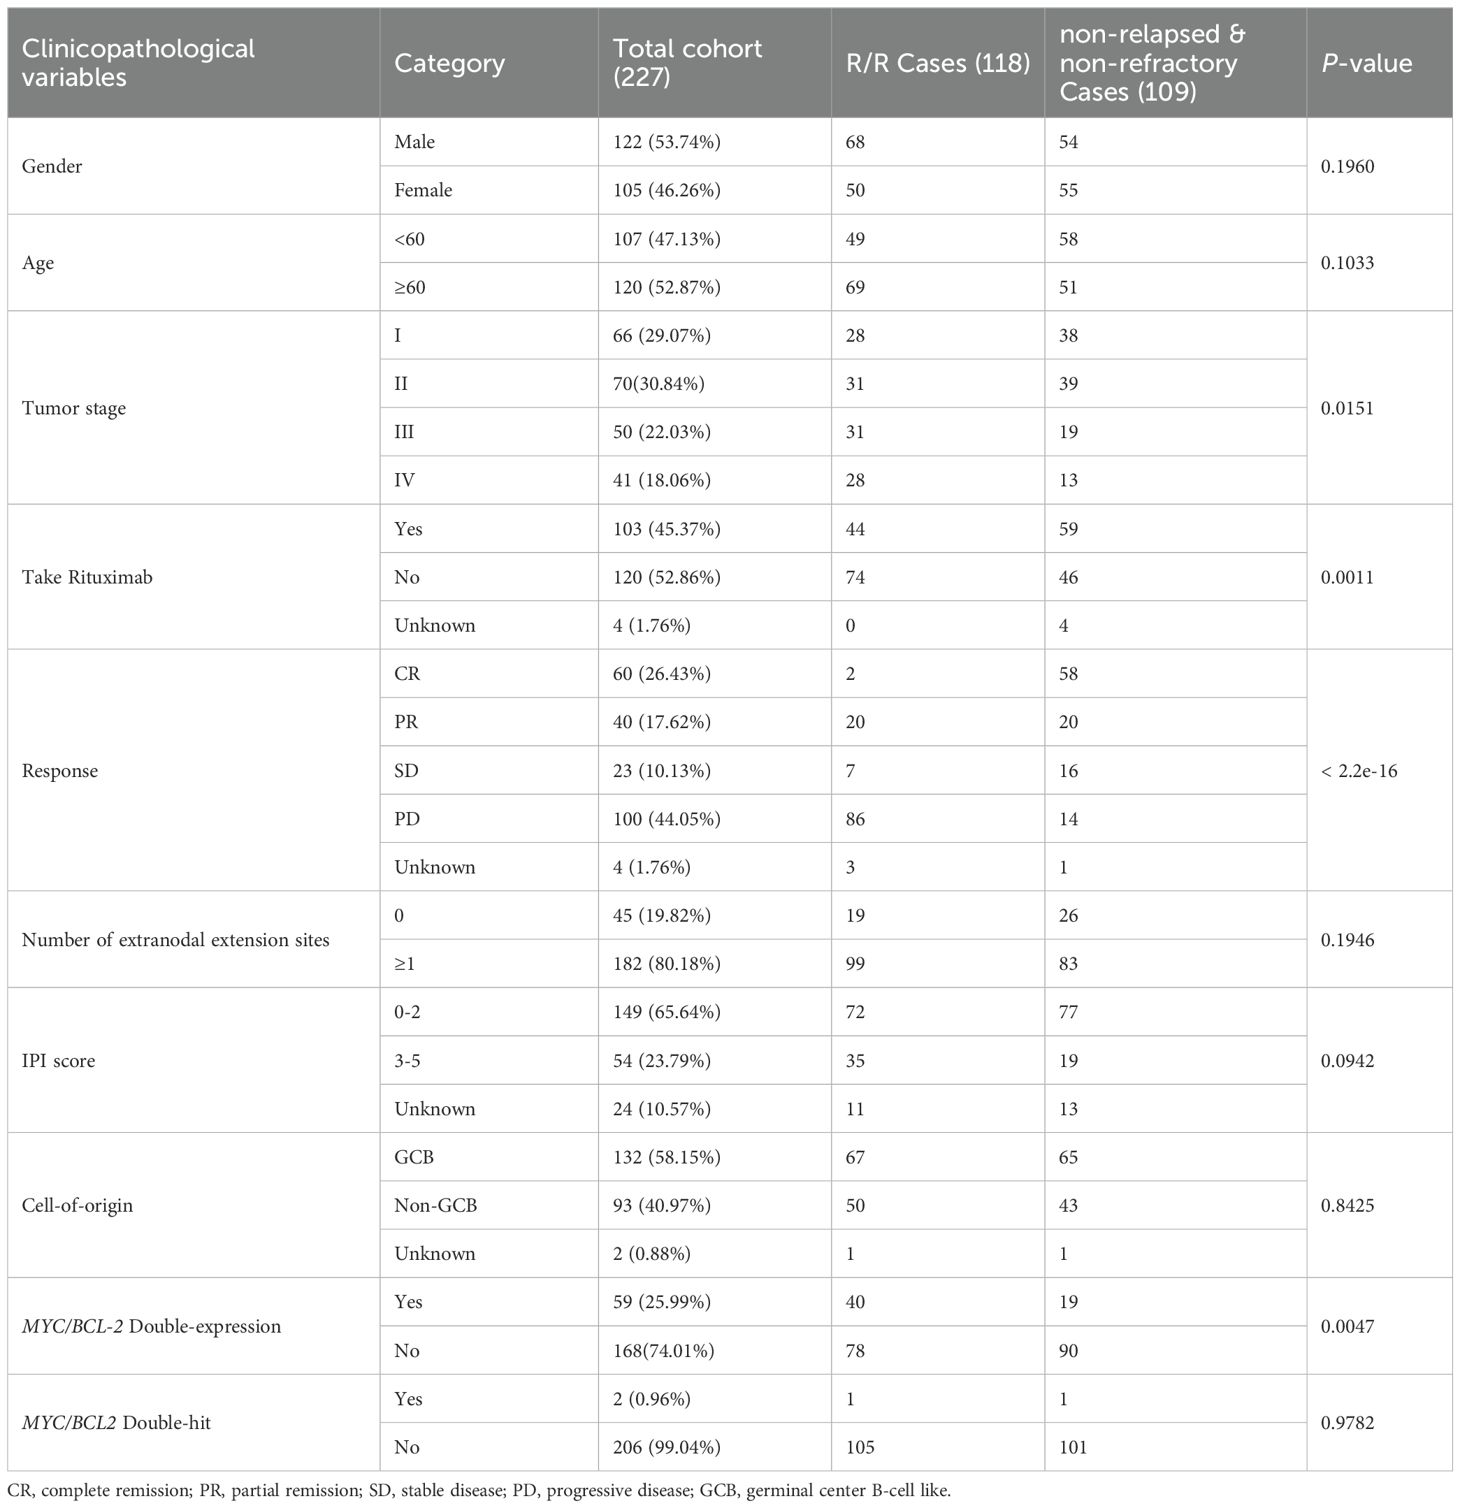
Table 1. Basic information of DLBCL patients.
3.2 The performance of the model based on clinical information is superior to that of using H&E images
We marked R/R DLBCL patients as positive samples and non-relapsed & non-refractory DLBCL patients as negative samples, and then divided the two groups of patients into training sets, validation sets, and test sets at 7:1:2, respectively. During the H&E image modeling and clinical information modeling process, the patients used for model training were consistent. When we constructed model with H&E pathological images alone, the average AUROC of the model was 0.65 ± 0.12 (Figure 2A) in the validation dataset, and the average AUROC was 0.65 ± 0.08 in the test dataset (Figure 2B). We used the features importance attribute of RF to screen clinical and molecular pathological information and then selected features that have scores to construct a model using the RF algorithm. Finally, a total of 42 features were selected. After 10 rounds of modeling, in the validation dataset, the AUROC of the model was 0.70 ± 0.10 (Figure 2C), the average AUROC of the model was 0.67 ± 0.07 (Figure 2D) in the test dataset. As can be seen, the performance of the model based on clinical and molecular pathological information is superior to that using H&E images.
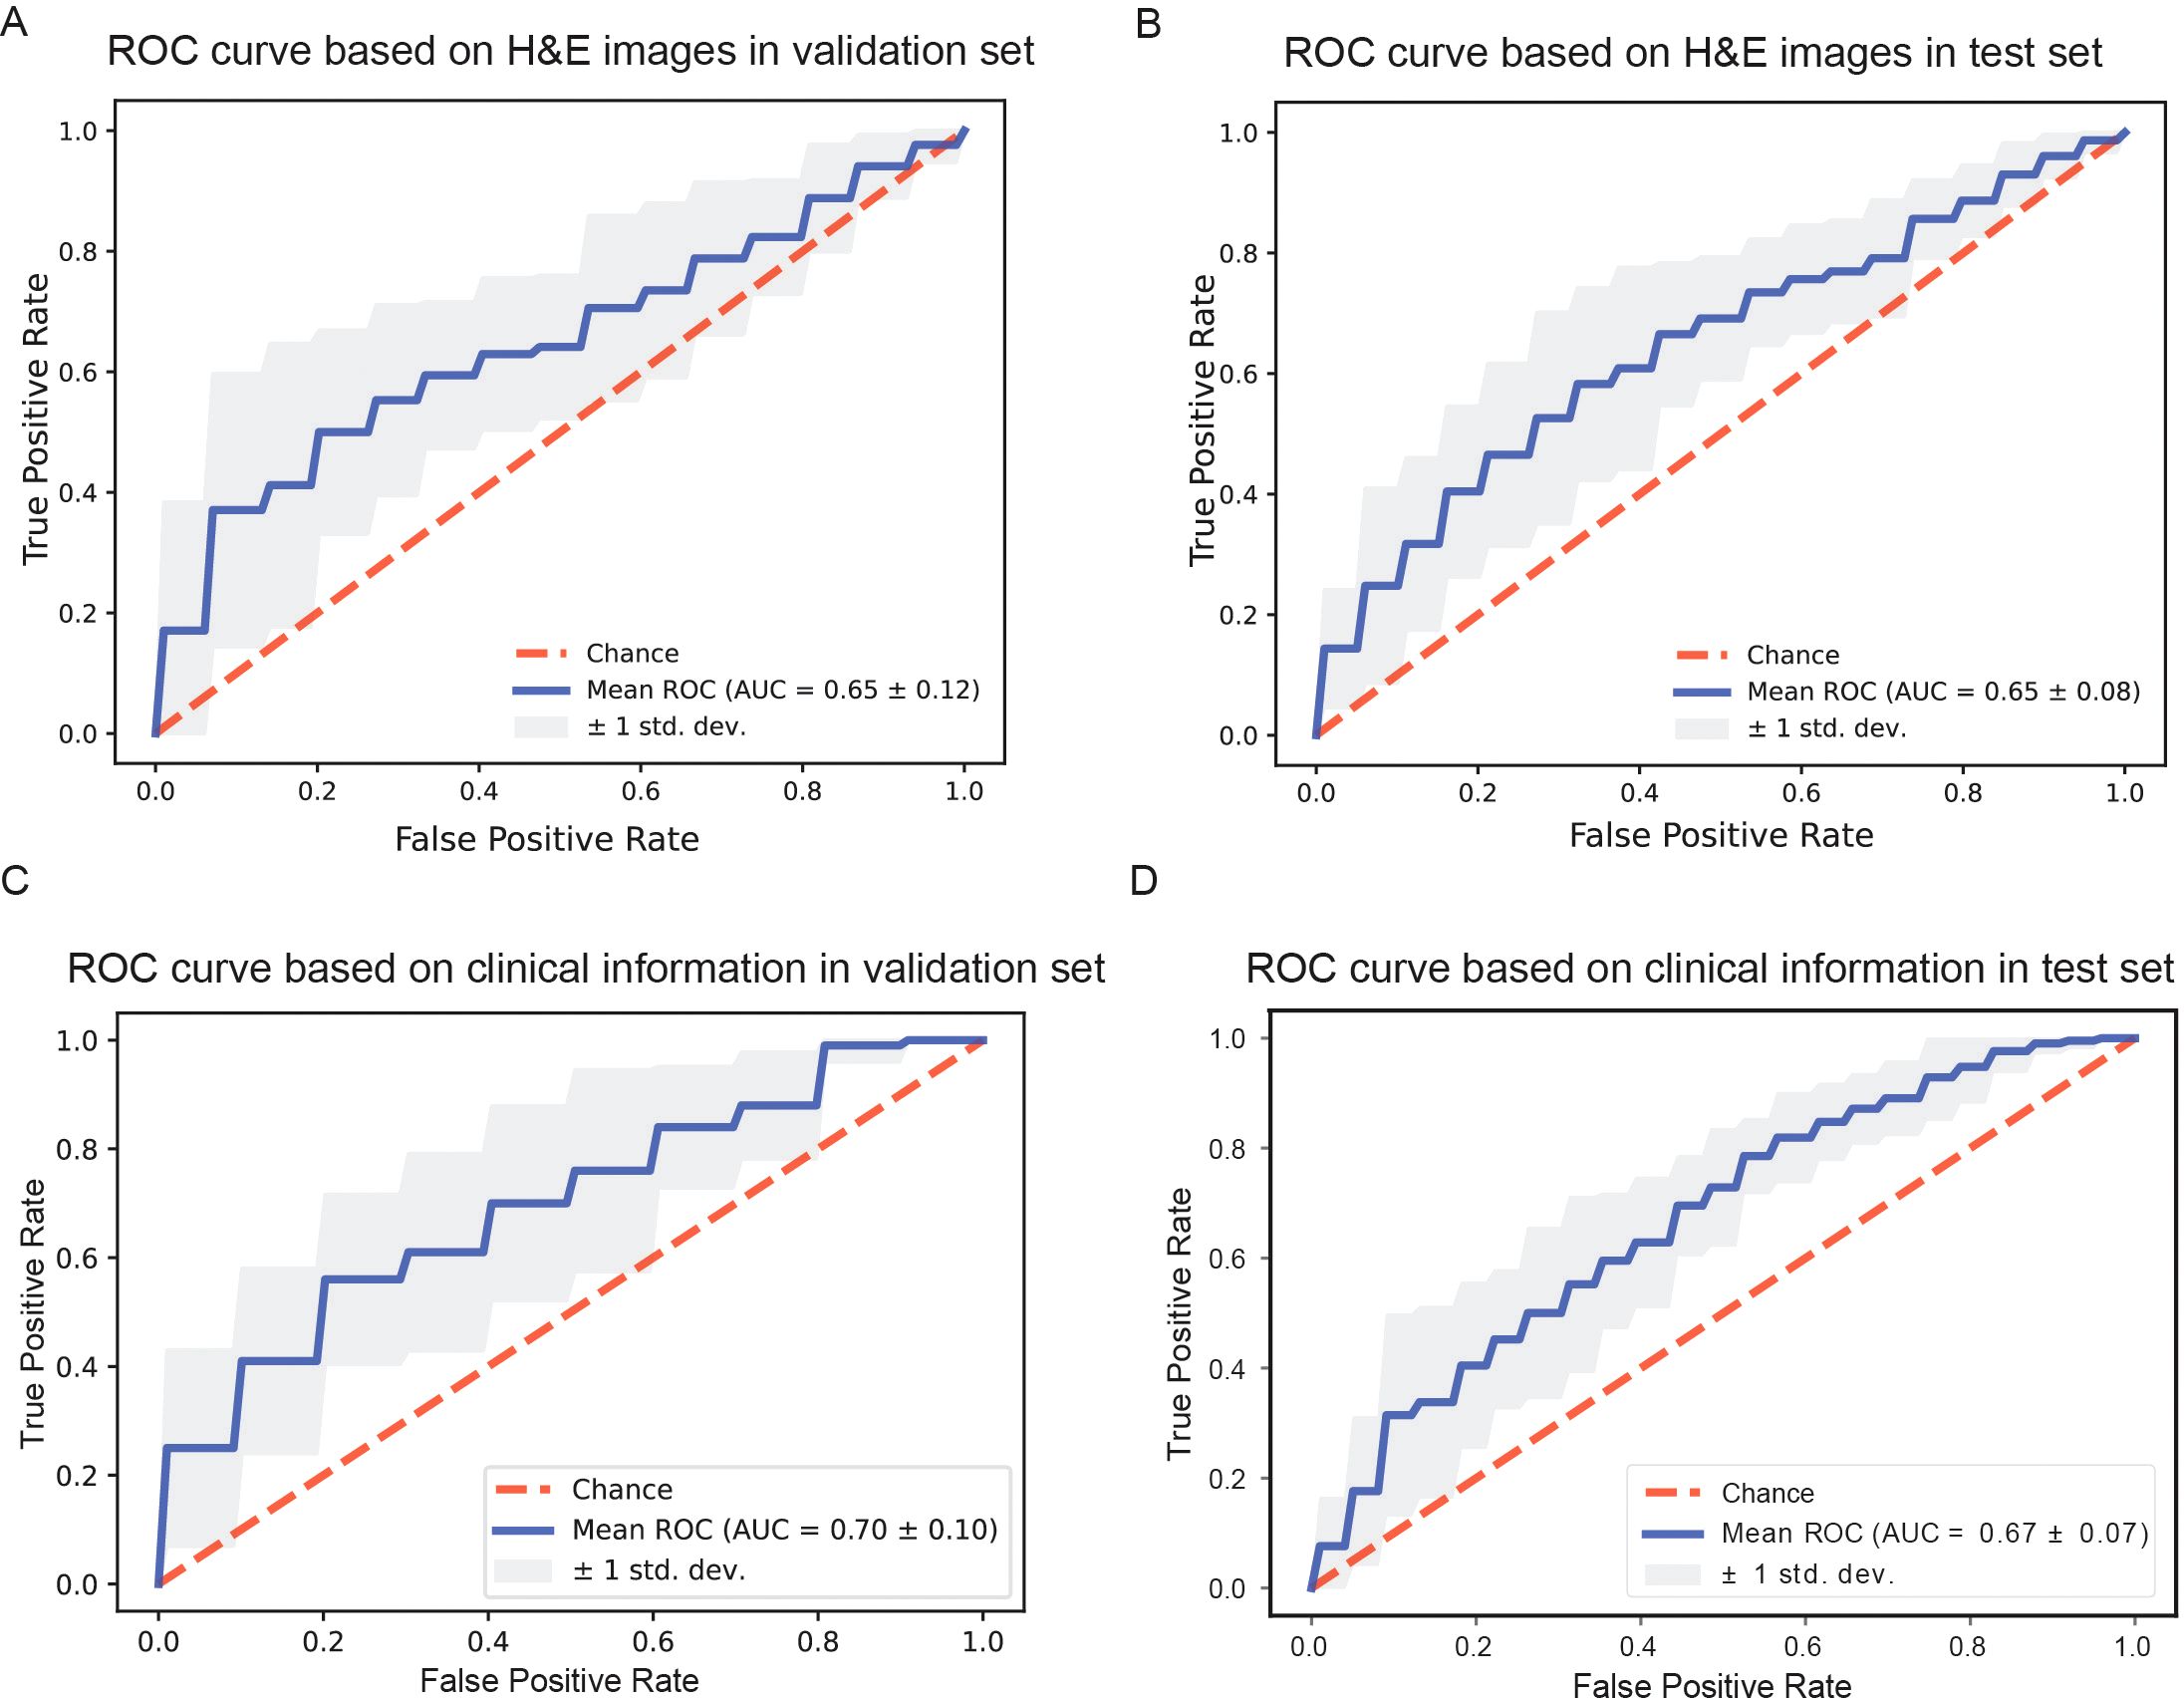
Figure 2. Comparison of model performance based on different information. (A, B) Receiver operating characteristic curves of models based on H&E stained whole slide images in the validation dataset and in the test dataset. (C, D) Receiver operating characteristic curves of models based on clinical information in the validation dataset and in the test dataset, respectively.
3.3 Some clinical features are strongly associated with relapsed or refractory of DLBCL
During the process of building the prediction model using clinical and molecular pathological information, we employed the hyperparameter optimization framework ‘Optuna’ to optimize the three hyperparameters of RF: n_estimators、max_depth、min_samples_split, to improve the accuracy (ACC) of the model based on the validation set. After 100 iterations, we obtained the best combination of parameters: ‘n_estimators’: 80, ‘max_depth’: 9, ‘min_samples_split’: 6, and the corresponding ACC of the prediction model was 0.675. The specific optimization process and corresponding results of 100 experiments was shown in Figure 3A. In the process of optimizing hyperparameters, we found that max_depth was the most important hyperparameter, followed by min_samples_split, and finally n_estimators. The importance scores for objective value of each parameter were shown in Figure 3B. RF refers to a classifier that uses multiple decision trees to train and predict samples, and can analyze the importance of different features based on the contribution of each feature on each tree. The contribution metrics included the Gini index and out-of-bag data error rate. We employed the Gini index to evaluate the features. All features were sorted based on their scores and included in model training. In theory, the higher the ranking of features, the more closely related to the relapsed and refractory of DLBCL. We chose the top nine features to display in Figure 3C. Among these nine features, the utilization of rituximab is an important factor affecting the prognosis of DLBCL patients (P=0.0023, Figure 3D). So we divided the patients into two parts according to whether they were treated with rituximab. Then, we used survival analysis to further analyze the relationship between the top six features and the prognosis of patients. Specifically, patients were grouped based on eigenvalues and survival curves were used to describe the survival status of each group. The Kaplan-Meier curves of patients that did not receive rituximab treatment were shown in Figures 3E–J, and the others were displayed in Figures 3K–P. The Eastern Cooperative Oncology Group (ECOG) Score and the stage of disease were strongly correlated with the prognosis of patients with DLBCL (P <0.05) when they did not receive rituximab treatment. After receiving rituximab treatment, the stages was no longer significantly correlated with the prognosis of patients, indicating rituximab treatment changed the prognosis of patients. The cut-off value for positive expression of BCL-2 is 70% or more of tumor cells expressing BCL-2. As can be seen, the survival probability of the BCL-2 positive group was lower than BCL-2 negative group, and in the rituximab treated group, the difference was significant. Some patients with DLBCL may experience a decrease in erythrocyte count. According to the changes in erythrocyte count, patients were divided into two groups. The KM survival curve showed that the overall survival rate of the normal group was superior to the group with decreased erythrocyte count. According to whether the hemoglobin is abnormal, DLBCL patients were divided into three groups. The overall survival rate of the normal hemoglobin group was higher than that of the abnormal group. According to the international prognostic index (IPI) score, patients were divided into two groups: IPI scores of 0, 1, and 2 were marked as 0, while 3 and above were marked as 1. The overall survival rate of the 0 group was higher than the 1 group, whether they were treated with rituximab or not.
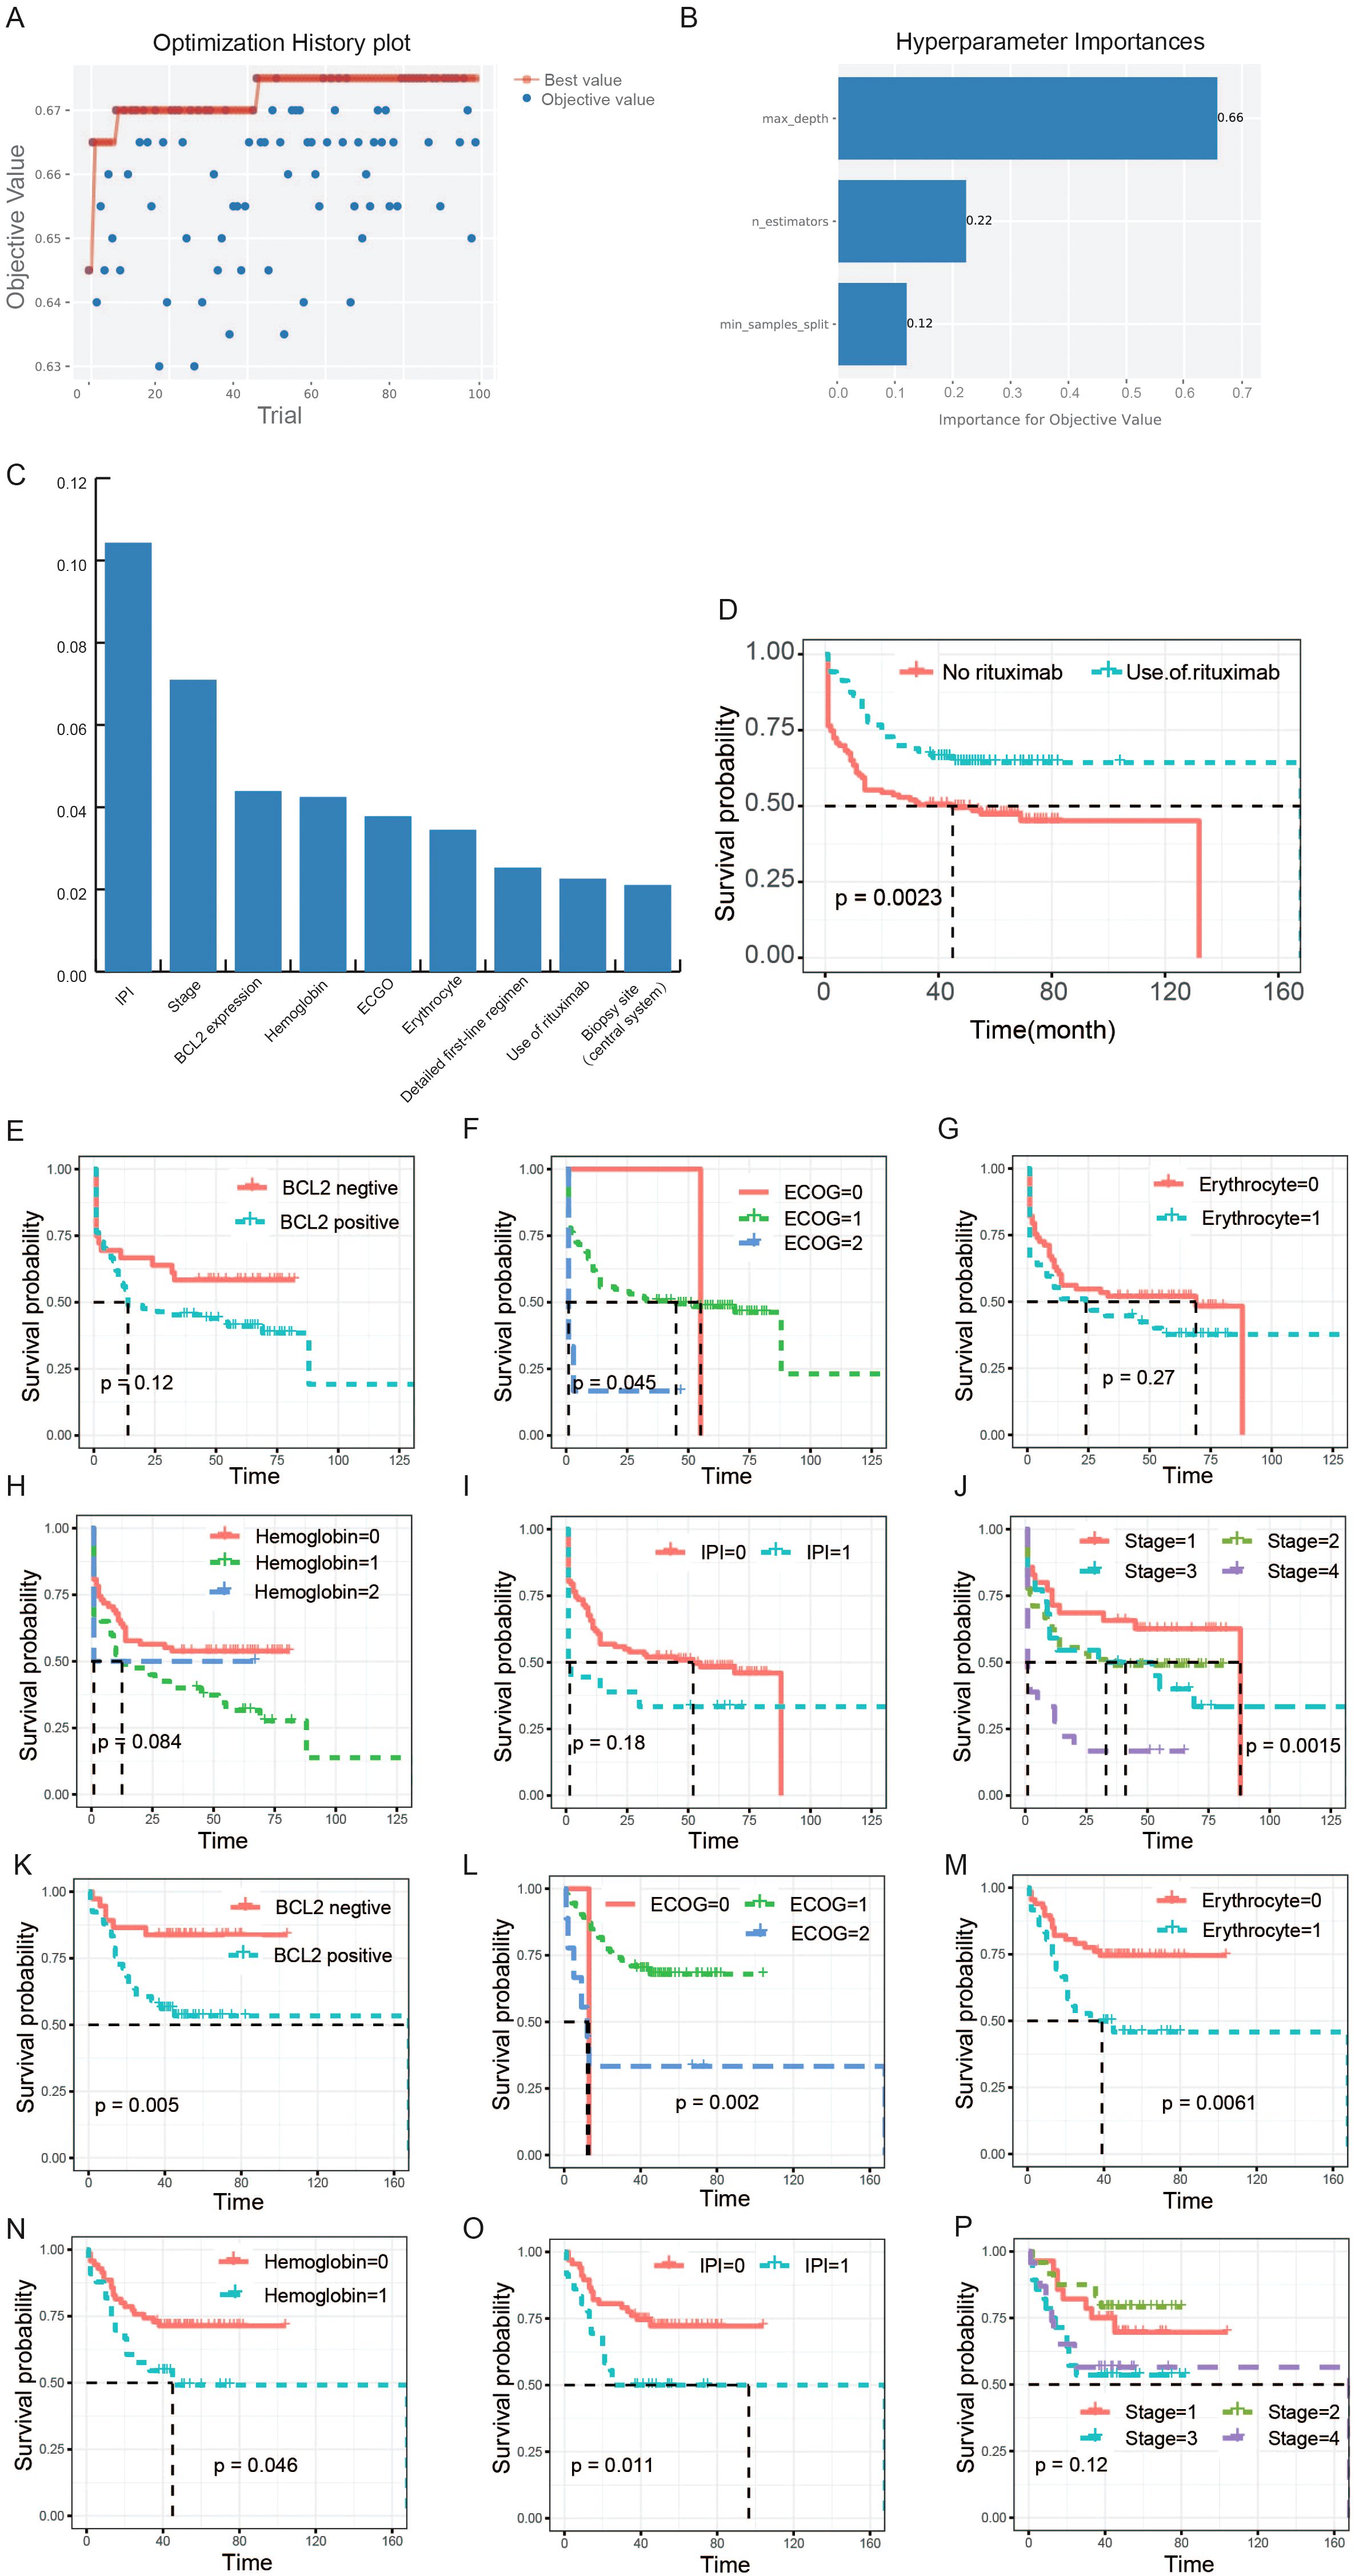
Figure 3. Selection of clinical features and their association analysis with survival. (A) The optimization history plot of modeling based on clinical and molecular pathological features. (B) Hyperparameter importance distribution in the optimal model. (C) The top nine features based on random-forest feature importance ranking. (D) The survival analysis of rituximab. The patients in this study were divided into two groups according to whether they were treated with rituximab. (E-J) The relationships between the six features and the prognosis of patients who did not receive rituximab treatment. (K-P) The relationships between the six features and the prognosis of patients who received rituximab treatment. The horizontal axis of the survival curve is the follow-up time (months), and the vertical axis is the survival rate.
3.4 The visual analysis makes image-based modeling interpretable
We used the attention mechanism to score each small patch of the H&E images, which were correctly classified using the H&E images-based model. The higher the score, the greater impact of the current patch on the patient’s final prediction. The red region meant a high attention area and the blue region represented a low attention area. Through the original H&E images and corresponding heatmap images, we obtained visual comparison graphs that can analyze which areas of the tissue were important to the prediction of relapsed or refractory. We chose H&E images and corresponding visualized images of two representative patients with different prognoses, which were shown in Figure 4. After reviewed by two pathology experts, they indicated that the original H&E stained pathological image from the non-relapsed & non-refractory patient with DLBCL (Figure 4A) revealed a low density of tumor cells and a rich background with pronounced fibrosis. However, the original H&E stained pathological image of R/R patient (Figure 4B) showed a high density of tumor cells and a relatively small number of background cells including T cells, histiocytes, and dendritic cells, with no significant fibrosis. Moreover, we can see the significant differences between these two groups of patients from the corresponding visualized heat-maps (Figures 4C, D).
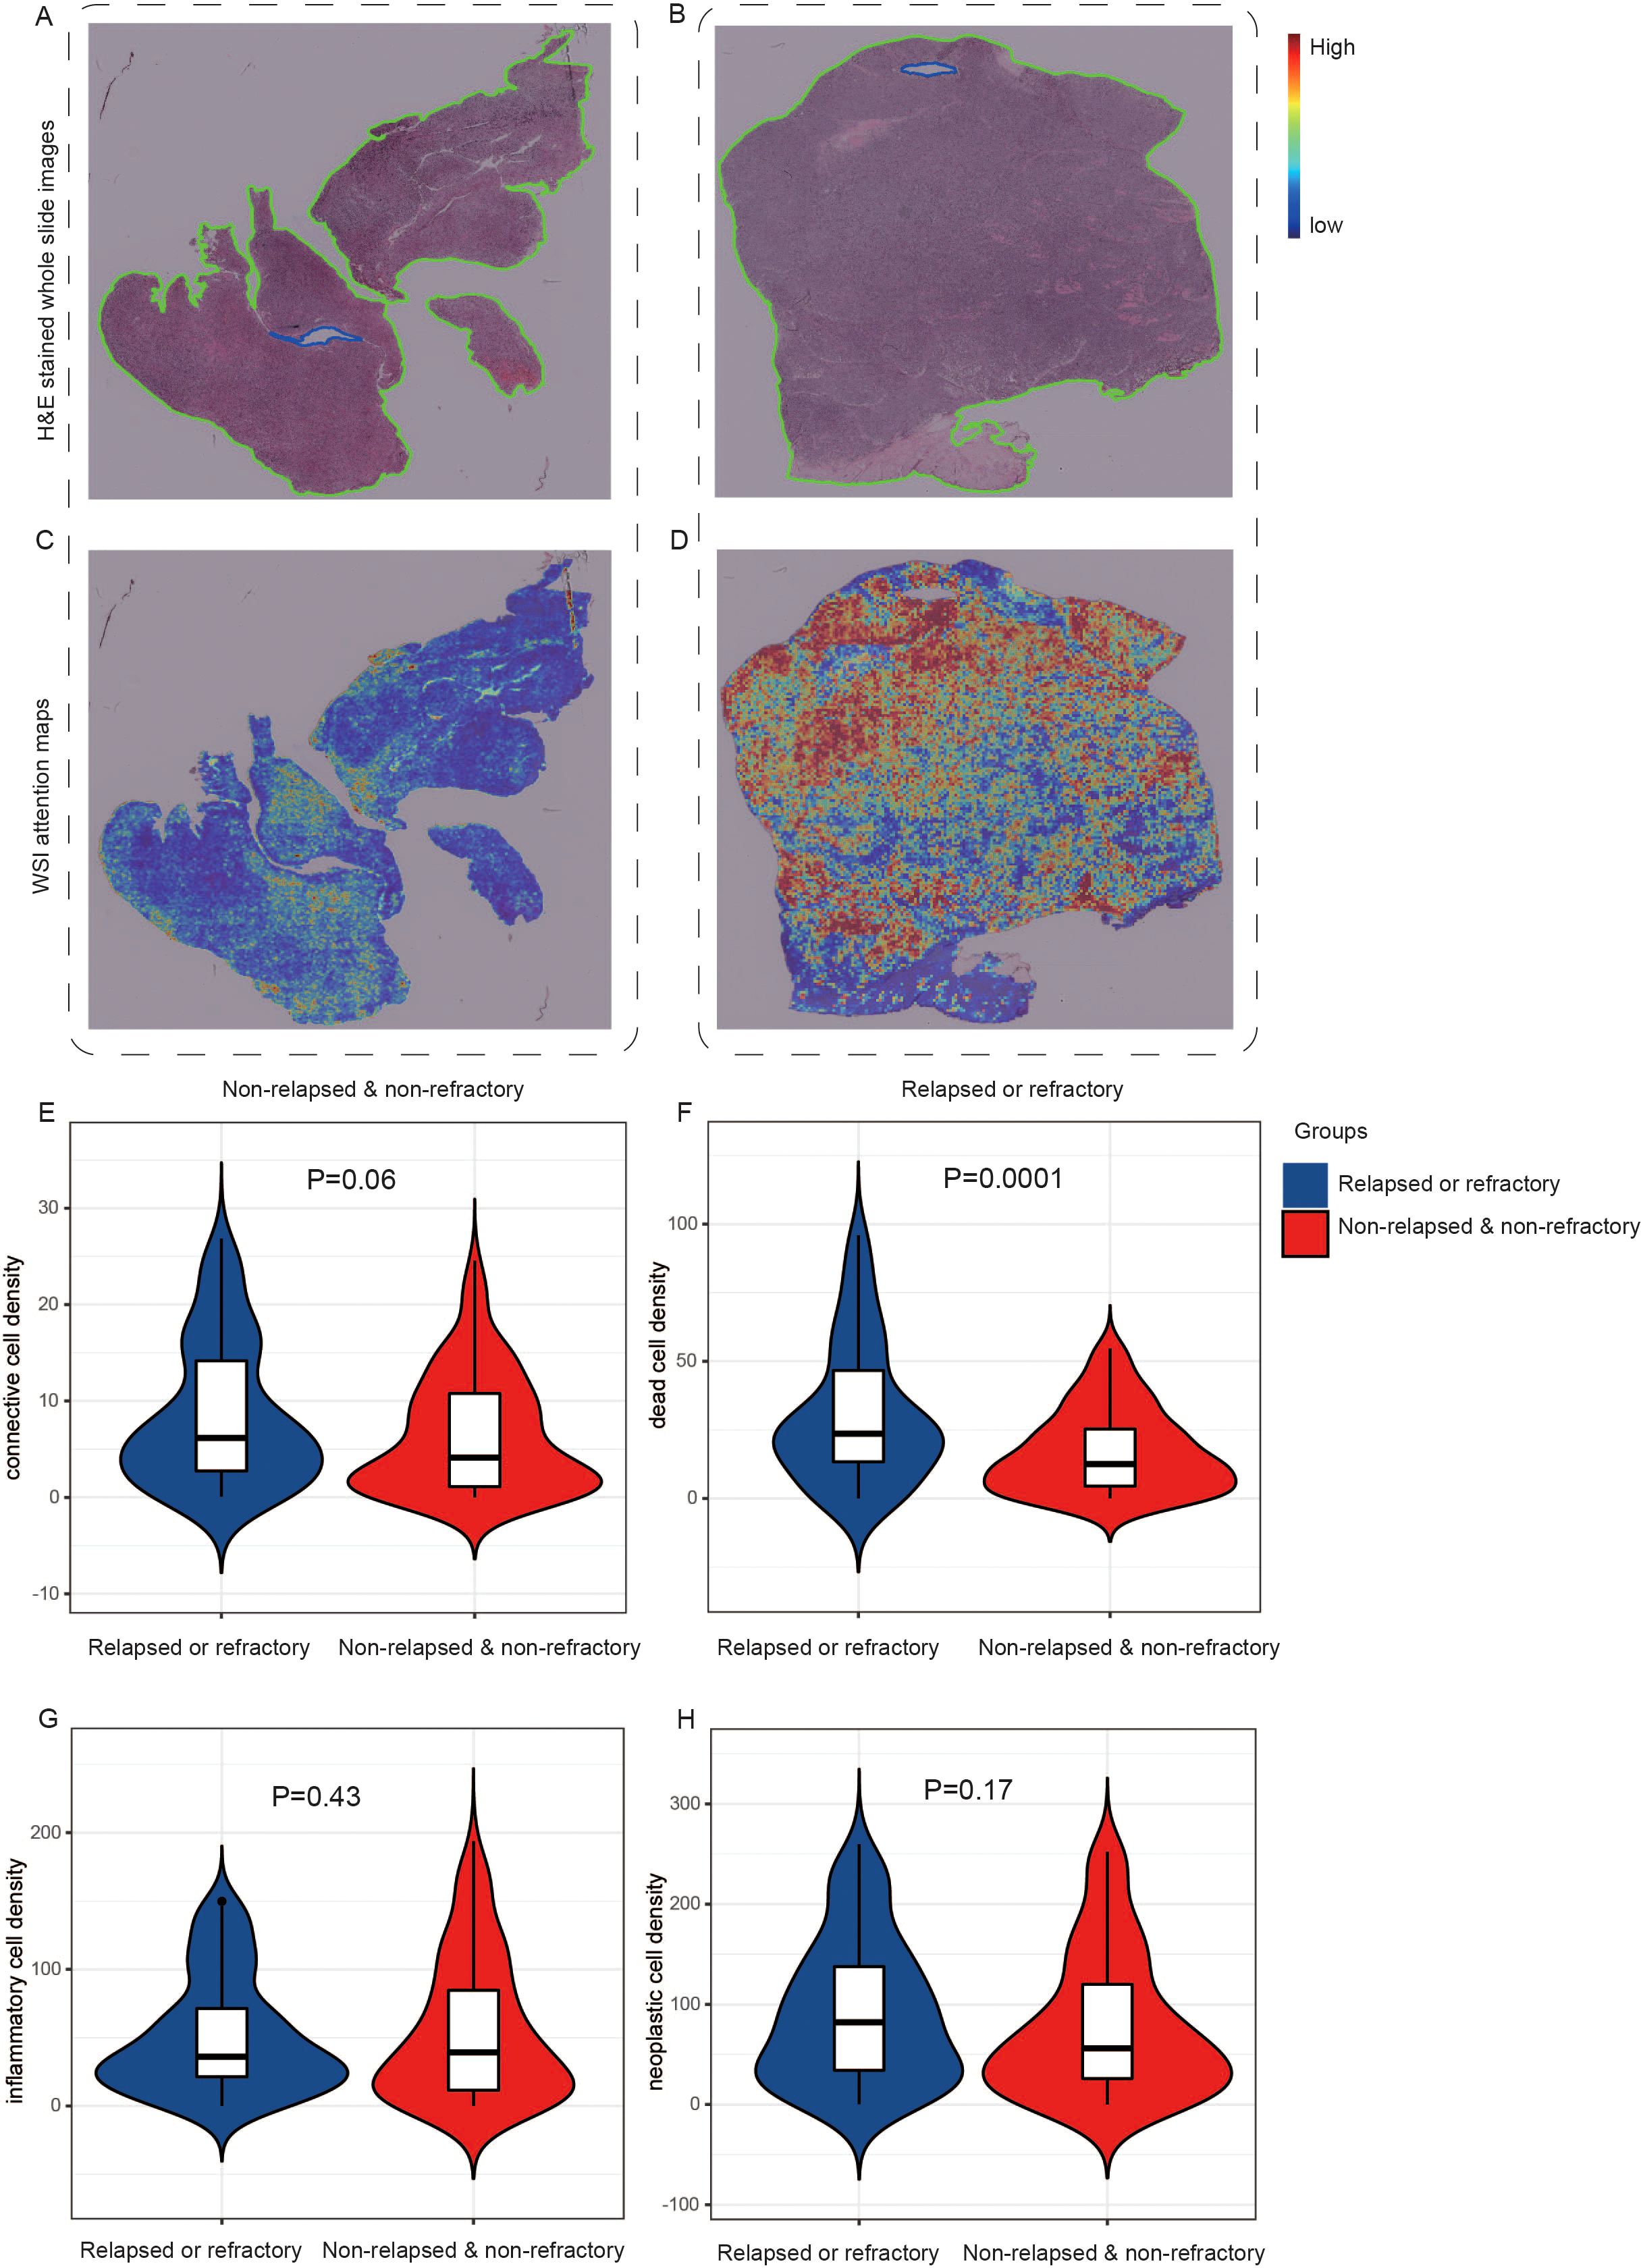
Figure 4. The visual analyses of H&E images-based modeling. One original H&E stained pathological image from the non-relapsed & non-refractory patient with DLBCL (A) and one image (B) from the relapsed or refractory patient with DLBCL. (C, D) The corresponding visualized attention heatmaps of the two H&E images, with red representing areas of high attention and blue representing areas of low attention. (E-H) The distribution of cell density in different queues. The inflammatory cell density in the R/R group was lower than that in the non-relapsed & non-refractory group, but there was no significant difference (E). The density of connective tissue cells, dead cells, and neoplastic cells was higher in the R/R group (F-H).
Then, we further analyzed and demonstrated the distribution of cell density in different groups, as shown in Figures 4E–H. All tumorous cells are labeled as neoplastic, and other cells are labeled as non-neoplastic, including non-neoplastic epithelial, connective/soft tissue, inflammatory and dead cells. In our study, no cells were predicted to be non-neoplastic epithelial cell, so a total of four types of cell nuclei were predicted: neoplastic cells, connective/soft tissue, inflammatory and dead cells. In addition, we extracted 15 nuclear morphological features and used the average value to generate a 15 dimensional feature vector for each nuclei in the WSI. We compared all features between the two groups and listed them in the Supplementary Table 1. Then we used the SHAP package (42) to explain these features of the WSI and shown the mean SHAP value in Supplementary Figure 1. It was found that the inflammatory cell density in the R/R group was lower than that in the non-relapsed & non-refractory group, but there was no significant difference (Figure 4E). The density of connective tissue cells, dead cells, and neoplastic cells was higher in the R/R group (Figures 4F-H), with dead cell density significantly higher than in the non-relapsed & non-refractory group (P=0.0001). Inflammatory cells typically cannot become neoplastic, whereas connective tissue cells have the potential to become neoplastic (40).
3.5 Integrating H&E pathological images with clinicopathological information for modeling can improve the predictive performance
Since the AUC values of the predictive models only based on H&E images and clinicopathological information respectively were lower than expected, we attempted to fuse H&E pathological image features and clinicopathological features using the CBP method to improve the performance of the prediction model. The grouping of patients and the partitioning of the dataset were the same as before. Finally, the mean AUC of the model in the validation set was 0.71 ± 0.07 after 10 rounds of repetition (Figure 5A), and the mean AUC in the test set was 0.70 ± 0.04 (Figure 5B). In addition, other performance parameters of the model were also improved, with the accuracy of the model was 0.658, the precision was 0.640, the recall was 0.643, and the F1 score was 0.629. While the accuracy of the model was 0.61, the precision was 0.60, the recall was 0.54, and the F1 score was 0.57 based on clinicopathological features, and the accuracy of the model was 0.50, the precision was 0.32, the recall was 0.38, and the F1 score was 0.32 based on pathological images. In addition, we employed four machine learning methods to construct classification model using the nuclear features extracted from H&E images. Furthermore, we combined the nuclear features, clinical features and H&E features obtained through the attention mechanism to develop a prediction model. The results were shown in Supplementary Figure 2.
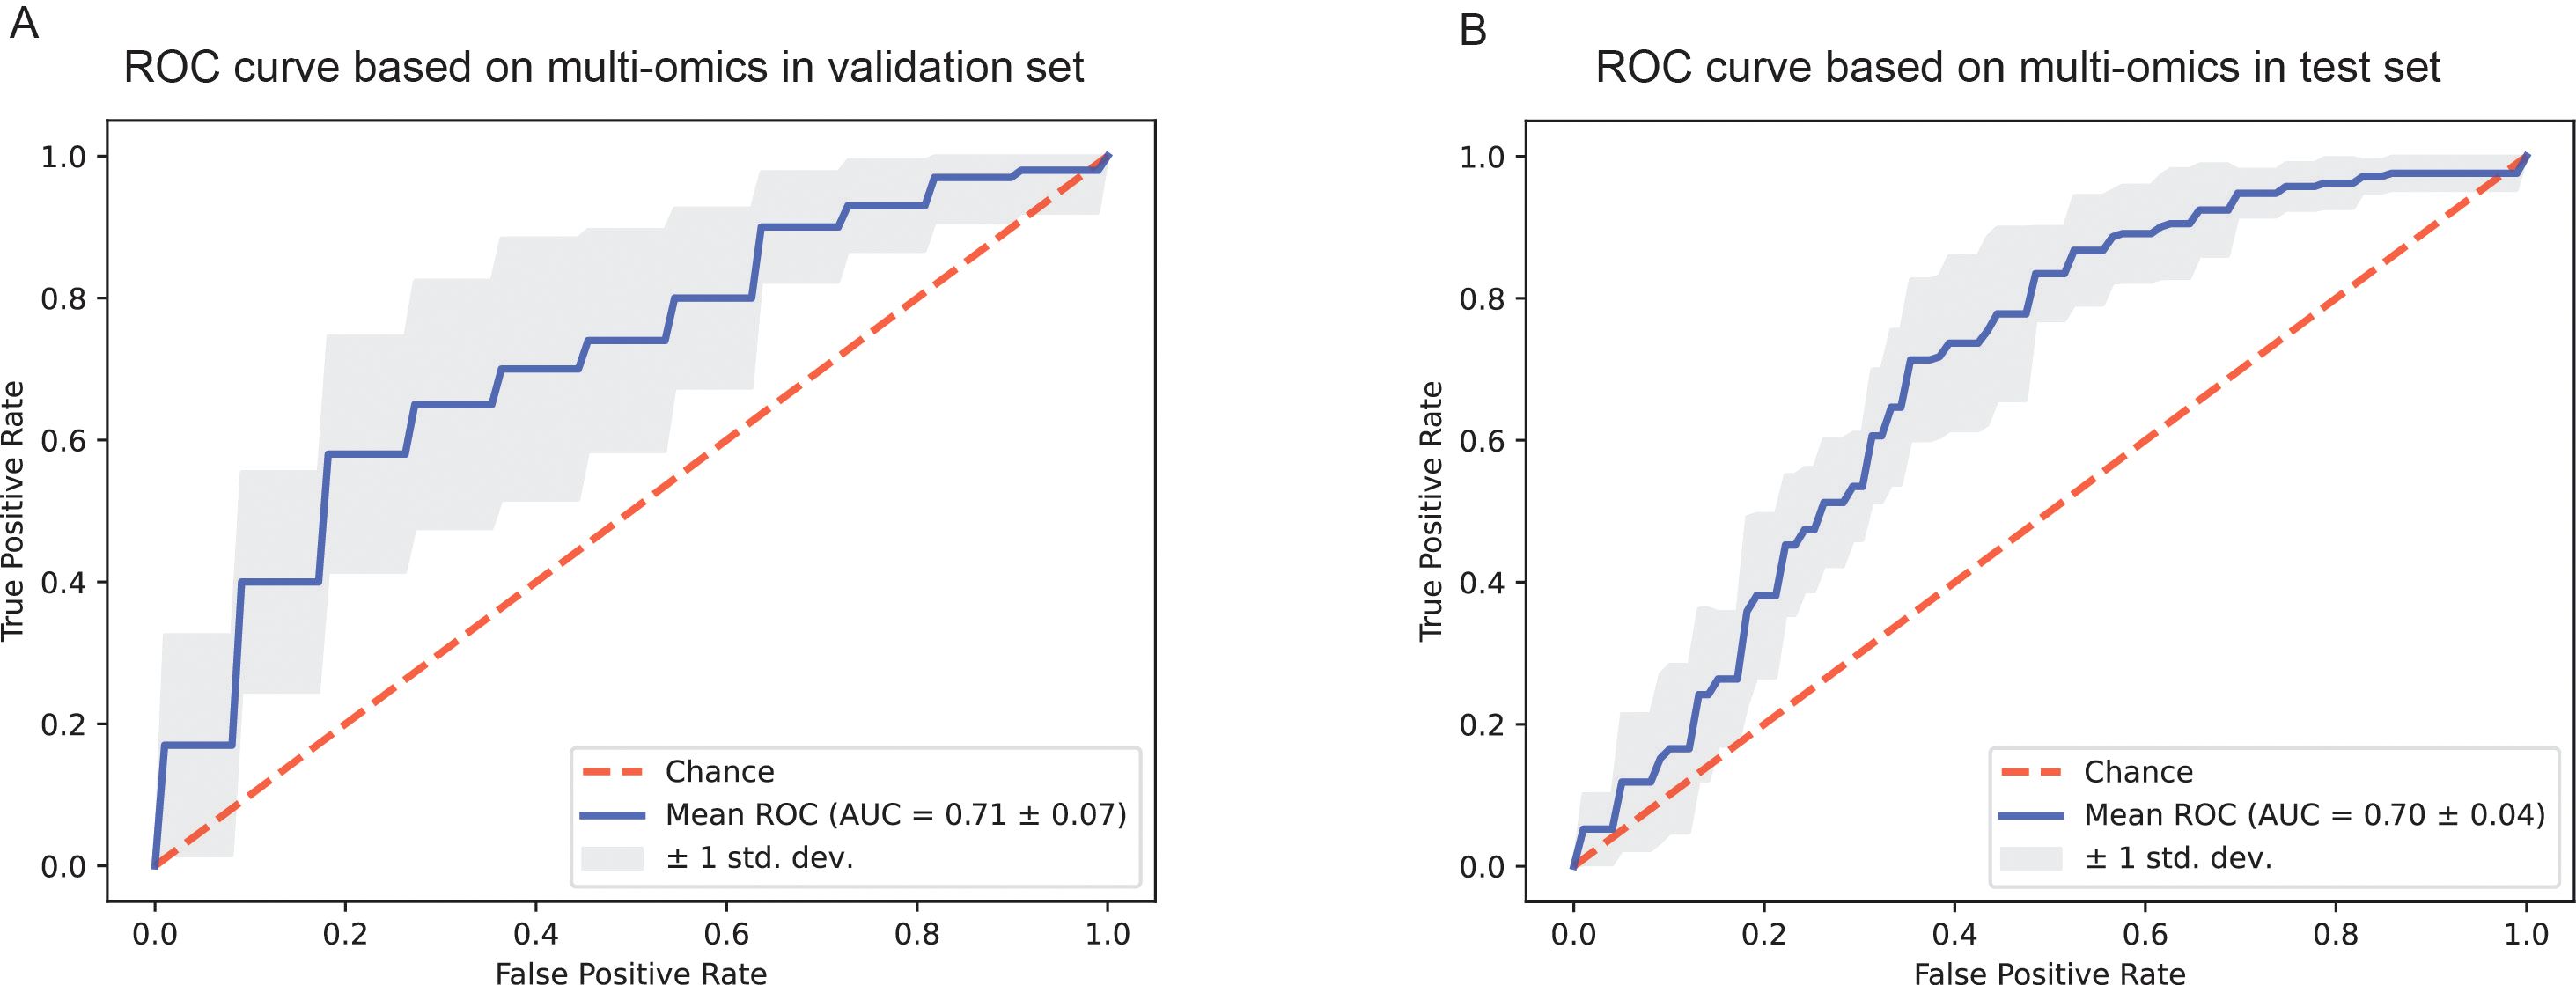
Figure 5. The ROC curves of the prediction model based on pathological images and clinicopathological information. (A) ROC curve of the combined deep learning model in the validation dataset. (B) ROC curve of the combined deep learning model in the test dataset.
4 Discussion
In this study, we collected clinical information, immunohistochemical results, laboratory test indicators and H&E stained pathological images of all DLBCL patients in Affiliated Hospital of Xuzhou Medical University from 2015 to 2018. After information matching and screening, there were 227 patients met the enrollment requirements. Then, we extracted pathological image features to predict R/R and non-relapsed & non-refractory DLBCL patients. To the best of our knowledge, this is the first study to construct a deep-learning predictive model utilizing H&E images to predict the prognosis of DLBCL patients. In addition, we sorted the clinical information, laboratory test indicators, and immunohistochemical information using the feature importance attribute of the random forest, and then constructed a predictive model with slightly better results than those based on pathological images alone. Finally, we developed a model that combining pathological image features with clinical information, laboratory indicators, and immunohistochemical indicators to predict R/R and non-relapsed & non-refractory risk of DLBCL patients, with an AUC of 0.71 ± 0.07 in the validation set and 0.70 ± 0.04 in the test set.
Hans et al. (43) classified DLBCL into germinal center B-cell like (GCB) and non-germinal center B-cell like (non GCB) subtypes based on the expression of CD10, bcl-6, and mum-1 in histopathological sections using immunohistochemistry. This classification could predict prognosis of patients, but the drawback is that the accuracy of classifying the same sample population is not high enough. It is far from enough to judge prognosis and select treatment based solely on COO classification during initial diagnosis. While the extant literature is sparse regarding the correlation between the COO and relapsed/refractory diffuse large B-cell lymphoma (R/R DLBCL). A recent study has elucidated that COO does not exhibit a significant association (p=0.285) with primary progressive disease which is characterized by either primary refractory disease, where the lymphoma does not respond to initial therapy, or relapsed disease occurring within 12 months post-treatment (44). It was reported that GCB cases accounted for 60.8% and non-GCB cases accounted for 39.2% of R/R DLBCLs (45), similar to our study. In our study, the R/R group included cases of primary refractory disease as well as all relapsed cases (relapsed after at least one month at the end of the treatment). Consistently, there was no significant correlation (p=0.84) between COO and the occurrence of R/R disease, which was shown in Table 1. Moreover, there was no significant correlation (p=0.27) between COO classification and overall survival of patients. In summary, our dataset is representative compared with other data.
We obtained a ranking of features related to relapsed or refractory risk of DLBCL patients using the feature importance attribute of RF. Through KM analysis, we found the use of rituximab and ECOG are strongly associated with survival rate. In previous studies, the expression of MYC and BCL-2 had been proven associated with a poor prognosis in initially treated DLBCL and R/R DLBCL (46, 47). Most patients with refractory lymphoma manifest as double-hit lymphoma (MYC-BCL2 rearrangement) (DHL) or double-expression lymphoma (MYC-BCL2 overexpression) (DEL), with more invasive manifestations clinically. The prognosis of these patients is poor, and R-CHOP may not be the preferred treatment option. IPI, ECOG, and clinical stage of tumor also had been reported to have important influences in the outcome of DLBCL (10). However, there have been no reports on the correlation between hemoglobin content and the prognosis of DLBCL yet, it still need to be further studied. M. Detrait et al. collected data from 130 patients with DLBCL to construct a model for predicting primary refractory disease (48). They used a variety of variables, including demographic characteristics, clinical condition, disease characteristics, first-line therapy, and PET-CT scan realization after 2 cycles of treatment. The performance of our model surpasses three models in their study and is slightly inferior to two of them. Maybe because they incorporated the indicator of PET-CT scan realization after 2 cycles of treatment, which can provide an initial assessment of prognosis.
There are some limitations in this study. Firstly, the accuracy of predicting the risk of R/R and non-relapsed & non-refractory in DLBCL patients only based on pathological images is relatively low. We analyzed the possible reasons as follows: First, we used WSI instead of region of interest (ROI) for feature extraction, which may affect the performance. The results from Liu et al. illustrated the model based on WSI achieved the best predictive performance compared to tumor area and peri-tumor area in Lymph node metastasis status (49). In addition, it was concordant with previous studies that the biological information on oncological outcome was not limited to the tumor area (50). Moreover, the pathologist evaluated that the lymphoma cells spreading throughout the WSI, so we chose WSI as the input. Second, the number of collected samples was not large enough, so high heterogeneity combined with a small dataset may lead to poor performance of the training model. Third, extracting abstract features from H&E stained patches of DLBCL patients alone may not be a good predictor of patient prognosis, and this method is lack of interpretability. We may need to analyze different cell ratios and tissue components of the FFPE slides. Loi et al. reported that tumor infiltrating lymphocytes (TILs) were prognostic in triple negative breast cancer and predictive for trastuzumab benefit in early breast cancer (51). The interplay of sTILs, tumor cells, other microenvironment mediators, their spatial relationships, quantity, and other image-based features have yet to be determined exhaustively and systemically (52). The phenotypic information in pathological tissue reflected the overall effect of the tumor microenvironment on the behavior of cancer cells. Recent studies demonstrated that deep learning models can identify protein expression alterations and genetic mutations based on histological images across multiple cancer types (53, 54). So we assumed that we could predict the prognosis of DLBCL patients based on H&E stained pathological images. And, as can be seen from Figure 4, there were significant differences in H&E stained pathological images between R/R patients and non-relapsed & non-refractory patients after visualization.
Secondly, as the labels of R/R and non-relapsed & non-refractory are difficult to obtain, we only collected one valid dataset, there is still a lack of independent test datasets. We downloaded clinical pathological information and H&E images of DLBCL patients from TCGA, and after information matching, we found that the prognosis information is incomplete and could not be used as an independent test dataset.
In the future, we plan to optimize the research from the following aspects. Firstly, we will collect more data from our hospital and other hospitals to optimize the model. Secondly, we will continue trying different image preprocessing methods to improve the performance of the models, hoping provide a valuable reference for hematologists. Compared with traditional methods, artificial intelligence based image recognition and classification can extract more important information that cannot be recognized by human eyes. In addition, due to the reduction of differences in visual perception among different individuals, these high-dimensional features will also become more objective and reliable. We expect to construct a model with an optimal performance that combines clinical information, laboratory examination results, immunohistochemical indicators, and pathological images together. This model could predict the prognosis of DLBCL patients accurately in the early stage, and assist doctors in developing personalized treatment plans.
Data availability statement
The raw data supporting the conclusions of this article will be made available by the authors, without undue reservation.
Ethics statement
The studies involving humans were approved by the Medical Research Ethics Committee of The Affiliated Hospital of Xuzhou Medical University. The studies were conducted in accordance with the local legislation and institutional requirements. The human samples used in this study were acquired from primarily isolated as part of your previous study for which ethical approval was obtained. Written informed consent for participation was not required from the participants or the participants’ legal guardians/next of kin in accordance with the national legislation and institutional requirements.
Author contributions
XS: Data curation, Project administration, Writing – review & editing. XM: Data curation, Writing – original draft, Writing – review & editing. DM: Data curation, Writing – original draft, Writing – review & editing. YG: Data curation, Methodology, Writing – original draft, Writing – review & editing. YY: Data curation, Writing – original draft, Writing – review & editing. YW: Data curation, Writing – review & editing. DL: Data curation, Writing – review & editing. MF: Data curation, Writing – review & editing. SX: Formal analysis, Methodology, Writing – review & editing. BJ: Methodology, Writing – review & editing. CX: Writing – review & editing. HL: Conceptualization, Funding acquisition, Project administration, Supervision, Writing – review & editing.
Funding
The author(s) declare financial support was received for the research, authorship, and/or publication of this article. This study was supported by the Key Research and Development Project of Xuzhou Science and Technology Project (No. KC21207 and KC21233), and the Advanced Program of The Affiliated Hospital of Xuzhou Medical University (grant PYJH2024317).
Conflict of interest
Authors XS, SX and BJ were employed by the company Geneis Beijing Co. Ltd.
The remaining authors declare that the research was conducted in the absence of any commercial or financial relationships that could be construed as a potential conflict of interest.
Publisher’s note
All claims expressed in this article are solely those of the authors and do not necessarily represent those of their affiliated organizations, or those of the publisher, the editors and the reviewers. Any product that may be evaluated in this article, or claim that may be made by its manufacturer, is not guaranteed or endorsed by the publisher.
Supplementary material
The Supplementary Material for this article can be found online at: https://www.frontiersin.org/articles/10.3389/fonc.2025.1480645/full#supplementary-material
References
1. Sauter CS, Matasar MJ, Schoder H, Devlin SM, Drullinsky P, Gerecitano J, et al. A phase 1 study of ibrutinib in combination with R-ICE in patients with relapsed or primary refractory DLBCL. Blood. (2018) 131:1805–8. doi: 10.1182/blood-2017-08-802561
2. Sung H, Ferlay J, Siegel RL, Laversanne M, Soerjomataram I, Jemal A, et al. Global cancer statistics 2020: GLOBOCAN estimates of incidence and mortality worldwide for 36 cancers in 185 countries. CA: Cancer J Clin. (2021) 71:209–49. doi: 10.3322/caac.21660
3. Palanca-Wessels MCA, Czuczman M, Salles G, Assouline S, Sehn LH, Flinn I, et al. Safety and activity of the anti-CD79B antibody–drug conjugate polatuzumab vedotin in relapsed or refractory B-cell non-Hodgkin lymphoma and chronic lymphocytic leukaemia: a phase 1 study. Lancet Oncol. (2015) 16:704–15. doi: 10.1016/S1470-2045(15)70128-2
4. Sehn LH, Herrera AF, Matasar MJ, Kamdar M, McMillan AK, Kim TM, et al. Addition of polatuzumab vedotin to bendamustine and rituximab (BR) improves outcomes in transplant-Ineligible patients with relapsed/Refractory (R/R) diffuse large B-Cell lymphoma (DLBCL) versus BR alone: results from a randomized phase 2 study. Blood. (2017) 130:2821. doi: 10.1182/BLOOD.V130.SUPPL_1.2821.2821
5. Viardot A, Goebeler M-E, Hess G, Neumann S, Pfreundschuh M, Adrian N, et al. Phase 2 study of the bispecific T-cell engager (BiTE) antibody blinatumomab in relapsed/refractory diffuse large B-cell lymphoma. Blood. (2016) 127:1410–6. doi: 10.1182/blood-2015-06-651380
6. Li S, Young KH, Medeiros LJ. Diffuse large B-cell lymphoma. Pathology. (2018) 50:74–87. doi: 10.1016/j.pathol.2017.09.006
7. Jurinovic V, Kridel R, Staiger AM, Szczepanowski M, Horn H, Dreyling MH, et al. Clinicogenetic risk models predict early progression of follicular lymphoma after first-line immunochemotherapy. Blood. (2016) 128:1112–20. doi: 10.1182/blood-2016-05-717355
8. Van Den Neste E, Schmitz N, Mounier N, Gill D, Linch D, Trneny M, et al. Outcomes of diffuse large B-cell lymphoma patients relapsing after autologous stem cell transplantation: an analysis of patients included in the CORAL study. Bone marrow Transplant. (2017) 52:216–21. doi: 10.1038/bmt.2016.213
9. Griffin TC, Weitzman S, Weinstein H, Chang M, Cairo M, Hutchison R, et al. A study of rituximab and ifosfamide, carboplatin, and etoposide chemotherapy in children with recurrent/refractory B-cell (CD20+) non-Hodgkin lymphoma and mature B-cell acute lymphoblastic leukemia: a report from the Children’s Oncology Group. Pediatr Blood Cancer. (2009) 52:177–81. doi: 10.1002/pbc.21753
10. Crump M, Neelapu SS, Farooq U, Van Den Neste E, Kuruvilla J, Westin J, et al. Outcomes in refractory diffuse large B-cell lymphoma: results from the international SCHOLAR-1 study. Blood. (2017) 130:1800–8. doi: 10.1182/blood-2017-03-769620
11. Riedell PA, Smith SM. Double hit and double expressors in lymphoma: Definition and treatment. Cancer. (2018) 124:4622–32. doi: 10.1002/cncr.31646
12. Sarkozy C, Sehn LH. Management of relapsed/refractory DLBCL. Best Pract Res Clin haematology. (2018) 31:209–16. doi: 10.1016/j.beha.2018.07.014
13. Wang L, Li LR. R-CHOP resistance in diffuse large B-cell lymphoma: biological and molecular mechanisms. Chin Med J (Engl). (2020) 134:253–60. doi: 10.1097/CM9.0000000000001294
14. Srour SA, Li S, Popat UR, Qazilbash MH, Lozano-Cerrada S, Maadani F, et al. A randomized phase II study of standard-dose versus high-dose rituximab with BEAM in autologous stem cell transplantation for relapsed aggressive B-cell non-hodgkin lymphomas: long term results. Br J Haematol. (2017) 178:561–70. doi: 10.1111/bjh.2017.178.issue-4
15. van Imhoff GW, McMillan A, Matasar MJ, Radford J, Ardeshna KM, Kuliczkowski K, et al. Ofatumumab versus rituximab salvage chemoimmunotherapy in relapsed or refractory diffuse large B-Cell lymphoma: the ORCHARRD study. J Clin Oncol. (2017) 35:544–51. doi: 10.1200/JCO.2016.69.0198
16. Friedberg JW. Relapsed/refractory diffuse large B-cell lymphoma. Hematol Am Soc Hematol Educ Program. (2011) 2011:498–505. doi: 10.1182/asheducation-2011.1.498
17. Gisselbrecht C, Glass B, Mounier N, Singh Gill D, Linch DC, Trneny M, et al. Salvage regimens with autologous transplantation for relapsed large B-cell lymphoma in the rituximab era. J Clin Oncol. (2010) 28:4184–90. doi: 10.1200/JCO.2010.28.1618
18. Hitz F, Connors JM, Gascoyne RD, Hoskins P, Moccia A, Savage KJ, et al. Outcome of patients with primary refractory diffuse large B cell lymphoma after R-CHOP treatment. Ann Hematol. (2015) 94:1839–43. doi: 10.1007/s00277-015-2467-z
19. Seo S, Hong JY, Yoon S, Yoo C, Park JH, Lee JB, et al. Prognostic significance of serum beta-2 microglobulin in patients with diffuse large B-cell lymphoma in the rituximab era. Oncotarget. (2016) 7:76934–43. doi: 10.18632/oncotarget.12734
20. Coiffier B, Radford J, Bosly A, Martinelli G, Verhoef G, Barca G, et al. A multicentre, phase II trial of ofatumumab monotherapy in relapsed/progressive diffuse large B-cell lymphoma. Br J haematology. (2013) 163:334–42. doi: 10.1111/bjh.2013.163.issue-3
21. Locke FL, Miklos DB, Jacobson CA, Perales MA, Kersten MJ, Oluwole OO, et al. Axicabtagene ciloleucel as second-Line therapy for large B-Cell lymphoma. New Engl J Med. (2022) 386:640–54. doi: 10.1056/NEJMoa2116133
22. Dunleavy K. Double-hit lymphoma: optimizing therapy. Hematol Am Soc Hematol Educ Program. (2021) 2021:157–63. doi: 10.1182/hematology.2021000247
23. International Non-Hodgkin's Lymphoma Prognostic Factors Project. A predictive model for aggressive non-Hodgkin’s lymphoma. New Engl J Med. (1993) 329:987–94. doi: 10.1056/NEJM199309303291402
24. Wang W, Yin J, Zhang W, Zhang Y, Zhou D, Zhao D, et al. Novel model predicts prognosis for patients with diffuse large B-cell lymphoma in first relapse after initial R-CHOP therapy: a single-institution study in China. J Int Med Res. (2021) 49:3000605211002971. doi: 10.1177/03000605211002971
25. Yamamoto M, Watanabe K, Fukuda T, Miura O. Prediction of prognosis for patients with diffuse large B-cell lymphoma refractory to or in first relapse after initial R-CHOP therapy: A single-institution study. Anticancer Res. (2017) 37:2655–62. doi: 10.21873/anticanres.11613
26. Ji MY, Yuan L, Jiang XD, Zeng Z, Zhan N, Huang PX, et al. Nuclear shape, architecture and orientation features from H&E images are able to predict recurrence in node-negative gastric adenocarcinoma. J Trans Med. (2019) 17:92. doi: 10.1186/s12967-019-1839-x
27. Luo X, Zang X, Yang L, Huang J, Liang F, Rodriguez-Canales J, et al. Comprehensive computational pathological image analysis predicts lung cancer prognosis. J Thorac Oncol. (2017) 12:501–9. doi: 10.1016/j.jtho.2016.10.017
28. Chen X, Wang X, Zhang K, Fung KM, Thai TC, Moore K, et al. Recent advances and clinical applications of deep learning in medical image analysis. Med Image Anal. (2022) 79:102444. doi: 10.1016/j.media.2022.102444
29. Acs B, Rantalainen M, Hartman J. Artificial intelligence as the next step towards precision pathology. J Intern Med. (2020) 288:62–81. doi: 10.1111/joim.v288.1
30. Swerdlow SH, Campo E, Pileri SA, Harris NL, Stein H, Siebert R, et al. The 2016 revision of the World Health Organization classification of lymphoid neoplasms. Blood. (2016) 127:2375–90. doi: 10.1182/blood-2016-01-643569
31. Wu Z, Wang L, Li C, Cai Y, Liang Y, Mo X, et al. DeepLRHE: A deep convolutional neural network framework to evaluate the risk of lung cancer recurrence and metastasis from histopathology images. Front Genet. (2020) 11:768. doi: 10.3389/fgene.2020.00768
32. Lu MY, Williamson DFK, Chen TY, Chen RJ, Barbieri M, Mahmood F. Data-efficient and weakly supervised computational pathology on whole-slide images. Nat Biomed Eng. (2021) 5:555–70. doi: 10.1038/s41551-020-00682-w
33. Cheson BD, Pfistner B, Juweid ME, Gascoyne RD, Specht L, Horning SJ, et al. Revised response criteria for Malignant lymphoma. J Clin Oncol. (2007) 25:579–86. doi: 10.1200/JCO.2006.09.2403
34. Yao Y, Lv Y, Tong L, Liang Y, Xi S, Ji B, et al. ICSDA: a multi-modal deep learning model to predict breast cancer recurrence and metastasis risk by integrating pathological, clinical and gene expression data. Briefings Bioinf. (2022) 23:1–11. doi: 10.1093/bib/bbac448
35. Prusa JD, Khoshgoftaar TM, Napolitano A. “Using feature selection in combination with ensemble learning techniques to improve tweet sentiment classification.” In: 2015 IEEE 27th International Conference on Tools with Artificial Intelligence (ICTAI). Los Alamitos, California, USA: IEEE Computer Society (2015). p. 186–93.
36. Moranguinho J, Pereira T, Ramos B, Morgado J, Costa JL, Oliveira HP. “Attention-based deep multiple instance learning approach for lung cancer prediction using histopathological images.” In: Annual International Conference of the IEEE Engineering in Medicine and Biology Society. Piscataway, New Jersey, USA: IEEE (2021). p. 2852–5.
37. Deviaene M, Testelmans D, Borzee P, Buyse B, Huffel SV, Varon C. “Feature selection algorithm based on random forest applied to sleep apnea detection.” In: Annual International Conference of the IEEE Engineering in Medicine and Biology Society. Piscataway, New Jersey, USA: IEEE (2019). p. 2580–3.
38. Speiser JL. A random forest method with feature selection for developing medical prediction models with clustered and longitudinal data. J Biomed Inf. (2021) 117:103763. doi: 10.1016/j.jbi.2021.103763
39. Huang K, Lin B, Liu J, Liu Y, Li J, Tian G, et al. Predicting colorectal cancer tumor mutational burden from histopathological images and clinical information using multi-modal deep learning. Bioinf (Oxford England). (2022) 38:5108–15. doi: 10.1093/bioinformatics/btac641
40. Gamper J, Koohbanani NA, Graham S, Jahanifar M, Khurram SA, Azam A, et al. PanNuke Dataset Extension, Insights and Baselines. Los Alamitos, California, USA: IEEE Computer Society (2020).
41. Heagerty PJ, Zheng Y. Survival model predictive accuracy and ROC curves. Biometrics. (2005) 61:92–105. doi: 10.1111/j.0006-341X.2005.030814.x
42. Lundberg SM, Erion G, Chen H, DeGrave A, Prutkin JM, Nair B, et al. From local explanations to global understanding with explainable AI for trees. Nat Mach Intell. (2020) 2:56–67. doi: 10.1038/s42256-019-0138-9
43. Hans CP, Weisenburger DD, Greiner TC, Gascoyne RD, Delabie J, Ott G, et al. Confirmation of the molecular classification of diffuse large B-cell lymphoma by immunohistochemistry using a tissue microarray. Blood. (2004) 103:275–82. doi: 10.1182/blood-2003-05-1545
44. Bock AM, Mwangi R, Wang Y, Khurana A, Maurer MJ, Ayers A, et al. Defining primary refractory large B-cell lymphoma. Blood Adv. (2024) 8:3402–15. doi: 10.1182/bloodadvances.2024012760
45. Desai SH, Mwangi R, Smith AN, Maurer MJ, Farooq U, King RL, et al. Cell of origin is not associated with outcomes of relapsed or refractory diffuse large B cell lymphoma. Hematol Oncol. (2023) 41:39–49. doi: 10.1002/hon.v41.1
46. Perry AM, Alvarado-Bernal Y, Laurini JA, Smith LM, Slack GW, Tan KL, et al. MYC and BCL2 protein expression predicts survival in patients with diffuse large B-cell lymphoma treated with rituximab. Br J haematology. (2014) 165:382–91. doi: 10.1111/bjh.2014.165.issue-3
47. Herrera AF, Mei M, Low L, Kim HT, Griffin GK, Song JY, et al. Relapsed or refractory double-Expressor and double-Hit lymphomas have inferior progression-Free survival after autologous stem-Cell transplantation. J Clin Oncol. (2017) 35:24–31. doi: 10.1200/JCO.2016.68.2740
48. Detrait MY, Warnon S, Lagasse R, Dumont L, De Prophétis S, Hansenne A, et al. A machine learning approach in a monocentric cohort for predicting primary refractory disease in Diffuse Large B-cell lymphoma patients. PloS One. (2024) 19:e0311261. doi: 10.1371/journal.pone.0311261
49. Liu Y, Lai F, Lin B, Gu Y, Chen L, Chen G, et al. Deep learning to predict cervical lymph node metastasis from intraoperative frozen section of tumour in papillary thyroid carcinoma: a multicentre diagnostic study. EClinicalMedicine. (2023) 60:102007. doi: 10.1016/j.eclinm.2023.102007
50. Yamamoto Y, Tsuzuki T, Akatsuka J, Ueki M, Morikawa H, Numata Y, et al. Automated acquisition of explainable knowledge from unannotated histopathology images. Nat Commun. (2019) 10:5642. doi: 10.1038/s41467-019-13647-8
51. Loi S, Michiels S, Salgado R, Sirtaine N, Jose V, Fumagalli D, et al. Tumor infiltrating lymphocytes are prognostic in triple negative breast cancer and predictive for trastuzumab benefit in early breast cancer: results from the FinHER trial. Ann Oncol. (2014) 25:1544–50. doi: 10.1093/annonc/mdu112
52. Amgad M, Sarkar A, Srinivas C, Redman R, Ratra S, Bechert CJ, et al. Joint region and nucleus segmentation for characterization of tumor infiltrating lymphocytes in breast cancer. Proc SPIE–the Int Soc Optical Eng. (2019) 10956. doi: 10.1117/12.2512892
53. Fu Y, Jung AW, Torne RV, Gonzalez S, Vöhringer H, Shmatko A, et al. Pan-cancer computational histopathology reveals mutations, tumor composition and prognosis. Nat Cancer. (2020) 1:800–10. doi: 10.1038/s43018-020-0085-8
Keywords: diffuse large B-cell lymphoma, histopathological images, clinical features, relapsed or refractory, deep learning
Citation: Ma D, Yuan Y, Miao X, Gu Y, Wang Y, Luo D, Fan M, Shi X, Xi S, Ji B, Xiang C and Liu H (2025) Predicting the risk of relapsed or refractory in patients with diffuse large B-cell lymphoma via deep learning. Front. Oncol. 15:1480645. doi: 10.3389/fonc.2025.1480645
Received: 14 August 2024; Accepted: 31 January 2025;
Published: 03 March 2025.
Edited by:
J. Luis Espinoza, Kanazawa University, JapanReviewed by:
Viet Hoang Nguyen, Hanoi Medical University, VietnamMichael Goldberg, BostonGene, Inc, United States
Nikita Kotlov, BostonGene, Inc, United States, in collaboration with reviewer MG
Copyright © 2025 Ma, Yuan, Miao, Gu, Wang, Luo, Fan, Shi, Xi, Ji, Xiang and Liu. This is an open-access article distributed under the terms of the Creative Commons Attribution License (CC BY). The use, distribution or reproduction in other forums is permitted, provided the original author(s) and the copyright owner(s) are credited and that the original publication in this journal is cited, in accordance with accepted academic practice. No use, distribution or reproduction is permitted which does not comply with these terms.
*Correspondence: Hui Liu, aGxpdUB4emhtdS5lZHUuY24=
†These authors have contributed equally to this work and share first authorship