- 1Department of Integrative Medicine, Yonsei University College of Medicine, Seoul, Republic of Korea
- 2Medical Physics and Biomedical Engineering Lab (MPBEL), Yonsei University College of Medicine, Seoul, Republic of Korea
- 3Department of Radiation Oncology, Yonsei Cancer Center, Heavy Ion Therapy Research Institute, Yonsei University College of Medicine, Seoul, Republic of Korea
- 4Department of Radiation Oncology, Gangnam Severance Hospital, Yonsei University College of Medicine, Seoul, Republic of Korea
- 5Department of Radiation Oncology, Yongin Severance Hospital, Yonsei University College of Medicine, Yongin, Republic of Korea
- 6Department of Biomedical Sciences, Seoul National University College of Medicine, Seoul, Republic of Korea
- 7Oncosoft Inc., Seoul, Republic of Korea
Purpose: This study presents novel quality assurance (QA) approach for volumetric modulated arc therapy (VMAT) that leverages frame-by-frame electronic portal imaging device (EPID) images integrated into Mobius3D for accurate three-dimensional dose calculations.
Methods: Sequential EPID images for VMAT plans were acquired every 0.4-second by iView system and processed through iterative deconvolution to mitigate blurring from photon scattering. Deconvolved images were binarized to define multi-leaf collimator (MLC) positions. Pre-acquired box fluences determined optimal threshold for binarization and adjusted for detector shift depending on gantry and collimator angles. Sequential EPID images were re-scaled using pixel scaling factor (PSF) and converted to monitor unit (MU) proportional values. Generated EPID-based log file, including control-point specific MLC and monitor units (MU) information, were analyzed in Mobius3D for Gamma passing rate (GPR) of VMAT plans from 18 patients. Plan complexity indices were calculated and correlated with GPR.
Results: Clinically appropriate threshold was defined to be 20000 that can extract accurate MLC data from the deconvolved binarized EPID images. Positional deviations due to gantry and collimator rotations were observed to be up to 4.5 pixels. Recalibrated EPID pixel values showed linearity with MU regardless of changes in dose rate. Consequently, average GPR for 18 patients evaluated using Mobius3D reached 95.2% ± 3.7%%, based on 3% dose difference and 3mm distance-to-agreement criterion. It was found that two plan complexity indices showed statistically significant correlation with GPR.
Conclusion: This study successfully implemented novel measurement-based VMAT QA framework based on control-point specific EPID, based upon accurate MLC and MU data at each frame.
1 Introduction
Intensity-Modulated Radiation Therapy (IMRT) and volumetric modulated arc therapy (VMAT) represent advanced techniques in radiation therapy that allow for irradiate optimized dose to cancerous tissues while sparing the surrounding healthy tissue (1–4). The inherent complexity of these techniques occurs from their ability to modulate the intensity of the radiation beam and adjust the shape of the beam in real-time through the movement of multi-leaf collimator (MLC) (5, 6). Additionally, VMAT enhances this complexity by shifting the speed of the gantry rotation and the dose rate during the treatment, which necessitates sophisticated planning and execution strategies to achieve the desired therapeutic outcomes (7, 8). The precision of these therapies, while beneficial for patient care, underscores the critical need for comprehensive quality assurance (QA) protocols to ensure that the planned treatment is delivered accurately (9–11).
QA methods for treatment plans with intensity modulation, IMRT and VMAT, can be categorized into four techniques: measurement-based, detector-based, electronic portal imaging device (EPID)-based, and log-based methods. The measurement-based method employing film and ion chambers is the most trustworthy, while being labor-intensive with special care on phantom and ion chambers (12, 13). The detector-based method with 2D array diodes or ion chambers can provide more efficient measurement conditions, which still requires time and effort for detector setup (9, 14). In contrast, EPID-based method does not need additional measurement equipment, thus offering a quick and simple process. However, most commercialized systems acquire and analyze 2D composite fluences even for the arc-based treatment plans, disabling for detecting errors of dose deliverability in control point-specific fashion (15). The log-based method, relying on the recorded machine log files that include MLC and monitor units (MU) information at the time of acquisition, is known to be powerful and efficient. It can also provide independent 3D dose recalculation with actual equipment parameters (16, 17). Despite the conveniences, the indirect QA process may occasionally fail to detect MLC positional errors, which could lead to biased QA results (18).
This work presents a new VMAT QA method based on 2D sequential EPID images. The hybrid QA strategy is featured to integrate the advantages of both EPID and log-based QA approaches that potentially implements a fast and convenient measurement-based QA approach without compromising patient safety and treatment effectiveness. It begins with capturing control-point specific 2D sequential EPID images, which are used to precisely extract MLC positions and MU information during the dose delivery. Using this information, we generate a log file reflective of the MLC and MU details from the EPID images, which is then fed into a commercial QA software device to perform comprehensive IMRT QA analysis.
2 Methods
2.1 2D sequential EPID-based QA framework
Figure 1 depicts the overall framework of our proposed sequential EPID images-based VMAT QA method, compared to the existing log-based QA method provided by Mobius 3D version 4.0.2 (Varian Medical System, Palo Alto, CA, USA). Basically, the previous approach performed the dose calculation for QA analysis with reference to the MLC and MU information saved in the machine log file following dose delivery. The proposed framework leveraged the sequential EPID images to obtain MLC and MU information during the dose delivery of VMAT rotational arc plans. The 2D EPID images acquired were processed by a de-convolution algorithm that can reduce the blurring effect caused by photon scattering. The de-blurred EPID images were then binarized to extract MLC positions at each time frame. The intensity of the images was adjusted by a specific indicator named pixel scaling factor (PSF) stored in the EPID log file, ensuring the proportionality to MU. The extracted MLC and MU information was fed into the Mobius3D software for comprehensive VMAT QA analysis. The details of each process were specified in the subsequent sections. All computational tasks, including the EPID image processing and the creation of the EPID-based log file, were performed using an in-house software in MATLAB version 9.13 (R2022b, Mathworks Inc., Natick, MA, USA).
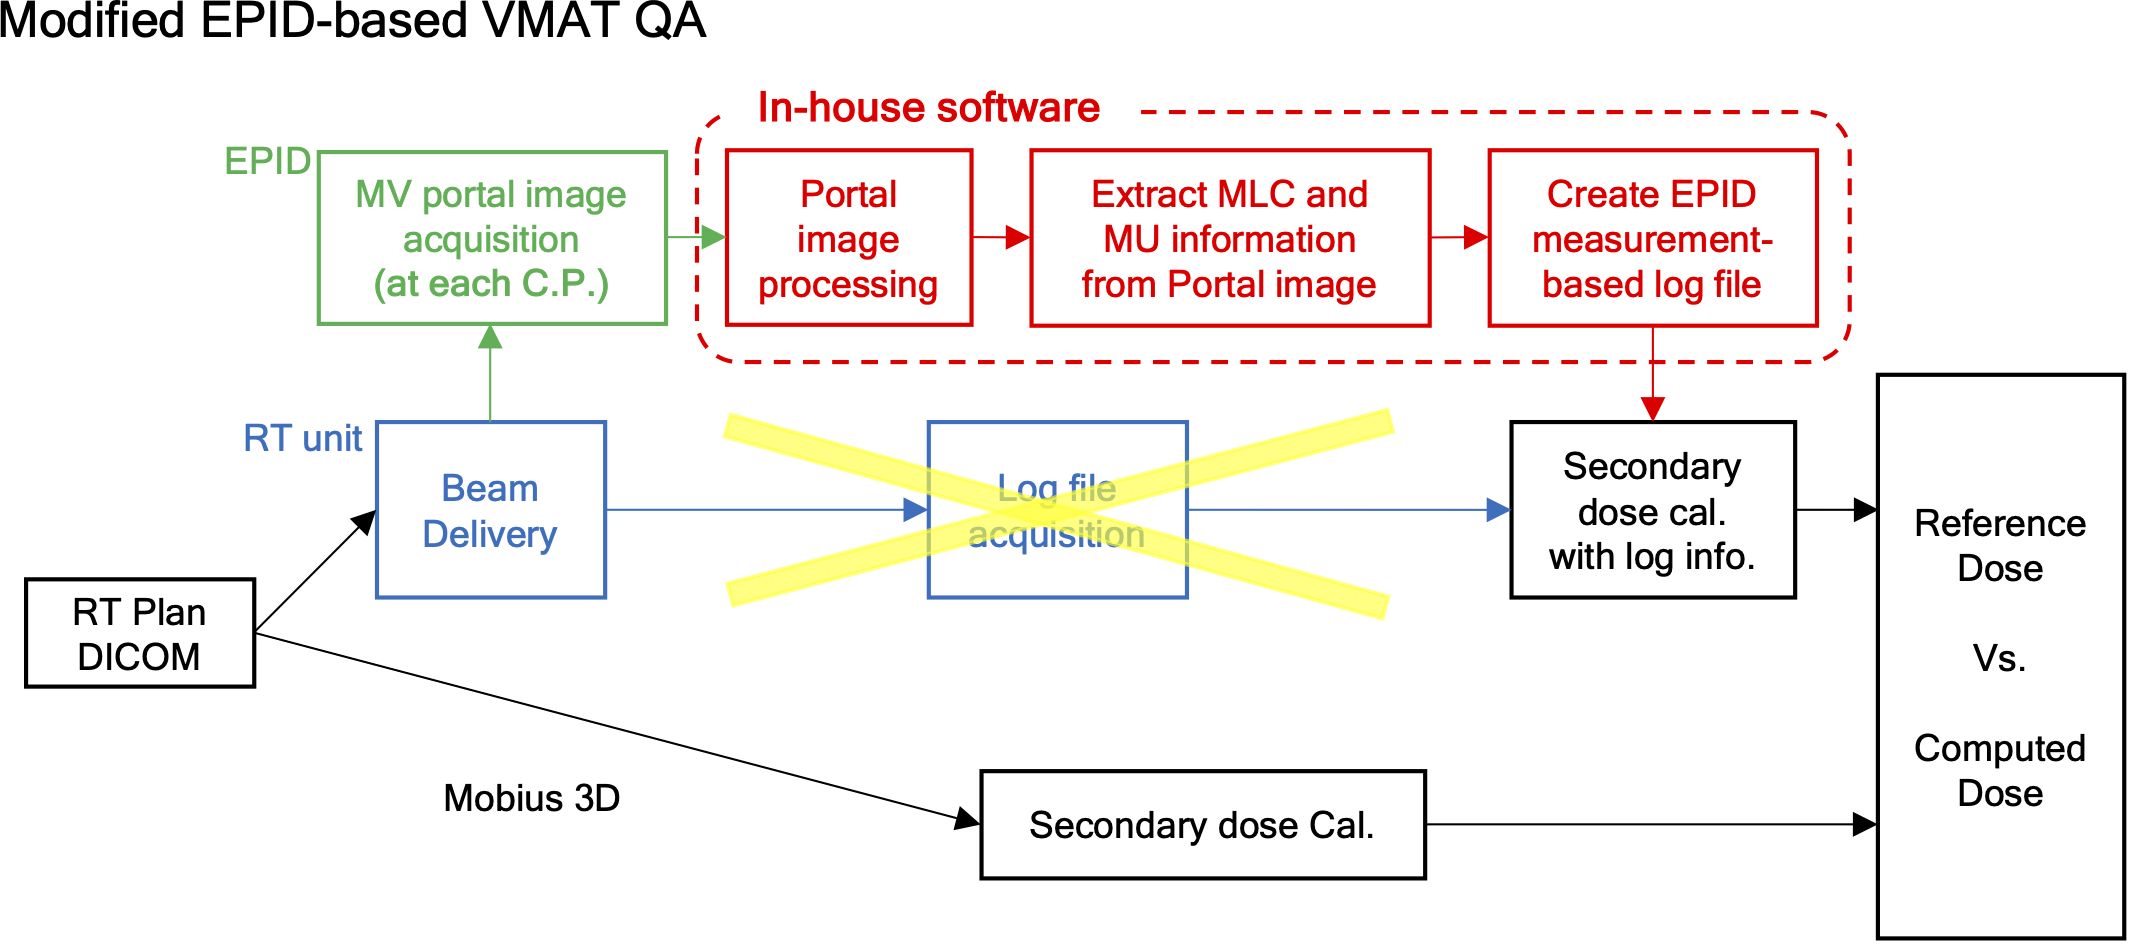
Figure 1. Framework of measurement-based control-point specific VMAT QA method based on EPID images.
2.2 MV EPID image acquisition
The execution of our proposed workflow necessitates the precise extraction of MLC positional information and MU at each 2D sequential EPID image. EPID images used for developing the proposed framework were acquired by the iView GT a-SI EPID equipped in Harmony (Elekta, Stockholm, Sweden). The iCom mode in iView GT generated the sequential 2D EPID images on a frame-by-frame basis at approximately 0.3-second time intervals with a resolution of 512 × 512 pixels in JPEG format. Also, it produced a single EPID log file, containing information of EPID acquisition time, total number of 2D sequential images, and PSF required for rescaling the EPID images. The number of spatially uniform control points designated in the RT plan DICOM files did not equal the number of temporally uniform control points in the EPID acquisition, in which the latter was greater than the former.
2.3 MV EPID image processing
Due to the original calibration performed in iView GT image acquisitions, the initial raw EPID images (EPIDraw) were normalized to fit a 16-bit format whose values were inversely proportional to actual dose of radaition. To obtain an EPID image proportional to the dose (EPIDprocessed), the raw pixel value of the EPIDraw is subtracted from 65535 (216 -1).
The EPIDprocessed was blurred by various scattered photons and a distribution that does not accurately reflect the incident photon fluence, requiring additional image processing (19). To convert EPIDprocessed to incident photon fluence, we employed a deconvolution algorithm with a Gaussian kernel, specifically through a 2D iterative deconvolution method (20). The blurred EPID image is mathematically represented as the convolution of true, incident photon fluence (EPIDtrue in Equation 2) with a two-dimensional point-spread kernel (K in Equation 2).
The algorithm was performed by updating the blurred image (EPIDapprox(n)) from the true incident EPID image (EPIDapprox(0, n)), as seen in Equation 3. Then, the incident deblurred EPID image (EPIDapprox(n)) was updated with the newly defined the blurred image (EPIDapprox(n)), as expressed in Equation 4.
It began iterating with an initial guess to be EPIDapprox(0,1) = EPIDprocessed, and stopped iterating until the difference between the updated blurred image (EPIDapprox(n)) and the given blurred image (EPIDprocessed) became saturated. The finally updated 2D EPID image (EPIDapprox.(0,n+1)) was defined to be the deconvolved EPID image (EPIDdeconv) that closely represents the incident photon fluence.
2.4 Extraction of MLC and MU Information from EPID Images
The de-convolved image (EPIDdeconv) needed to be binarized to extract MLC positional information, in which the appropriate threshold value needs to be considered. To find a clinically available value, we acquired EPIDdeconv of box-shaped fluences with different dimensions: 5 × 5, 10 × 10, 15 × 15, and 20 × 20 cm2. The four EPIDdeconv images with different field sizes were binarized using values from 40% to 60% of the maximum pixel value of the EPID images, in which the range of the thresholding operation was empirically determined. As specified in Figure 2, the optimal threshold was chosen, such that the number of pixels in the cross-plane direction of EPIDdeconv for 10 × 10 cm², 15 × 15 cm², and 20 × 20 cm² can hold linearity of 2 times, 3 times, and 4 times, respectively, compared to the number of pixels in the cross-plane direction of EPIDdeconv for 5 × 5 cm².
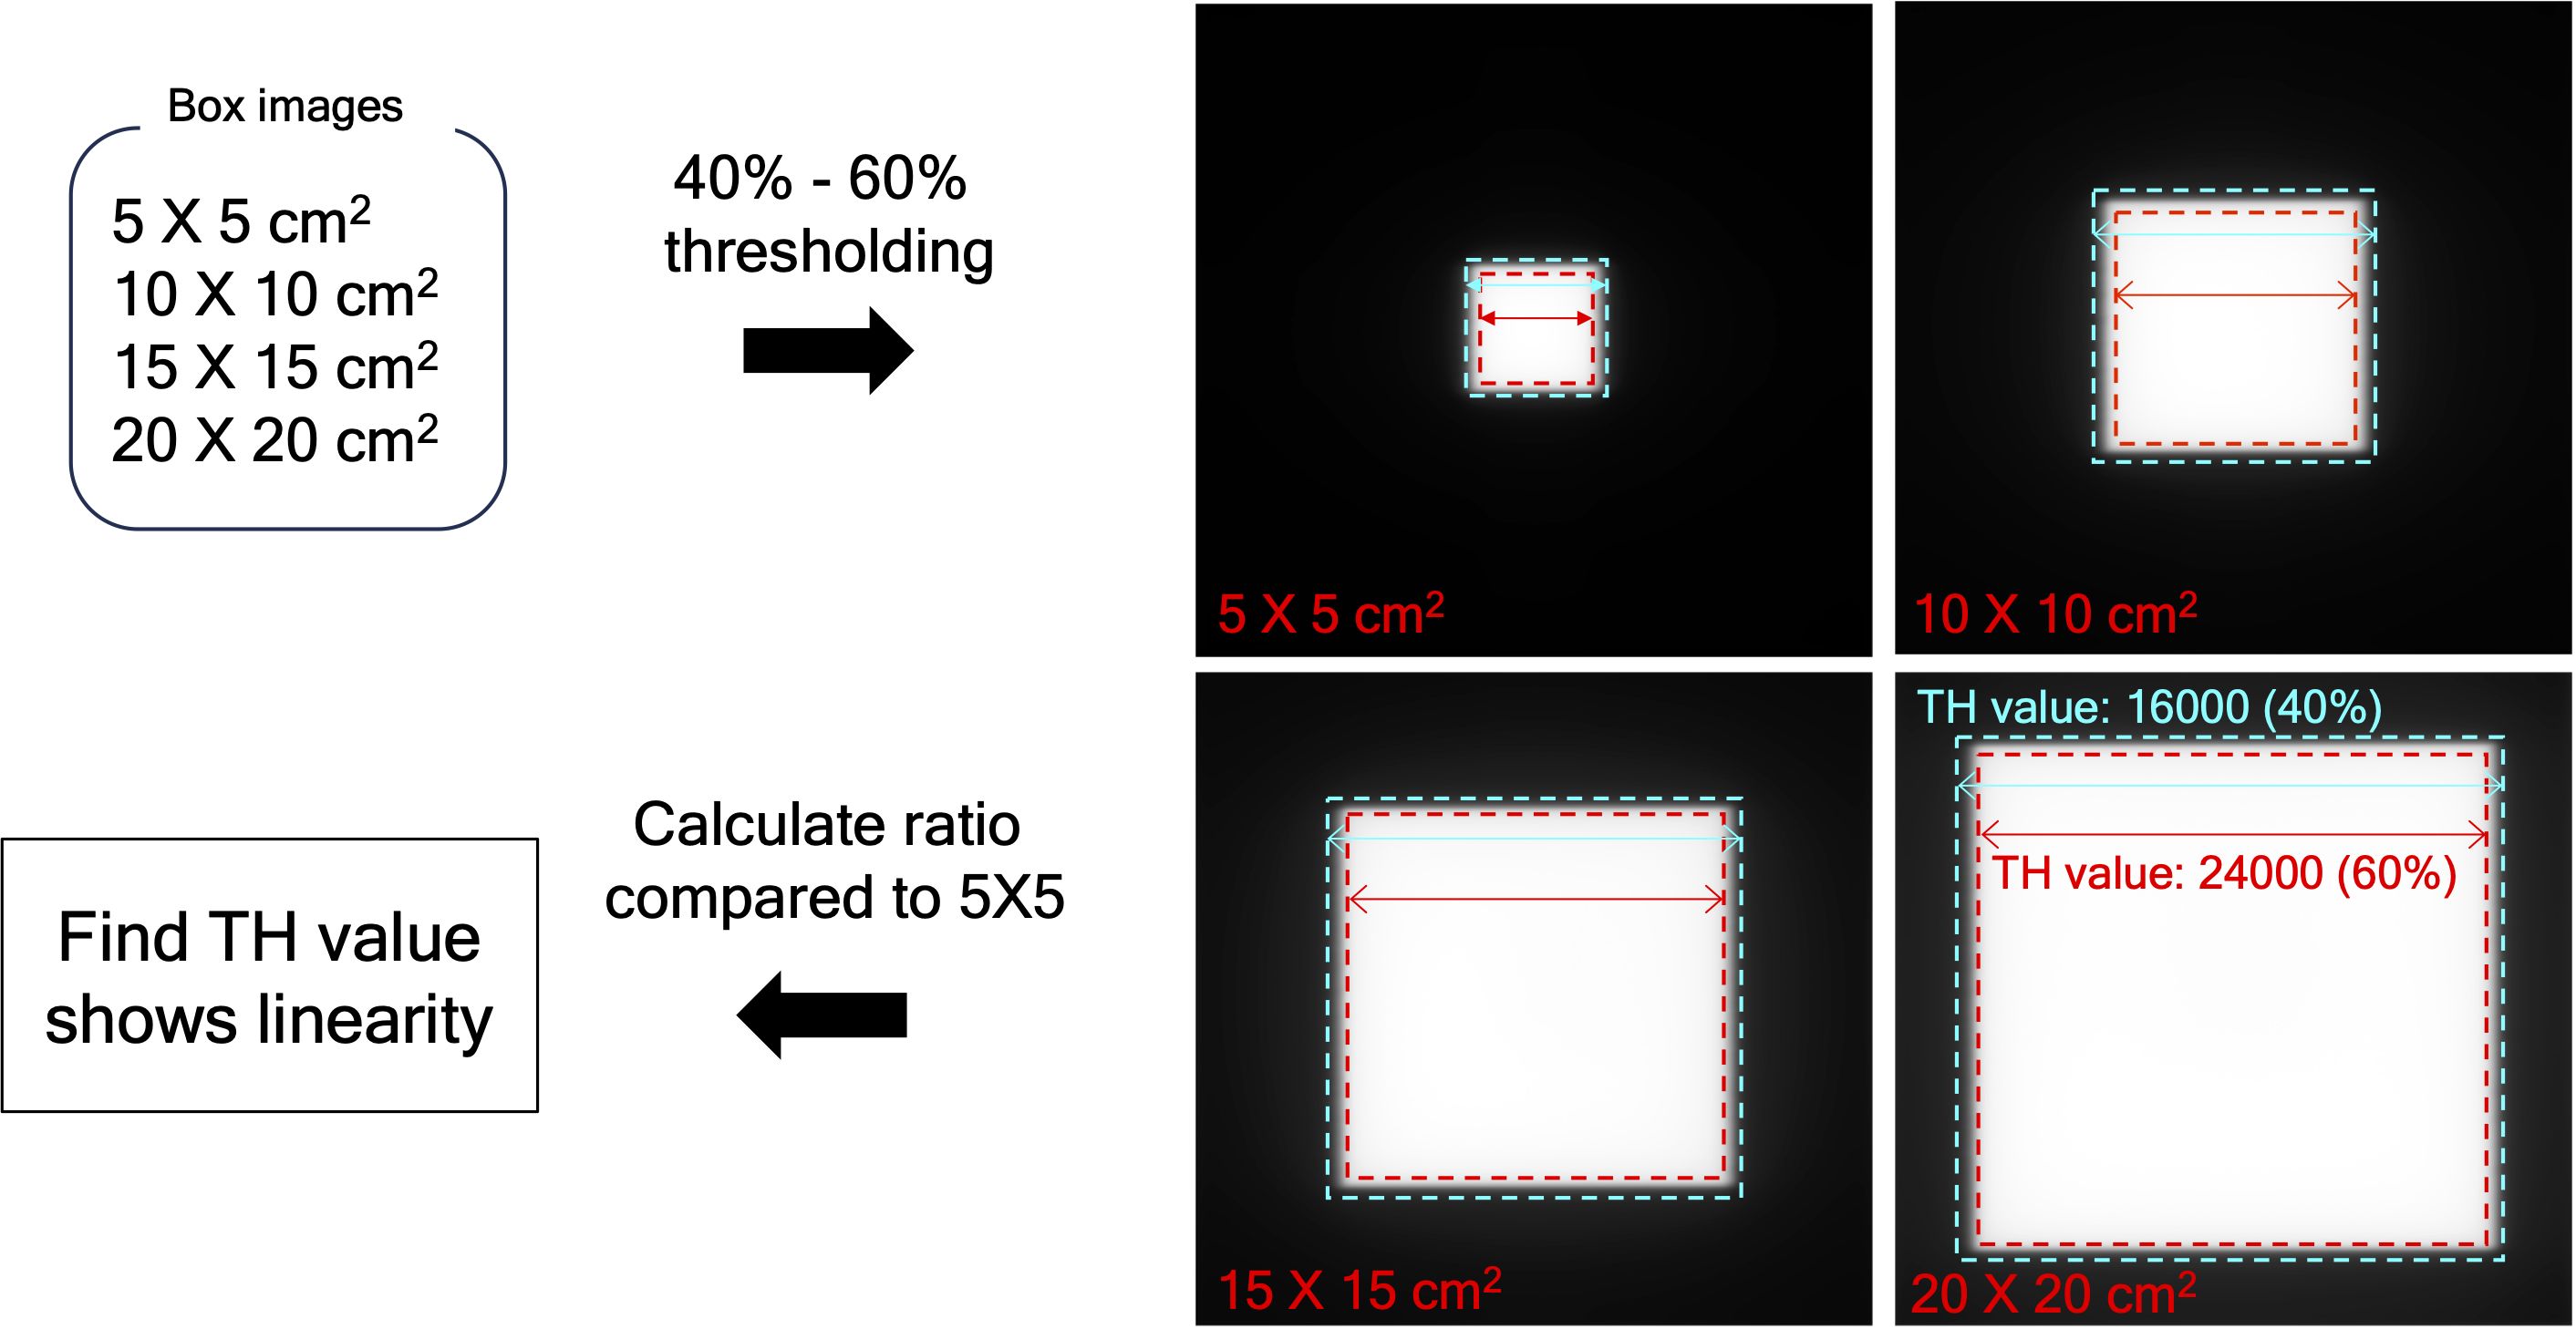
Figure 2. Determine the appropriate threshold value, using EPID image of box-shaped fluences with four dimensions by thresholding between 40% to 60% of the maximum pixel value. The range was found to maintain the quality of the binarized images consistently.
Another issue to be considered was a mechanical EPID detector shift from gantry and collimator rotations in VMAT treatment, potentially propagating errors in MLC positional information. To maintain consistent accuracy in identifying MLC positional information, a variety of EPID images were obtained with a standard 10 × 10 cm2 field dimension, while changing the gantry and collimator rotating angles. We have divided the sources of the imaging center offset values into two factors: 1) EPID detector sagging during the gantry angle rotation and 2) additional center shift from collimator rotation. EPID detector sagging from gantry rotation is unavoidable, inherent element that can affect the EPID image center shift, being independent of the collimator rotation. As illustrated in Figure 3A, the gantry angles varied from 0 to 350 degrees with 10-degree intervals to account for this. To additionally capture the secondary factor being affected by the collimator rotation, the EPID images were acquired at different collimator angles from -90 to 90 degrees in 30-degree intervals for each gantry angle, while the gantry angle changes from 0 to 330 degrees with 30-degree intervals, as illustrated in Figure 3B.
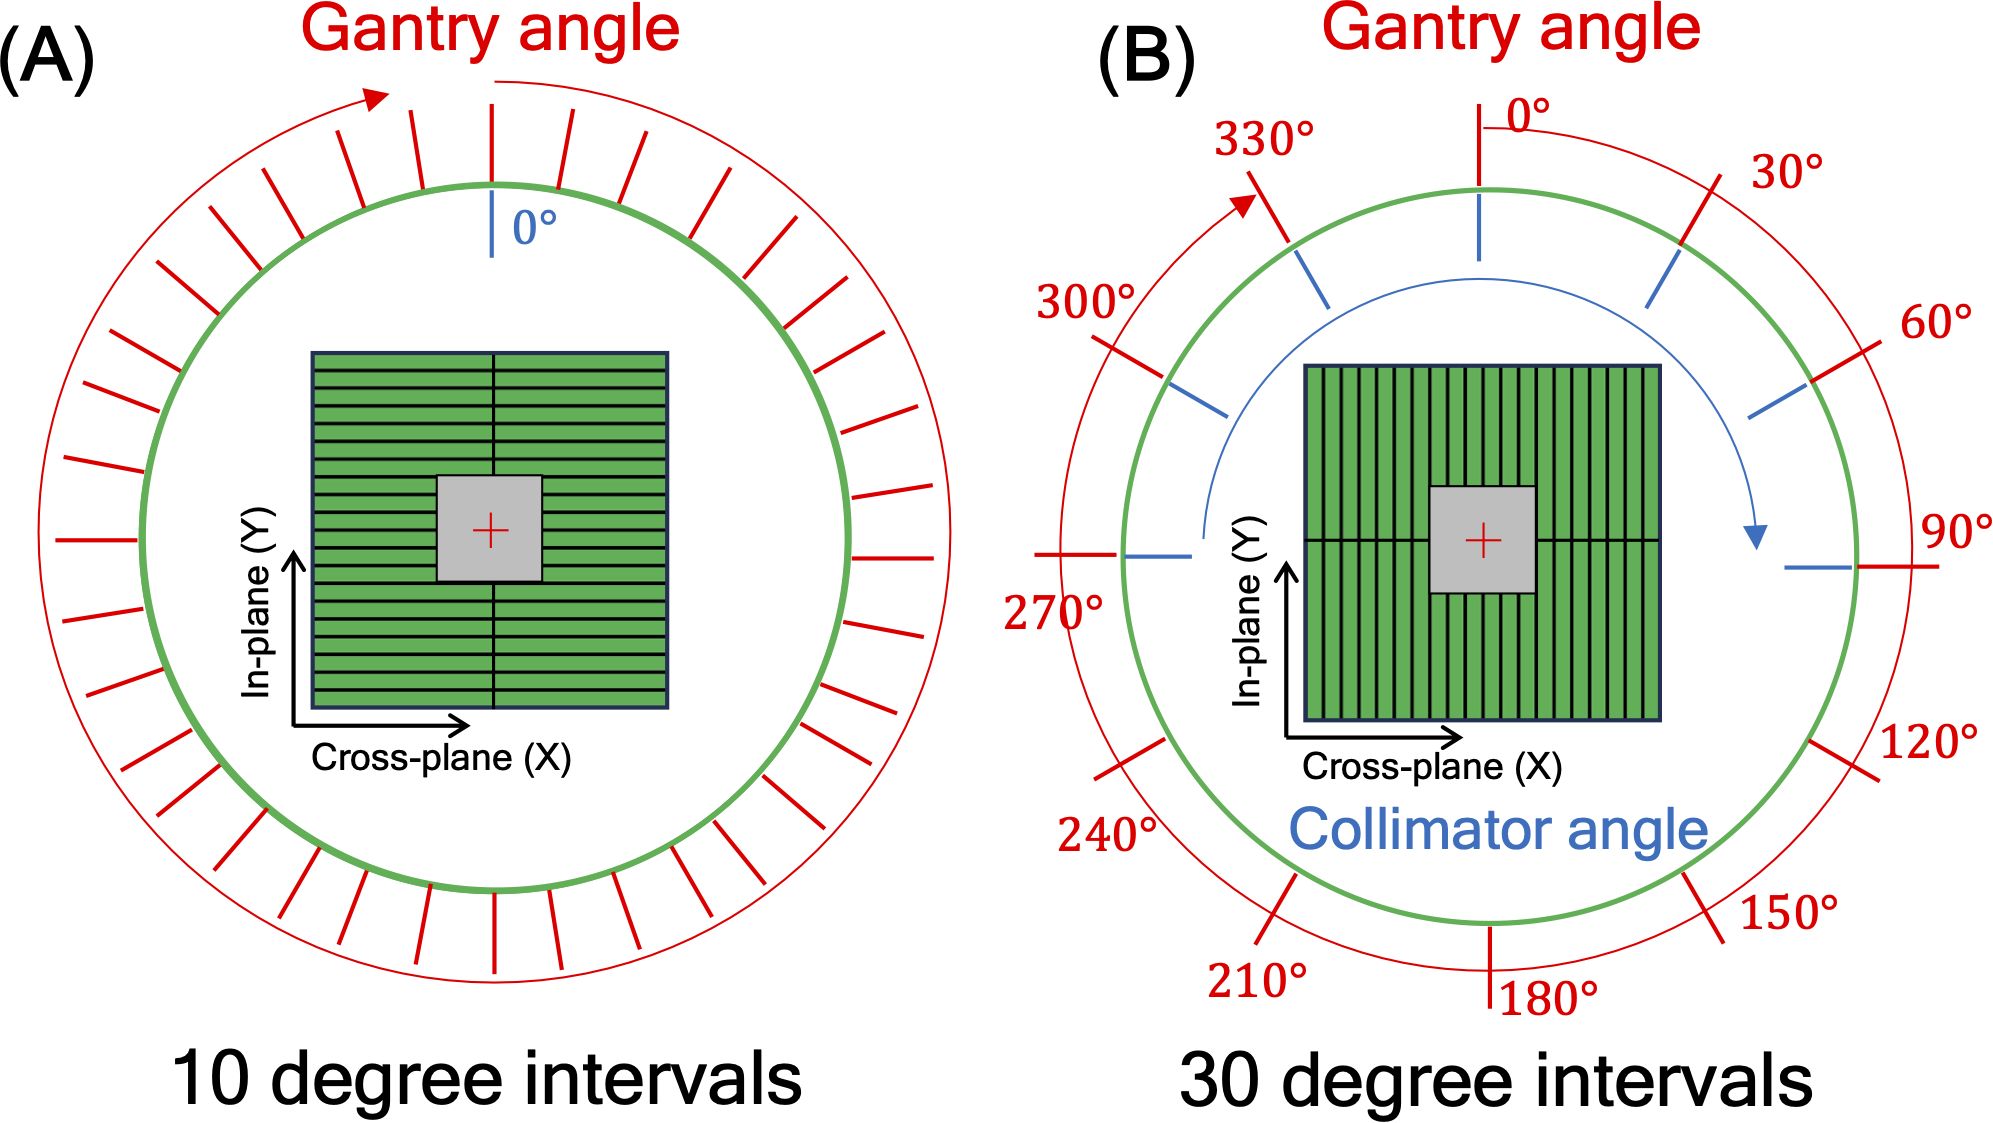
Figure 3. illustration of 10×10 cm2 box fluence used to calculate imaging center offset values to address (A) EPID detector sagging during the gantry angle rotation, and (B) additional center shift of EPID detector from collimator and gantry angle rotation. For offset value of EPID detector sagging, the gantry angles varied from 0 to 350 degrees with 10-degree intervals. For offset value of additional center shift, the gantry angles were adjusted in 30-degree intervals from 0 to 330 degrees, and for each gantry angle, the collimator angles were adjusted from -90 to 90 degrees in 30-degree intervals.
The intensity of actual dose, represented by MU, needed to be specified at each 2D sequential EPID images. The raw EPID images were re-scaled by Equation 1 to keep the proportionality to the dose of radiation. The actual intensity could be converted by referring to aforementioned frame-specific value, PSF (21). Equation 5 shows the conversion of the EPID image intensity to the effective global MU equivalent value (EPIDMU).
To assess the reliability of MU obtained via EPIDMU, we conducted a MU linearity check. Specifically, it was assessed by ensuring the linearity of the MU equivalent values of two different sets of EPID images at 10 × 10cm2 field dimension, while changing the different MUs (1, 2, 3, 5, 10, 20, and 100 MUs) and different dose rates of 100, 300, and 500 MU/min. in delivering 100 MU.
2.5 Evaluation
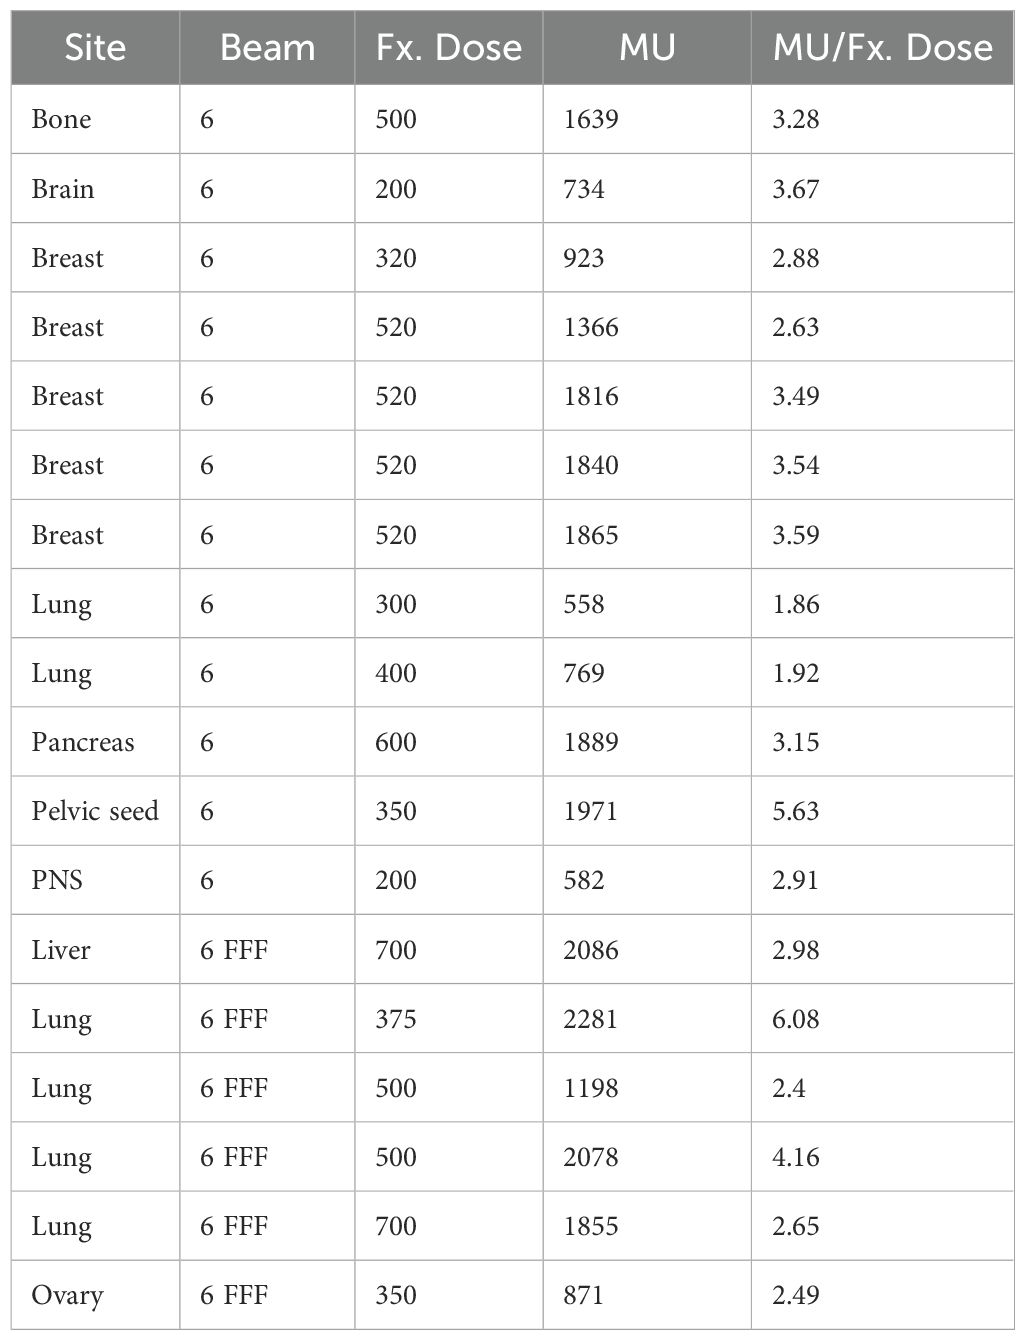
The datasets used for this retrospective study were approved by the institutional review board of the Yonsei University Severance Hospital, Korea (4-2021-0869), which waived the need for informed patient consent to use patient-specific information of RT images, structures, dose and plan. To verify that the proposed QA method was properly implemented, we acquired sequential EPID images from eighteen VMAT plans using a 6 MV and 6 MV flattening filter free (FFF) beam energies with various body sites, as shown in Table 1. For each case, the MLC positional information and MU values extracted from the sequential EPID images was capsulized into a dynalog file-type format that is compatible to the Mobius 3D QA software. This allowed for conducting comprehensive VMAT QA analyses provided by the software, including 3D dose calculation and quantification of gamma passing rate (GPR). The patient-specific VMAT QA results were assessed by GPR at 3%/3 mm criterion for the 18 cases.
To investigate the correlation between the complexity of the given VMAT plans and the deliverability of the VMAT plans (quantified by GPR), we calculated several plan complexity metrics using the open-source algorithm, available on GitHub (22) (http://github.com/AurelienCD/DeepHybridLearning_RadiotherapyQA_Depository_ManuscriptID_Diagnostics), which has been employed for previous studies (23–25). This work computed six plan complexity indices as follows: small aperture score (SAS), leaf travel (LT), modulation complexity score for VMAT plans (MCSv), combination of LT and MCSv (LTMCS), aperture area variability (AAV), and leaf sequence variability (LSV). SAS measures the proportion of small fields within a treatment plan. LT quantifies the total distance that MLC leaves travel during the delivery of a radiation therapy plan. MCSv evaluates the degree of modulation in the treatment, considering factors like variation in dose rate, gantry speed, and MLC positions across the arc of treatment. LTMCS combines the metrics of LT and MCSv to reflects both geometric changes in MLC positioning and the modulation of dose delivery. AAV measures the variability in the size of the apertures throughout the treatment. LSV evaluates the changes in leaf sequences and configuration during treatment. The plan complexity is interpreted to be incremental with larger SAS value and lower values of LT, MCSv, LTMCS, AAV, and LSV. Additionally, from the plan DICOM file, the MU and MLC information was employed for analyzing the plan complexity. We computed averaged mean and maximum MLC traveling distance (‘Mean_mean_MLC’ and ‘Mean_max_MLC’) between two consecutive control points of VMAT plans including standard deviations of those (‘STD_mean_MLC’ and ‘STD_max_MLC’). The average MU difference (Mean_MU) between two consecutive control points and its standard deviation (STD_MU) were also extracted. The correlation between twelve complexity indices and the gamma passing rate of each plan was assessed using Spearman’s rank correlation test. Spearman’s rank correlation test was performed in R version 4.3.3 (R foundation for Statistical Computing, Vienna, Austria).
3 Result
3.1 MLC and MU information extraction from sequential EPID images
Table 2 shows linearity of the pixel counts of cross-plane of EPIDdeconv of box-shaped fluence with dimension of 5 × 5 cm2, 10 × 10 cm2, 15 × 15 cm2, 20 × 20 cm2. This analysis revealed optimal linearity within the threshold range of 19800 to 20200. Consequently, we selected the midpoint, 20000, as the threshold value, facilitating accurate MLC positional extraction from the EPID images. Figure 4 shows the effect of deconvolution applied to EPIDprocessed. The EPIDdeconv shows sharper edges than before it was applied, and the effect is more noticeable after the threshold is taken. Additionally, GPR calculated by Mobius3D shows better result when the deconvolution is performed. The imaging center offset values are calculated. The EPID detector sagging during the gantry angle rotation induces an offset ranging from -3.0654 to 0.4218 pixels on the left bank and from -2.5 to 1 pixel on the right bank in the cross-plane direction, as shown in Figure 5A. Additionally, an offset between -4.5 to 0 pixels is observed at the upper edge of the leaf in the in-plane direction, with an offset of -3.7792 to 0.2208 pixels at the lower edge of the leaf, as shown in Figure 5B. Regarding the shift in center of the EPID images caused by rotation of the collimator angles for the respective gantry angles, an offset is generated ranging from -10 pixels to 5 pixels in the cross-plane direction and from -7.5 pixels to 5.5 pixels in the in-plane direction, as shown in Figure 6. Figure 7A shows that the pixel values converted to EPIDMU held linearity to the MUs delivered across 1, 2, 4, 10, 20, 50, and 100 MUs. Additionally, regardless of changes in dose rate, the pixel values of EPIDMU remain consistent at 100 MU as shown in Figure 7B.

Table 2. Linearity of the pixel counts of cross-plan of deconvolved EPID image of box-shaped fluence with dimension of 5×5 cm2, 10×10 cm2, 15×15 cm2, 20×20 cm2.
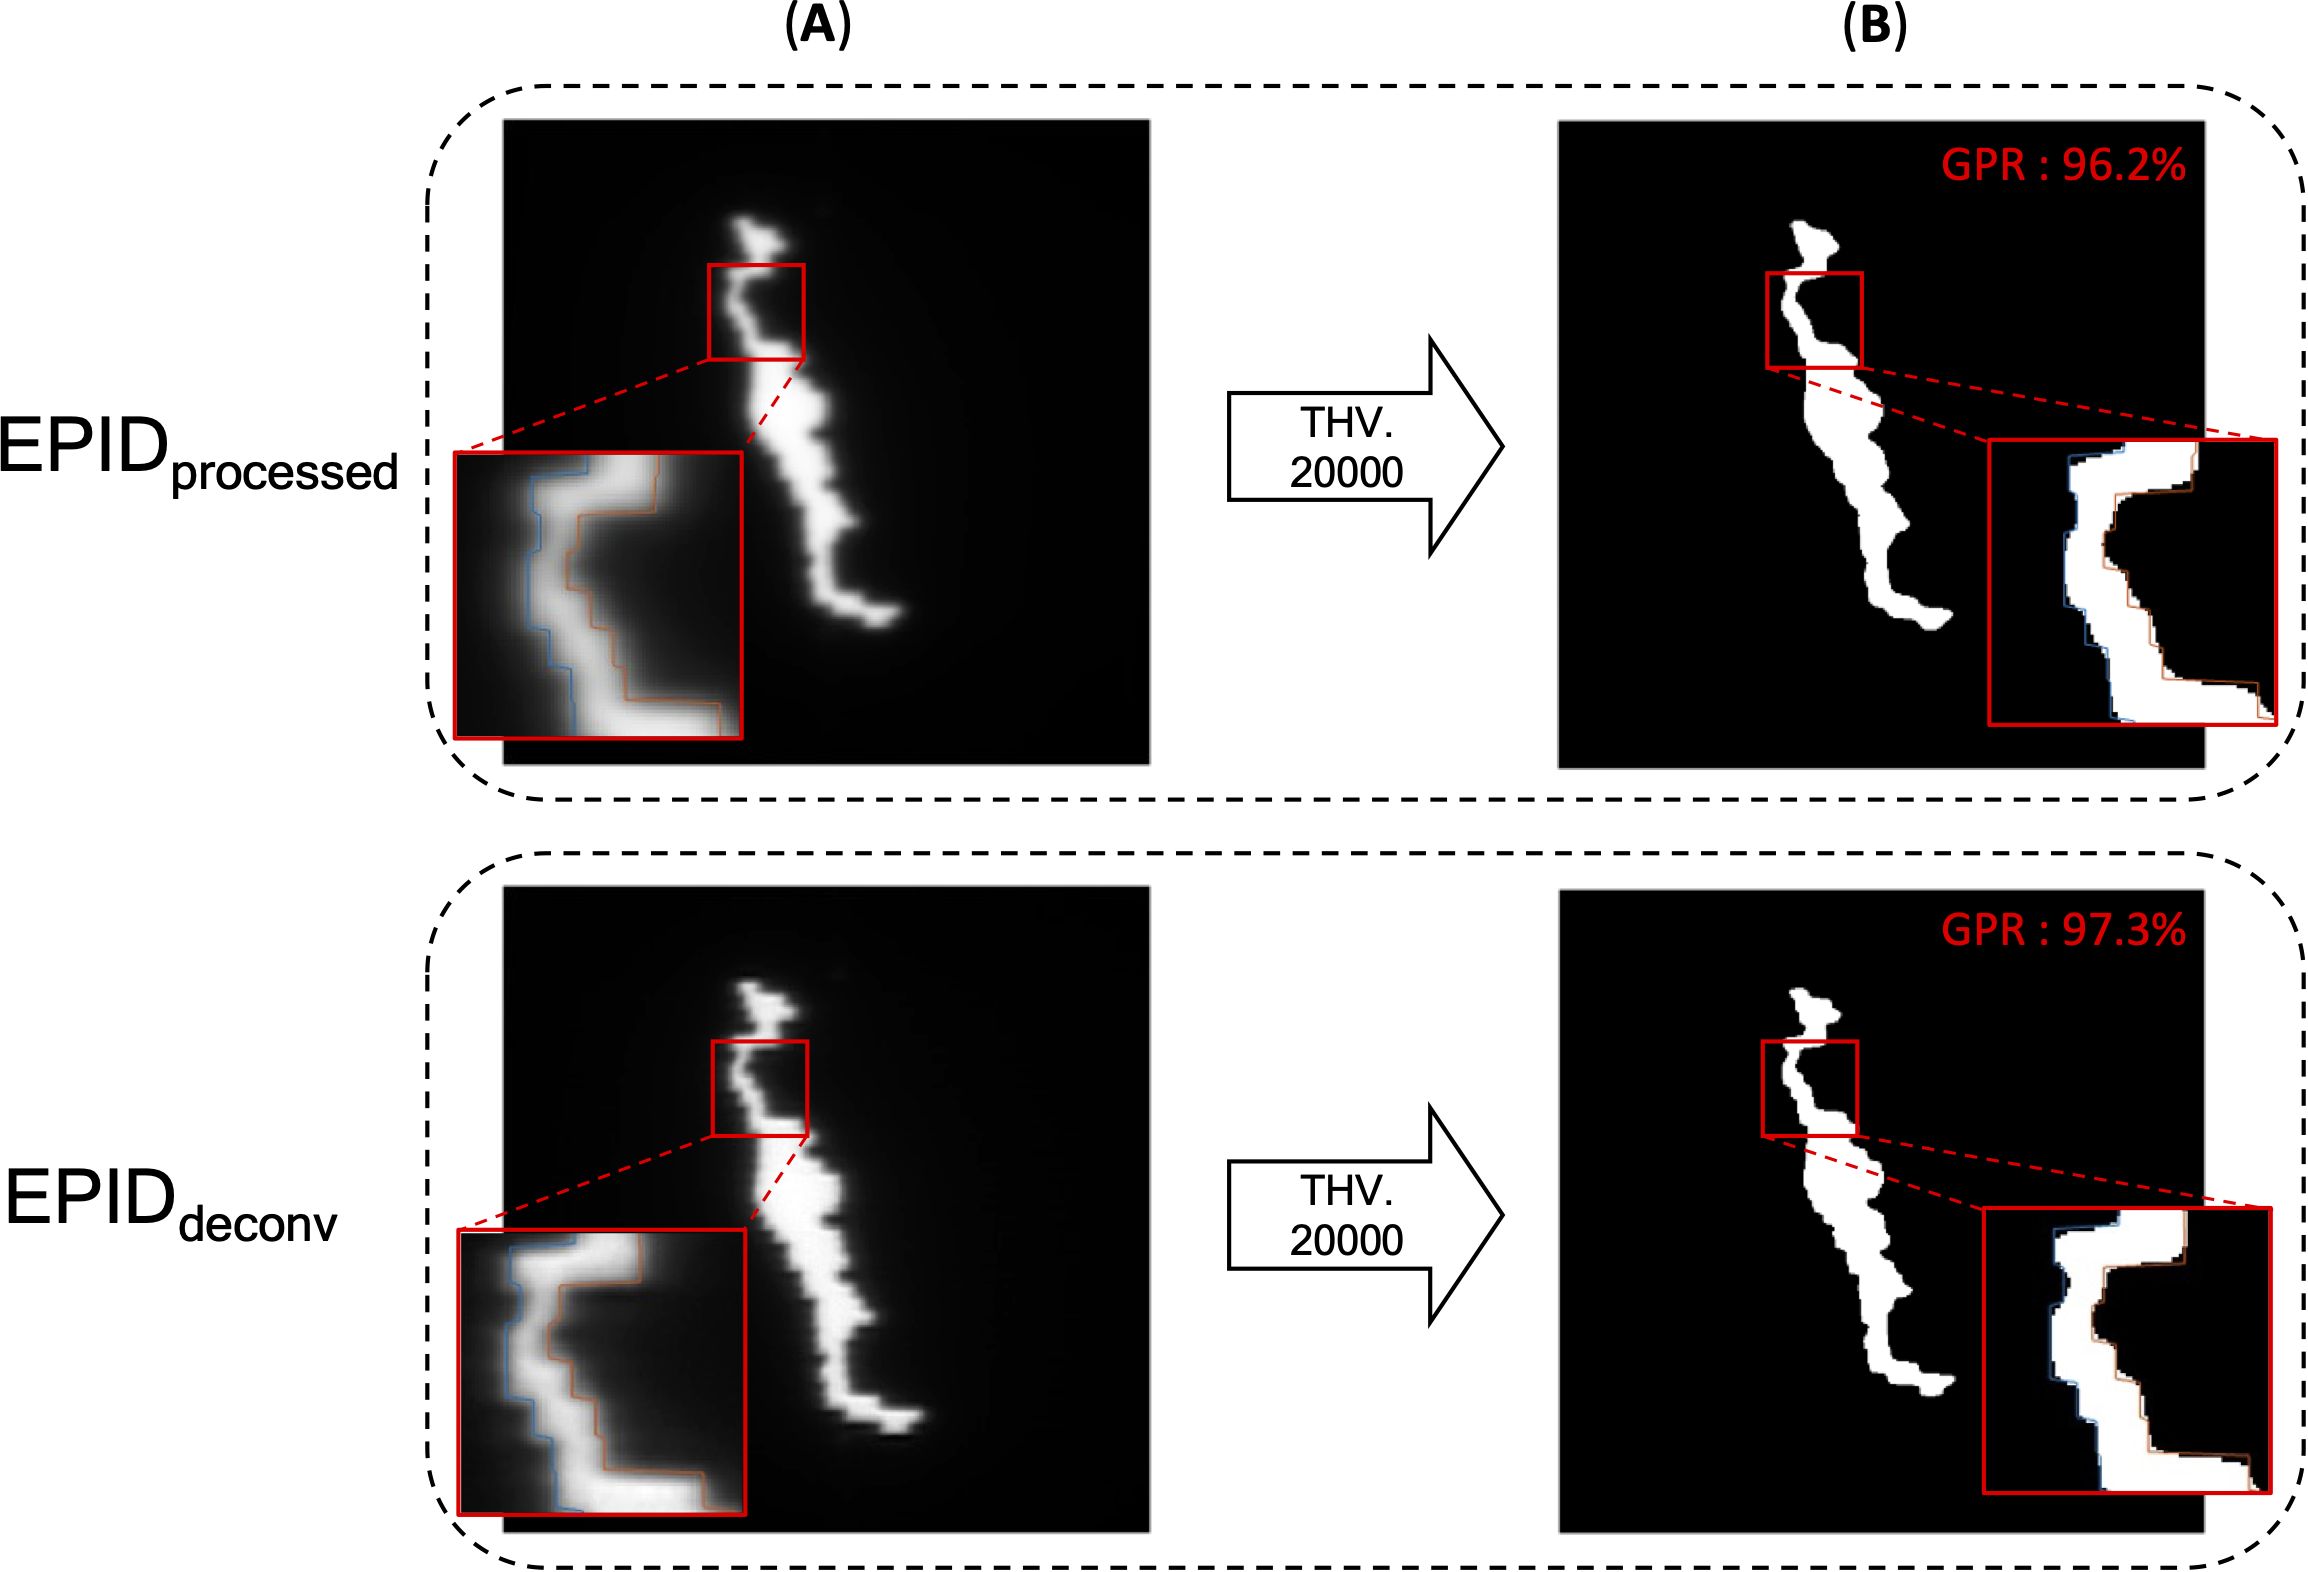
Figure 4. EPID images of before deconvolution (EPIDprocessed) and after deconvolution (EPIDdeconv) is performed. (A) EPID image before binarization, (B) binarized EPID images by adequate threshold value. In the enlarged part, one can see that the boundaries of the binarized image and the MLC position do not align as well as after the deconvolution is applied. Additionally, GPR calculated by Mobius3D shows better result when the deconvolution is performed.
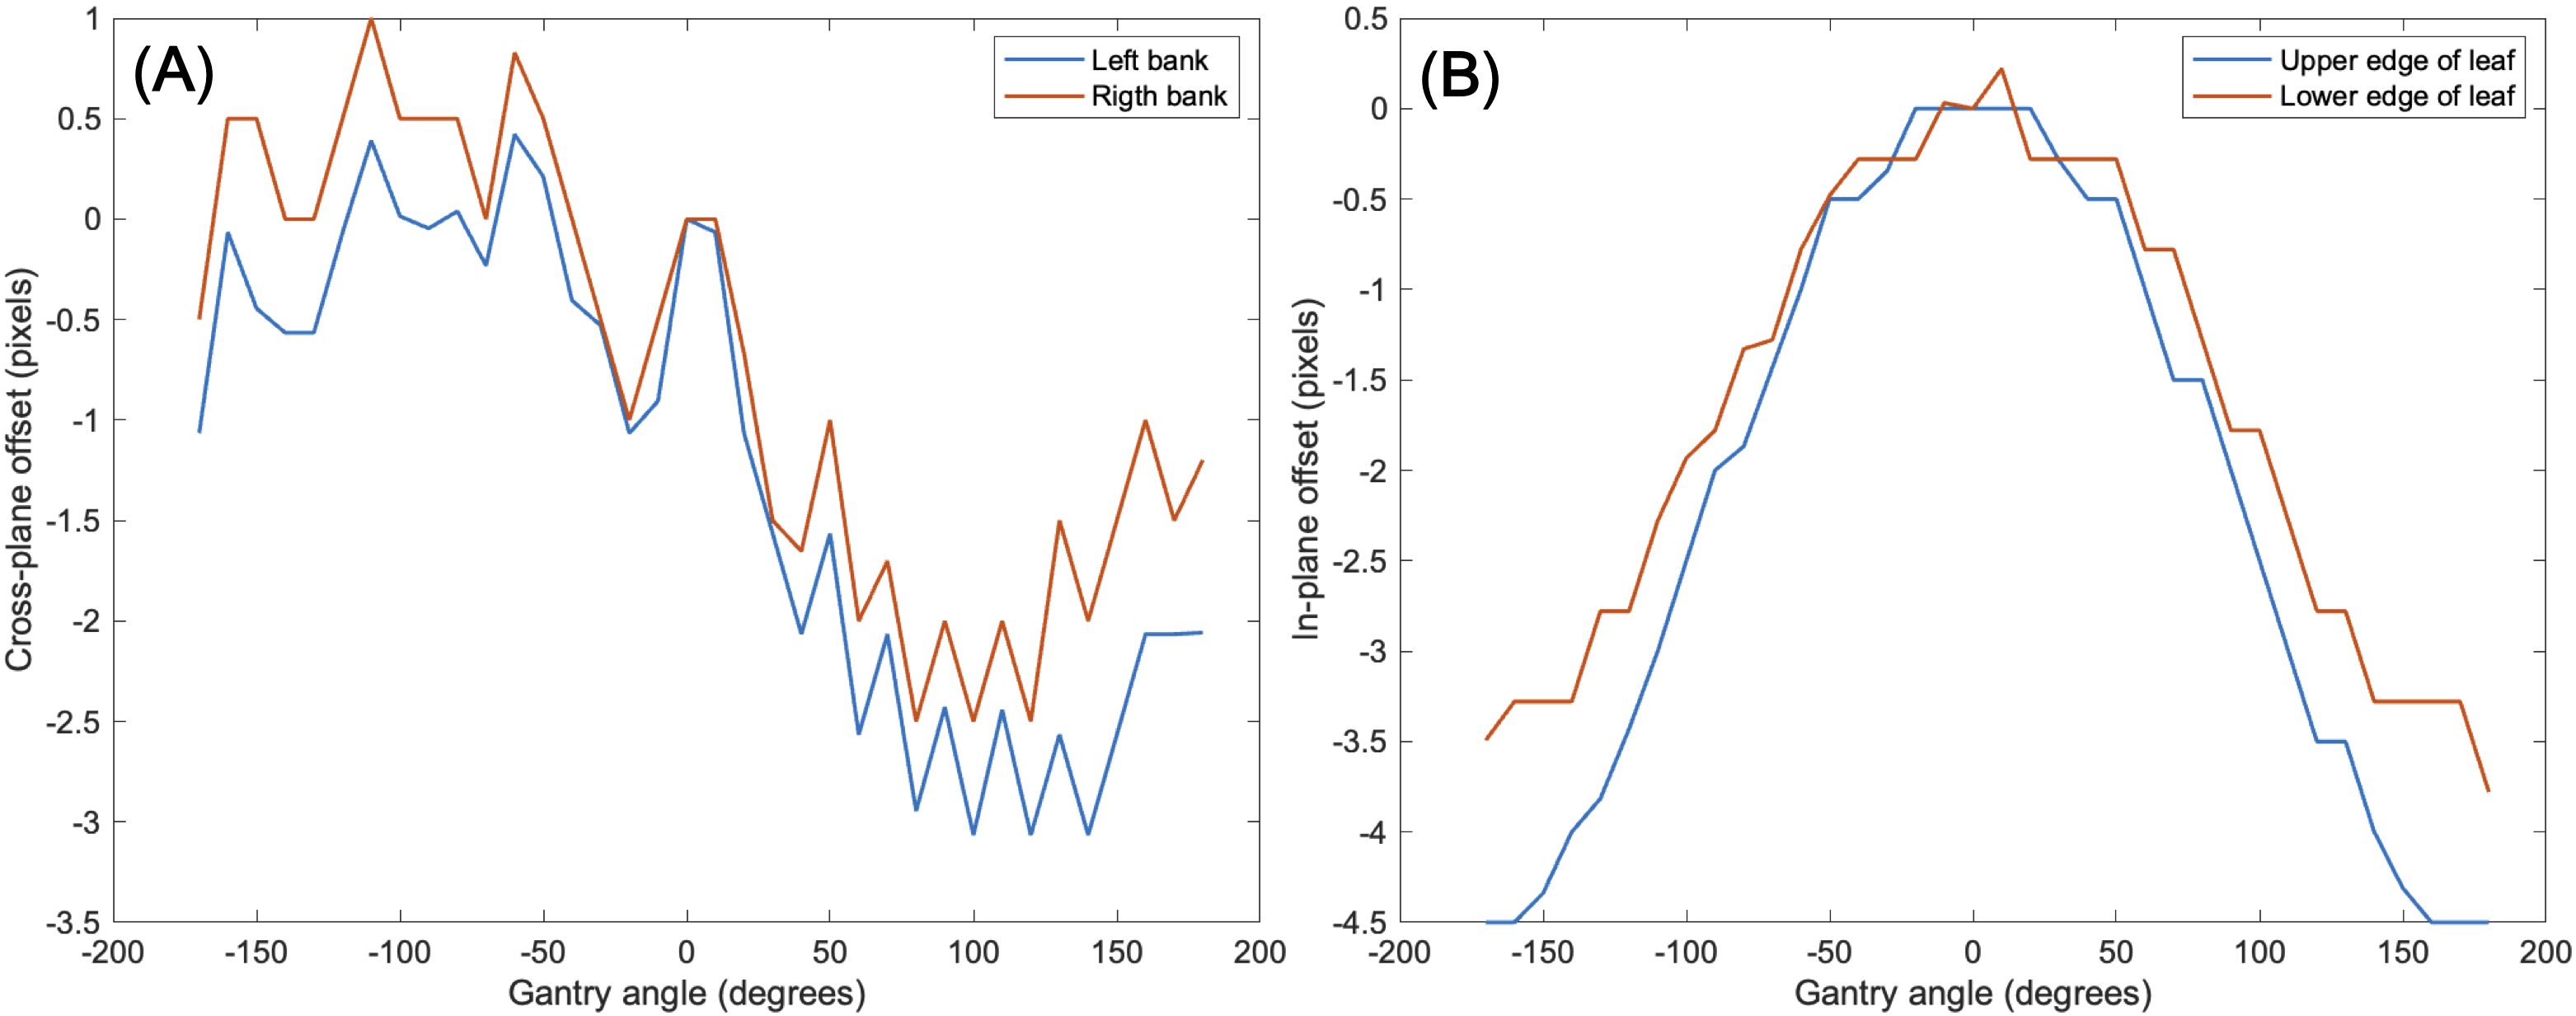
Figure 5. Imaging center offset values to address EPID detector sagging during the gantry angle rotation in the (A) cross-plane direction, (B) in-plane direction.
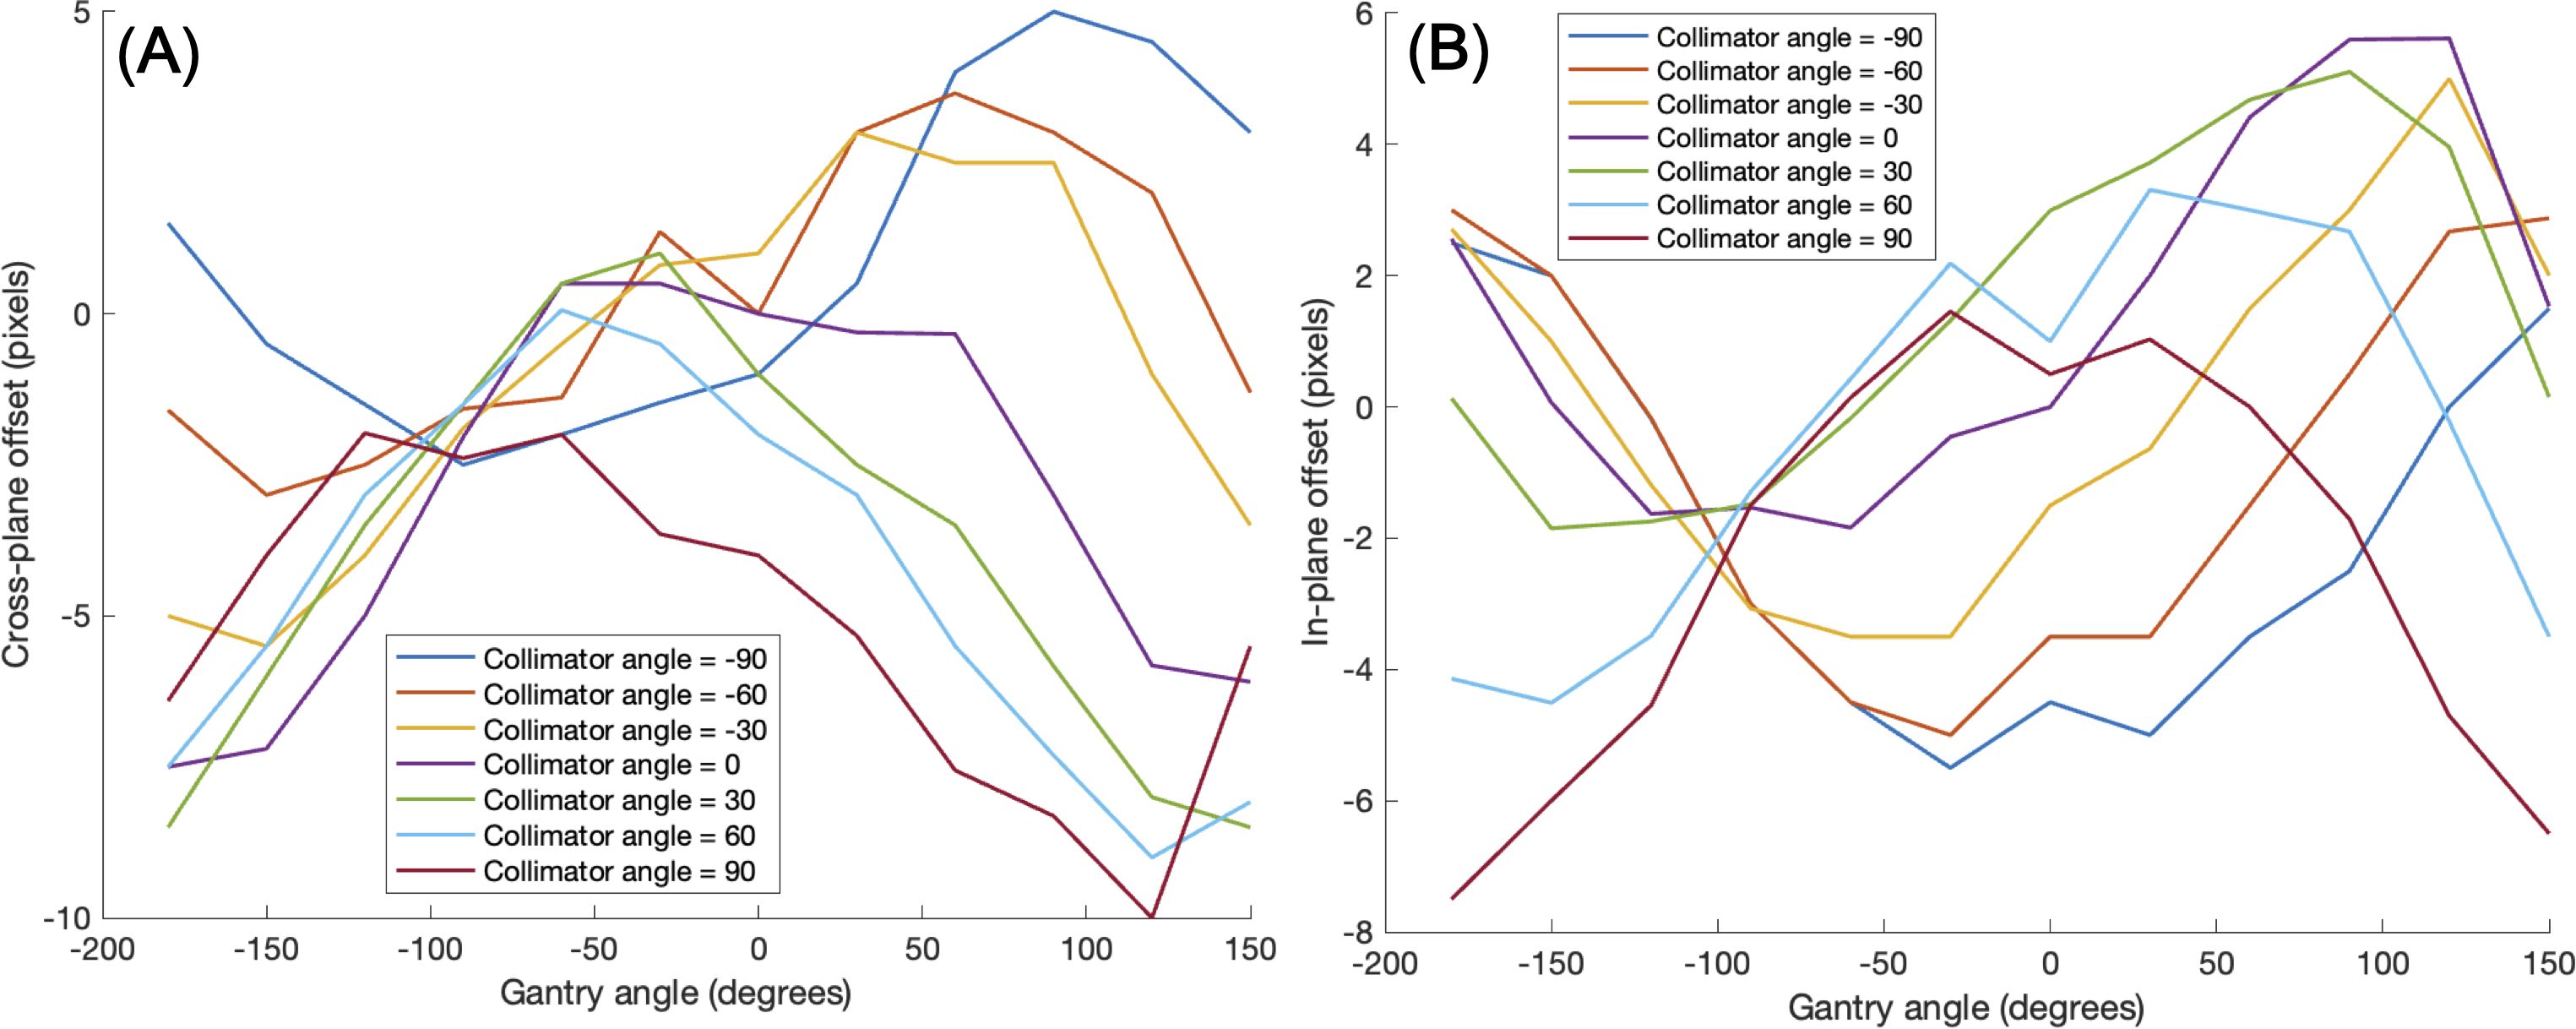
Figure 6. Imaging center offset values to address additional center shift of EPID detector caused by rotation of the gantry angle and collimator angle in the (A) cross-plane direction, (B) in-plane direction.
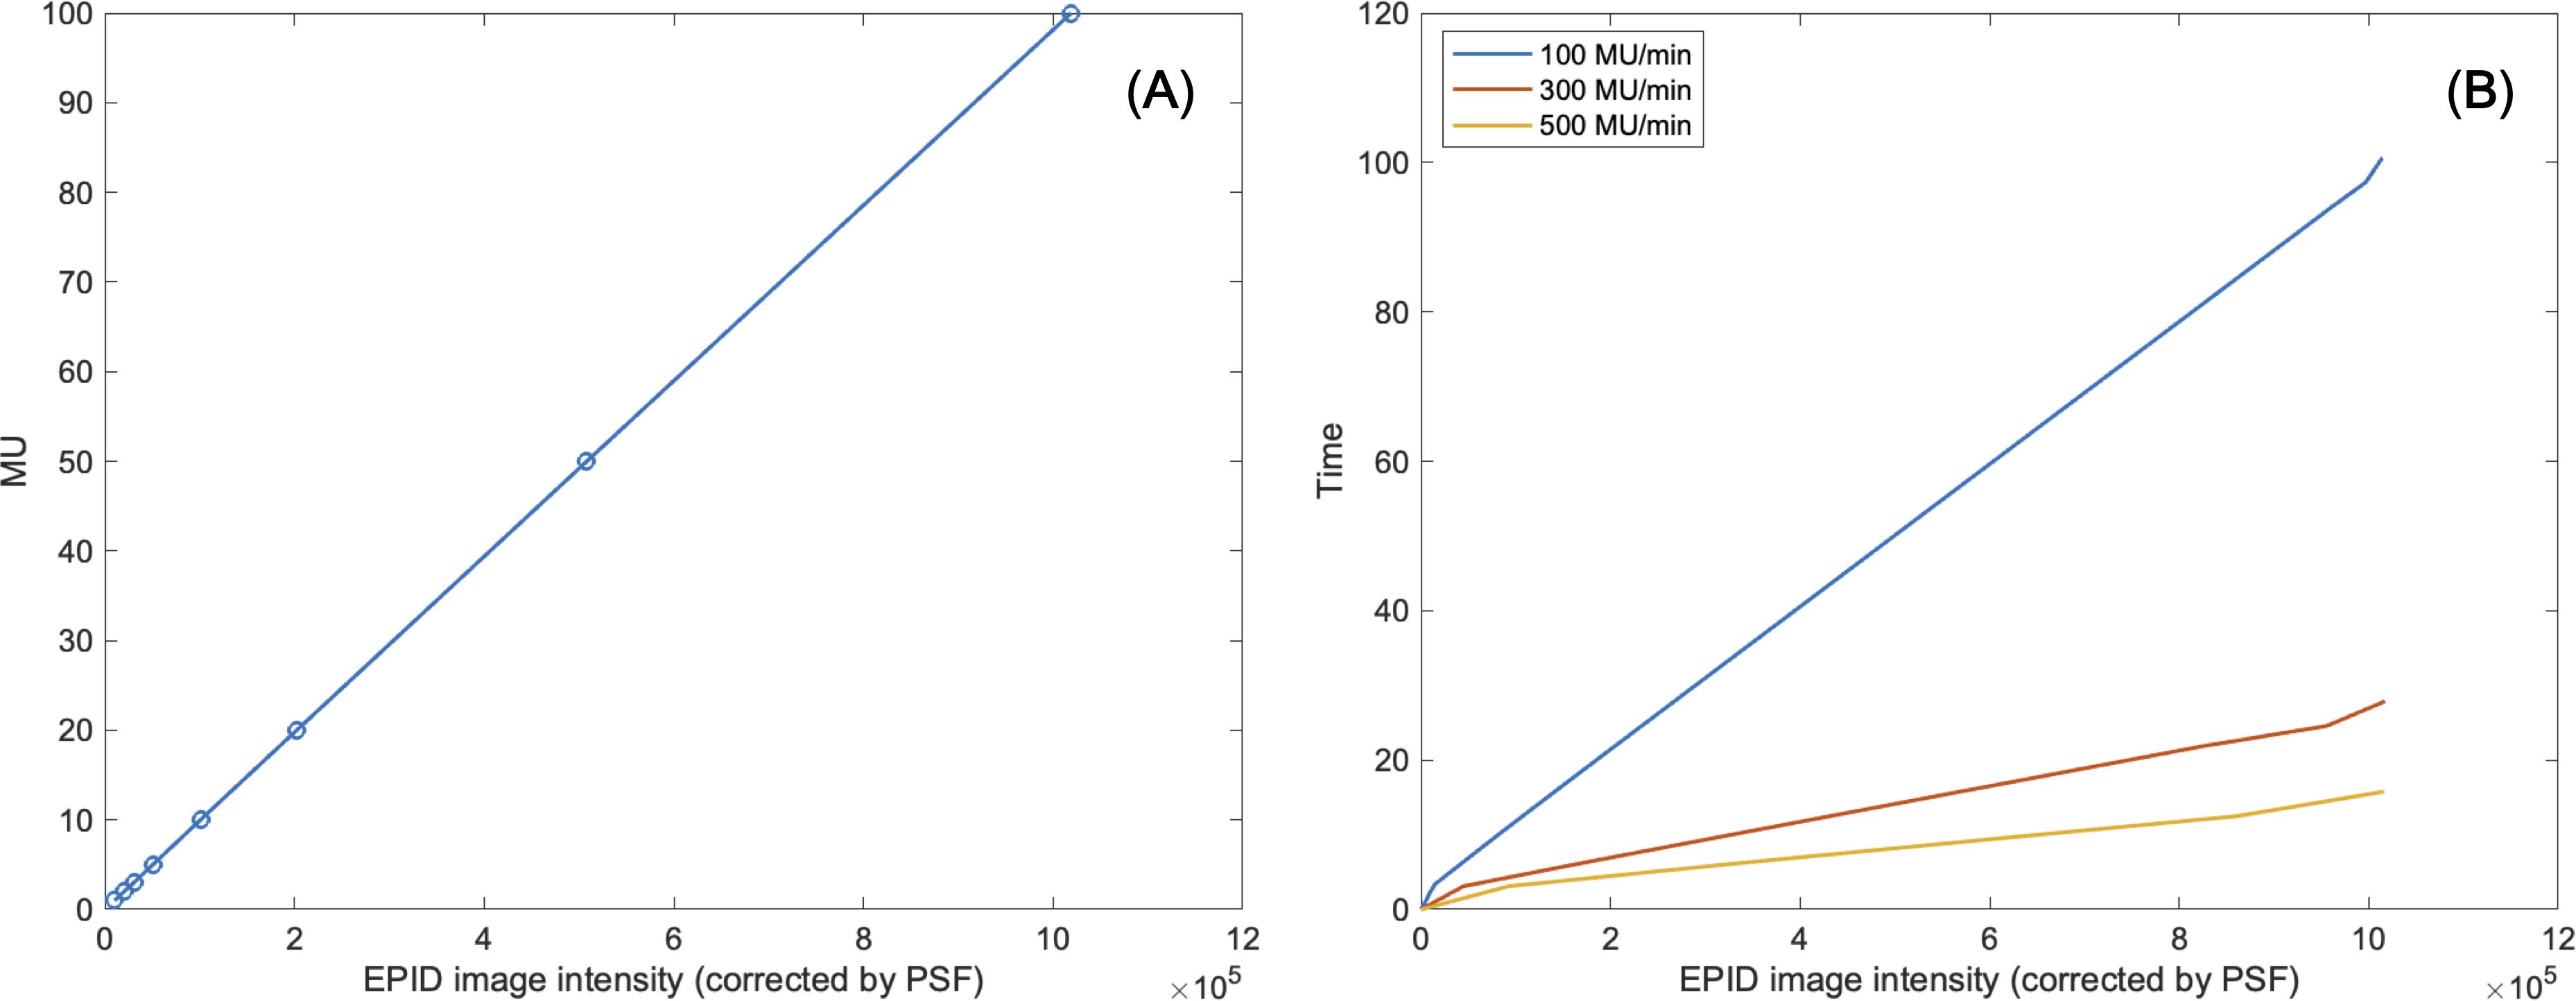
Figure 7. (A) Linearity of MU to EPID image intensity corrected by pixel scaling factor. (B) Consistency of EPID image intensity corrected by pixel scaling factor regardless of changes in dose rate.
3.2 GPR and plan complexity
The VMAT QA method based on 2D sequential EPID images was successfully executed by generating the EPID-based log file compatible to Mobius3D system for the 18 patient cases. For each plan, metrics such as GPR, DVH, and target coverage were calculated by Mobius3D. On average, the GPR remarked 95.2% ± 3.7%, in which most of the cases exceeded 90% in GPR, as shown in Table 3. However, the GPRs of two plans for lung and breast VMAT cases with 6 MV and 6MV FFF energy were below 90%, which might need to be reviewed before actual treatment. The MUs relative to the fractional dose were found to be high among the tested datasets, while some other cases with larger ratio of MUs to fractional dose resulted in the GPRs larger than 95%. This triggered on the necessity of quantifying and analyzing the plan complexity metrics.
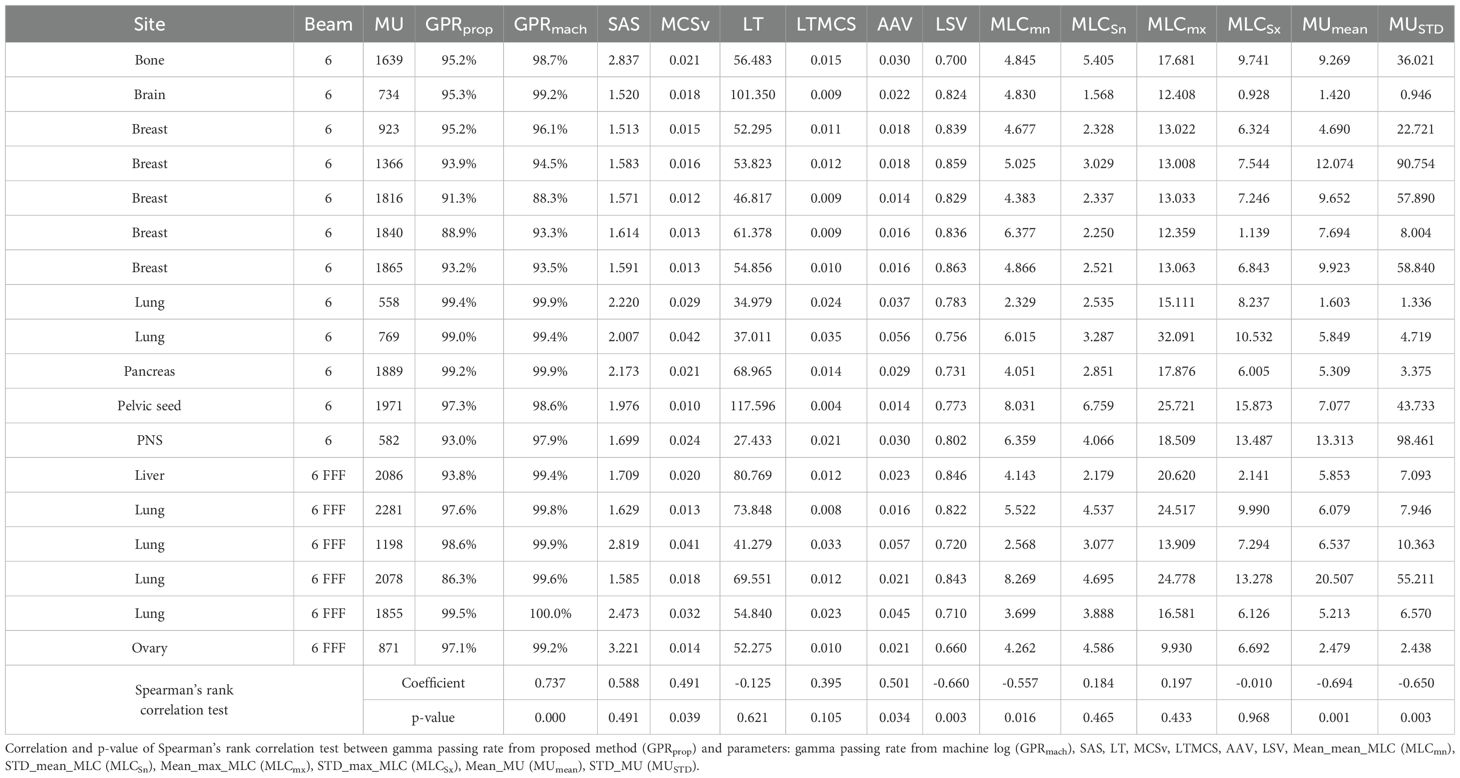
Table 3. Gamma passing rate calculated from Mobius3D and six plan complexity indices of 18 VMAT plans.
The magnitude and pattern of the plan complexity values behaved different, which required for the correlation test with statistical analysis to ensure the relationship between GPRs and plan complexity indices. Figure 8 shows scatter plots of correlation between six plan complexity indices and GPRs for the 18 VMAT plans, in which the solid lines represent Spearman’s rank correlation, and dashed lines mark threshold values for significant indices, suggesting critical levels of plan complexity. The correlations between three metrics (SAS, LSV, and LT) and GPRs were opposed to the expected, which were excluded in statistical analysis. For instance, the plan with greater value of SAS was supposed to yield low GPR, which behaved entirely opposite in our experiments. The remaining two of three plan complexity indices (AAV and MCSv) exhibited the large correlations around ±0.45 in appropriate direction, which led to the statistically significant influences (p < 0.05). Those complexity metrics, however, were not direct predictors for the GPRs as indicated by the dotted lines in red in Figure 8. The plans with similar complexity values to those with GPRs < 90% did not always result in the low GPRs.
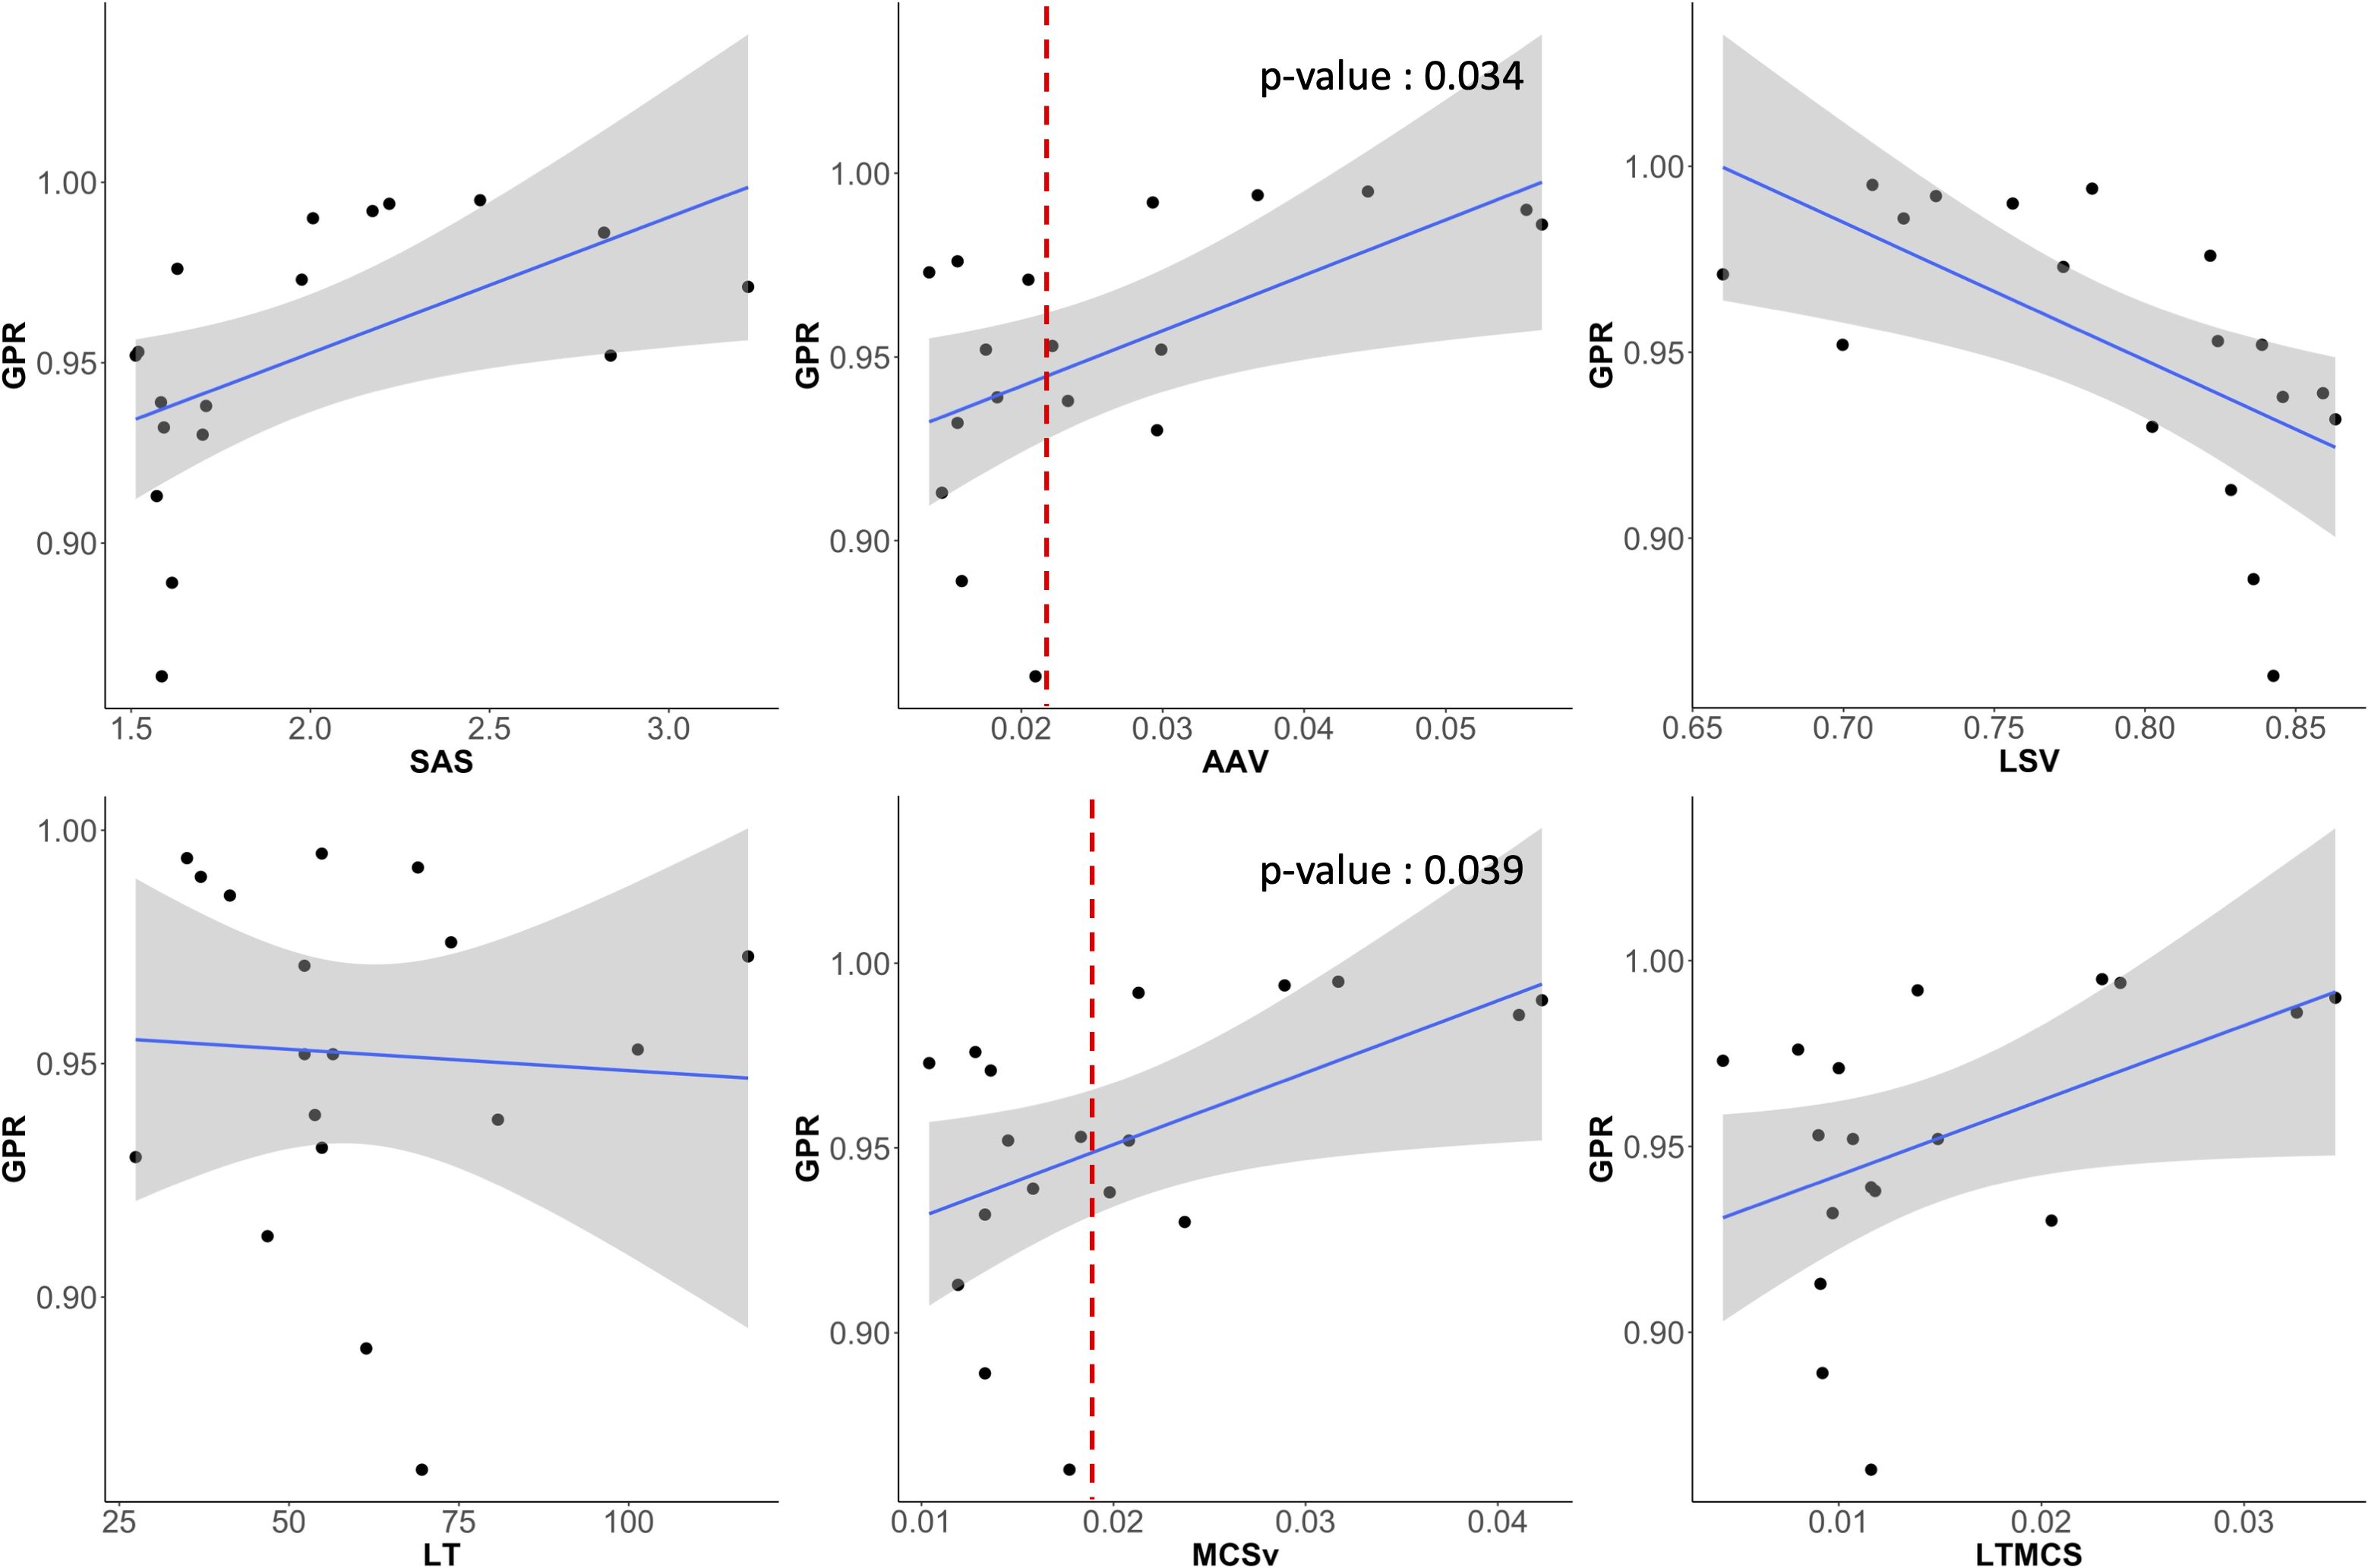
Figure 8. Scatter plots showing the correlation between GPR and six plan complexity indices (SAS, AAV, LSV, LT, MCSv, LTMCS). AAV and MCSv showed substantial correlations to the GPRs and had statistically significant influences.
Figure 9 shows scatter plots of correlation between the direct MLC and MU-related complexity indices and GPRs. The mean of averaged MLC traveling distance (Mean_mean_MLC), averaged MU differences (Mean_MU), and standard deviation of MU differences (STD_MU) between two consecutive CPs revealed the reasonable direction of the correlations to the GPRs and statistically significant influences. Importantly, two indices (Mean_mean_MLC and Mean_MU) were rigorous predictors for the GPRs, in which the average MLC traveling distance of 6 cm and average MU difference of 8 MUs between two consecutive control points could offer a warning sign regarding plan deliverability.
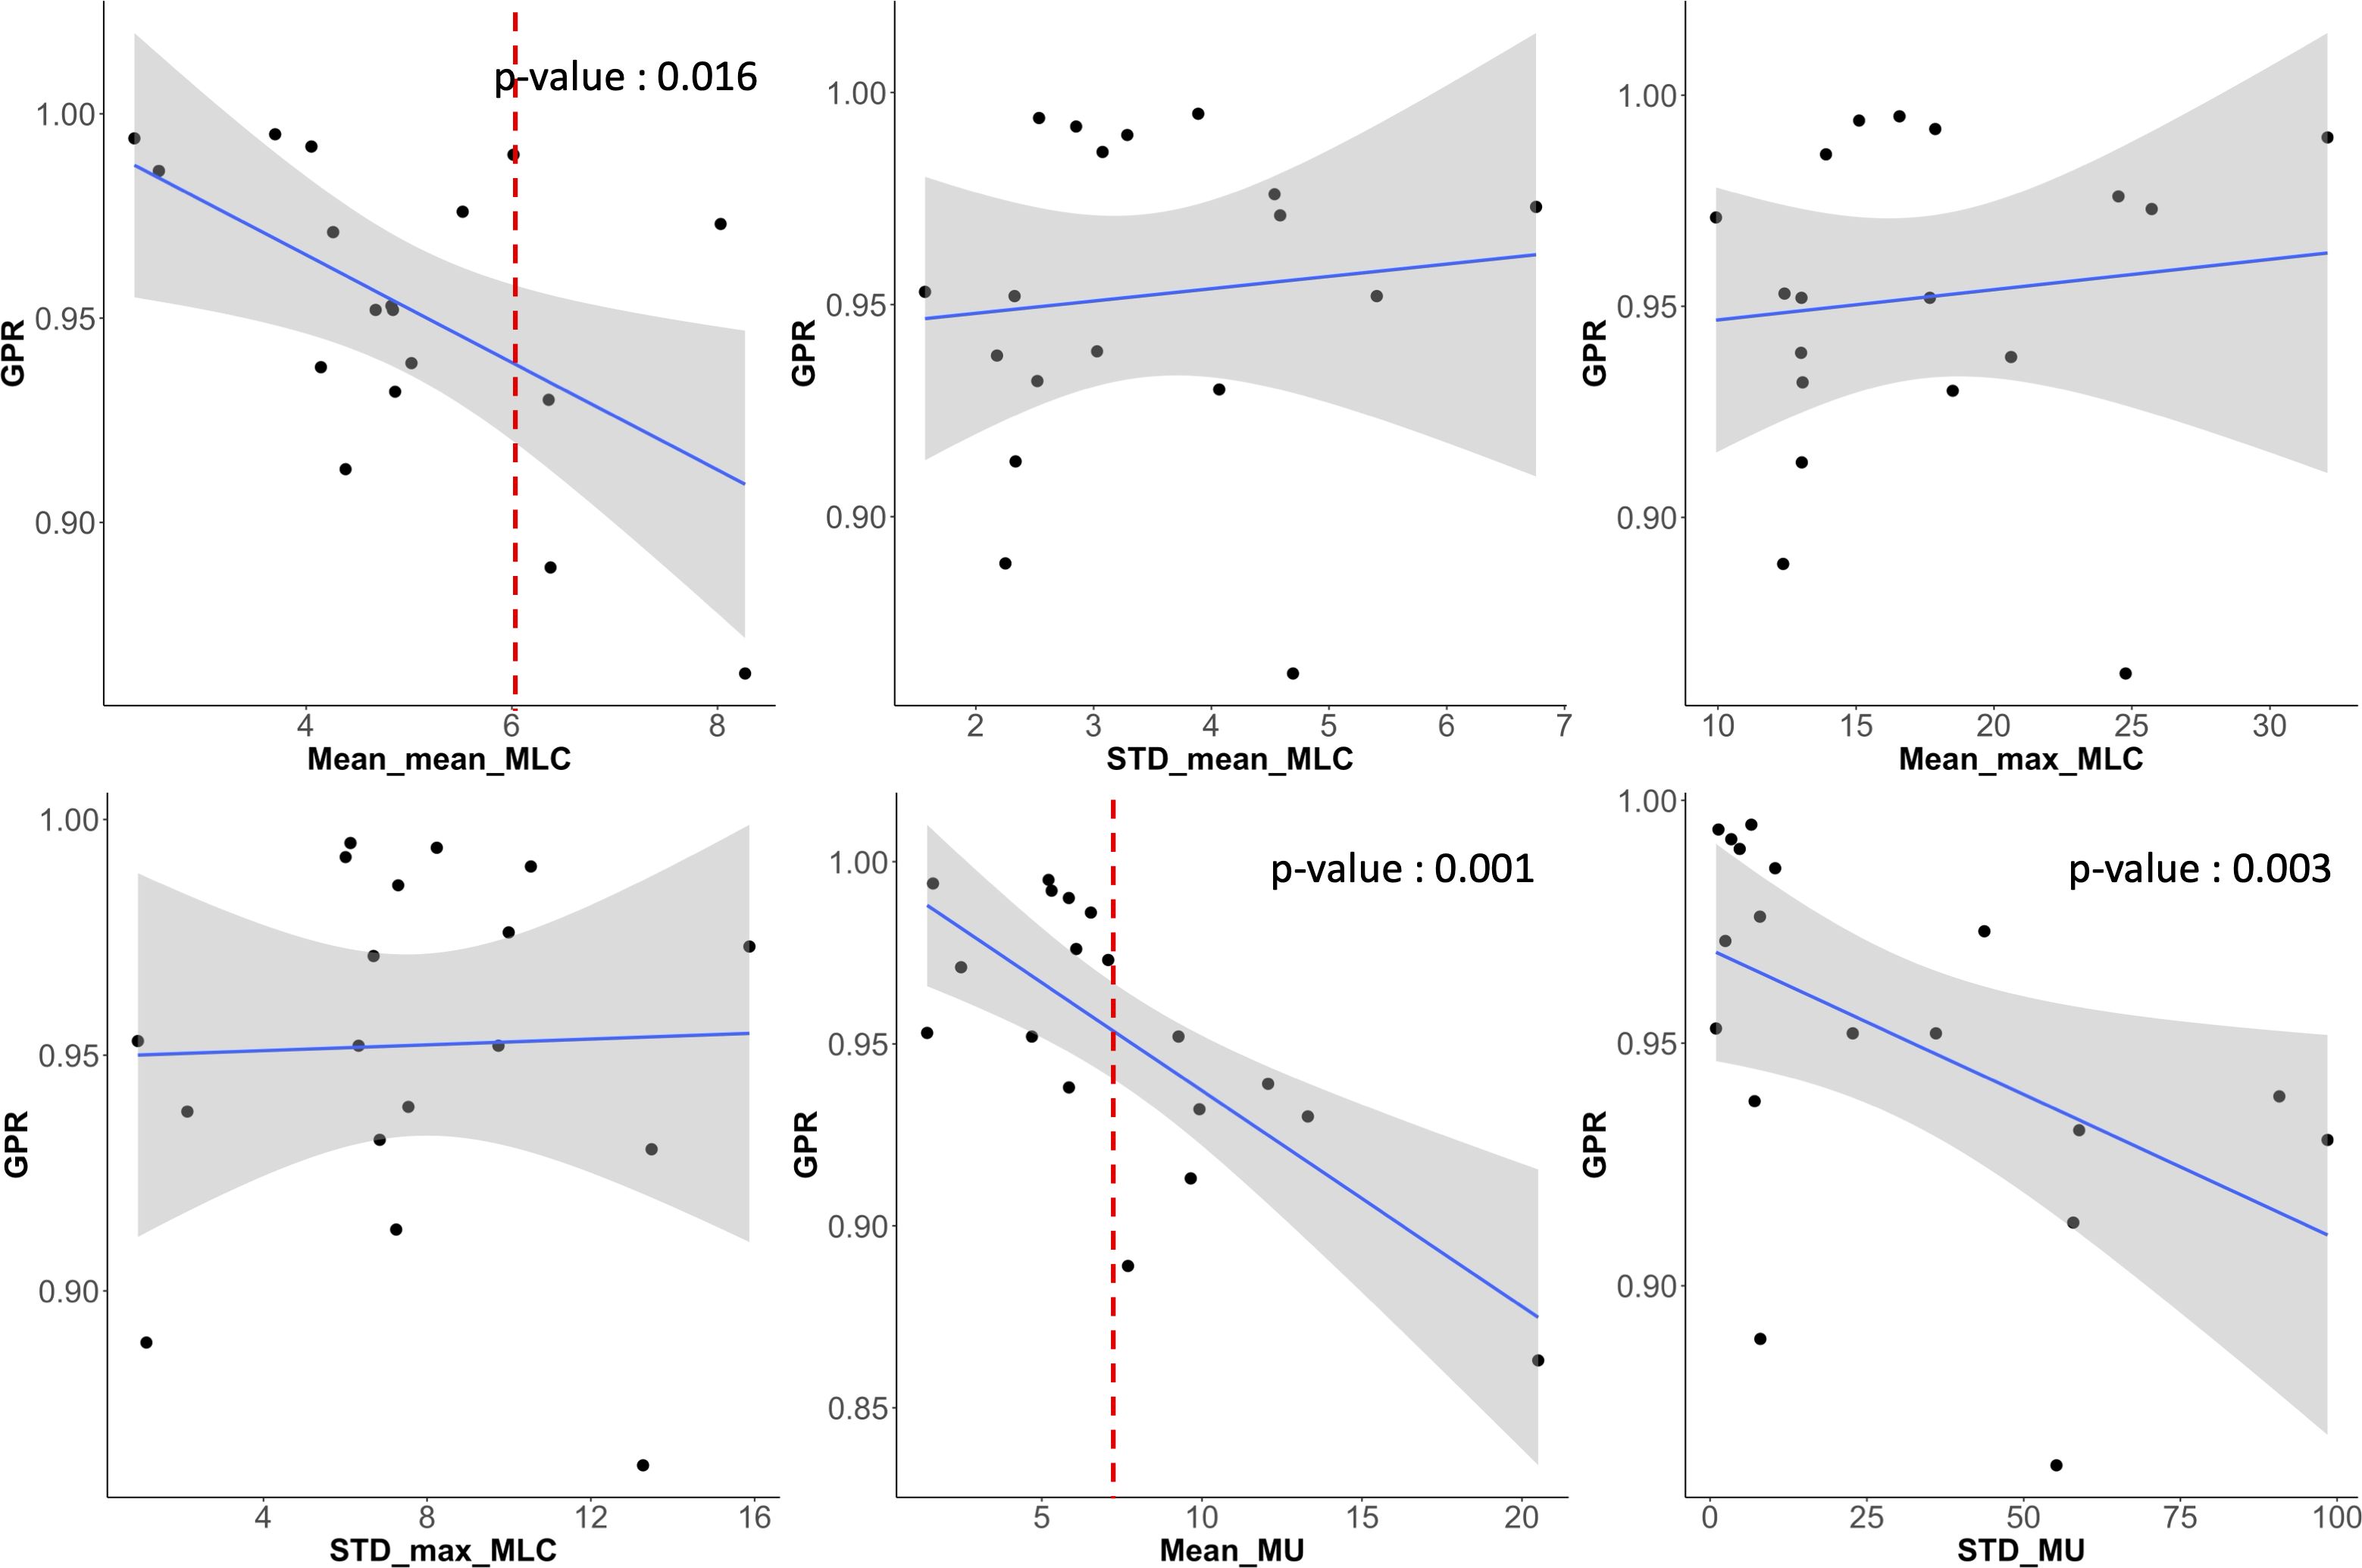
Figure 9. Scatter plots showing the correlation between GPR and six MLC and MU parameters (averaged mean and maximum MLC traveling distance (‘Mean_mean_MLC’ and ‘Mean_max_MLC’) and their standard deviations (‘STD_mean_MLC’ and ‘STD_max_MLC’), average MU difference (Mean_MU) between two consecutive control points and its standard deviation (STD_MU)). Averaged mean MLC traveling distance (Mean_mean_MLC) and averaged MU difference (Mean_MU) between two control points had also strong correlations to GPRs and had statistically significant influence.
We also compared the GPRs of EPID-generated (proposed) logs with those from machine-generated logs, yielding a significant correlation of 0.737 (p < 0.05). However, for VMAT plans using a 6MV FFF beam, GPR calculations using machine logs consistently showed results above 99%, indicating a limited capacity to differentiate plan complexity. Consequently, a Spearman’s rank correlation test for VMAT plans using 6MV beams only revealed a significant correlation coefficient of 0.919 (p= 0.00002).
4 Discussion
This study introduces a novel measurement-based control-point specific VMAT QA method that integrates the strengths of EPID-based QA and log-based QA. The primary goal was to utilize sequential EPID images captured during beam-on gantry rotation to mitigate occasional failure of detecting errors caused by machine fault due to lack of independent measurements in log-based QA. Furthermore, unlike traditional EPID-based QA that acquired and compared 2D composite fluences, our approach generated a dynalog file from MLC and MU information extracted from sequential EPID images, followed by facilitating independent 3D dose calculations. This enabled the acquisition of comprehensive information such as DVH and target dose, while maintaining the advantages of efficiency. Some previous works and the commercial products have attempted to develop patient-specific VMAT QA system with sequential EPID images. To our best knowledge, however, this study is the first trial of integrating both MLC and MU information with the measured frame-by-frame EPID images.
In technical aspects, the most challenging phase was to acquire the sequential EPID images. Differentiated from conventional EPID-based QA with only 2D composite fluence assigned to a whole or partial arc, frame-by-frame EPID images were required for generating a dynalog file in the new framework that is compatible to the commercial QA system, Mobius3D, for comprehensive QA analysis, including GPR based on 3D dose distributions. The Elekta linear accelerator allowed for an iCom connection mode that exported sequential 2D EPID images with a timing resolution of 0.3 seconds. The EPID images obtained from iCom mode, unfortunately, were blurred due to photon scattering in JPEG format, necessitating additional processing to extract accurate MLC and MU information. The blurred 2D sequential images were processed through iterative deconvolution algorithm and thresholding operator, which facilitated accurate and consistent extraction of placements of MLC leaves. Also, the PSF embedded in log files of sequential EPID images successfully converted the image intensities to MU-proportional values. The appropriateness of the threshold value in image binarization and PSF information for MU compatibility was ensured by independent linearity checks of the EPID images acquired with different MLC field sizes and different MU values.
The new QA framework developed in this work was successfully implemented, yielding an average GPR of 95.2% ± 3.7% across 18 VMAT plans. Most cases surpassed the clinically acceptable threshold of 90% GPR, while two out of the 18 plans exhibited GPRs below 90%. It led to the necessity of further investigation into the plan characteristics in relation to the GPRs. The 12 metrics were incorporated into the analysis, including six plan complexity metrics and six metrics based on direct MLC and MU transitional information from RT plan DICOM files. Two out of the six plan complexity metrics (AAV and MCSv) showed substantial correlations to the GPRs and had statistically significant influences. Two MLC and MU-directly associated metrics (averaged mean MLC traveling distance and averaged MU difference between two control points) had also strong correlations to GPRs and had statistically significant differences. Interestingly, those two MLC and MU-direct metrics implied strong potential for the GPR predictions, compared to the three plan complexity metrics. Plans with an average MLC traveling distance of 6 cm and an average MU difference of 8 MUs between two consecutive control points would be likely to leading to the GPRs < 90 with very few exceptions. In addition, for VMAT plans using 6MV FFF beams, despite variations in plan complexity indices, the machine log-based QA failed to detect the differences in GPR calculations, as observed in our study, thereby limiting its ability to screen non-deliverable plans during pre-treatment QA procedures. Contrarily, our EPID-generated logs successfully reflected the plan complexity of different plans in GPR calculations, ensuring a clinically secure methodology for patient-specific VMAT QA.
Despite the various strengths of our framework proposed in this work, there are a couple of limitations to be discussed. This study was conducted exclusively with a single linear accelerator, Harmony Pro by Elekta, which fortunately provided the 2D sequential EPID images. As stated previously, the presence of 2D sequential images was a key for the development of our proposed framework. Thus, it would be necessary to identify if a specific linear accelerator could allow us to obtain such sequential 2D EPID images for the applicability of this framework. Also, some critical parameters in determining a threshold value for image binarization and estimating mechanical offsets across gantry and collimator angles are likely to vary depending on the linear accelerators. It would have to be verified that such procedures proposed in this work are generalizable and applicable to the other linear accelerators. Additionally, the study was validated with only 18 plans. It possibly led to a bias in analyzing the results and identifying the factors associated with low GPRs. Therefore, further validation involving a wider range of equipment and a larger number of plans might be necessary to generalize the findings and improve the robustness of the proposed QA method.
5 Conclusion
This study successfully implemented a novel, measurement-based VMAT QA framework using control-point specific, frame-by-frame EPID images. The methodology involved extracting accurate MLC positions through iterative deconvolution and offset correction, as well as determining MU values using a PSF. The generated EPID-based log files were compatible with the Mobius3D system, facilitating accurate 3D dose calculations and comprehensive QA evaluations. Most of QA results met the clinical criteria, validating the effectiveness of the framework. In plans that did not meet the clinical criteria, we identified significant correlations between several plan complexity indices and the GPR. These findings highlight the framework’s potential to enhance VMAT QA processes. Future work will focus on validating this approach across a broader range of linear accelerators and treatment plans to ensure its generalizability and robustness.
Data availability statement
The datasets presented in this article are not readily available because they are confidential patient data and protected by institutional data use agreements. Requests to access the datasets should be directed to HK at SEpIRU5SWUtJTUB5dWhzLmFj.
Ethics statement
The studies involving humans were approved by the Severance Hospital’s Institutional Review Board (IRB No. 4-2021-0869). The studies were conducted in accordance with the local legislation and institutional requirements. Written informed consent for participation was not required from the participants or the participants’ legal guardians/next of kin in accordance with the national legislation and institutional requirements.
Author contributions
JS: Data curation, Investigation, Methodology, Software, Validation, Visualization, Writing – original draft, Writing – review & editing. HK: Conceptualization, Investigation, Methodology, Project administration, Resources, Software, Supervision, Validation, Writing – original draft, Writing – review & editing, Data curation. MH: Conceptualization, Investigation, Methodology, Software, Supervision, Writing – review & editing. JhK: Conceptualization, Formal analysis, Investigation, Methodology, Supervision, Writing – review & editing. KP: Conceptualization, Investigation, Methodology, Supervision, Writing – review & editing. HC: Data curation, Validation, Writing – review & editing. DY: Data curation, Resources, Writing – review & editing. JsK: Conceptualization, Formal analysis, Funding acquisition, Investigation, Methodology, Project administration, Supervision, Writing – original draft, Writing – review & editing.
Funding
The author(s) declare financial support was received for the research, authorship, and/or publication of this article. This work was supported by Varian Medical Systems under a research framework agreement (4-2021-0869).
Conflict of interest
Author JSK was employed by company Oncosoft Inc.
The remaining authors declare that the research was conducted in the absence of any commercial or financial relationships that could be construed as a potential conflict of interest.
Publisher’s note
All claims expressed in this article are solely those of the authors and do not necessarily represent those of their affiliated organizations, or those of the publisher, the editors and the reviewers. Any product that may be evaluated in this article, or claim that may be made by its manufacturer, is not guaranteed or endorsed by the publisher.
References
1. Palma D, Vollans E, James K, Nakano S, Moiseenko V, Shaffer R, et al. Volumetric modulated arc therapy for delivery of prostate radiotherapy: comparison with intensity-modulated radiotherapy and three-dimensional conformal radiotherapy. Int J Radiat Oncol Biol Phys. (2008) 72:996–1001. doi: 10.1016/j.ijrobp.2008.02.047
2. Wolff D, Stieler F, Welzel G, Lorenz F, Abo-Madyan Y, Mai S, et al. Volumetric modulated arc therapy (VMAT) vs. serial tomotherapy, step-and-shoot IMRT and 3D-conformal RT for treatment of prostate cancer. Radiother Oncol. (2009) 93:226–33. doi: 10.1016/j.radonc.2009.08.011
3. Wang X, Li G, Zhang Y, Bai S, Xu F, Wei Y, et al. Single-arc volumetric-modulated arc therapy (sVMAT) as adjuvant treatment for gastric cancer: dosimetric comparisons with three-dimensional conformal radiotherapy (3D-CRT) and intensity-modulated radiotherapy (IMRT). Med Dosimetry. (2013) 38:395–400. doi: 10.1016/j.meddos.2013.04.007
4. Liu H, Chen X, He Z, Li J. Evaluation of 3D-CRT, IMRT and VMAT radiotherapy plans for left breast cancer based on clinical dosimetric study. Comput Med Imaging Graphics. (2016) 54:1–5. doi: 10.1016/j.compmedimag.2016.10.001
5. Nutting C, Dearnaley DP, Webb S. Intensity modulated radiation therapy: a clinical review. Br J Radiol. (2000) 73:459–69. doi: 10.1259/bjr.73.869.10884741
6. Webb S. The physical basis of IMRT and inverse planning. Br J Radiol. (2003) 76:678–89. doi: 10.1259/bjr/65676879
7. Otto K. Volumetric modulated arc therapy: IMRT in a single gantry arc. Med Phys. (2008) 35:310–7. doi: 10.1118/1.2818738
8. Teoh M, Clark CH, Wood K, Whitaker S, Nisbet A. Volumetric modulated arc therapy: a review of current literature and clinical use in practice. Br J Radiol. (2011) 84:967–96. doi: 10.1259/bjr/22373346
9. Liang B, Liu B, Zhou F, Yin FF, Wu Q. Comparisons of volumetric modulated arc therapy (VMAT) quality assurance (QA) systems: sensitivity analysis to machine errors. Radiat Oncol. (2016) 11:1–0. doi: 10.1186/s13014-016-0725-4
10. Chen L, Luo H, Li S, Tan X, Feng B, Yang X, et al. Pretreatment patient-specific quality assurance prediction based on 1D complexity metrics and 3D planning dose: classification, gamma passing rates, and DVH metrics. Radiat Oncol. (2023) 18:192. doi: 10.1186/s13014-023-02376-4
11. Dogan N, Mijnheer BJ, Padgett K, Nalichowski A, Wu C, Nyflot MJ, et al. AAPM Task Group Report 307: use of EPIDs for patient-specific IMRT and VMAT QA. Med Phys. (2023) 50:e865–903. doi: 10.1002/mp.16536
12. Poppe B, Blechschmidt A, Djouguela A, Kollhoff R, Rubach A, Willborn KC, et al. Two-dimensional ionization chamber arrays for IMRT plan verification. Med Phys. (2006) 33:1005–15. doi: 10.1118/1.2179167
13. Fenoglietto P, Laliberté B, Aillères N, Riou O, Dubois JB, Azria D. Eight years of IMRT quality assurance with ionization chambers and film dosimetry: experience of the Montpellier Comprehensive Cancer Center. Radiat Oncol. (2011) 6:1–1. doi: 10.1186/1748-717X-6-85
14. Li JG, Yan G, Liu C. Comparison of two commercial detector arrays for IMRT quality assurance. J Appl Clin Med Phys. (2009) 10:62–74. doi: 10.1120/jacmp.v10i2.2942
15. Camilleri J, Mazurier J, Franck D, Dudouet P, Latorzeff I, Franceries X. 2D EPID dose calibration for pretreatment quality control of conformal and IMRT fields: A simple and fast convolution approach. Physica Medica. (2016) 32:133–40. doi: 10.1016/j.ejmp.2015.10.094
16. Sun B, Rangaraj D, Boddu S, Goddu M, Yang D, Palaniswaamy G, et al. Evaluation of the efficiency and effectiveness of independent dose calculation followed by machine log file analysis against conventional measurement based IMRT QA. J Appl Clin Med Phys. (2012) 13:140–54. doi: 10.1120/jacmp.v13i5.3837
17. Calvo-Ortega JF, Teke T, Moragues S, Pozo M, Casals J. A Varian DynaLog file-based procedure for patient dose-volume histogram-based IMRT QA. J Appl Clin Med Phys. (2014) 15:100–9. doi: 10.1120/jacmp.v15i2.4665
18. Agnew A, Agnew CE, Grattan MW, Hounsell AR, McGarry CK. Monitoring daily MLC positional errors using trajectory log files and EPID measurements for IMRT and VMAT deliveries. Phys Med Biol. (2014) 59:N49. doi: 10.1088/0031-9155/59/9/N49
19. von Wittenau AS, Logan CM, Aufderheide Iii MB, Slone DM. Blurring artifacts in megavoltage radiography with a flat-panel imaging system: Comparison of Monte Carlo simulations with measurements. Med Phys. (2002) 29:2559–70. doi: 10.1118/1.1513159
20. Looe HK, Harder D, Willborn KC, Poppe B. Iterative 2D deconvolution of portal imaging radiographs. Z für Medizinische Physik. (2011) 21:52–64. doi: 10.1016/j.zemedi.2010.08.001
21. Cilla S, Fidanzio A, Greco F, Sabatino D, Russo A, Gargiulo L, et al. Calibration of Elekta aSi EPIDs used as transit dosimeter. Technol Cancer Res Treat. (2012) 10:39–48. doi: 10.7785/tcrt.2012.500178
22. Moreau N, Bonnor L, Jaudet C, Lechippey L, Falzone N, Batalla A, et al. Deep hybrid learning prediction of patient-specific quality assurance in radiotherapy: implementation in clinical routine. Diagnostics. (2023) 13:943. doi: 10.3390/diagnostics13050943
23. Cho H, Lee JS, Kim JS, Kim D, Chang JS, Byun HK, et al. Generating 3D images of VMAT plans for predictive models and activation maps associated with plan deliverability. Med Phys. (2024) 51:7415–24. doi: 10.1002/mp.17298
24. Boutry C, Moreau N, Jaudet C, Lechippey L, Corroyer-Dulmont A. Machine learning and deep learning prediction of patient specific quality assurance in breast IMRT radiotherapy plans using Halcyon specific complexity indices. Radiother Oncol. (2024) 200:110483. doi: 10.1016/j.radonc.2024.110483
25. Malki S, Chouaba S, Belkhiat E. (2024). "Machine and deep learning-based approaches to VMAT plan complexity evaluation: A short scoping review", in: 2024 2nd International Conference on Electrical Engineering and Automatic Control (ICEEAC). pp. 1–6. Setif, Algeria: IEEE. doi: 10.1109/ICEEAC61226.2024.10576527
Keywords: EPID, patient-specific QA, control-point specific QA, log-based QA, VMAT QA
Citation: Seok J, Kim H, Han MC, Kim J, Park K, Cho H, Yoo D and Kim JS (2024) Development of a new VMAT QA framework for Mobius3D using control-point specific EPID images. Front. Oncol. 14:1478118. doi: 10.3389/fonc.2024.1478118
Received: 09 August 2024; Accepted: 12 November 2024;
Published: 04 December 2024.
Edited by:
Baozhou Sun, Baylor College of Medicine, United StatesReviewed by:
Chengyu Shi, New York Proton Center, United StatesJia-Ming Wu, Wuwei Cancer Hospital of Gansu Province, China
Do-Kun Yoon, Yonsei University, Republic of Korea
Copyright © 2024 Seok, Kim, Han, Kim, Park, Cho, Yoo and Kim. This is an open-access article distributed under the terms of the Creative Commons Attribution License (CC BY). The use, distribution or reproduction in other forums is permitted, provided the original author(s) and the copyright owner(s) are credited and that the original publication in this journal is cited, in accordance with accepted academic practice. No use, distribution or reproduction is permitted which does not comply with these terms.
*Correspondence: Jin Sung Kim, SklOU1VOR0B5dWhzLmFj; Hojin Kim, SEpIRU5SWUtJTUB5dWhzLmFj
 JaeHyun Seok
 Hojin Kim
 Min Cheol Han
 Jihun Kim
 Kwangwoo Park
 Hyeonjeong Cho
 Dohyeon Yoo
 Jin Sung Kim