- 1Department of Magnetic Resonance Imaging (MRI), The First People’s Hospital of Yunnan Province, The Affiliated Hospital of Kunming University of Science and Technology, Kunming, China
- 2Department of Radiology, FISCA Laboratory for Advanced Imaging, Nanjing, China
- 3Department of Nuclear Medicine, The First Affiliated Hospital of University of Science and Technology of China, Hefei, Anhui, China
Purpose: The aim of this study was to evaluate the diagnostic value of dynamic contrast-enhanced magnetic resonance imaging (DCE-MRI) derived kinetic parameters with high spatiotemporal resolution in discriminating malignant from normal prostate tissues.
Methods: Fifty patients with suspicious of malignant diseases in prostate were included in this study. Regions of interest (ROI) were manually delineated by experienced radiologists. Voxel-wise kinetic parameters were produced with the following tracer kinetic models (TKMs): Tofts model, extended Tofts model (ETM), Brix’s conventional two-compartment model (Brix), adiabatic tissue homogeneity model (ATH), and distributed parameter model (DP). The initial area under the signal-time curve (IAUC) with an uptake integral approach was also included. Mann–Whitney U test and receiver operating characteristic (ROC) curves were used to evaluate the capability of distinguishing tumor lesions from normal tissues. A p-value of 0.05 or less is considered statistically significant. ROI based parameters correlation analysis between DP and ETM were performed.
Results: 624 lesions and 269 normal tissue ROIs were obtained. Thirty parameters were derived from the six kinetic models. Except for PS from Brix, statistically significant differences between lesions and normal tissues (P<0.05) were observed in other parameters.Ve from DP, ATH and Brix and PS from ATH have AUC values less than 0.6 in the ROC analysis. MTT, Vp and PS from DP, Ktrans from ETM and Tofts, E and PS from ATH, IAUC parameters and F from Brix have AUC values larger than 0.8. Ve and Vp from DP and ETM are correlated (r> 0.65). The correlation coefficient between Ktrans from ETM and PS from DP is 0.751.
Conclusion: MTT, Vp and PS from DP, Ktrans from ETM and Tofts, E and PS from ATH, F from Brix and IAUC parameters can be used to differentiate malignant lesions from normal tissues in the prostate.
1 Introduction
Prostate cancer (PCa) ranks sixth in incidence and seventh in cancer-related mortality rates in China (1).In 2020, approximately 1.4 million new cases of PCa were diagnosed worldwide. The Lancet Commission predicts that by 2040, the incidence rate will double, with an estimated 3 million new cases (2). Magnetic resonance imaging (MRI) is becoming an important method in the diagnosis and management of PCa, Its strong negative predictive value is instrumental in mitigating the risks of overdiagnosis and overtreatment of clinically significant prostate cancer(csPCa) (3, 4) and MRI-guided biopsy is associated with higher detection rates (5). In 2019, the Prostate Imaging Reporting and Data System (PI-RADS) steering committee released PI-RADS version 2.1 (PI-RADS v2.1) by revising acquisition parameters and the scoring system in the PI-RADS version 2 while maintaining the overall framework of the system (6). DCE-MRI is the rapid acquisition of sequential images during the passage of a contrast agent within a tissue of interest over a period, which potentially provides information regarding tumor angiogenesis such as blood flow,vascular permeability, and micro-vessel density to aid treatment selection, frequent treatment monitoring and assess response to targeted therapy following treatment. The clinical application of DCE-MRI in PCa management is supported by evidence that malignant lesions enhance and wash out more quickly than normal prostate tissues (2).
In the PI-RADS v2.1, DCE-MRIis mandated to be interpreted in conjunction with T2-weighted imaging(T2WI) and diffusion weighted imaging(DWI), both of which have greater weight and influence in assessment. The role of DCE-MRI in PI-RADS v2.1 has been downgraded to a qualitative binary classifier in the lesion within the peripheral zone of the prostate only when differentiating between a PI-RADS score of 3 and 4. However, only qualitative (uptake and washout curve pattern with limited imaging time points) or semi-quantitative methodology was reviewed in PI-RADS v2.1. The downgrading of DCE-MRI in the PI-RADS guidelines could possibly be related to variation in DCE data acquisition and analysis, where visual examination by radiologists was the dominant method for DCE image analysis. Using the visual review approach, Lotte et al. reported that the accuracy of mpMRI was not significantly improved by adding DCE to T2WI and DWI (7), whereas Zawaideh et al. reviewed two hundred sixty-four patients who underwent prostate MRI, and found that mpMRI had fewer Likert 3 call rates and increased specificity and was subjectively considered of benefit by readers in 28.4% of cases (8).
Verma et al. presented a comprehensive review on the application of DCE-MRI to PCa diagnosis, where the analysis of prostate DCE-MRI can be categorized into three types of methods: qualitative, semi-quantitative, and quantitative (9). Qualitative analysis visually assess whether focal areas enhance earlier and more intensely than normal tissues, which is inherently subjective and varies in different prostate zones. Semi-quantitative analysis evaluate the shape of the intensity-time curve in the region of interest (ROI) by calculating various curve parameters include the time of first contrast uptake, time to peak, maximum slope, and peak enhancement, which is sometimes collectively referred to as “curveology.” (9). Tavakoli et al. recently investigated the contribution of mean early-phase DCE signal (mDCE) to PI-RADS for detecting csPCa and found that mDCE did not assist with PI-RADS score 3 lesion risk stratification (10).
The quantitative approach is based on modeling the transport of the contrast agent within the tissue microenvironment using tracer kinetic modeling(TKM) techniques. well-known tracer kinetic models like Tofts (11) and extended Tofts(ETM) (12)have been extensively studied in PCa (9, 13). Winkel et al. assessed whether incorporating perfusion information from Tofts into T2WI/DWI sequences improved machine learning classification of PCa risk groups, discovering that this approach enhanced risk stratification for both benign and malignant, and intermediate- versus high-risk PCa in the peripheral zone (14). Park et al. evaluated the efficacy of ETM-derived perfusion parameters in distinguishing csPCa(Gleason score ≥7) from clinically insignificant PCa [(ciPCa) Gleason score 6], finding that the interstitial space volume fraction was most effective, albeit with a modest AUC of 0.643 (15).
Stabile et al. recently reviewed the factors affecting the accuracy of mpMRI and MRI-targeted biopsy to detect and localize csPCa, and found that the radiologists’ experience was the dominating factor (16). The high heterogeneity across the studies underlines the need to define the experience of radiologists and urologists, implement quality control, and adhere to the most recent PI-RADS assessment guidelines. Nevertheless, a factor that was not accounted in the review is the way how DCE images were acquired and analyzed. Among the studies included, most used the qualitative approach. DCE imaging has progressed tremendously along with more advanced TKMs being proposed (such as Brix’s conventional two-compartment model (17), adiabatic tissue homogeneity model (ATH) (18, 19), and distributed parameter (DP) model (20, 21), but with less attention in PCa diagnosis. Hence, further research is required to clarify whether technical advancement would impact the accuracy of the PCa MRI pathway and to what extent.
2 Materials and methods
2.1 Patient
This study received approval on June 28, 2021, with the approval number KHLL 2021-137 from the institutional research ethics review board of The First People’s Hospital of Yunnan Province, The Affiliated Hospital of Kunming University of Science and Technology, Kunming, China. A total of 72 consecutive patients diagnosed with PCa underwent a DCE-MRI examination between June 2022 and February 2024. The inclusion criteria were as follows: (a) patients with an elevated PSA; (b) patients with clinical symptoms; (c) no history of androgen castration treatment, chemoradiotherapy, or biopsy before MRI examination; (d) acceptable quality of MR images; and (e) pathological results obtained by a combination of standard transrectal ultrasound (TRUS)-guided 12-core systematic biopsy and MRI–TRUS cognitive fusion biopsy(n=33) or radical prostatectomy(n=17) within a week after the MR examination. Patients were excluded for the following reasons: (a) unsatisfactory image quality of DCE-MRI, such as significant motion artifacts(n=3) and difficulty in delineating artery input(n=10); (b) prostate biopsy performed within six weeks before the MRI examination(n=2); and (c) absence of histopathologic reports due to no biopsy or surgery was performed (n=7).
2.2 Image acquisition
All scans were performed on a 3.0T MRI scanner (MAGNETOM Prisma, Siemens Healthineers, Germany) in The First People’s Hospital of Yunnan Province, The Affiliated Hospital of Kunming University of Science and Technology, Kunming, China. Each scan included axial T1-weighted imaging (T1WI) (repetition time (TR)=500ms, echo time(TE)=9.7ms, slice thickness=3.0mm, gap=0.3mm, number of slices=24), T2WI in three planes(TR=3000-4000ms, TE=107-114ms, slice thickness=3.0mm, gap=0.3mm), DWI(TR=4000ms, TE=57ms,slice thickness=3.0mm, gap=0.3mm, 3 b-values:50,1000,2000s/mm2) and DCE-MRI. The DCE-MRI was performed using a three-dimension volumetric interpolated breath-hold examination (3D Vibe) sequence in the axial direction (TR= 2.8ms, TE=0.82ms; slice thickness=3.0mm, gap=0.6mm, FOV=300x248mm, matrix=160x99, number of slices=24, NEX= 1, pre-contrast flip angles: 5°, 10°, 15°, post-contrast flip angle 15°). Before injection of the contrast agent, ten repetitions of the sequence were performed for each flip angle (5°, 10°, 15°), and native (pre-contrast) tissue T1 values were estimated using the variable flip angle method. 120 dynamic scans with a temporal resolution of 2s were performed immediately after intravenous administration of Gadopentetate Dimeglumine(Magnevist; BayerSchering Pharma AG) at a rate of 2.0 mL/s and a dose of 0.1mmoL/kg body weight. Tissue contrast concentration-time curves were derived from the dynamic scans by estimating the difference in post- and pre-contrast relaxation rate(1/T1) for kinetic modeling.
2.3 Image analysis
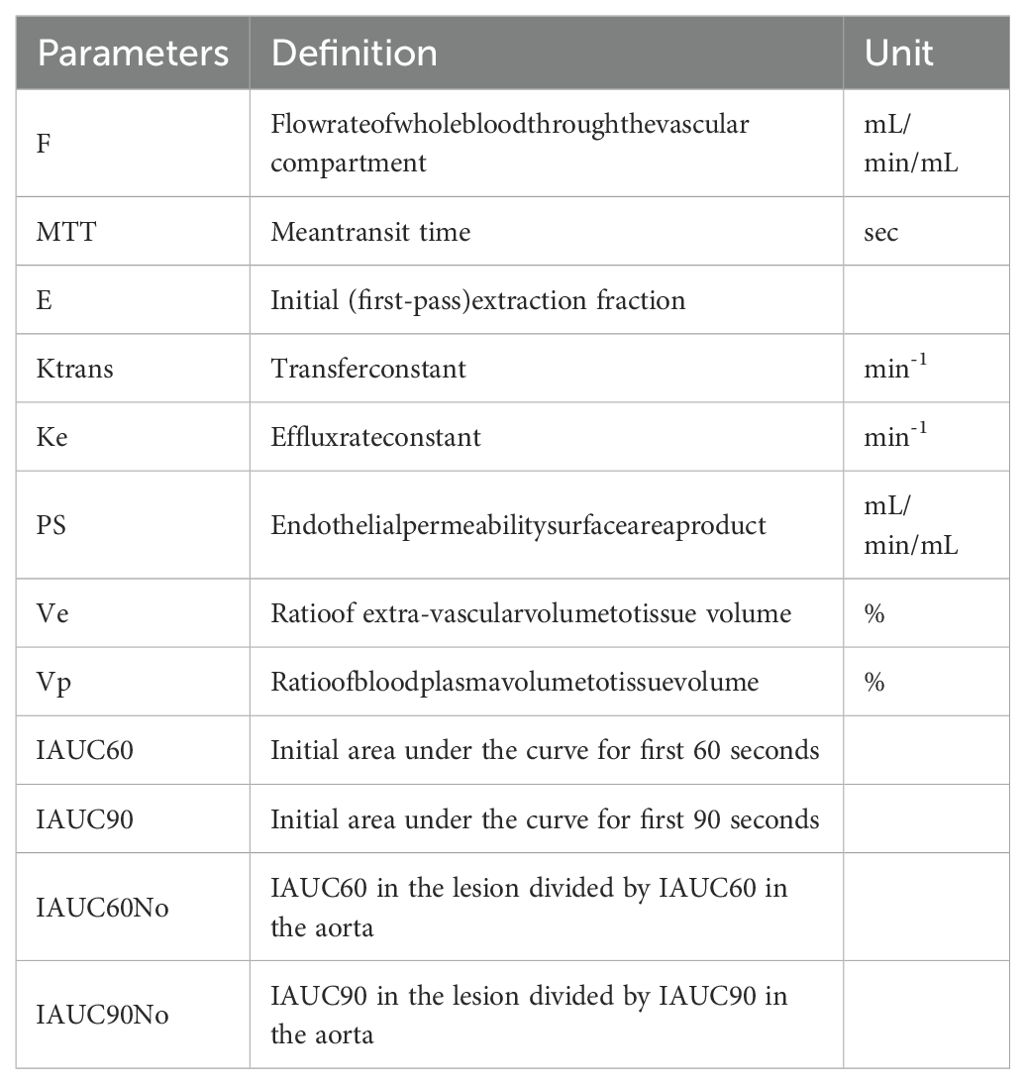
DCE-MR image analysis were performed on a commercially available software (FISCA Healthcare, China). ROI in the foci that are suspicious of malignancy and normal tissue were manually demarcated by two experienced radiologists (with six and eighteen years of expertise in prostate MRI, respectively) on the artery phase of DCE images with cross-referencing of the T2WI, DWI and DCE-MRI scans. The arterial input function (AIF) for each subject was sampled from iliac artery. In total,6 parameters from DP, 3 parameters from Tofts, 4 parameters from ETM, 6 parameters from Brix, 7 parameters from ATH and 4 parameters from IAUC on a voxel-wise level were produced for each subject. Voxels that failed in fitting or with non-physiological values were excluded from further analysis. The parameters’ abbreviation, definition, and unit are listed in Table 1.
2.4 Statistical analysis
The Mann–Whitney U test was used to compare all parameter values in lesions that are suspicious of malignancy and normal prostate tissue. Spearman correlation analysis was used to assess possible correlations of parameters between DP and the commonly used ETM. A strong correlation was assumed for 0.8<r ≤ 1, a moderate correlation for 0.5<r ≤ 0.8, a weak correlation for 0.3<r ≤ 0.5 and no correlation for r ≤ 0.3 (22). Receiver operating characteristic (ROC) analysis was conducted to evaluate the discriminatory ability of each parameter, with the area under curve (AUC) serving as the indicator of discriminatory power. Optimal cut-off values were chosen using the Youden index on the estimated curves. An AUC value greater than 0.8 was considered to be effective in discriminating tumors from normal tissue. All statistical analyses were performed using MATLAB (2020b; MathWorks, Natick, MA) software. A p-value of 0.05 or less was considered to be statistically significant.
3 Results
3.1 Patients
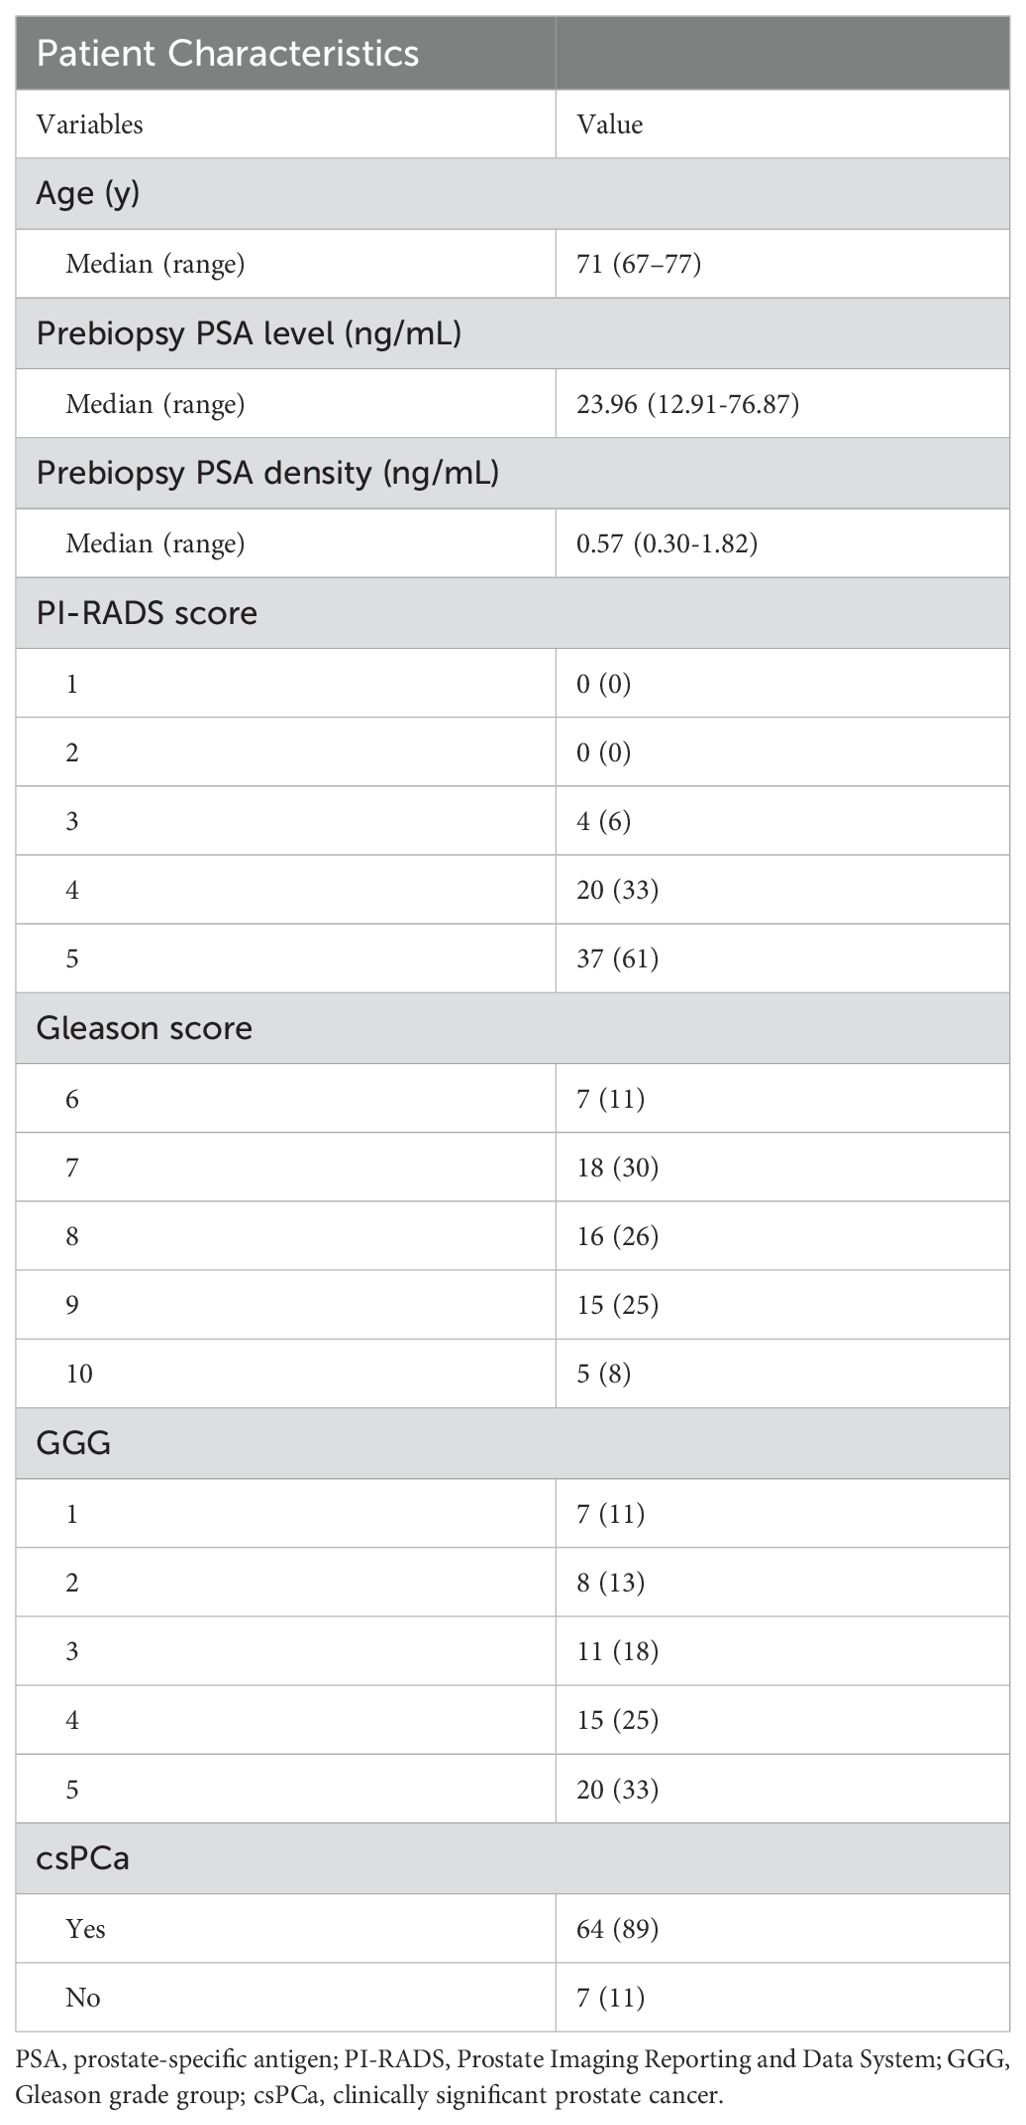
Of the 72 cases, 50 were finally selected after exclusion (13 cases due to unsatisfactory image quality of DCE-MRI; 2 cases due to prostate biopsy performed within six weeks before MRI examination; 7 cases due to no histopathologic reports). Clinical information of the 50 patients is shown in Table 2. Figure 1 shows representative parameter images of a patient generated by using the various kinetic models. A tumor ROI is shown in the T2WI. The tumor can be well visualized in most kinetic images.
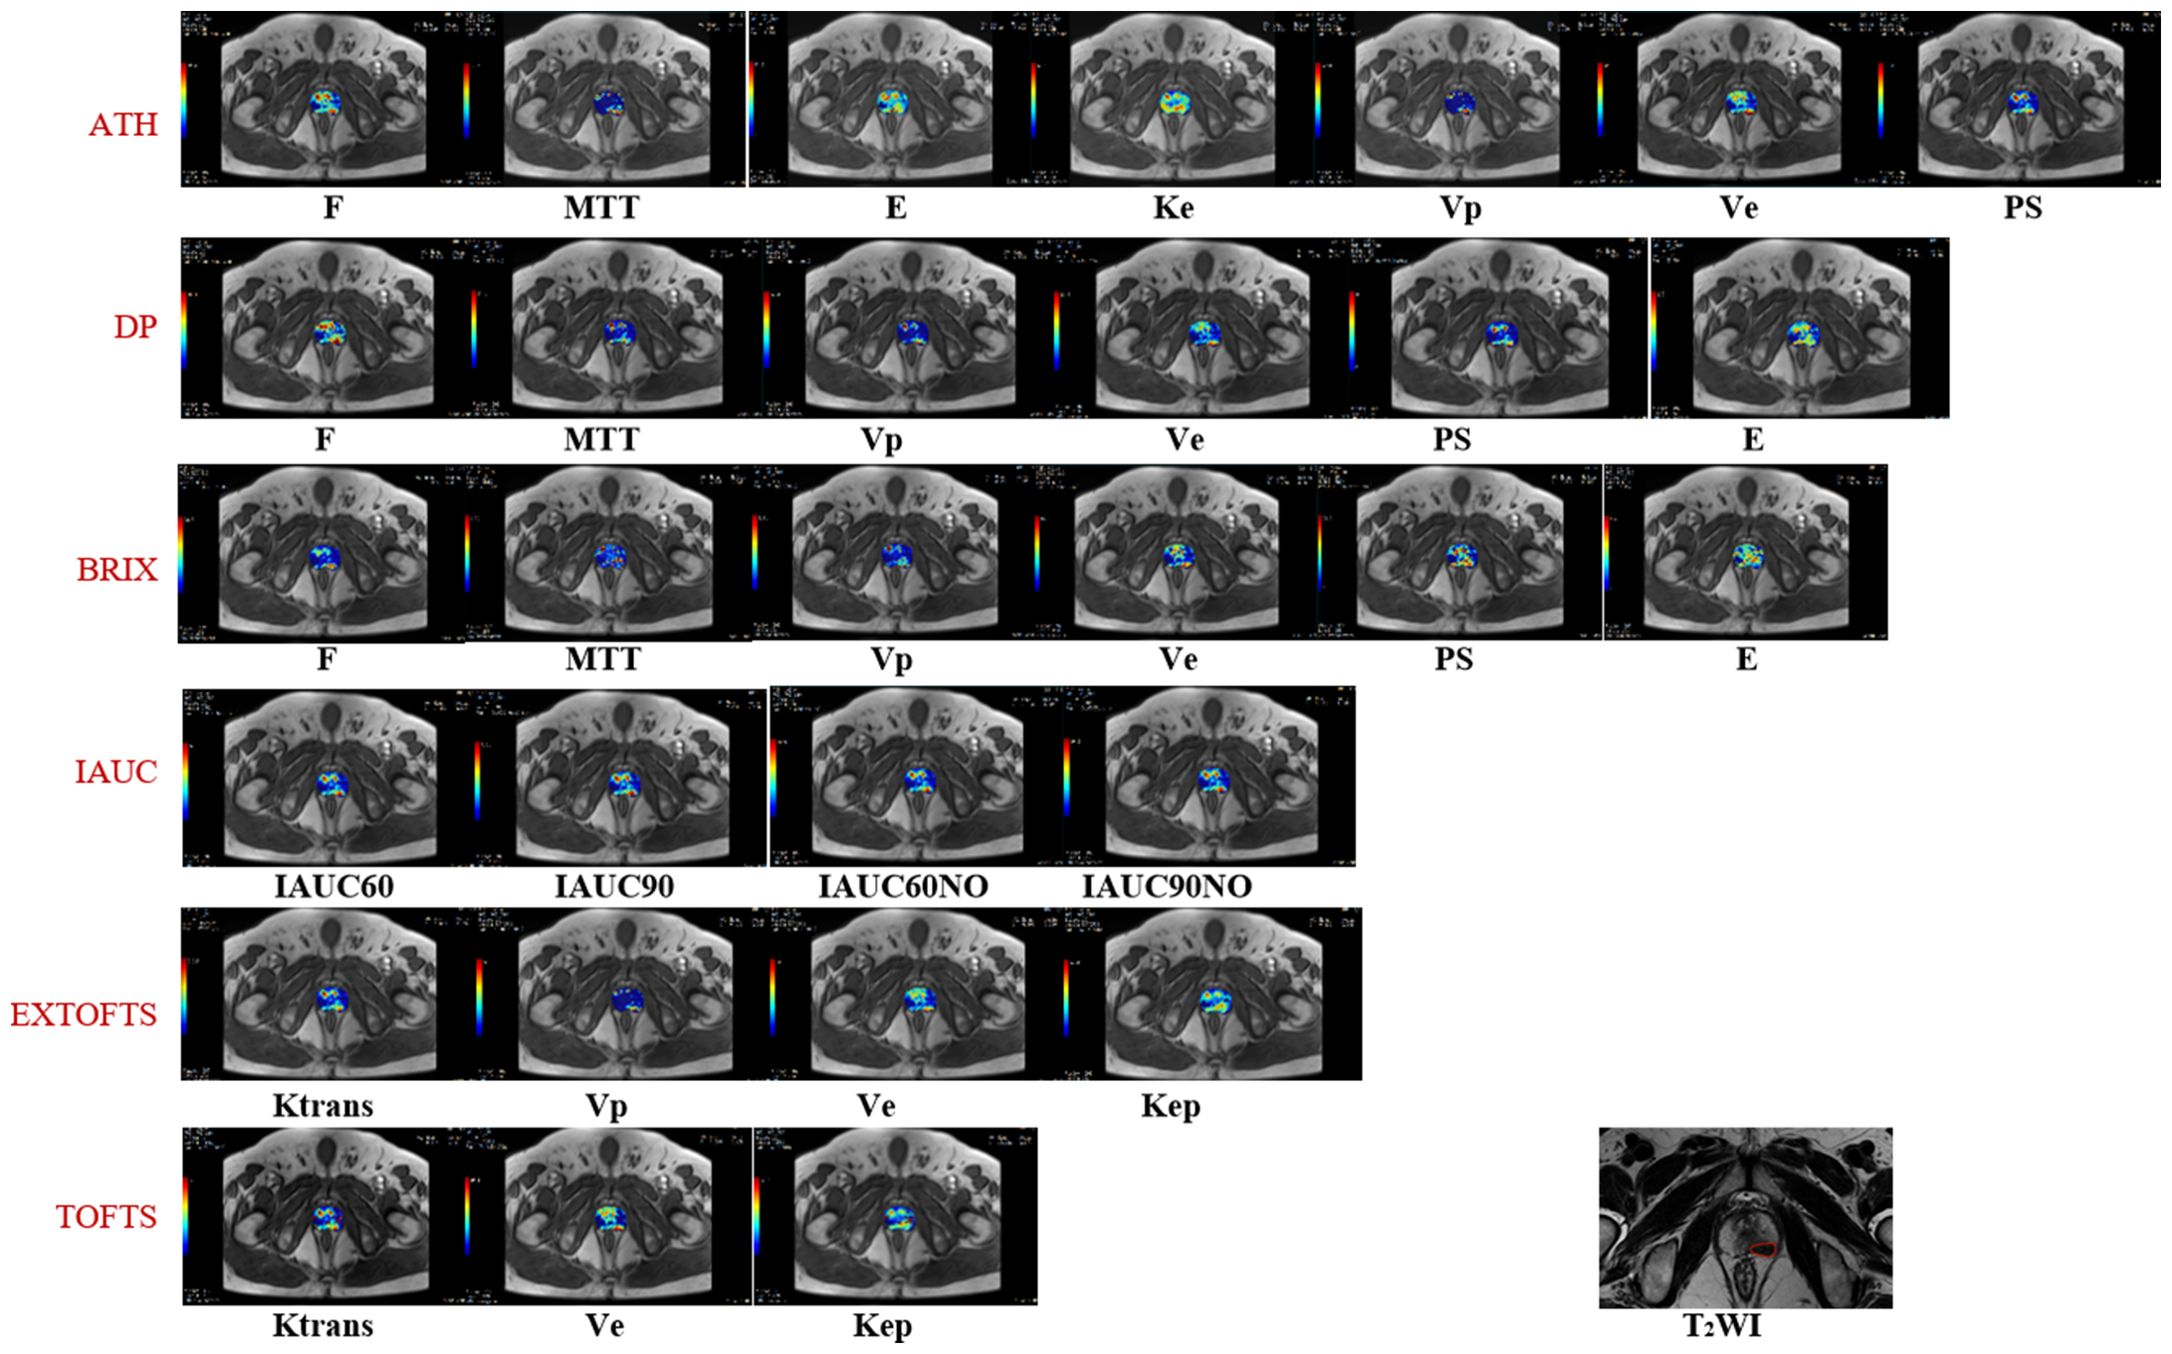
Figure 1. Shows representative parameter maps generated by using the various kinetic models. The corresponding T2 weighted image with a tumor ROI delineation.
3.2 Comparison of kinetic parameters and ROC analysis
624 lesion ROIs and 269 normal tissue ROIs were identified. Median values for each parameter in lesions that are suspicious of malignancy and normal tissues are detailed in Table 3. Only PS from Brix shows no statistically significant difference between lesions that are suspicious of malignancy and normal tissues via the Mann–Whitney U test. All parameter values in lesions that are suspicious of malignancy are larger than those in normal tissues. The ROC curves of the various kinetic parameters with AUC values and thresholds are shown in Figure 2. MTT, Vp and PS from DP, Ktrans and Kep from ETM, Ktrans from Tofts, E and PS from ATH, F and Vp from Brix and IAUC parameters yielded large AUC values (>0.8) in discriminating tumor from normal tissue. Ve from all models exhibited poor performance with an AUC value of less than 0.6. Additionally, AUC value of PS from Brix is less than 0.6.Table 4 summarizes the ROC curve analysis results including optimal cutoff value, sensitivity, specificity, and accuracy. Ktrans derived from the Tofts model gave the best performance in differentiating suspicious malignant lesions from normal prostate tissues (AUC=0.86), with a sensitivity of 83.9% and a specificity of 75.4% with a cutoff value of 0.07.
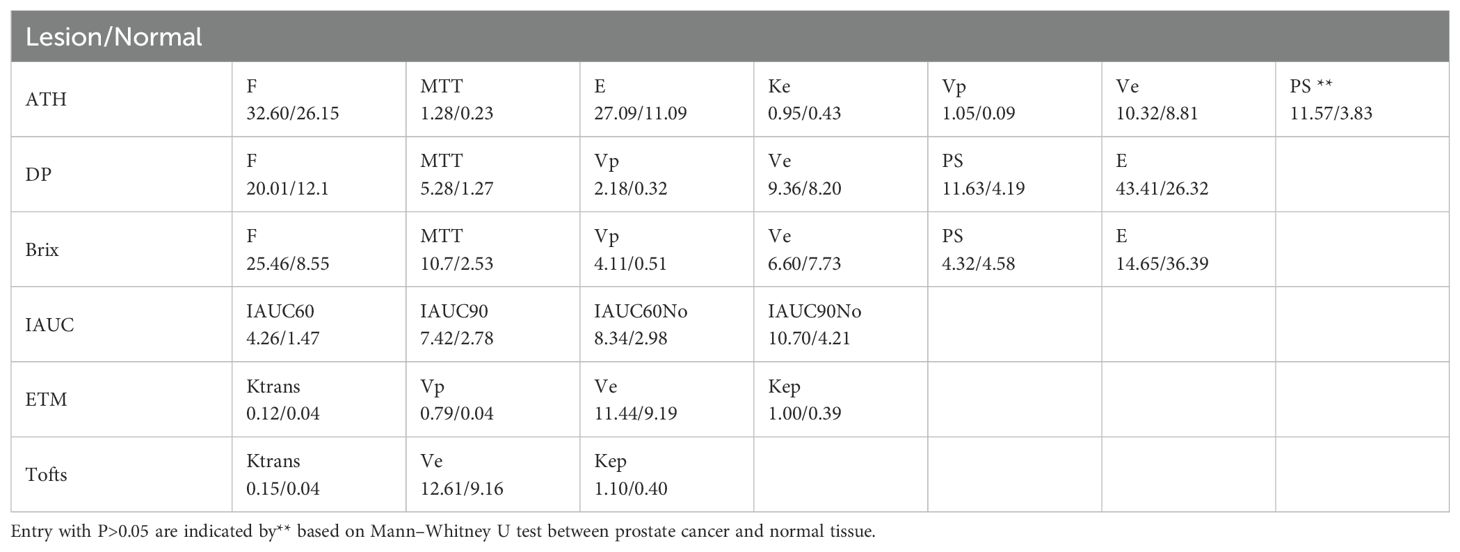
Table 3. Median parameter values in lesions and normal tissues derived from different kinetic models.
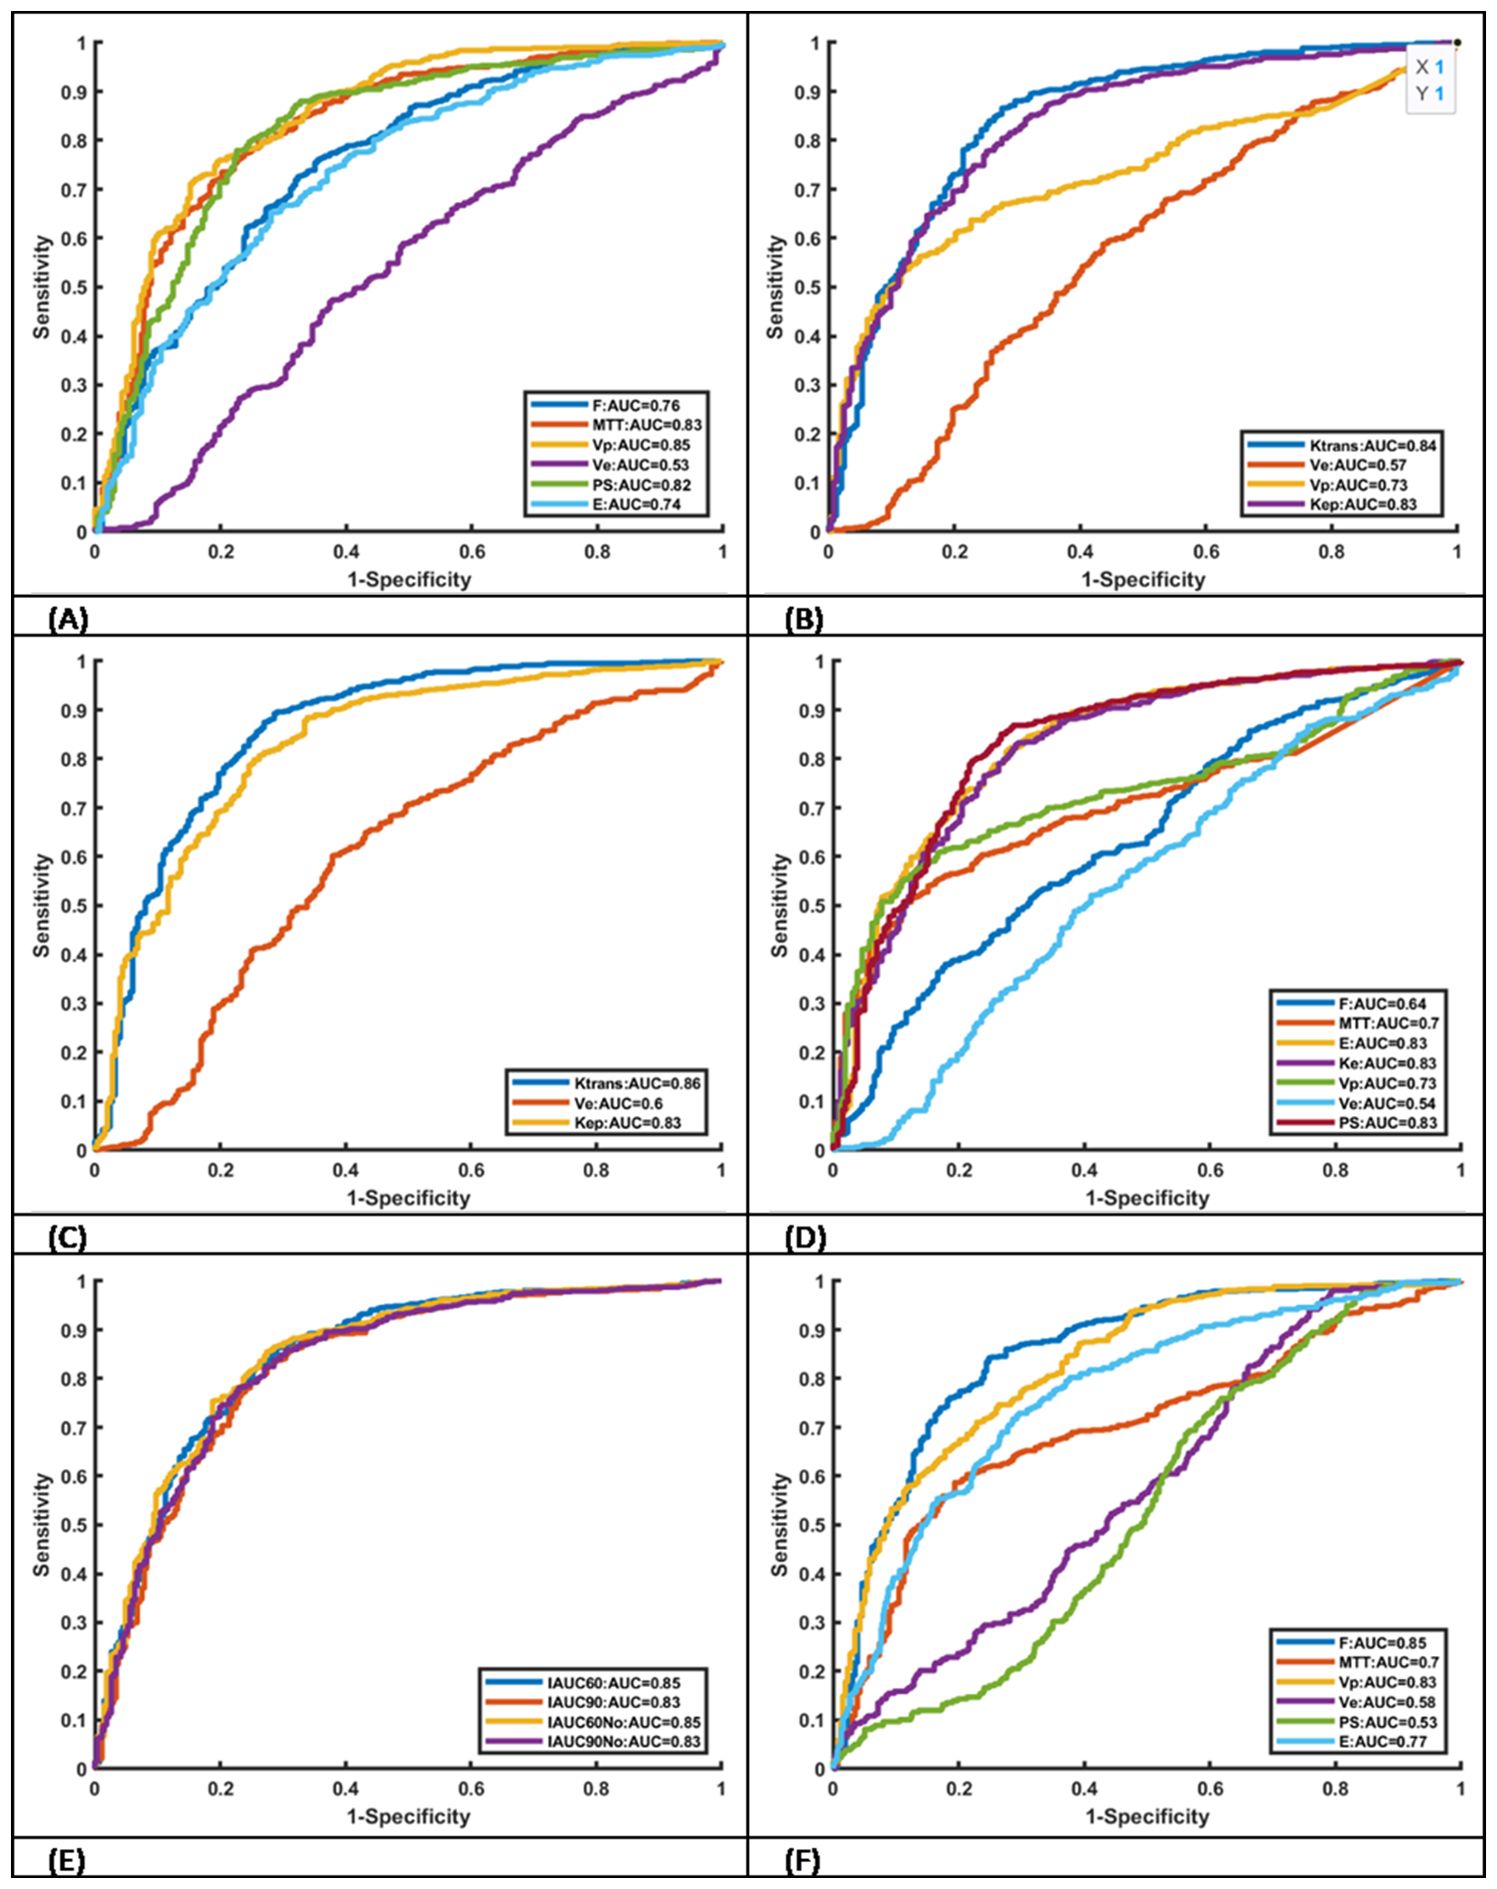
Figure 2. Receiver operating characteristic curves of kinetic parameters derived from six different models AUC values. (A) DP, (B) ETM. (C) TOFTS, (D) ATH, (E) IAUC and (F) Brix.

Table 4. Spearman’s correlation coefficient between parameters of DP model (F, tp, Vp, Ve, PS and E) and ETM (Ktrans, Ve, Vp and Kep) in lesions and normal tissues.
3.3 Correlations between DP and ETM parameters
The results of Spearman’s correlation coefficients between parameters of DP model are shown in Table 4. Except for the correlation between MTT and Kep, Ve and Ktrans, E and Kep in the lesions, Ve and Vp, E and Vp in the normal tissues, other correlations are statistically correlated with different coefficient values (P<0.05). Ve from DP is negatively correlated with Kep from ETM for both lesions and normal tissues. Ve from DP are highly correlated with those from ETM with correlation coefficient larger than 0.9. For lesions, both F and PS are positively correlated with Ktrans from ETM.
4 Discussion
In this study, quantitative DCE parameters from different TKMs were investigated to discriminate PCa and normal tissue. Results showed that (1) Vp from DP, F from Brix, Ktrans from Tofts and IAUC60 gave AUC values>0.85 (2), most parameters showed significant differences, and (3) all TKMs presented good performance, with one or more parameters AUC>0.80. All advanced TKMs demonstrated that prostate cancer tissue was characterized by higher values of F, Vp, MTT, PS and E in comparison with normal tissue. Except for Ktrans from Tofts, Vp from DP, F from Brix, IAUC60 and IAUC60No from IAUC, they also have excellent performance in discrimination with an AUC of 0.85. In this study, Ktrans from Tofts, which determines the rate of gadolinium influx from plasma into the extravascular extracellular space (EES), gave the best performance in terms of AUC value. Ktrans can describe only PS when the transport of the tracer across the vessel wall is limited by permeability in the situation of high blood flow. In the Mann–Whitney U tests, only PS from Brix did not give statistically significant differences between oncological lesions and normal tissues. Except for PS from Brix, PS from DP and ATH give high AUC values (larger than 0.8). This could be partially explained by the difference Brix and DP or ATH on the assumption of intravascular distribution of gadolinium contrast. In the ROC analysis, Ve from all TKMs, measuring the fractional volume of the EES, showed poor capability in differentiation, which suggests no significant difference of “room” available within the tissue interstitium for accumulating gadolinium between oncological lesions and normal tissues. correlation analysis between DP and ETM illustrated a moderately positive correlation between DP-derived PS and ETM-derived Ktrans in prostate cancer tissue, but a weakly positive correlation in prostate normal tissue.
For DCE imaging, 3D T1w-GRE with a temporal resolution of less than 15 seconds is recommended in PI-RADS v2.1 (6).The present study used a DCE-MRI protocol with a temporal resolution of 2 seconds, which may help capture rapid changes of signal intensity and improve quantitative analysis. However, short-interval image acquisition may easily lead to motion error. A robust image registration method dedicated to DCE kinetic modeling is being developed and will be incorporated in the image analysis protocol.
The presence of benign disease (e.g, benign prostatic hyperplasia, inflammation, prostatic intraepithelial neoplasia, and atrophy) is a common cause of false positive errors in diagnosing PCa using mpMRI. To determine the best features to discriminate PCa from benign disease and its relationship to benign disease classification and tumor grade, Litjens and colleagues derived a series of features from T2WI, ADC map, and DCE parametric maps (including Tofts-derived parametric maps), and used sequential forward floating feature selection analysis to identify the best combination of MRI parameters to discriminate among benign classes (23). The results showed that Ve maps provided the best separation between cancer and atrophy. For the other types of noncancerous lesions, features from all three modalities were included, indicating that each parameter in mpMRI provided additional information to the diagnostic process (23). The finding supported the added value of quantitative DCE in the characterization of nonmalignant lesions.
Akin and coauthors assessed the incremental value of DWI and DCE to T2WI in detecting locally recurrent PCa after radiotherapy, and they found that biopsy-positive and biopsy-negative prostate sides differed significantly in Tofts-derived Ktrans and Kep (24). Verma et al. presented a review of earlier efforts of DCE-MRI in prostate management and concluded that DCE-MRI was emerging as a useful clinical technique as part of a multi-parametric approach for evaluating the extent of primary and recurrent prostate cancer, however, performing a high-quality DCE-MRI examination required an in-depth knowledge of the technical aspects and limitations of image acquisition and postprocessing techniques (9). An appraisal of the application of mpMRI to PCa diagnosis was recently reported (16). Even though the use of DCE is currently of debate, DCE seems to be particularly useful when T2WI and DWI are equivocal or degraded by artefacts. In particular, DCE has demonstrated an important role in the evaluation of local recurrence after interventions (such as transurethral resection of the prostate and focal therapy) that change prostate morphology, where the standard PI-RADS score is not applicable (16). The value of DCE in detecting local PCa recurrence with biochemical relapse after local treatment with curative intent was recognized in the recently published Prostate Imaging for Recurrence Reporting (PI-RR) system (25), where the PI-RR assessment after radiation therapy is mainly derived from the DWI and DCE sequences (where DCE would be of particular importance when DWI could be subject to susceptibility artefacts after low-dose-rate brachytherapy), and the final PI-RR assessment score after radical prostatectomy is generated using the individual DWI and DCE sequences, with DCE being the dominant sequence. The long-term goal of this study is to explore whether quantitative kinetic parameters from dynamic scans can be used to improve the weighting of DCE imaging in the PI-RADS and PI-RR. Multi-center and multi-nation large-scale clinical trials are needed to address this issue.
There are several avenues to improve the study. Firstly, this is a single institution study and the size of the effective dataset is moderate, and the findings need to be further validated in multicenter trials with large cohort size. Secondly, lesions and normal tissues ROIs were manually delineated by a senior radiologist with more than 10 years’ experience, but this still may introduce variability of ROI delineation. Thirdly, this study does not differentiate the location of malignant lesions. In clinical practice, localized prostate cancer shows great clinical, genetic and environmental heterogeneity, and spatial distribution in tumorigenesis are being increasingly considered for further personalized treatment. Fourthly, this study does not investigate the difference between csPCa (Gleason score>6) and ciPCa (Gleason score=6), which could be studied in the future when more samples of ciPCa are recruited.
5 Conclusion
This study compared quantitative DCE parameters from different TKMs in distinguishing PCa from normal tissue. Preliminary results turned out that MTT, Vp, and PS from DP, Ktrans from ETM and Tofts, E, and PS from ATH, IAUC parameters and F from Brix could be helpful in discriminating prostate malignant lesions from prostate normal tissues. Parameter values from DP are correlated with those from ETM.
Data availability statement
The original contributions presented in the study are included in the article/supplementary material. Further inquiries can be directed to the corresponding authors.
Ethics statement
The studies involving humans were approved by the Ethics Committee of The First People’s Hospital of Yunnan Province. The studies were conducted in accordance with the local legislation and institutional requirements. The participants provided their written informed consent to participate in this study.
Author contributions
HZ: Conceptualization, Methodology, Writing – original draft. JY: Writing – original draft. KW: Project administration, Supervision, Writing – review & editing. ZH: Writing – review & editing. JD: Data curation, Writing – review & editing. JHY: Writing – review & editing. YZ: Conceptualization, Methodology, Writing – review & editing.
Funding
The author(s) declare that financial support was received for the research, authorship, and/or publication of this article. This study has received funding by the Yunnan Provincial Department of Science and Technology-Kunming Medical University Applied Basic Research Joint Special General Project (202201AY070001-254).
Conflict of interest
The authors declare that the research was conducted in the absence of any commercial or financial relationships that could be construed as a potential conflict of interest.
Publisher’s note
All claims expressed in this article are solely those of the authors and do not necessarily represent those of their affiliated organizations, or those of the publisher, the editors and the reviewers. Any product that may be evaluated in this article, or claim that may be made by its manufacturer, is not guaranteed or endorsed by the publisher.
References
1. Han B, Zheng R, Zeng H, Wang S, Sun K, Chen R, et al. Cancer incidence and mortality in China, 2022. J Natl Cancer Center. (2024) 4:47–53. doi: 10.1016/j.jncc.2024.01.006
2. James ND, Tannock I, N’Dow J, Feng F, Gillessen S, Ali SA, et al. The Lancet Commission on prostate cancer: planning for the surge in cases. Lancet. (2024) 403:1683–722. doi: 10.1016/S0140-6736(24)00651-2
3. Moldovan PC, Van Den Broeck T, Sylvester R, Marconi L, Bellmunt J, Van Den Bergh RCN, et al. What is the negative predictive value of multiparametric magnetic resonance imaging in excluding prostate cancer at biopsy? A systematic review and meta-analysis from the european association of urology prostate cancer guidelines panel. Eur Urol. (2017) 72:250–66. doi: 10.1016/j.eururo.2017.02.026
4. Panebianco V, Barchetti G, Simone G, Del Monte M, Ciardi A, Grompone MD, et al. Negative multiparametric magnetic resonance imaging for prostate cancer: what’s next? Eur Urol. (2018) 74:48–54. doi: 10.1016/j.eururo.2018.03.007
5. Kasivisvanathan V, Rannikko AS, Borghi M, Panebianco V, Mynderse LA, Vaarala MH, et al. MRI-targeted or standard biopsy for prostate-cancer diagnosis. n Engl J Med. (2018) 378:1767–77. doi: 10.1056/NEJMoa1801993
6. Turkbey B, Rosenkrantz AB, Haider MA, Padhani AR, Villeirs G, Macura KJ, et al. Prostate imaging reporting and data system version 2.1: 2019 update of prostate imaging reporting and data system version 2. Eur Urol. (2019) 76:340–51. doi: 10.1016/j.eururo.2019.02.033
7. Lotte R, Lafourcade A, Mozer P, Conort P, Barret E, Comperat E, et al. Multiparametric MRI for Suspected Recurrent Prostate Cancer after HIFU : Is DCE still needed? Eur Radiol (2018) 28:3760–9. doi: 10.1007/s00330-018-5352-z
8. Zawaideh JP, Sala E, Shaida N, Koo B, Warren AY, Carmisciano L, et al. Diagnostic accuracy of biparametric versus multiparametric prostate MRI: assessment of contrast benefit in clinical practice. Eur Radiol (2020) 30:4039–49. doi: 10.1007/s00330-020-06782-0
9. Verma S, Turkbey B, Muradyan N, Rajesh A, Cornud F, Haider MA, et al. Overview of dynamic contrast-enhanced MRI in prostate cancer diagnosis and management. Am J Roentgenology. (2012) 198:1277–88. doi: 10.2214/AJR.12.8510
10. Tavakoli AA, Hielscher T, Badura P, Görtz M, Kuder TA, Gnirs R, et al. Contribution of dynamic contrast-enhanced and diffusion MRI to PI-RADS for detecting clinically significant prostate cancer. Radiology. (2023) 306:186–99. doi: 10.1148/radiol.212692
11. Tofts PS, Brix G, Buckley DL, Evelhoch JL, Henderson E, Knopp MV, et al. Estimating kinetic parameters from dynamic contrast-enhanced t1-weighted MRI of a diffusable tracer: Standardized quantities and symbols. J Magn Reson Imaging. (1999) 10:223–32. doi: 10.1002/(SICI)1522-2586(199909)10:3<223::AID-JMRI2>3.0.CO;2-S
12. Tofts PS. Modeling tracer kinetics in dynamic Gd-DTPA MR imaging. Magnetic Resonance Imaging. (1997) 7:91–101. doi: 10.1002/jmri.1880070113
13. Alonzi R, Padhani AR, Allen C. Dynamic contrast enhanced MRI in prostate cancer. Eur J Radiol. (2007) 63:335–50. doi: 10.1016/j.ejrad.2007.06.028
14. Winkel DJ, Breit H-C, Block TK, Boll DT, Heye TJ. High spatiotemporal resolution dynamic contrast-enhanced MRI improves the image-based discrimination of histopathology risk groups of peripheral zone prostate cancer: a supervised machine learning approach. Eur Radiol. (2020) 30:4828–37. doi: 10.1007/s00330-020-06849-y
15. Park H, Kim SH, Kim JY. Dynamic contrast-enhanced magnetic resonance imaging for risk stratification in patients with prostate cancer. Quant Imaging Med Surg. (2022) 12:742–51. doi: 10.21037/qims-21-455
16. Stabile A, Giganti F, Kasivisvanathan V, Giannarini G, Moore CM, Padhani AR, et al. Factors influencing variability in the performance of multiparametric magnetic resonance imaging in detecting clinically significant prostate cancer: A systematic literature review. Eur Urol Oncol. (2020) 3:145–67. doi: 10.1016/j.euo.2020.02.005
17. Brix G, Semmler W, Port R, SChad LR, Layer G, Lorenz WJ. Pharmacokinetic parameters in CNS Gd-DTPA enhanced MR imaging. J Comput Assist Tomogr. (1991) 15:621–8. doi: 10.1097/00004728-199107000-00018
18. Lawrence KSST, Lee T-Y. An adiabatic approximation to the tissue homogeneity model for water exchange in the brain: I. Theor Derivation. J Cereb Blood Flow Metab. (1998) 18:1365–77. doi: 10.1097/00004647-199812000-00011
19. Lawrence KSST, Lee T-Y. An adiabatic approximation to the tissue homogeneity model for water exchange in the brain: II. Exp Validation. J Cereb Blood Flow Metab. (1998) 18:1378–85. doi: 10.1097/00004647-199812000-00012
20. Dennis Cheong LH, Tchoyoson Lim CC, Koh TS. Dynamic contrast-enhanced CT of intracranial meningioma: comparison of distributed and compartmental tracer kinetic models—Initial results. Radiology. (2004) 232:921–30. doi: 10.1148/radiol.2323031198
21. Koh TS, Cheong LH, Hou Z, Soh YC. A physiologic model of capillary-tissue exchange for dynamic contrast-enhanced imaging of tumor microcirculation. IEEE Trans BioMed Eng. (2003) 50:159–67. doi: 10.1109/TBME.2002.807657
22. Zwick S, Brix G, Tofts PS, Strecker R, Kopp-Schneider A, Laue H, et al. Simulation-based comparison of two approaches frequently used for dynamic contrast-enhanced MRI. Eur Radiol. (2010) 20:432–42. doi: 10.1007/s00330-009-1556-6
23. Litjens GJS, Elliott R, Shih NN, Feldman MD, Kobus T, Hulsbergen-van De Kaa C, et al. Computer-extracted features can distinguish noncancerous confounding disease from prostatic adenocarcinoma at multiparametric MR imaging. Radiology. (2016) 278:135–45. doi: 10.1148/radiol.2015142856
24. Akin O, Gultekin DH, Vargas HA, Zheng J, Moskowitz C, Pei X, et al. Incremental value of diffusion weighted and dynamic contrast enhanced MRI in the detection of locally recurrent prostate cancer after radiation treatment: preliminary results. Eur Radiol. (2011) 21:1970–8. doi: 10.1007/s00330-011-2130-6
25. Panebianco V, Villeirs G, Weinreb JC, Turkbey BI, Margolis DJ, Richenberg J, et al. Prostate magnetic resonance imaging for local recurrence reporting (PI-RR): international consensus -based guidelines on multiparametric magnetic resonance imaging for prostate cancer recurrence after radiation therapy and radical prostatectomy. Eur Urol Oncol. (2021) 4:868–76. doi: 10.1016/j.euo.2021.01.003
Keywords: DCE MRI, tracer kinetic modeling, prostate cancer, quantitative, Gleason score
Citation: Zhang H, Yang J, Wu K, Hou Z, Du J, Yan J and Zhao Y (2024) Comparison of tracer kinetic models in differentiating malignant from normal prostate tissue using dynamic contrast-enhanced MRI. Front. Oncol. 14:1450388. doi: 10.3389/fonc.2024.1450388
Received: 17 June 2024; Accepted: 15 November 2024;
Published: 06 December 2024.
Edited by:
Fabio Grizzi, Humanitas Research Hospital, ItalyReviewed by:
Bernhard Ralla, Charité University Medicine Berlin, GermanyManuela Andrea Hoffmann, Johannes Gutenberg University Mainz, Germany
Miguel Martín Landrove, Central University of Venezuela, Venezuela
Copyright © 2024 Zhang, Yang, Wu, Hou, Du, Yan and Zhao. This is an open-access article distributed under the terms of the Creative Commons Attribution License (CC BY). The use, distribution or reproduction in other forums is permitted, provided the original author(s) and the copyright owner(s) are credited and that the original publication in this journal is cited, in accordance with accepted academic practice. No use, distribution or reproduction is permitted which does not comply with these terms.
*Correspondence: Ying Zhao, Y2d6enlpbmdAMTYzLmNvbQ==; Jianhua Yan, amlhbmh1YS55YW5AZ21haWwuY29t
†These authors have contributed equally to this work and share first authorship
‡These authors have contributed equally to this work
 Hongjiang Zhang
 Jing Yang1†
 Kunhua Wu
 Zujun Hou
 Jianhua Yan
 Ying Zhao