- 1Department of Radiology, The First Affiliated Hospital of Dalian Medical University, Dalian, China
- 2Department of MRI, North China University of Science and Technology Affiliated Hospital, Tangshan, China
- 3Clinical and Technical Support, Philips Healthcare, Beijing, China
- 4School of Biomedical Engineering, Faculty of Medicine, Dalian University of Technology, Dalian, China
Purpose: To explore the value of quantitative imaging parameters by enhanced T2* weighted angiography (ESWAN) and dynamic contrast-enhanced magnetic resonance imaging (DCE-MRI) for evaluating the expression of Hypoxia-inducible factor-1α (HIF-1α) in endometrial carcinoma (EC).
Methods: Data from 122 patients with EC confirmed by clinical pathology were retrospectively analyzed. According to the number of positive cells stained with HIF-1α by immunohistochemistry, patients were divided into two groups: 65 cases with high expression of HIF-1α and 57 cases with low expression of HIF-1α. Clinical data included age, FIGO stage, menopausal status, abnormal uterine bleeding, and pathological type. All patients underwent preoperative 1.5T MRI scans, including ESWAN and DCE-MRI. The amplitude, phase, and R2* values derived from ESWAN and the volume transfer constant (Ktrans), rate constant (Kep), and extravascular volume fraction (Ve) values derived from DCE-MRI were measured by two observers, respectively. The intra-class correlation coefficient (ICC) was used to assess the measurement of reproducibility across observers, and the differences in imaging parameters between the two groups were compared using the independent sample t-test or Mann-Whitney U-test. Binary logistic regression analysis was used to find independent risk factors for HIF-1α expression. The efficacy of selected imaging parameters for predicting HIF-1α expression was assessed using receiver operating characteristic (ROC) curves, and the Delong test was used to compare the area under ROC curves (AUC).
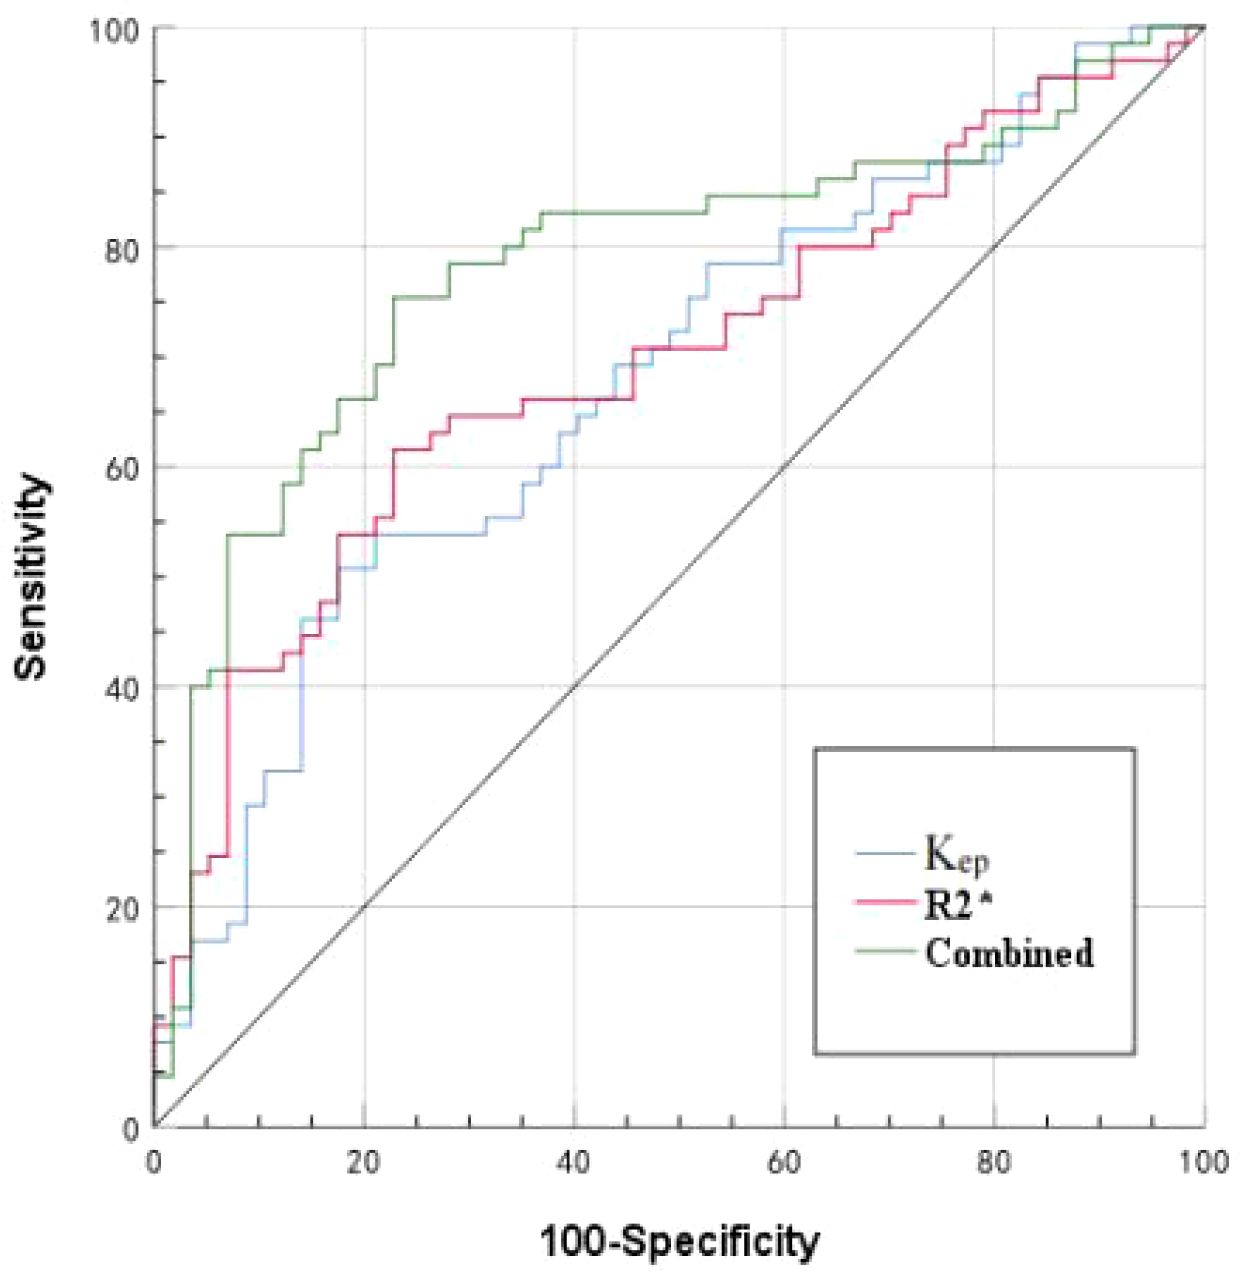
Results: The consistency between the two observers was good (ICC>0.75). The R2*, Ktrans, and Kep values of the HIF-1α high expression group were higher than those of the HIF-1α low expression group (14.59 ± 4.06 vs. 11.99 ± 2.84 Hz, 0.45 ± 0.18 vs. 0.36 ± 0.14/min, and 2.17 ± 1.10 vs. 1.54 ± 0.80/min) (P< 0.001, P = 0.011, and P =0.001). Binary logistic regression analysis revealed that R2* and Kep values were independent risk factors for HIF-1α expression. The AUC values of R2*, Kep, and their combination for prediction of HIF-1α expression were 0.697, 0.677, and 0.781, respectively. The diagnostic efficacy was significantly improved with combination of R2* and Kep.
Conclusions: Quantitative parameters by ESWAN and DCE-MRI showed significant differences between EC patients with low and high expression of HIF-1α, and the combination of ESWAN and DCE-MRI improves the efficacy in prediction of HIF-1α expression in EC, which has an excellent clinical application prospect.
Introduction
Endometrial carcinoma (EC) is the predominant gynecologic cancer in developed countries, exhibiting an escalating incidence globally (1). Due to the high mortality and recurrence rate, several studies have focused on evaluating the relationship between internal microenvironmental state of the tumor and clinical outcome of the patients (2, 3). Oxygen is vital in energy metabolism, tumors typically thrive in a hypoxic microenvironment. Malignant tumor cells, with their high energy needs, undergo metabolic reprogramming in this hypoxic setting. This promotes the survival of tumor cells, suppresses anti-tumor immunity, and promotes the growth of malignant tumors. Hypoxia-inducible factor-1α (HIF-1α) is the primary transcription factor regulating gene expression under hypoxia conditions (4). Previous studies have demonstrated a close relationship between HIF-1α expression and the oxygenation status of tumors, establishing it as a crucial biomarker of tumor hypoxia, invasiveness, or radioresistance (5, 6). The high expression of HIF-1α leads to high invasiveness or poor prognosis of EC. HIF-1α expression is usually detected through immunohistochemical staining of postoperative pathology. Obtaining the expression information of HIF-1α before treatment is helpful to quantitatively evaluate the degree of hypoxia of the tumor, thus helping to predict the treatment response or adjust the treatment plan as soon as possible.
Magnetic resonance imaging (MRI) techniques, especially several noninvasive and quantitative imaging methods, have been used to evaluate the hypoxia state in the human body before the operation, such as blood oxygen level-dependent (BOLD), diffusion-weighted imaging (DWI), intra-voxel incoherent motion (IVIM), and dynamic contrast-enhanced magnetic resonance imaging (DCE-MRI). BOLD reflects the changes of paramagnetic deoxyhemoglobin within erythrocytes and can be used to evaluate tumor oxygenation levels (7, 8). Given the generation of BOLD contrast is relatively cumbersome, its clinical application for tumor evaluation is limited. DWI and IVIM indirectly reflect tumor oxygenation status by assessing cell number levels in hypoxia. Li et al. (9) reported that the D value of the IVIM imaging was positively correlated with HIF expression, while the contrary results were found in another study (10).
The enhanced T2* weighted angiography (ESWAN), based on the difference of magnetic sensitivity between different tissues and the effect of blood oxygen level dependence, can accurately measure iron deposition in living tissues (11, 12). Some studies have found a correlation between R2* values obtained by ESWAN and hypoxia in rat glioma models (13). DCE-MRI could reflect the hemodynamic information of contrast agents in and out of the tumor, providing a quantitative reflection of tissue perfusion and an in vivo evaluation of tumor microcirculation status (14). Some studies have found that its quantitative parameters were related to hypoxia of soft tissue sarcoma (15) and nasopharyngeal carcinoma (16). This study aimed to preliminarily investigate the value of multiple quantitative parameters obtained by ESWAN and DCE-MRI in evaluating EC HIF-1α expression level.
Materials and methods
Research objects
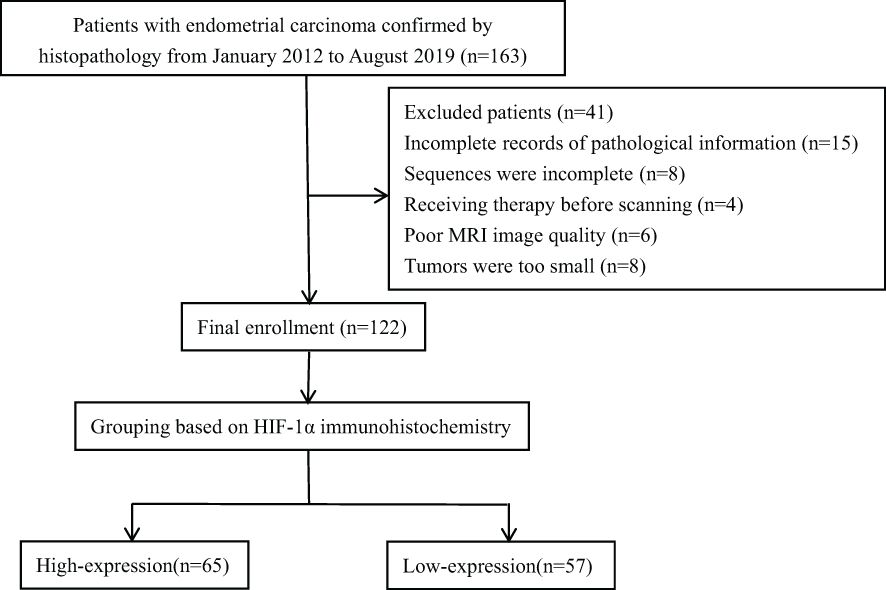
The retrospective analysis encompassed the clinical and imaging data of EC in our hospital from January 2012 to August 2019. This research plan was approved by the hospital institutional review board, and all patients obtained written informed consent. Inclusion criteria (1): Patients confirmed by pathology to have EC with complete pathological data (2); MRI sequences included ESWAN and DCE-MRI (3); The largest diameter of the lesion was > 1 cm. Exclusion criteria (1): Patients who had received chemoradiotherapy or other treatments (including biopsy or curettage) before the MRI examination (2); Poor MRI image quality with artifacts that affected data measurement. The final enrollment included 122 EC patients. According to the proportion of HIF-1α positive cells, the patients were divided into two groups, including 65 cases in HIF-1α high expression group and 57 cases in HIF-1α low expression group. The research flow chart was shown in Figure 1.
MRI imaging
MRI examinations were performed with a 1.5T MRI scanner (GE 1.5 T Signa HDXT MR) equipped with an 8-channel body coil within two weeks before operation. All patients were asked to urinate and fast for 4 to 6 hours before MRI examination. MRI sequences included T1WI, T2WI, DWI, ESWAN, and DCE-MRI. The DCE-MRI was collected for 30 phases, with each phase lasting 6 seconds. After the first phase of dynamic scans, the contrast agent Omniscan (Gd-DTPA-BMA, Nycomed Pharma, Norway) was intravenously injected at a concentration of 0.1mmol/kg of body weight, at a rate of 3 ml/s, followed by a 20 ml saline flush. The main scanning parameters were summarized in Table 1.
Imaging analysis
The original imaging data were transmitted to the GE ADW 4.6 workstation, where ESWAN data were processed using the integrated software (Function Tool, GE Healthcare) to generate amplitude, phase, and R2* maps. The DCE-MRI was analyzed and processed by the integrated software to acquire volume transfer constant (Ktrans), rate constant (Kep), and extravascular volume fraction (Ve) maps. Two radiologists (Y.Z.X. and J.C.M., with 10 and 5 years of experience in uterine MRI, respectively) independently conducted the image analysis, oblivious to the specific pathological results. With T2WI and DWI images as reference, the parenchymal portion of tumor enhancement on the largest diameter slice on DCE-MRI was delineated as the region of interest (ROI). The parenchymal portion of the tumor should be included as much as possible (Figures 2, 3), with an area larger than 0.5 cm2 and a distance greater than 0.2 cm from the tumor edge, and with exclusion of cystic lesions, bleeding, or adjacent vessels. Each observer draw the ROI for two times and recorded the mean value for all ESWAN and DCE-MRI parameters.
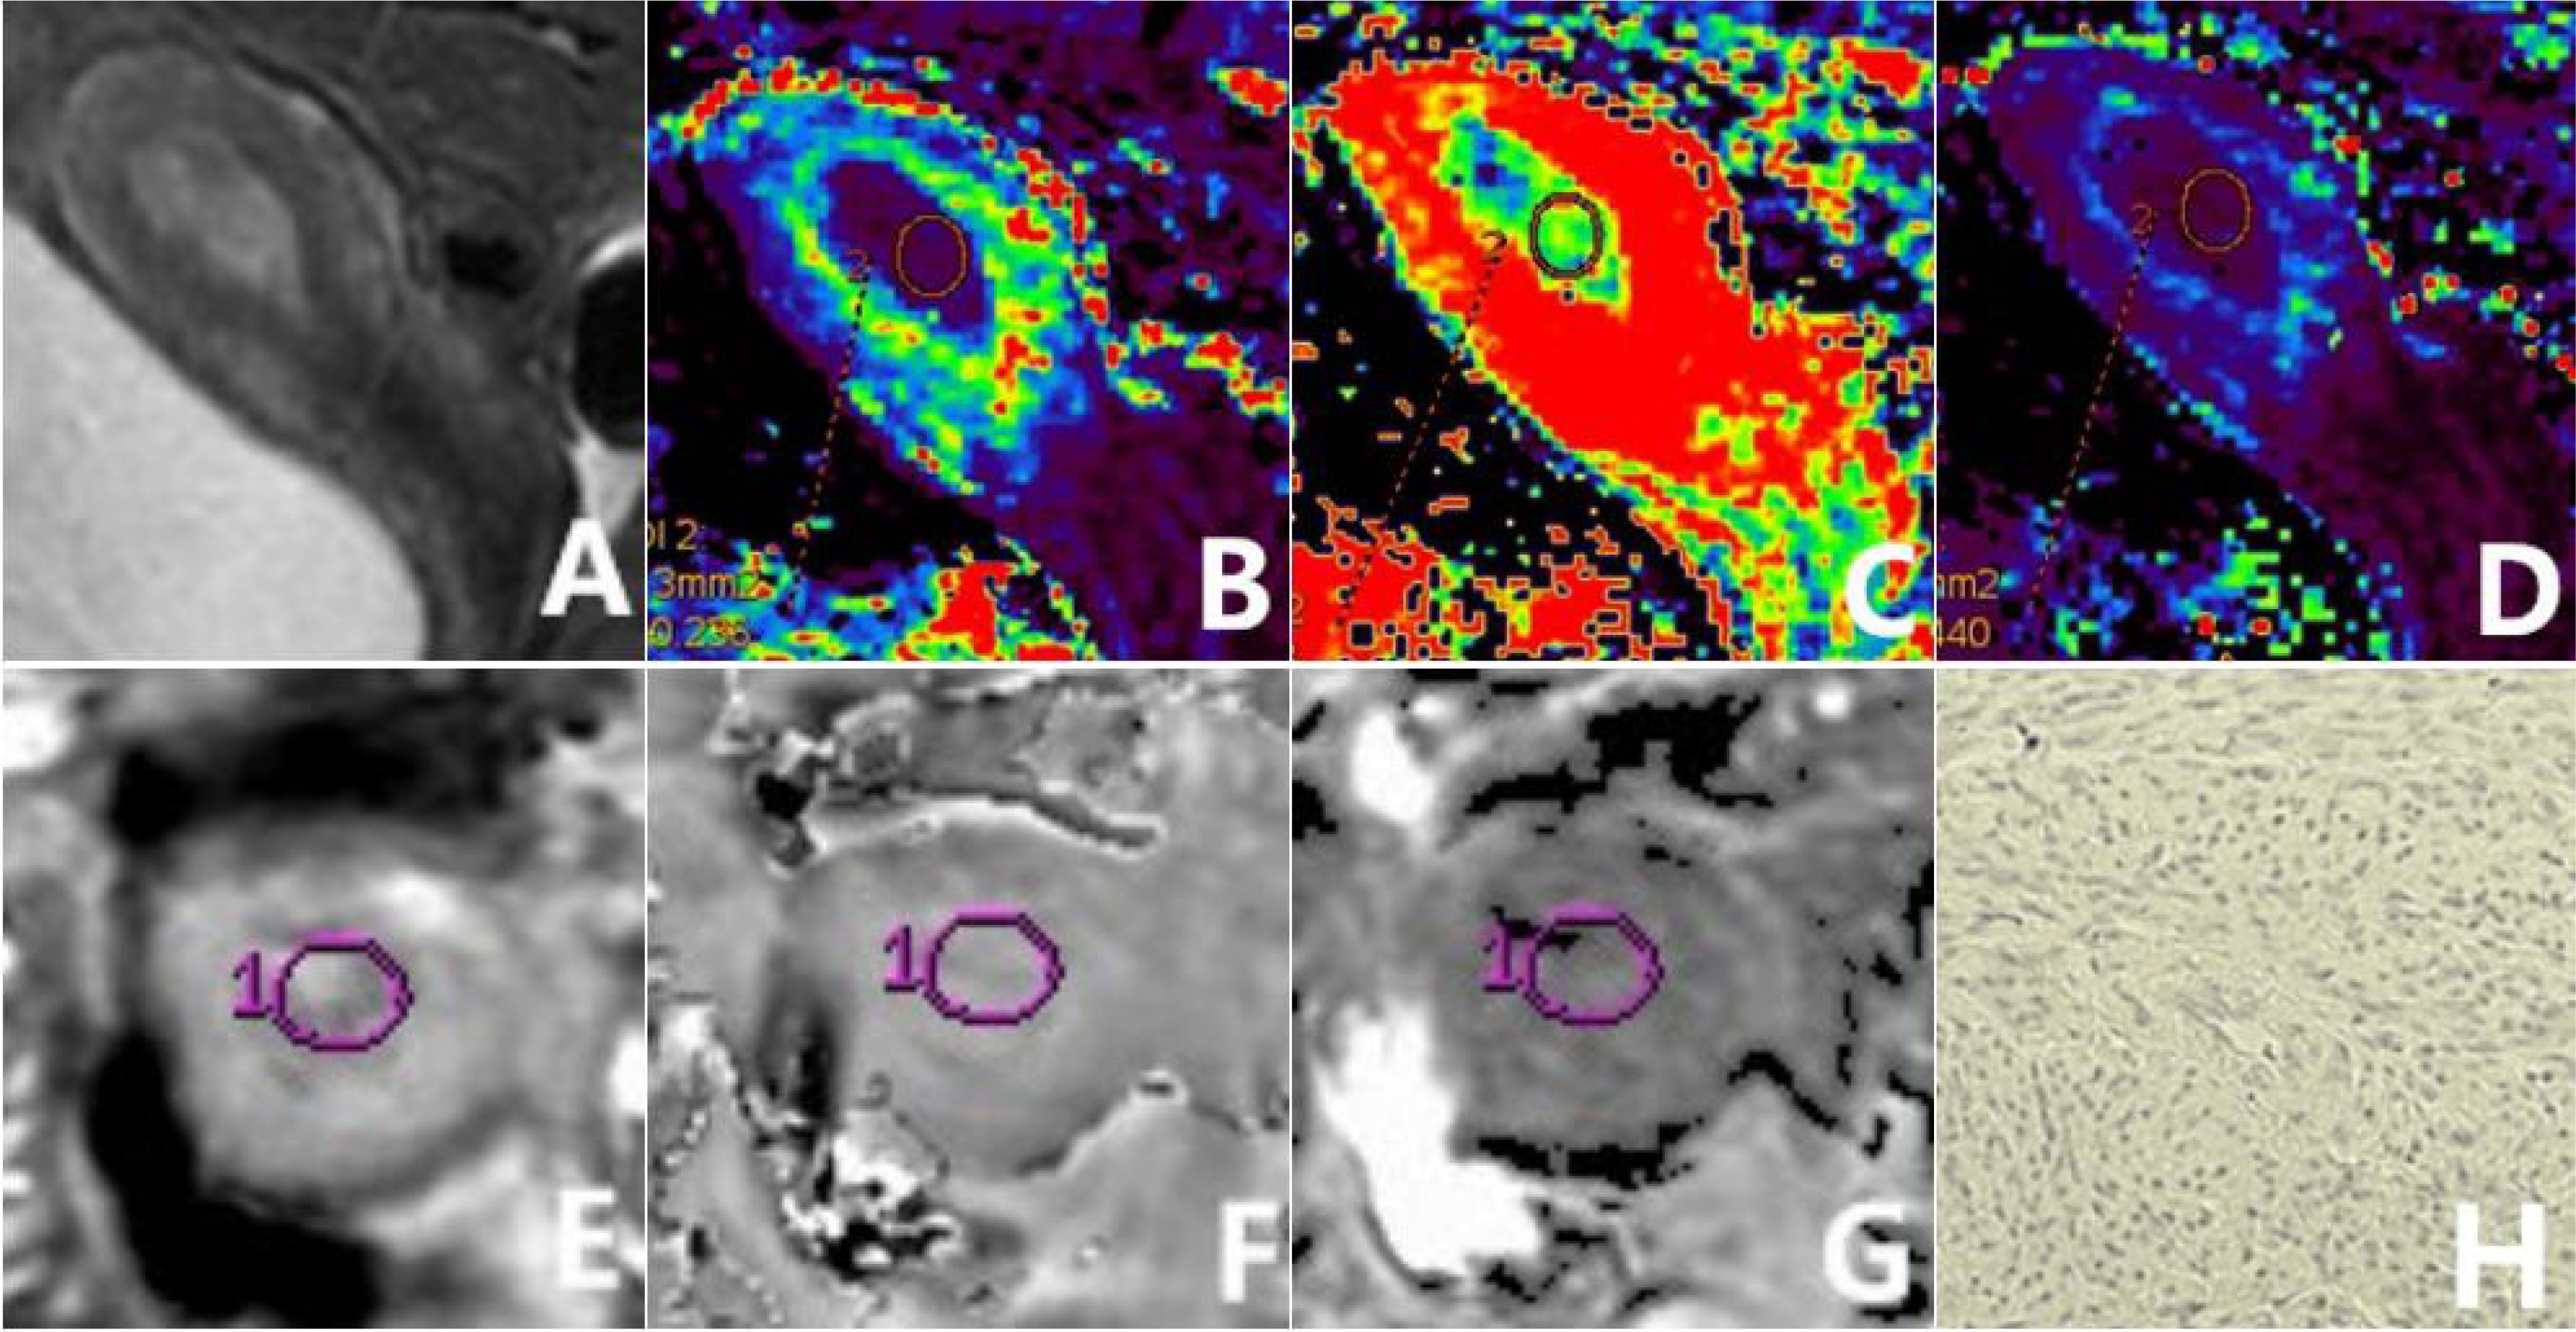
Figure 2. a 56-year-old patient diagnosed with type II EC of a poorly differentiated nature, exhibiting low HIF-1α expression. The sagittal T2WI (A) elucidates a pervasive, marginally elevated signal intensity within the uterine cavity, accompanied by a discontinuous signal in the junctional zone. The Ktrans (B), Ve (C), and Kep (D) maps of the sagittal DCE-MRI show quantitative values of 0.216 min-1, 0.302, and 0.753 min-1, respectively, for the tumor. The amplitude (E), phase (F), and R2* (G) maps of the axial ESWAN show quantitative values of 953.13, 0.087 radians, and 13.842 Hz, respectively, for the tumor. The immunohistochemical staining image (H) (×200) reveals that HIF-1α staining positive cells is less than 50% and the staining intensity is less than 2 points.

Figure 3. a 65-year-old patient diagnosed with type I EC of a highly differentiated nature, exhibiting high HIF-1α expression. The sagittal T2WI (A) elucidates a pervasive, marginally elevated signal intensity in the uterine cavity extending to the cervix, with an incomplete signal in the junctional zone. The Ktrans (B), Ve (C), and Kep (D) maps of the sagittal DCE-MRI show quantitative values of 0.547 min-1, 0.231, and 2.607 min-1, respectively, for the tumor. The amplitude (E), phase (F), and R2* (G) maps of the axial ESWAN show quantitative values of 1370.4, 0.015 radians, and 11.398 Hz, respectively, for the tumor. The immunohistochemical staining image (H) (×200) reveals thatHIF-1α staining positive cells is more than 50% and the staining intensity is more than 2 points.
HIF-1α immunohistochemistry
Immunohistochemical staining of HIF-1α was performed on 5-μm formalin-fixed paraffin-embedded tissue sections. The scoring of HIF-1α immunohistochemical results was based on the proportion of cells showing positive staining: 0 points, 0-25% (no staining or weakly positive); 1 point, 25-50% (moderately positive); 2 points, 50-75% (distinct positive); 3 points, 75-100% (strongly positive); and 4 points, 100% (entirely positive). Cases with scores 2 to 4 were categorized as the high-expression group, while the remaining cases were classified as the low-expression group (10, 15).
Statistical analysis
Statistical analysis was performed with statistical software packages (SPSS 22.0 Chicago, IL, USA) and Med Calc 15.2.2 software (Med Calc Software, Ostend, Belgium). The interclass correlation coefficient (ICC) was used to evaluate the agreement of the measurement data between two observers. Data were determined to be generally distributed according to the Kolmogorov-Smirnov test and were compared using the independent samples t-test or the Mann-Whitney U test. General clinical information of the two groups of patients were defined as the number of cases or rate (%), and the comparison between groups was made using the chi-square test or Fisher’s exact probability method. Binary logistic regression was used to identify independent risk factors in predicting HIF-1α expression in EC. Receiver operating characteristic (ROC) analysis was used to evaluate the efficacy of different imaging parameters and their combination in predicting HIF-1α expression in EC, with the area under the curve (AUC), threshold, sensitivity, and specificity calculated. The Delong test was used to compare the variability among the AUC values. P < 0.05 was recognized as statistically significant.
Results
Patient’s characteristics
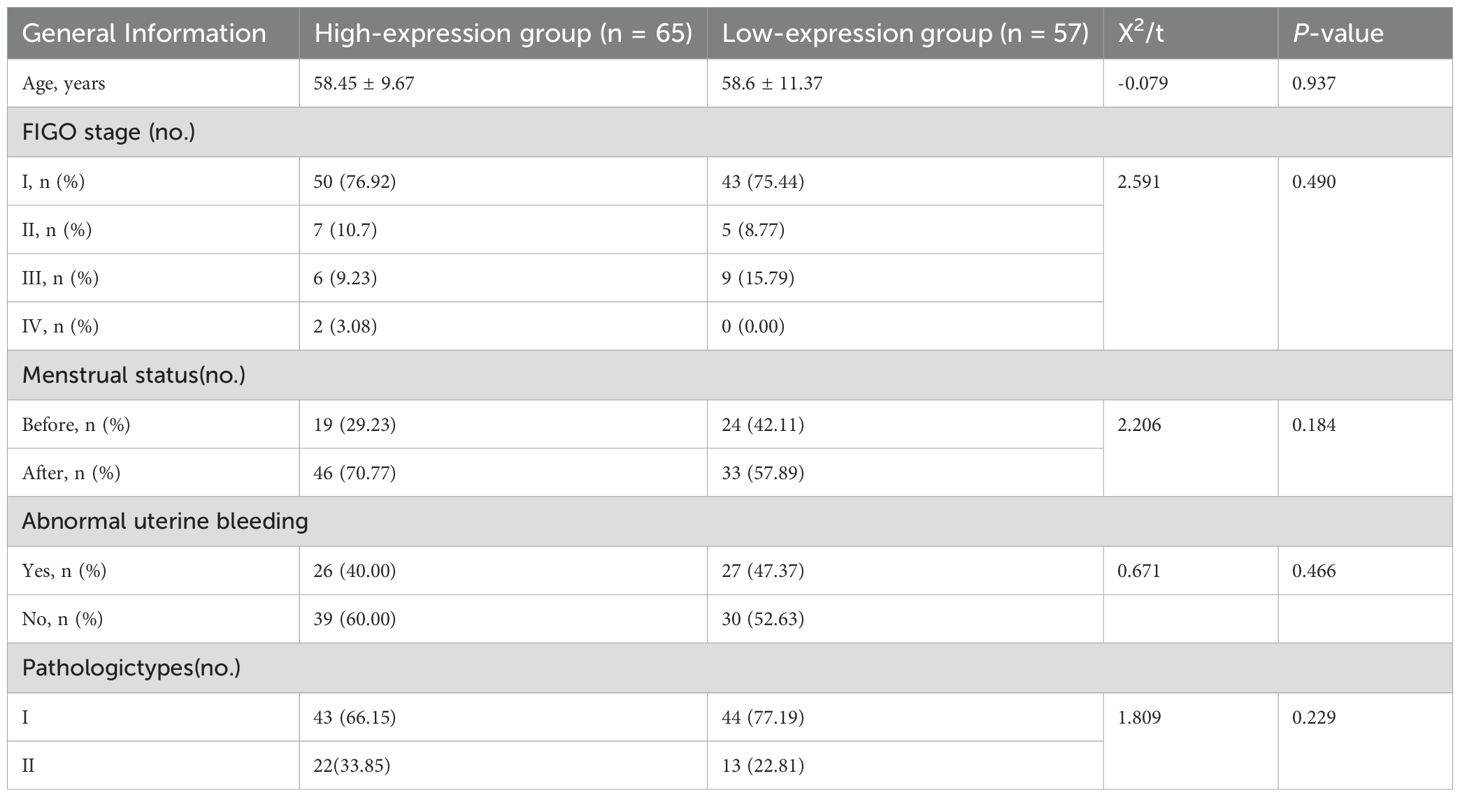
There were no notable variations between the two groups in clinical characteristics such as age, International Federation of Gynecology and Obstetrics (FIGO) stage, menopausal status, abnormal uterine bleeding, and type of pathology (P > 0.05) (as shown in Table 2).
Comparison of ESWAN and DCE-MRI parameters between two patient groups
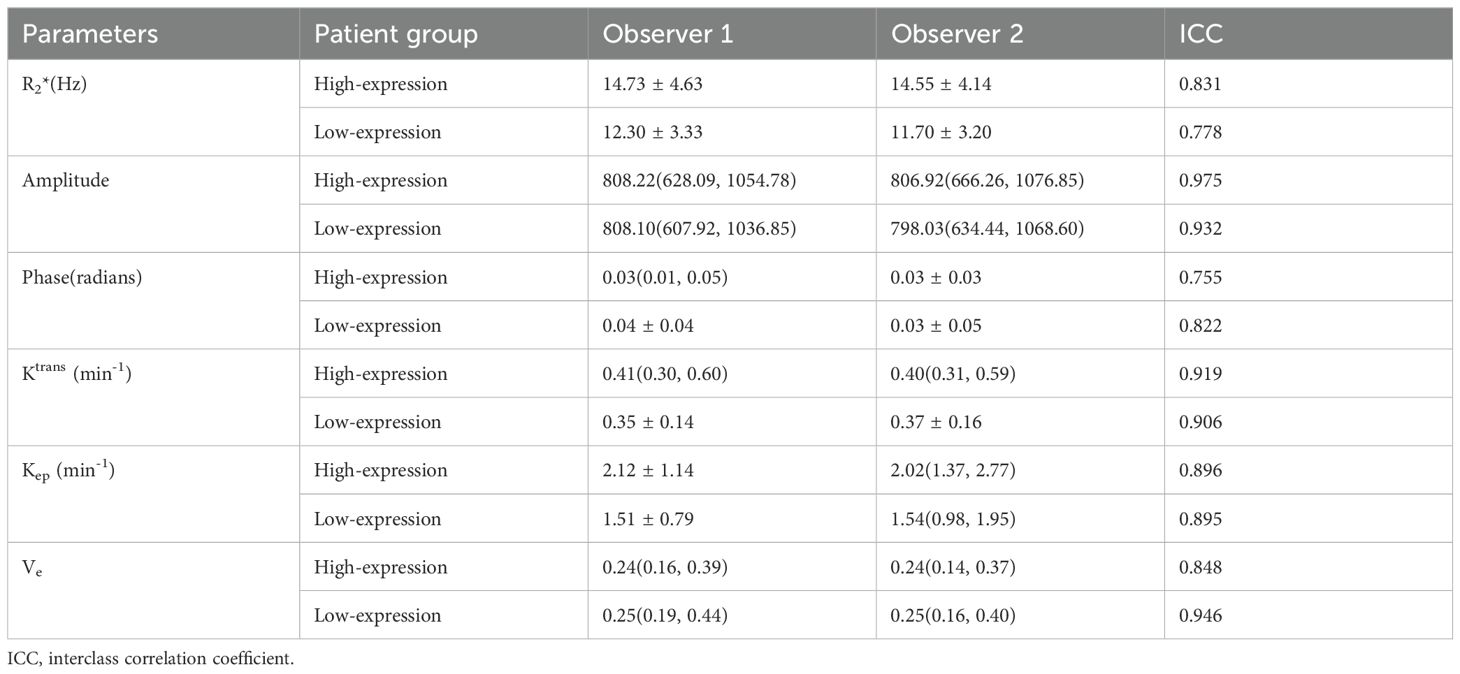
Data measurements by the two observers had a high consistency (ICC>0.75), and the mean of the two measurements were taken for further study (as shown in Table 3). The high-expression group had a significantly higher R2*, Ktrans, and Kep values than the low-expression group (14.59 ± 4.06 vs. 11.99 ± 2.84 Hz, 0.45 ± 0.18 vs. 0.36 ± 0.14/min, and 2.17 ± 1.10 vs. 1.54 ± 0.80/min) (P<0.001, P =0.011, and P =0.001). However, no significant between-group difference was found concerning amplitude, phase, and Ve values (as shown in Table 4 and Figure 4).

Figure 4. Box plots of parameters in the two patient groups. Comparison of R2* (A), Ktrans (B), and Kep (C) between the two groups. *: P < 0.05, **: P < 0.01.
Binary logistic regression analysis to find independent risk factors for HIF-1α expression in EC
The parameters R2*, Ktrans, and Kep values with statistically significant differences (P< 0.05) between the two groups were included in logistic regression analysis. Although the univariate analysis showed that R2*, Ktrans, and Kep values were all favorable for evaluating HIF-1α expression in EC, the multivariate analysis showed that only R2* and Kep values were independent risk factors for assessing HIF-1α expression in EC (as shown in Table 5).

Table 5. Univariate and multivariate analyses to assess independent risk factors of HIF-1α expression in EC.
Diagnostic efficacy evaluation of the different imaging parameters in identifying HIF-1α expression
The AUCs, threshold, sensitivity, and specificity of R2*, Kep, and R2*+Kep (R2* combined with Kep) were determined for prediction of HIF-1α expression in EC. The AUCs of R2*+Kep were significantly higher than the AUCs of R2* or Kep (P < 0.05) (as shown in Table 6 and Figure 5).

Table 6. Diagnostic efficacy of different imaging parameters for prediction of HIF-1α expression in EC.
Discussion
HIF-1α is a crucial regulator of metabolic reprogramming in tumor cells. It governs the expression of genes related to hypoxia in vivo, including angiogenesis, erythropoiesis, glycolysis, cell adhesion, cell proliferation, and apoptosis (17), which can reflect the hypoxia microenvironment of tumors. Previous studies have shown that the hypoxia microenvironment accelerates the progression of solid tumors, increases invasiveness, enhances metastatic potential (18, 19). Over expression of HIF-1α will regulate the molecular signal pathway and mediate the expression of hypoxia-related genes, which will lead to insufficient arterial blood supply, low vascular density, low delivery efficiency of vascular tissue, changes in red blood cell flow, imbalance between oxygen supply and demand, and high invasiveness of tumor. Under hypoxia, chemotherapy drugs show low-level cytotoxicity (20, 21), reducing their therapeutic effect. According to the European Society of Gynecological Oncology (ESGO) treatment guidelines (22), EC with high prognostic risk factors should be treated with postoperative adjuvant therapy. Tumor type and grade are the criteria for risk stratification of tumors, which is more accurate when combined with molecular and immunohistochemical indicators (23, 24), and it has been demonstrated that HIF-1α is a high-risk factor for recurrence of EC (25). Thus, the accurate detection of HIF-1a expression in EC facilitates making individual treatment plans.
Value of ESWAN combined with DCE-MRI in assessing HIF-1α expression in EC
ESWAN is a unique and sensitive imaging method for evaluation of oxygen content, calcium and iron deposits in tissues. R2* (the transverse relaxation rate) value quantified by ESWAN, is directly correlated with the concentration of paramagnetic substances such as deoxyhemoglobin in tissues and is a sensitive index to evaluate the local oxygen content of tumors (26). It has been applied in the study of differential diagnosis of EC and endometrial polyp (27), expression of Ki-67 (28) and microsatellite instability in EC (29, 30). In this study, we found that the R2* values of EC cases with high HIF-1α expression were higher than those with low HIF-1α expression. The reason may lies in that the high expression of HIF-1α can lead to increase in vascular endothelial growth factors (VEGFs) and other pro-angiogenic factors, and thus higher micro-vessel density. However, the weak and unstable vessel walls in tumor neovascularization can cause tumor tissue bleeding, blood stasis, excessive oxygen consumption, and increased paramagnetic substances such as deoxyhemoglobin and iron-containing hemoglobin (31), which can contribute to the increased R2* values. Besides, higher HIF-1α expression is associated with more significant local tumor hypoxia and decreased blood oxygen content, which can lead to increase in paramagnetic substances like deoxyhemoglobin and iron-containing hemoglobin, resulting in elevated R2* values. Meanwhile, R2* has been identified as an independent risk factor for predicting HIF-1α over expression by multivariate analysis, indicating its potential and distinctiveness in assessing the anoxic microenvironment of tumor. For immobile tissues, the phase map shows the rotation angle of magnetization vector during relaxation, reflecting the difference in magnetic susceptibility between tissues by the changes in magnetic field. Increased paramagnetic material in organs will produce higher magnetic susceptibility. In our study, the phase values of EC patients in the high HIF-1α expression group tended to be lower than those of EC in the low expression group, but the difference was not statistically significant. One possible explanation is that high HIF-1α expression correlates with increased tumor malignancy (32). Tumors with higher malignancy have more local paramagnetic materials, causing a negative phase shift. This manifests as a low signal on the phase map, leading to a reduced phase value for the high HIF-1α expression group.
DCE-MRI sequences can quantitatively assess the contrast agent’s movement rate in and out of cells and blood vessels, thus obtaining information on tumor penetration and reflecting changes in the tumor microenvironment. Our findings demonstrated that the Ktrans and Kep values for the group with high HIF-1α expression exceeded those of the low expression group. Ktrans represents the speed of the contrast agent’s movement from the vasculature to the extracellular space and the blood flow rate and vascular permeability, while Kep represents the speed of contrast agent transfer from the extracellular space back into the vasculature, accurately reflecting capillary permeability (33). HIF-1α can instigate neoangiogenesis by activating angiogenic factors like VEGFs (34), leading to increased microangiogenesis in EC tumors. The blood vessels in tumors with higher expression of HIF-1α have disorganized endothelial cell arrangement and distorted morphology, resulting in increased permeability, enhanced contrast leakage, and easy reflux. Due to these factors, the Ktrans and Kep values in the high HIF-1α expression group were increased compared to the low expression group. Previous studies have found (35) that the Ktrans and Kep values of patients with soft tissue sarcoma in the high HIF-1α expression group were higher than those in the low expression group, which is consistent with this study.
Our multifactorial analysis revealed that both the R2* and Kep values can serve as independent risk factors for predicting high HIF-1α expression in EC. The expression level of HIF-1α can indicate the clinical biological characteristics of EC. R2* value reflects the difference in contents of paramagnetic material and the dependence of blood oxygen level in the lesion, and Kep value reflects the blood reflux velocity and capillary permeability in the lesion. High HIF-1α expression in the lesion increases blood flow rate and vascular permeability, leading to uncomplicated reflux of the contrast agent and a higher Kep value. A weak and unstable capillary wall in the lesion can cause tumor bleeding and increased R2* value. The combination of R2* and Kep integrates information from both image features, and thus significantly enhance the efficiency of evaluating high HIF-1α expression in EC.
Limitations
Firstly, although the ROIs included the parenchymal portion of the tumor as much as possible, they still did not outline the tumor globally, and might miss some heterogeneous information.
Secondly, the ESWAN and DCE-MRI sequences were different in scanning orientation and layer thickness, which may result in slight mismatch among the ROIs of related parameters.
Thirdly, this study is a retrospective single-center study, and a multicenter prospective study is expected in the future for validation of current results.
Conclusion
In conclusion, multimodal parameters by ESWAN and DCE-MRI were promise to serve as an important guide for quantitatively evaluating HIF-1α expression in endometrial cancer, which may help to predict the prognosis of the tumor and appropriately adjust the therapeutic regimen.
Data availability statement
The raw data supporting the conclusions of this article will be made available by the authors, without undue reservation.
Ethics statement
The studies involving humans were approved by Ethics Committee of the First Affiliated Hospital of Dalian Medical University. The studies were conducted in accordance with the local legislation and institutional requirements. The participants provided their written informed consent to participate in this study. Written informed consent was obtained from the individual(s) for the publication of any potentially identifiable images or data included in this article.
Author contributions
ZX: Writing – original draft, Writing – review & editing. LL: Writing – review & editing, Conceptualization, Formal Analysis. CM: Writing – original draft. AL: Writing – original draft, Writing – review & editing.
Funding
The author(s) declare that no financial support was received for the research, authorship, and/or publication of this article.
Conflict of interest
Author CM was employed by company Philips Healthcare.
The remaining authors declare that the research was conducted in the absence of any commercial or financial relationships that could be construed as a potential conflict of interest.
Publisher’s note
All claims expressed in this article are solely those of the authors and do not necessarily represent those of their affiliated organizations, or those of the publisher, the editors and the reviewers. Any product that may be evaluated in this article, or claim that may be made by its manufacturer, is not guaranteed or endorsed by the publisher.
References
1. Crosbie EJ, Kitson SJ, McAlpine JN, Mukhopadhyay A, Powell ME, Singh N. Endometrial cancer. Lancet. (2022) 399:1412–28. doi: 10.1016/S0140-6736(22)00323-3
2. Dai Y, Zhao L, Hua D, Cui L, Zhang X, Kang N, et al. Tumor immune microenvironment in endometrial cancer of different molecular subtypes: evidence from a retrospective observational study. Front Immunol. (2022) 13:1035616. doi: 10.3389/fimmu.2022.1035616
3. Morito S, Kawasaki M, Nishiyama M, Sakumoto T, Hashiguchi M, Narita T, et al. Microenvironmental elements singularity synergistically regulate the behavior and chemosensitivity of endometrioid carcinoma. Hum Cell. (2023) 36:1147–59. doi: 10.1007/s13577-023-00886-7
4. Nava RC, McKenna Z, Fennel Z, Berkemeier Q, Ducharme J, de Castro Magalhães F, et al. Repeated sprint exercise in hypoxia stimulates HIF-1-dependent gene expression in skeletal muscle. Eur J Appl Physiol. (2022) 122:1097–107. doi: 10.1007/s00421-022-04909-3
5. Rashid M, Zadeh LR, Baradaran B, Molavi O, Ghesmati Z, Sabzichi M, et al. Up-down regulation of HIF-1α in cancer progression. Gene. (2021) :798:145796. doi: 10.1016/j.gene.2021.145796
6. Ucaryilmaz Metin C, Ozcan G. The HIF-1α as a potent inducer of the hallmarks in gastric cancer. Cancers (Basel). (2022) 14:2711. doi: 10.3390/cancers14112711
7. van Grinsven EE, Guichelaar J, Philippens ME, Siero JC, Bhogal AA. Hemodynamic imaging parameters in brain metastases patients - Agreement between multi-delay ASL and hypercapnic BOLD. J Cereb Blood Flow Metab. (2023) 43:2072–84. doi: 10.1177/0271678X231196989
8. Bartsch SJ, Ehret V, Friske J, Fröhlich V, Laimer-Gruber D, Helbich TH, et al. Hyperoxic BOLD-MRI-based characterization of breast cancer molecular subtypes is independent of the supplied amount of oxygen: A preclinical study. Diagnostics (Basel). (2023) 13:2946. doi: 10.3390/diagnostics.13182946
9. Li X, Wu S, Li D, Yu T, Zhu H, Song Y, et al. Intravoxel incoherent motion combined with dynamic contrast-enhanced perfusion MRI of early cervical carcinoma: correlations between multimodal parameters and HIF-1α Expression. J Magn Reson Imaging. (2019) 50:918–29. doi: 10.1002/jmri.26604
10. Li X, Yang L, Wang Q, Tao J, Pan Z, Wang S. Soft tissue sarcomas: IVIM and DKI correlate with the expression of HIF-1α on direct comparison of MRI and pathological slices. Eur Radiol. (2021) 31:4669–79. doi: 10.1007/s00330-020-07526-w
11. Du J, Li K, Wang W, Jhonatan FY, Zhang W, Yang H, et al. Qualitative and quantitative diagnosis of intramuscular hemangioma subtypes: Diagnostic performance comparison of ESWAN and conventional MRI. Acta Radiol. (2023) 64:208–16. doi: 10.1177/02841851211065145
12. Han X, Sun M, Wang M, Fan R, Chen D, Xie L, et al. The enhanced T2 star weighted angiography (ESWAN) value for differentiating borderline from Malignant epithelial ovarian tumors. Eur J Radiol. (2019) :118:187–193. doi: 10.1016/j.ejrad.2019.07.011
13. Wang D, Lu Y, Li X, Mei N, Wu PY, Geng D, et al. Evaluation of HIF-1α Expression in a rat glioma model using intravoxel incoherent motion and R2* Mapping. Front Oncol. (2022) 12:902612. doi: 10.3389/fonc.2022.902612
14. Thawani R, Gao L, Mohinani A, Tudorica A, Li X, Mitri Z, et al. Quantitative DCE-MRI prediction of breast cancer recurrence following neoadjuvant chemotherapy: a preliminary study. BMC Med Imaging. (2022) 22:182. doi: 10.1186/s12880-022-00908-0
15. Li X, Hu Y, Xie Y, Lu R, Li Q, Tao H, et al. Whole-tumor histogram analysis of diffusion-weighted imaging and dynamic contrast-enhanced MRI for soft tissue sarcoma: correlation with HIF-1alpha expression. Eur Radiol. (2023) 33:3961–73. doi: 10.1007/s00330-022-09296-z
16. Liu L, Hu L, Zeng Q, Peng D, Chen Z, Huang C, et al. Dynamic contrast-enhanced MRI of nasopharyngeal carcinoma: correlation of quantitative dynamic contrast-enhanced magnetic resonance imaging (DCE-MRI) parameters with hypoxia-inducible factor 1α expression and tumor grade/stage. Ann Palliat Med. (2021) 10:2238–53. doi: 10.21037/apm-21-303
17. Rani S, Roy S, Singh M, Kaithwas G. Regulation of transactivation at C-TAD domain of HIF-1α by factor-inhibiting HIF-1α (FIH-1): A potential target for therapeutic intervention in cancer. Oxid Med Cell Longev. (2022) 2022:2407223. doi: 10.1155/2022/2407223
18. Li Y, Zhao L, Li XF. Hypoxia and the tumor microenvironment. Technol Cancer Res Treat. (2021) 20:15330338211036304. doi: 10.1177/15330338211036304
19. Lappano R, Todd LA, Stanic M, Cai Q, Maggiolini M, Marincola F, et al. Multifaceted interplay between hormones, growth factors and hypoxia in the tumor microenvironment. Cancers (Basel). (2022) 14:539. doi: 10.3390/cancers14030539
20. Lee SH, Golinska M, Griffiths JR. HIF-1-independent mechanisms regulating metabolic adaptation in hypoxic cancer cells. Cells. (2021) 10:2371. doi: 10.3390/cells10092371
21. Kopecka J, Salaroglio IC, Perez-Ruiz E, Sarmento-Ribeiro AB, Saponara S, De Las Rivas J, et al. Hypoxia as a driver of resistance to immunotherapy. Drug Resist Updat. (2021) 59:100787. doi: 10.1016/j.drup.2021.100787
22. Concin N, Matias-Guiu X, Vergote I, Cibula D, Mirza MR, Marnitz S, et al. ESGO/ESTRO/ESP guidelines for the management of patients with endometrial carcinoma. Int J Gynecol Cancer. (2021) 31:12–39. doi: 10.1136/ijgc-2020-002230
23. D’Oria O, Giannini A, Besharat AR, Caserta D. Management of endometrial cancer: molecular identikit and tailored therapeutic approach. Clin Exp Obstet Gynecol. (2023) 50:210. doi: 10.31083/j.ceog5010210
24. Di Donato V, Giannini A, Bogani G. Recent advances in endometrial cancer management. J Clin Med. (2023) 12:2241. doi: 10.3390/jcm12062241
25. Sadlecki P, Bodnar M, Grabiec M, Marszalek A, Walentowicz P, Sokup A, et al. The role of Hypoxia-inducible factor-1 α, glucose transporter-1, (GLUT-1) and carbon anhydrase IX in endometrial cancer patients. BioMed Res Int. (2014) 2014:616850. doi: 10.1155/2014/616850
26. Craft ML, Edwards M, Jain TP, Choi PY. R2 and R2* MRI assessment of liver iron content in an undifferentiated diagnostic population with hyperferritinaemia, and impact on clinical decision making. Eur J Radiol. (2021) 135:109473. doi: 10.1016/j.ejrad.2020.109473
27. Meng X, Liu AL, Tian SF, Ju Y, Song QW. The value of ESWAN in diagnosis and differential diagnosis of endometrial carcinoma and endometrial polyp. Chin J Magn Reson Imaging. (2020) 11:501–5. doi: 10.12015/issn.1674-8034.2020.07.005
28. Tian SF, Liu AL, Zhu W, Liu JH, Song QW. Correlation between multi-parameter quantitative measurement of enhanced T2*-weighted angiography sequence and the expression of proliferating cell nuclear antigen ki-67 of endometrial carcinoma. Chin J Med Imaging. (2018) 26:865–9. doi: 10.3969/j.issn.1005-5185.2018.11.017
29. Tian SF, Liu AL, Guo Y, Lin T, Chen LH, Wang N, et al. Prediction of microsatellite instability of endometrial carcinoma based on global tumor texture analysis of enhanced T2* weighted angiography sequence R2*. Chin J Med Imaging Technol. (2019) 38:257–61. doi: 10.13929/j.issn.1003-3289.2022.02.022
30. Tian SF, Liu AL, Chen LH, Liu JH, Huang K. Prediction of microsatellite instability in endometrial carcinoma by multiple quantitative parameters of magnetic sensitive sequence. Chin J Magn Reson Imaging. (2020) 11:493–6. doi: 10.12015/issn.1674-8034.2020.07.003
31. Chuang TC, Chen YL, Shui WP, Chung HW, Hsu SS, Lai PH. Intra-tumoral susceptibility signal: a post-processing technique for objective grading of astrocytoma with susceptibility-weighted imaging. Quant Imaging Med Surg. (2022) 12:558–67. doi: 10.21037/qims-21-58
32. Tawadros AIF, Khalafalla MMM. Expression of programmed death-ligand 1 and hypoxia-inducible factor-1α proteins in endometrial carcinoma. J Cancer Res Ther. (2018) 14:S1063–9. doi: 10.4103/0973-1482.202891
33. Chen Y, Yang X, Wen Z, Liu Y, Lu B, Yu S, et al. Association between high-resolution MRI-detected extramural vascular invasion and tumour microcirculation estimated by dynamic contrast-enhanced MRI in rectal cancer: preliminary results. BMC Cancer. (2019) 19:498. doi: 10.1186/s12885-019-5732-z
34. Zhang EY, Gao B, Shi HL, Huang LF, Yang L, Wu XJ, et al. 20(S)-Protopanaxadiol enhances angiogenesis via HIF-1α-mediated VEGF secretion by activating p70S6 kinase and benefits wound healing in genetically diabetic mice. Exp Mol Med. (2017) 49:e387. doi: 10.1038/emm.2017.151
Keywords: endometrial carcinoma, hypoxia-inducible factor-1α, enhanced T2∗ weighted angiography, dynamic contrast-enhanced, magnetic resonance imaging
Citation: Xie Z, Lin L, Ma C and Liu A (2024) Prediction of HIF-1α expression in endometrial carcinoma by enhanced T2∗ weighted angiography and dynamic contrast-enhanced magnetic resonance imaging. Front. Oncol. 14:1439229. doi: 10.3389/fonc.2024.1439229
Received: 27 June 2024; Accepted: 07 November 2024;
Published: 11 December 2024.
Edited by:
Xin Tang, Hangzhou Wuyunshan Hospital, ChinaReviewed by:
Xiao M. Zhang, Affiliated Hospital of North Sichuan Medical College, ChinaZhenyu Shu, Zhejiang Provincial People’s Hospital, China
Violante Di Donato, Unitelma Sapienza University, Italy
Copyright © 2024 Xie, Lin, Ma and Liu. This is an open-access article distributed under the terms of the Creative Commons Attribution License (CC BY). The use, distribution or reproduction in other forums is permitted, provided the original author(s) and the copyright owner(s) are credited and that the original publication in this journal is cited, in accordance with accepted academic practice. No use, distribution or reproduction is permitted which does not comply with these terms.
*Correspondence: Ailian Liu, bGl1YWlsaWFuQGRtdS5lZHUuY24=
 Zongyuan Xie1,2
 Ailian Liu