- 1Department of Radiology, The Affiliated Hospital of Qingdao University, Qingdao, Shandong, China
- 2Department of Operation Center, Women and Children’s Hospital, Qingdao University, Qingdao, Shandong, China
- 3Department of Radiology, The Puyang Oilfield General Hospital, Puyang, Henan, China
- 4Department of Radiology, The Third Hospital of Hebei Medical University, Shijiazhuang, Hebei, China
- 5Department of Research Collaboration, Research and Development (R&D) Center, Beijing Deepwise and League of Philosophy Doctor (PHD) Technology Co., Ltd, Beijing, China
- 6Department of Radiology, Peking University Third Hospital, Beijing, China
Background: Accurate identification of pathologic grade before operation is helpful for guiding clinical treatment decisions and improving the prognosis for soft tissue sarcoma (STS).
Purpose: To construct and assess a magnetic resonance imaging (MRI)-based radiomics nomogram incorporating intratumoral habitats (subregions of clusters of voxels containing similar features) and peritumoral features for the preoperative prediction of the pathological grade of STS.
Methods: The MRI data of 145 patients with STS (74 low-grade and 71 high-grade) from 4 hospitals were retrospectively collected, including enhanced T1-weighted and fat-suppressed-T2-weighted sequences. The patients were divided into training cohort (n = 102) and validation cohort (n = 43). K-means clustering was used to divide intratumoral voxels into three habitats according to signal intensity. A number of radiomics features were extracted from tumor-related regions to construct radiomics prediction signatures for seven subgroups. Logistic regression analysis identified peritumoral edema as an independent risk factor. A nomogram was created by merging the best radiomics signature with the peritumoral edema. We evaluated the performance and clinical value of the model using area under the curve (AUC), calibration curves, and decision curve analysis.
Results: A multi-layer perceptron classifier model based on intratumoral habitats and peritumoral features combined gave the best radiomics signature, with an AUC of 0.856 for the validation cohort. The AUC of the nomogram in the validation cohort was 0.868, which was superior to the radiomics signature and the clinical model established by peritumoral edema. The calibration curves and decision curve analyses revealed good calibration and a high clinical application value for this nomogram.
Conclusion: The MRI-based nomogram is accurate and effective for predicting preoperative grading in patients with STS.
1 Introduction
Soft tissue sarcomas (STSs) are rare heterogeneous tumors that account for 1% of all tumors (1), and surgical resection is regarded as the primary therapeutic approach for localized STS. Recent studies reported that in addition to surgery, adjuvant radiotherapy and chemotherapy can improve the prognosis for high-grade (grade III) STS. In this respect, the possible adverse consequences of radiation and chemotherapy can be avoided by a preoperative diagnosis of low-grade illness (grades I and II) (2, 3). Accurate preoperative grading is also beneficial for the selection of neoadjuvant chemoradiotherapy (2, 4, 5). Histologic grade is considered to be an important factor affecting the prognosis for STS (4). Although the preoperative histological tumor grading of STS is largely dependent on needle biopsy, because of tumor heterogeneity (6), the initial biopsy-based pathology test may underestimate the actual grade (5, 7). Therefore, there is an urgent need to develop a non-invasive and reliable approach for determining STS grade before surgery, so that patients can receive more effective and targeted treatment.
Magnetic resonance imaging (MRI) is the most commonly used technique for the preoperative diagnosis and evaluation of STS due to its non-invasive nature and excellent soft tissue contrast resolution. Although STS can be diagnosed on MRI by an experienced radiologist, the STS grade is difficult to determine because of tumor heterogeneity (8). Radiomics is a noninvasive method that extracts markers to assist physicians in making judgments through the quantitative mining of features from medical images (9, 10). Considered a digital biopsy, radiomics enables a detailed description of tumor characteristics and spatial heterogeneity in multiple clinical settings (11, 12). In earlier research, biomarkers based on quantitative MRI radiomics features have been regarded as an effective tool to distinguish tumor grades (13, 14). STSs are highly heterogeneous (6), and their growth patterns, tumor heterogeneity, and grade have all been linked in numerous prior investigations (4–7). However, conventional radiomics analysis is usually performed on the whole tumor, thus ignoring regional phenotypic changes within the tumor (15).
Recently, an emerging approach of partitioning tumors into subregions (known as habitats) containing clusters of voxels with similar features has allowed for more effective quantification of intratumor heterogeneity and definition of tumor subregions that are relevant to tumor growth or invasiveness (16–18). A study demonstrated that tumor habitat analysis has high value for predicting tumor grade (19). In addition, recent research demonstrated that the peritumoral microenvironment is valuable for the clinical evaluation of tumor-aggressive biological behavior (20). However, few studies have evaluated the value of both the tumor habitat and the peritumoral environment for accurately predicting the grade and invasive potential of tumors.
Thus, the aim of this study was to develop and validate a non-invasive MRI-based radiomics model combining intratumoral habitats and peritumoral microenvironments for the pretreatment differentiation of high-grade STS from low-grade STS.
2 Materials and methods
2.1 Study population
This retrospective investigation obtained ethical approval and written informed consent was not required. The inclusion and exclusion criteria are shown in Supplementary A1 in Supplementary Data Sheet 1. Consecutive patients with soft tissue sarcomas treated between January 2007 and July 2022 at the Puyang Oilfield General Hospital, the Third Hospital of Hebei Medical University, the Shandong Provincial Hospital affiliated with Shandong First Medical University, and the Affiliated Hospital of Qingdao University were collected. A total of 145 patients (56 ± 16, 55.2% male) meeting the criteria were enrolled in the study and were divided into two groups. There were 102 patients from the affiliated hospital of Qingdao University in the training cohort and 43 patients from the other three hospitals in the validation cohort. The pathological findings are shown in Supplementary Table S1.
2.2 MRI protocol
The MRI sequences and scanners are shown in Supplementary A2 in Supplementary Data Sheet 1. The parameters of the MRI sequences are listed in Supplementary Table S2.
2.3 Clinical information and collection of MRI morphological characteristics
Clinical information including age, sex, and the tumor-node-metastasis (TNM) staging were collected. The FNCLCC (Fédération Nationale des Centres de luttte contre le cancer) system scores for the tumor mitotic index, degree of differentiation, and degree of necrosis were added to give the tumor grade. Histopathological low grade was assigned to FNCLCC grades I and II, whereas histopathological high grade was assigned to grade III.
MRI morphological characteristics were assessed by two radiologists with more than 7 years of experience who were unaware of the pathological findings (Supplementary A3 in Supplementary Data Sheet 1).
2.4 Image preprocessing and region-of-interest segmentation
The MRI preprocessing and tumor region-of-interest (ROI) segmentation consisted of four main phases: MRI registration, bias-field correction, segmentation of tumor-associated regions, and spatial resampling. First, using 3D slicer software (v. 5.0.3, www.slicer.org), the CE-T1WI and FS-T2WI of each patient were subjected to 3D rigid transformation registration. Following this registration, bias-field unevenness was corrected using the Python N4-bias-field-correction function. Then, the ROI was accurately drawn, including the tumorous and peritumoral regions, as shown in Figure 1. Two primary radiologists manually segmented the tumor ROIs using ITK-SNAP software (v.3.8.0, http://www.itksnap.org). When there were disagreements over an ROI, it was reviewed and corrected by another senior expert radiologist, and the tumor area mask was formed. Then, Radiomics Intelligent Analysis Software (RIAS) was applied to expand the boundary of the tumor lesion mask 10 mm outward for each lesion to generate a peritumoral mask. The “tail sign” can be considered a sign of infiltration or fascial invasion and is an independent factor affecting patient prognosis. It had the same signal intensity as the main mass and had the same enhancement after the injection of gadolinium-based contrast material. Thus, the “tail sign” was segmented into the tumor area mask (21, 22). Large blood vessels, bone tissue, and air areas that had not been invaded in the peritumoral mask were removed manually. Finally, RIAS was used to resample all of the images and masks to an isotropic spatial voxel size of 1 × 1 × 1 mm3.
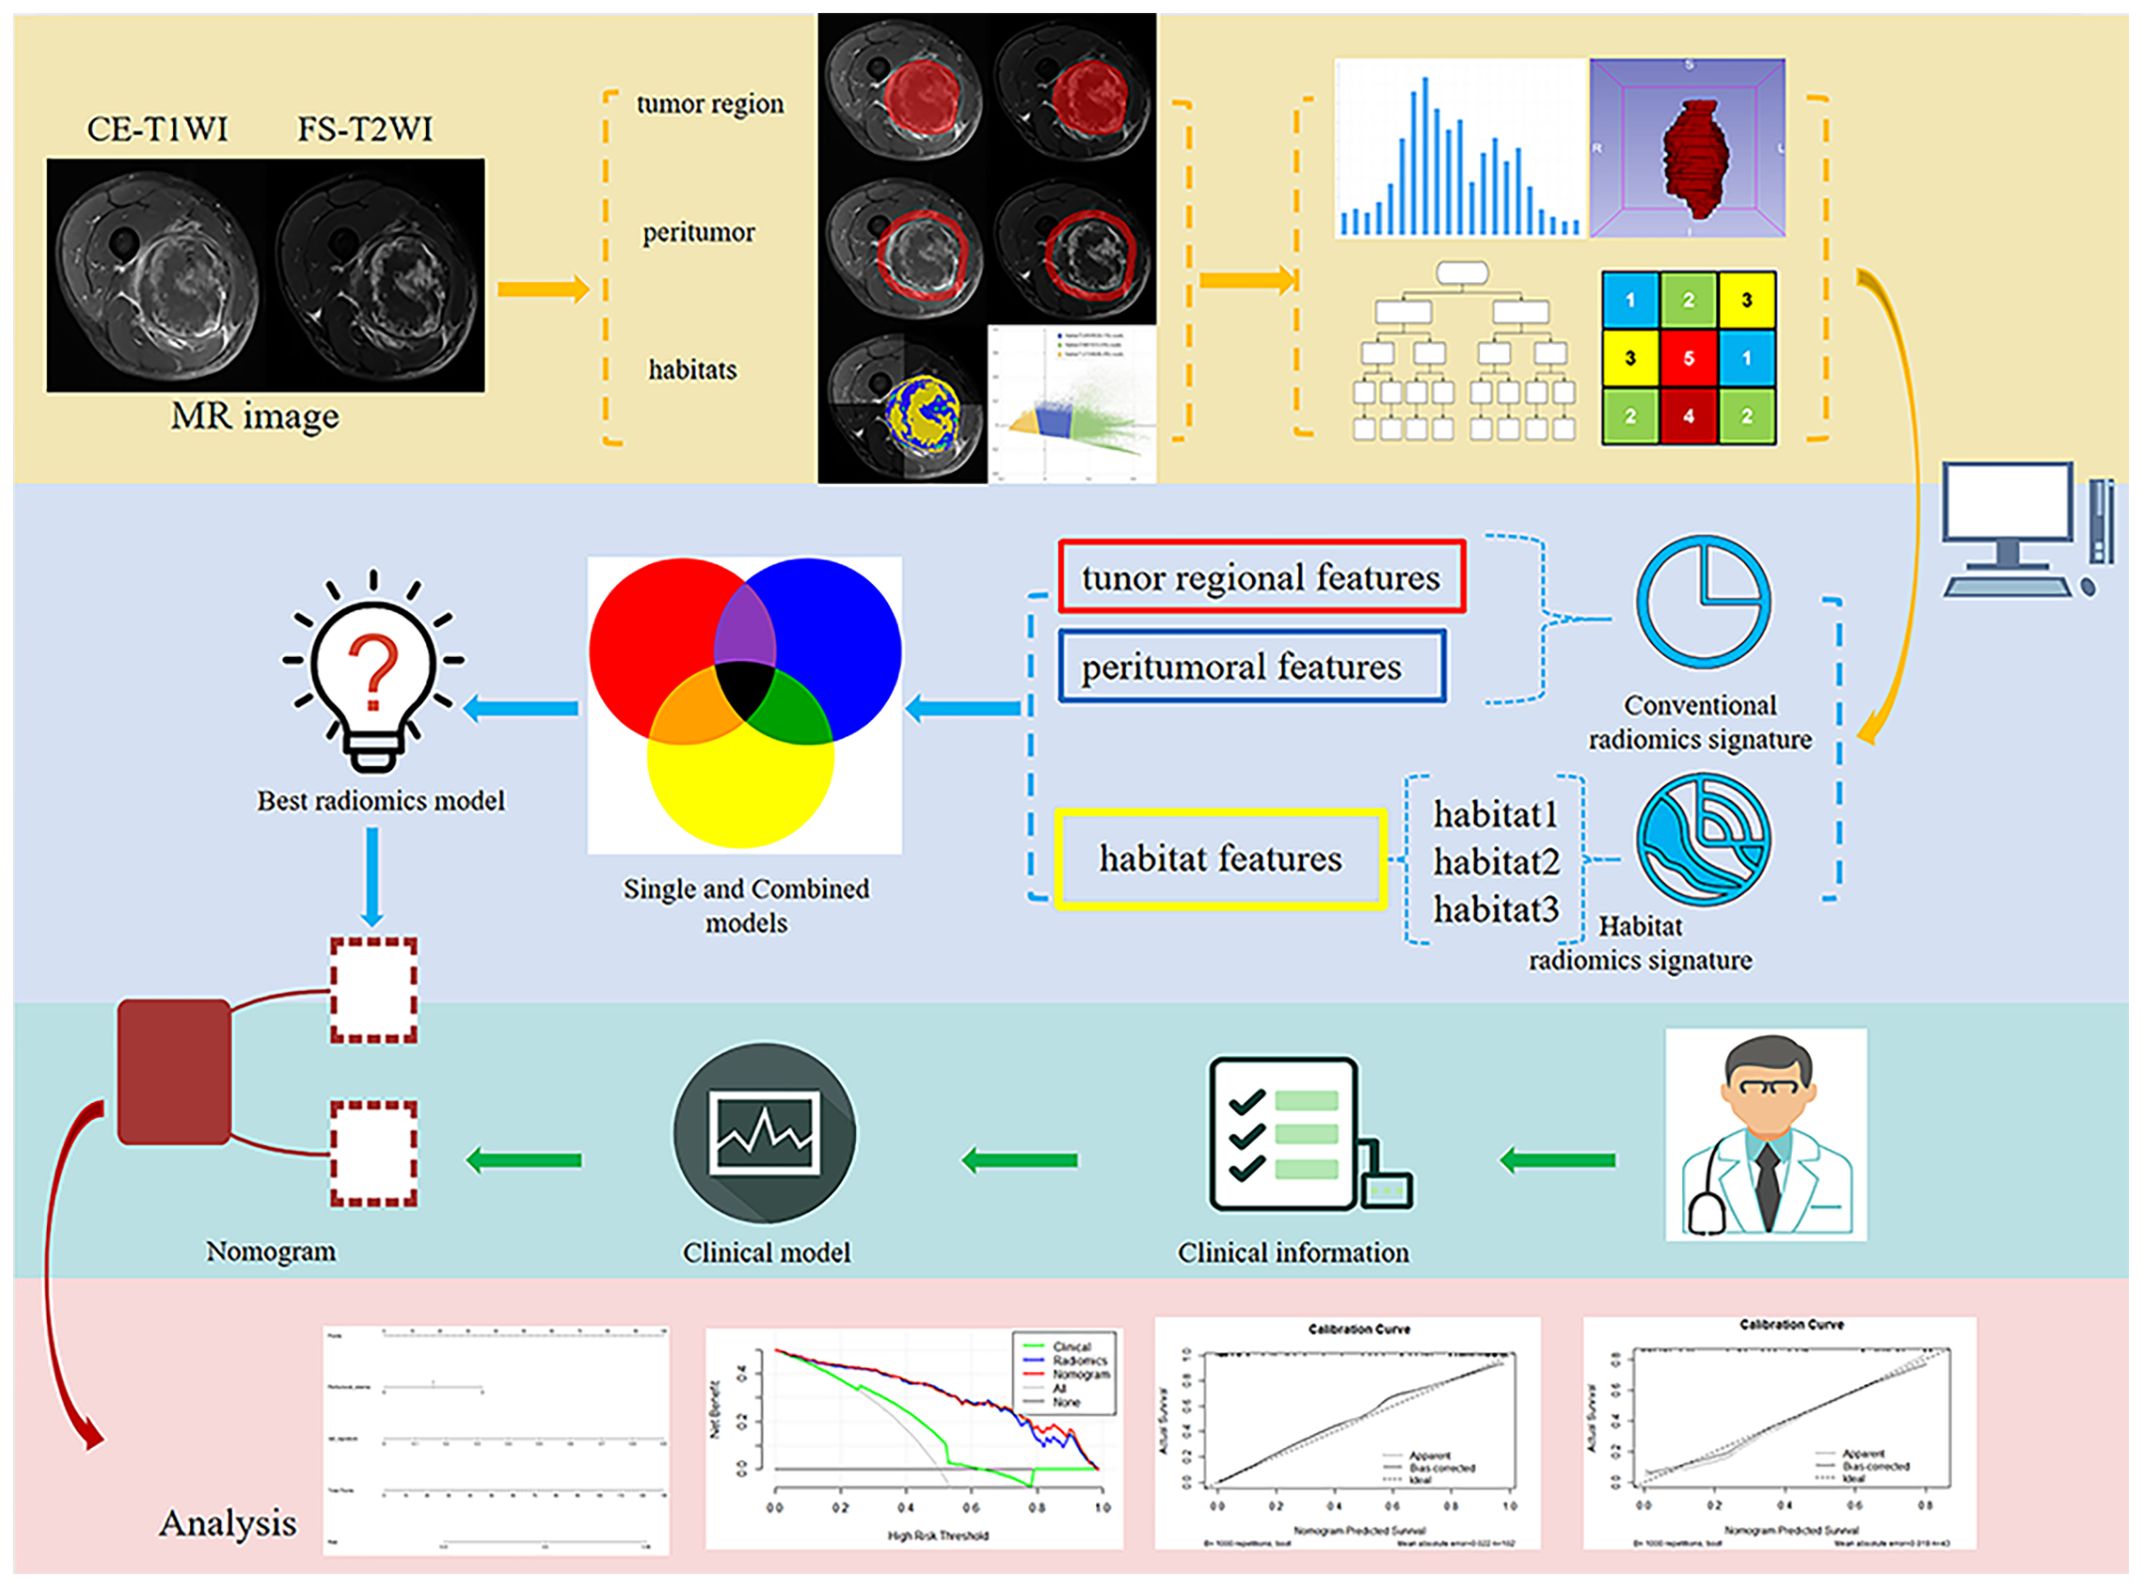
Figure 1. Flowchart illustrating the study design, including data collection, radiomics feature extraction, model training, and validation.
The signal intensity of the CE-T1WI and FS-T2WI was standardized using the normalizing technique for histogram intensity in Python before performing the intratumoral habitats analysis (23). The K-means clustering module in Python was used to cluster the voxels in the normalized CE-T1WI and FS-T2WI images into three clusters representing the functionally-coherent subregions of the STS intratumoral regions, i.e., the intratumoral habitats: a low-enhancement solid subregion with low signal intensity (Habitat 1), a high-signal intensity enhanced viable subregion (Habitat 2), and a low-activity subregion with intermediate signal intensity (Habitat 3).
2.5 Extraction of radiomics features
All radiomics feature extraction was performed using the PyRadiomics toolkit in Python. A total of 1906 radiomics features were extracted from the tumoral region masks and peritumoral masks for each sequence, with these including textural features, shape features, first-order features, and wavelet features. A further 93 radiomics features, including textural features and first-order features, were extracted from each of the three intratumoral habitats of each sequence. This resulted in final totals of 558 habitat features, 3812 tumor region features, and 3812 peritumoral features.
2.6 Image normalization and standardization method
The combat compensation method (24), which eliminates scanner and protocol influences while maintaining the salient features of texture patterns, was used to standardize the MR images and radiomics features. Then, all features were standardized to Z-scores according to the mean and standard deviation.
2.7 Feature selection
Minimum Redundancy Maximum Relevance (mRMR) was used to initially reduce the dimensionality of high-dimensional features, with this resulting in the retaining of 25 highly correlated and low-redundancy features. Then, to further reduce dimensionality and save the features with the greatest predictive ability, we employed the logistic regression method known as the least absolute shrinkage and selection operator (LASSO).
A total of seven subgroups of radiomics signatures were established, with these being the tumoral region signature subgroup, intratumoral habitats signature subgroup, peritumor signature subgroup, signature subgroup combining tumoral region and intratumoral habitats features (TH-combined signature), signature subgroup combining tumoral region and peritumor features (TP-combined signature), signature subgroup combining intratumoral habitats and peritumor features (HP-combined signature), and signature subgroup combining all radiomics features (THP-combined signature). The radiomics features selected for each predictive signature are shown in Supplementary Table S3.
2.8 Classifiers
Different radiomics signatures to predict STS grade were constructed and evaluated using the following 11 machine learning classifiers: logistic regression (LR), extremely randomized trees (ExtraTrees), support vector machine (SVM), NaiveBayes, K nearest neighbor (KNN), AdaBoost, random forest, eXtreme Gradient Boosting (XGBoost), Multi-Layer perceptron (MLP), GradientBoosting, and Light Gradient Boosting Machine (LightGBM). The classifiers were trained using 10-fold cross-validation applied to the training cohort, and the grade prediction performance of the classifiers was evaluated using area under the receiver operating characteristics (ROC) curve (AUC), accuracy, sensitivity, and specificity. The best machine-learning algorithm was determined to be the one with the highest AUC.
2.9 Adding the clinical model and constructing the nomogram
In the construction of the clinical model, the clinical information and MRI morphological characteristics connected to STS grading were first selected using univariate logistic regression. Subsequently, those clinical features with P < 0.05 were entered into a multivariate logistic regression, and peritumoral edema was selected to create clinical models. We then employed the Akaike information criterion-based likelihood ratio test to determine the factors related to STS grading. Finally, we selected the best radiomics signature and combined it with the peritumoral edema to build a nomogram. AUC and accuracy were used to evaluate the performance of the nomogram, radiomics signatures, and clinical model. Calibration curves and decision curve analysis (DCA) were conducted to assess the fit and clinical dependability of the models, respectively.
2.10 Statistical analysis
Statistical tests were conducted using SPSS 26.0 (IBM, New York, USA), Python (version 3.9.7, www.python.org), and R software 4.1.2 (https://www.r-project.org/). Continuous variables in the clinical data were analyzed using either independent sample t-tests or Mann-Whitney U tests, while categorical variables were analyzed using the chi-square test or Fisher’s exact test. The statistical significance level was set at P < 0.05 for all statistical tests.
3 Results
3.1 Clinical factors and modeling
The total 145 patients were divided into the training set and the external validation set. The clinical information and MRI characteristics of the patients with STS in the two sets are listed in Table 1. There were significant differences in age, depth, heterogeneous SI on FS-T2WI, and location (P < 0.05) between the two sets. Furthermore, no significant differences were observed in the remaining characteristics.
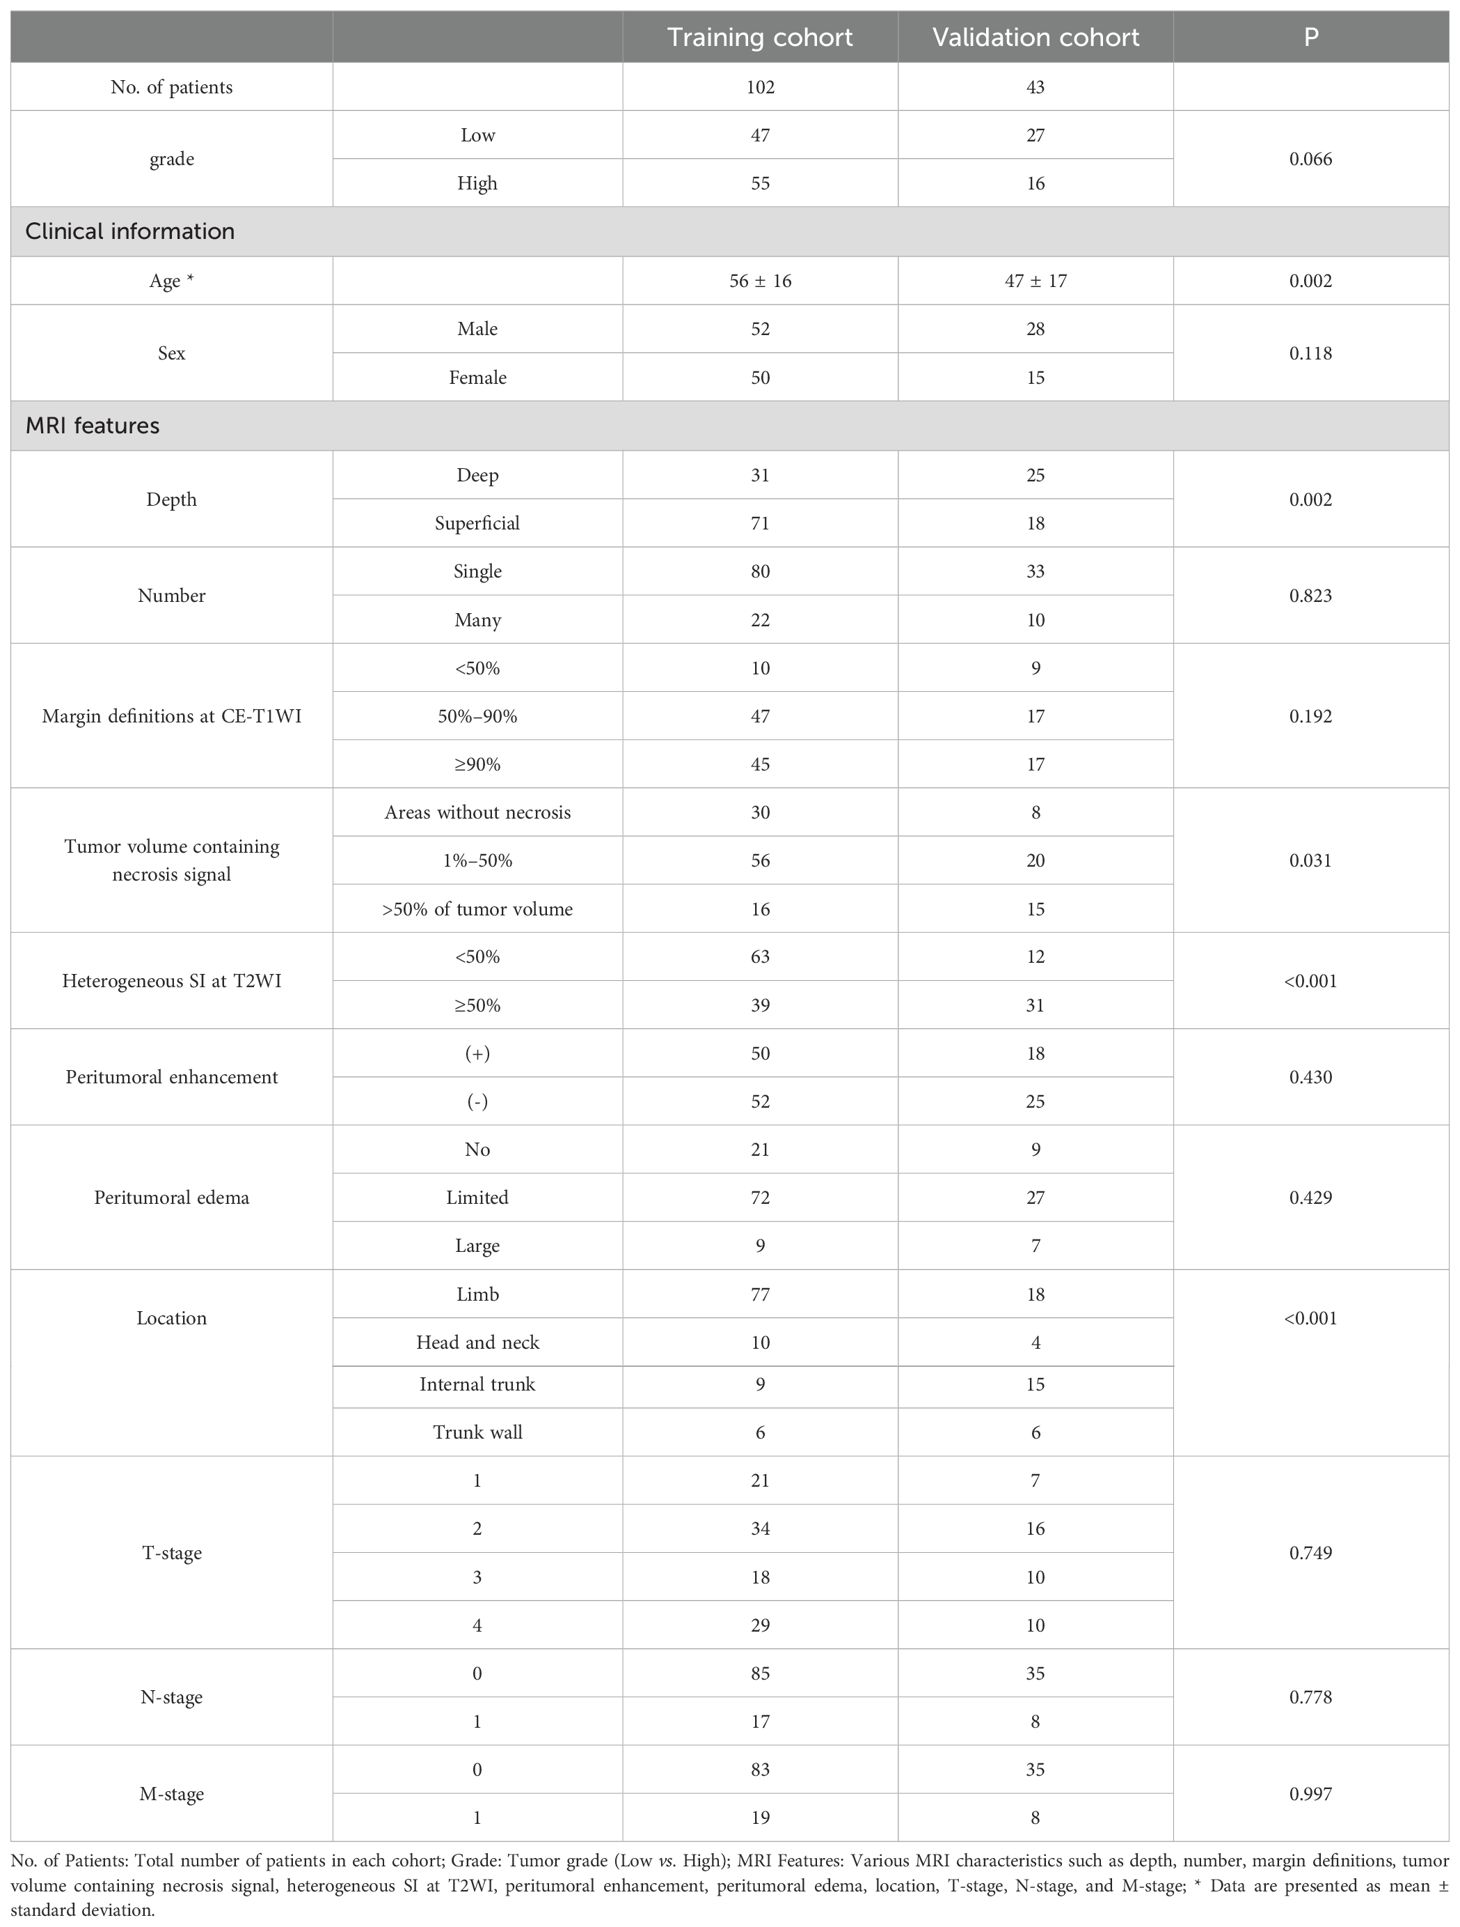
Table 1. Patient clinical information and MRI characteristics in the training and validation cohorts.
The results of the univariate and multivariate LR analysis showed that peritumoral edema was an independent predictor of STS grade. Table 2 shows the univariate and multivariate logistic regression results with P < 0.05. A clinical model was established with the inclusion of peritumoral edema. The AUC values for the clinical model applied to training and validation sets were 0.665 (95% CI: 0.582–0.749) and 0.613 (95% CI: 0.472–0.755), respectively.
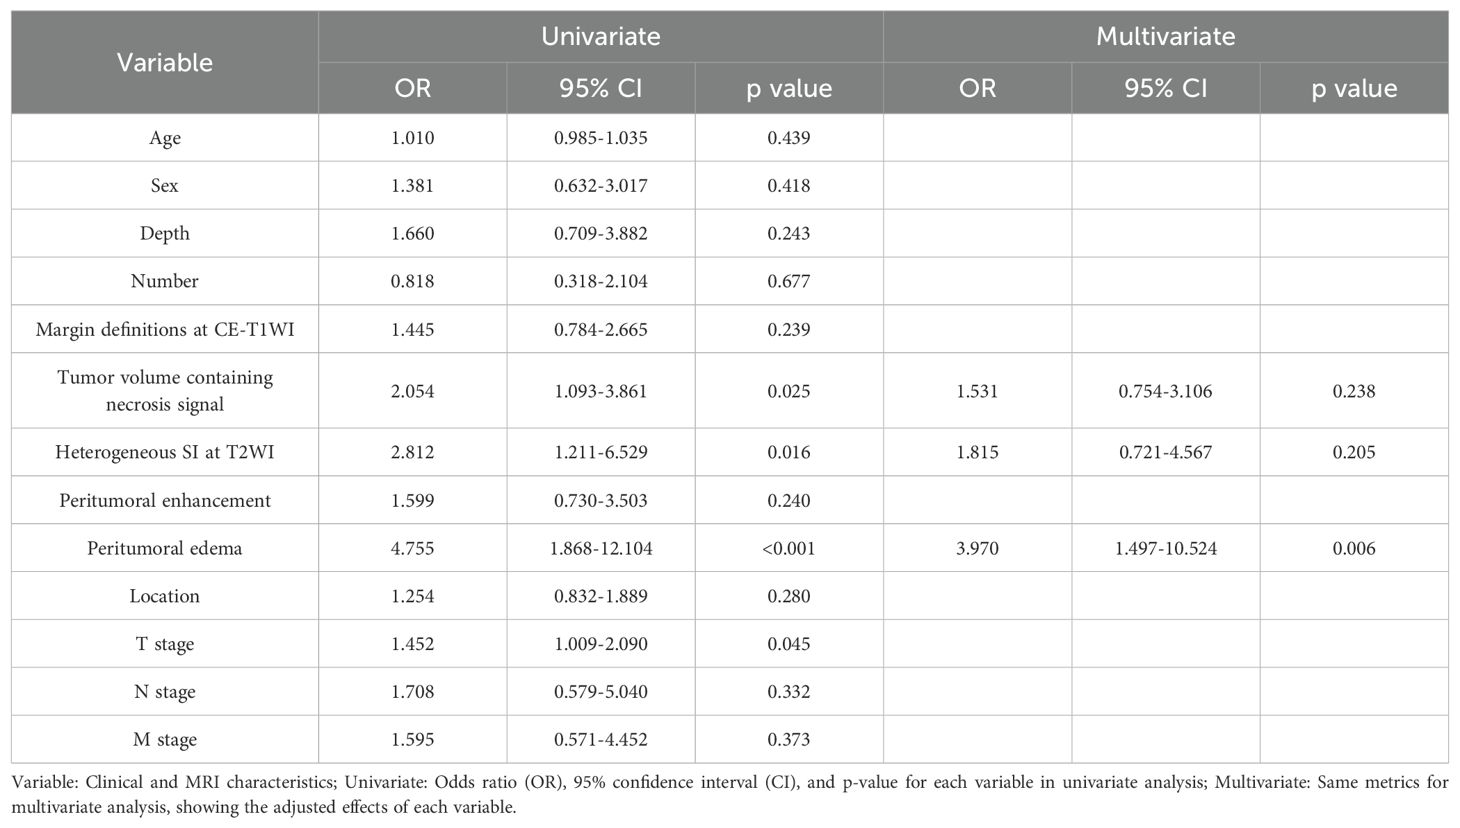
Table 2. Positive results of clinical information and MRI characteristics in univariate and multivariate logistic regression.
3.2 Radiomics feature selection and radiomics signature performance
We initially identified 25 features using mRMR and then further screened these features using LASSO. We established seven radiomics signature subgroups and used 11 machine learning methods to construct separate signatures for each subgroup, resulting in a total of 77 radiomics signatures. The AUC and accuracy of these are shown in Table 3. For the validation set, the best signature and the optimal performance within each subgroup were as follows: the tumoral region signature built using the ExtraTrees classifier had a highest AUC value of 0.613; the intratumoral habitats signature built using the KNN classifier had a highest AUC value of 0.626; the peritumor signature built using the MLP classifier had a highest AUC value of 0.828; the TH-combined signature built using the AdaBoost classifier had a highest AUC value of 0.589; the TP-combined signature built using the LR classifier had a highest AUC value of 0.738; the HP-combined signature built using the MLP classifier had a highest AUC value of 0.856; and the THP-combined signature built using the MLP classifier had a highest AUC value of 0.657. In summary, we found that the HP-combined signature built by combining mRMR and LASSO with the MLP classifier had the highest predictive performance (for the training and validation sets the accuracy values were 0.873 and 0.814, respectively, and the AUC values were 0.923 and 0.856), and was therefore the model used in the subsequent studies. Eighteen features were selected by LASSO to establish the HP-combined signature (the best radiomics signature), as shown in Figure 2, with this including 12 peritumoral features and six habitat features.
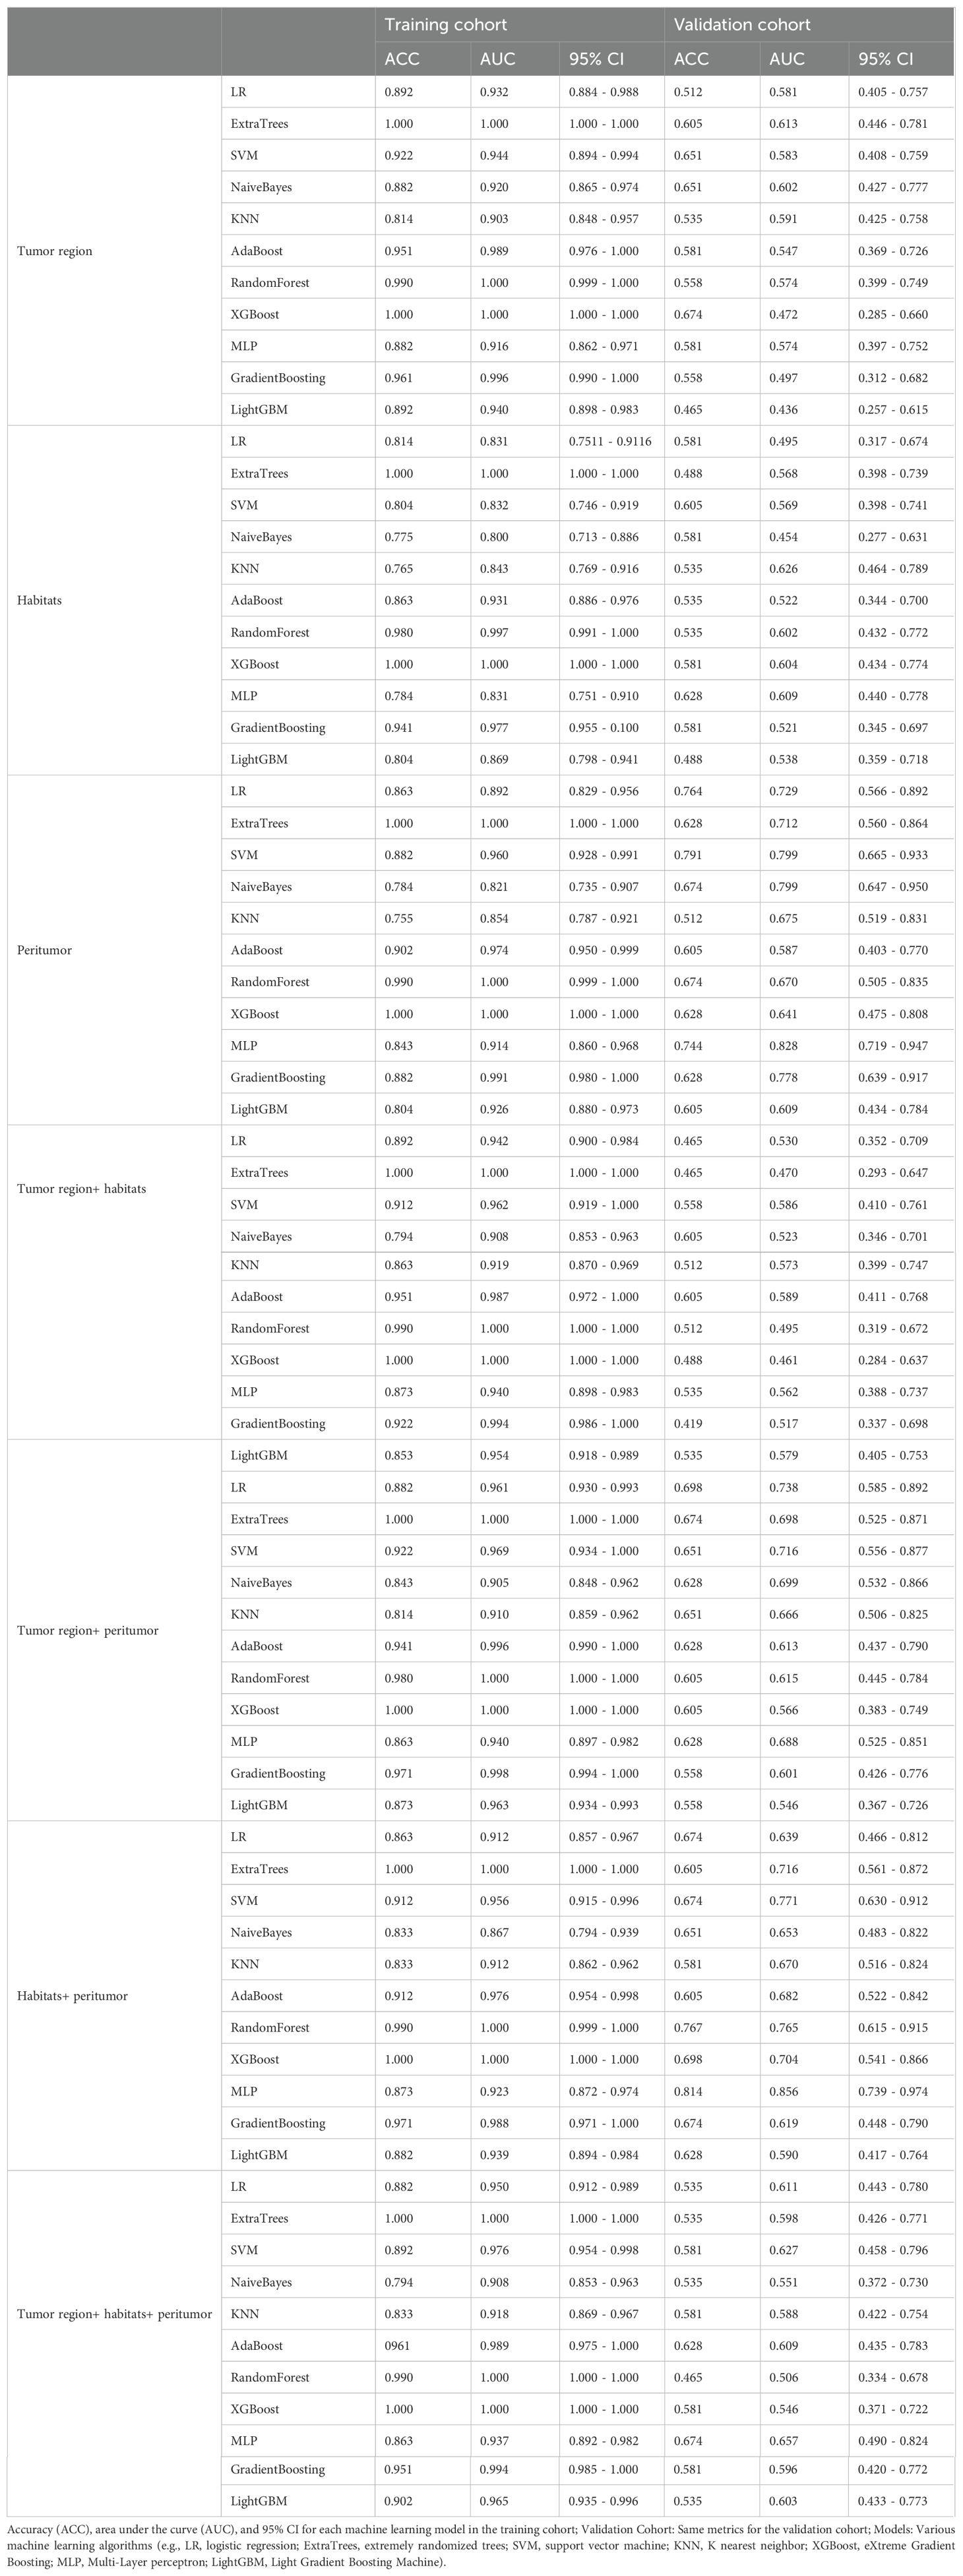
Table 3. The predictive performance of different radiomics machine learning signatures in the training and validation cohorts.
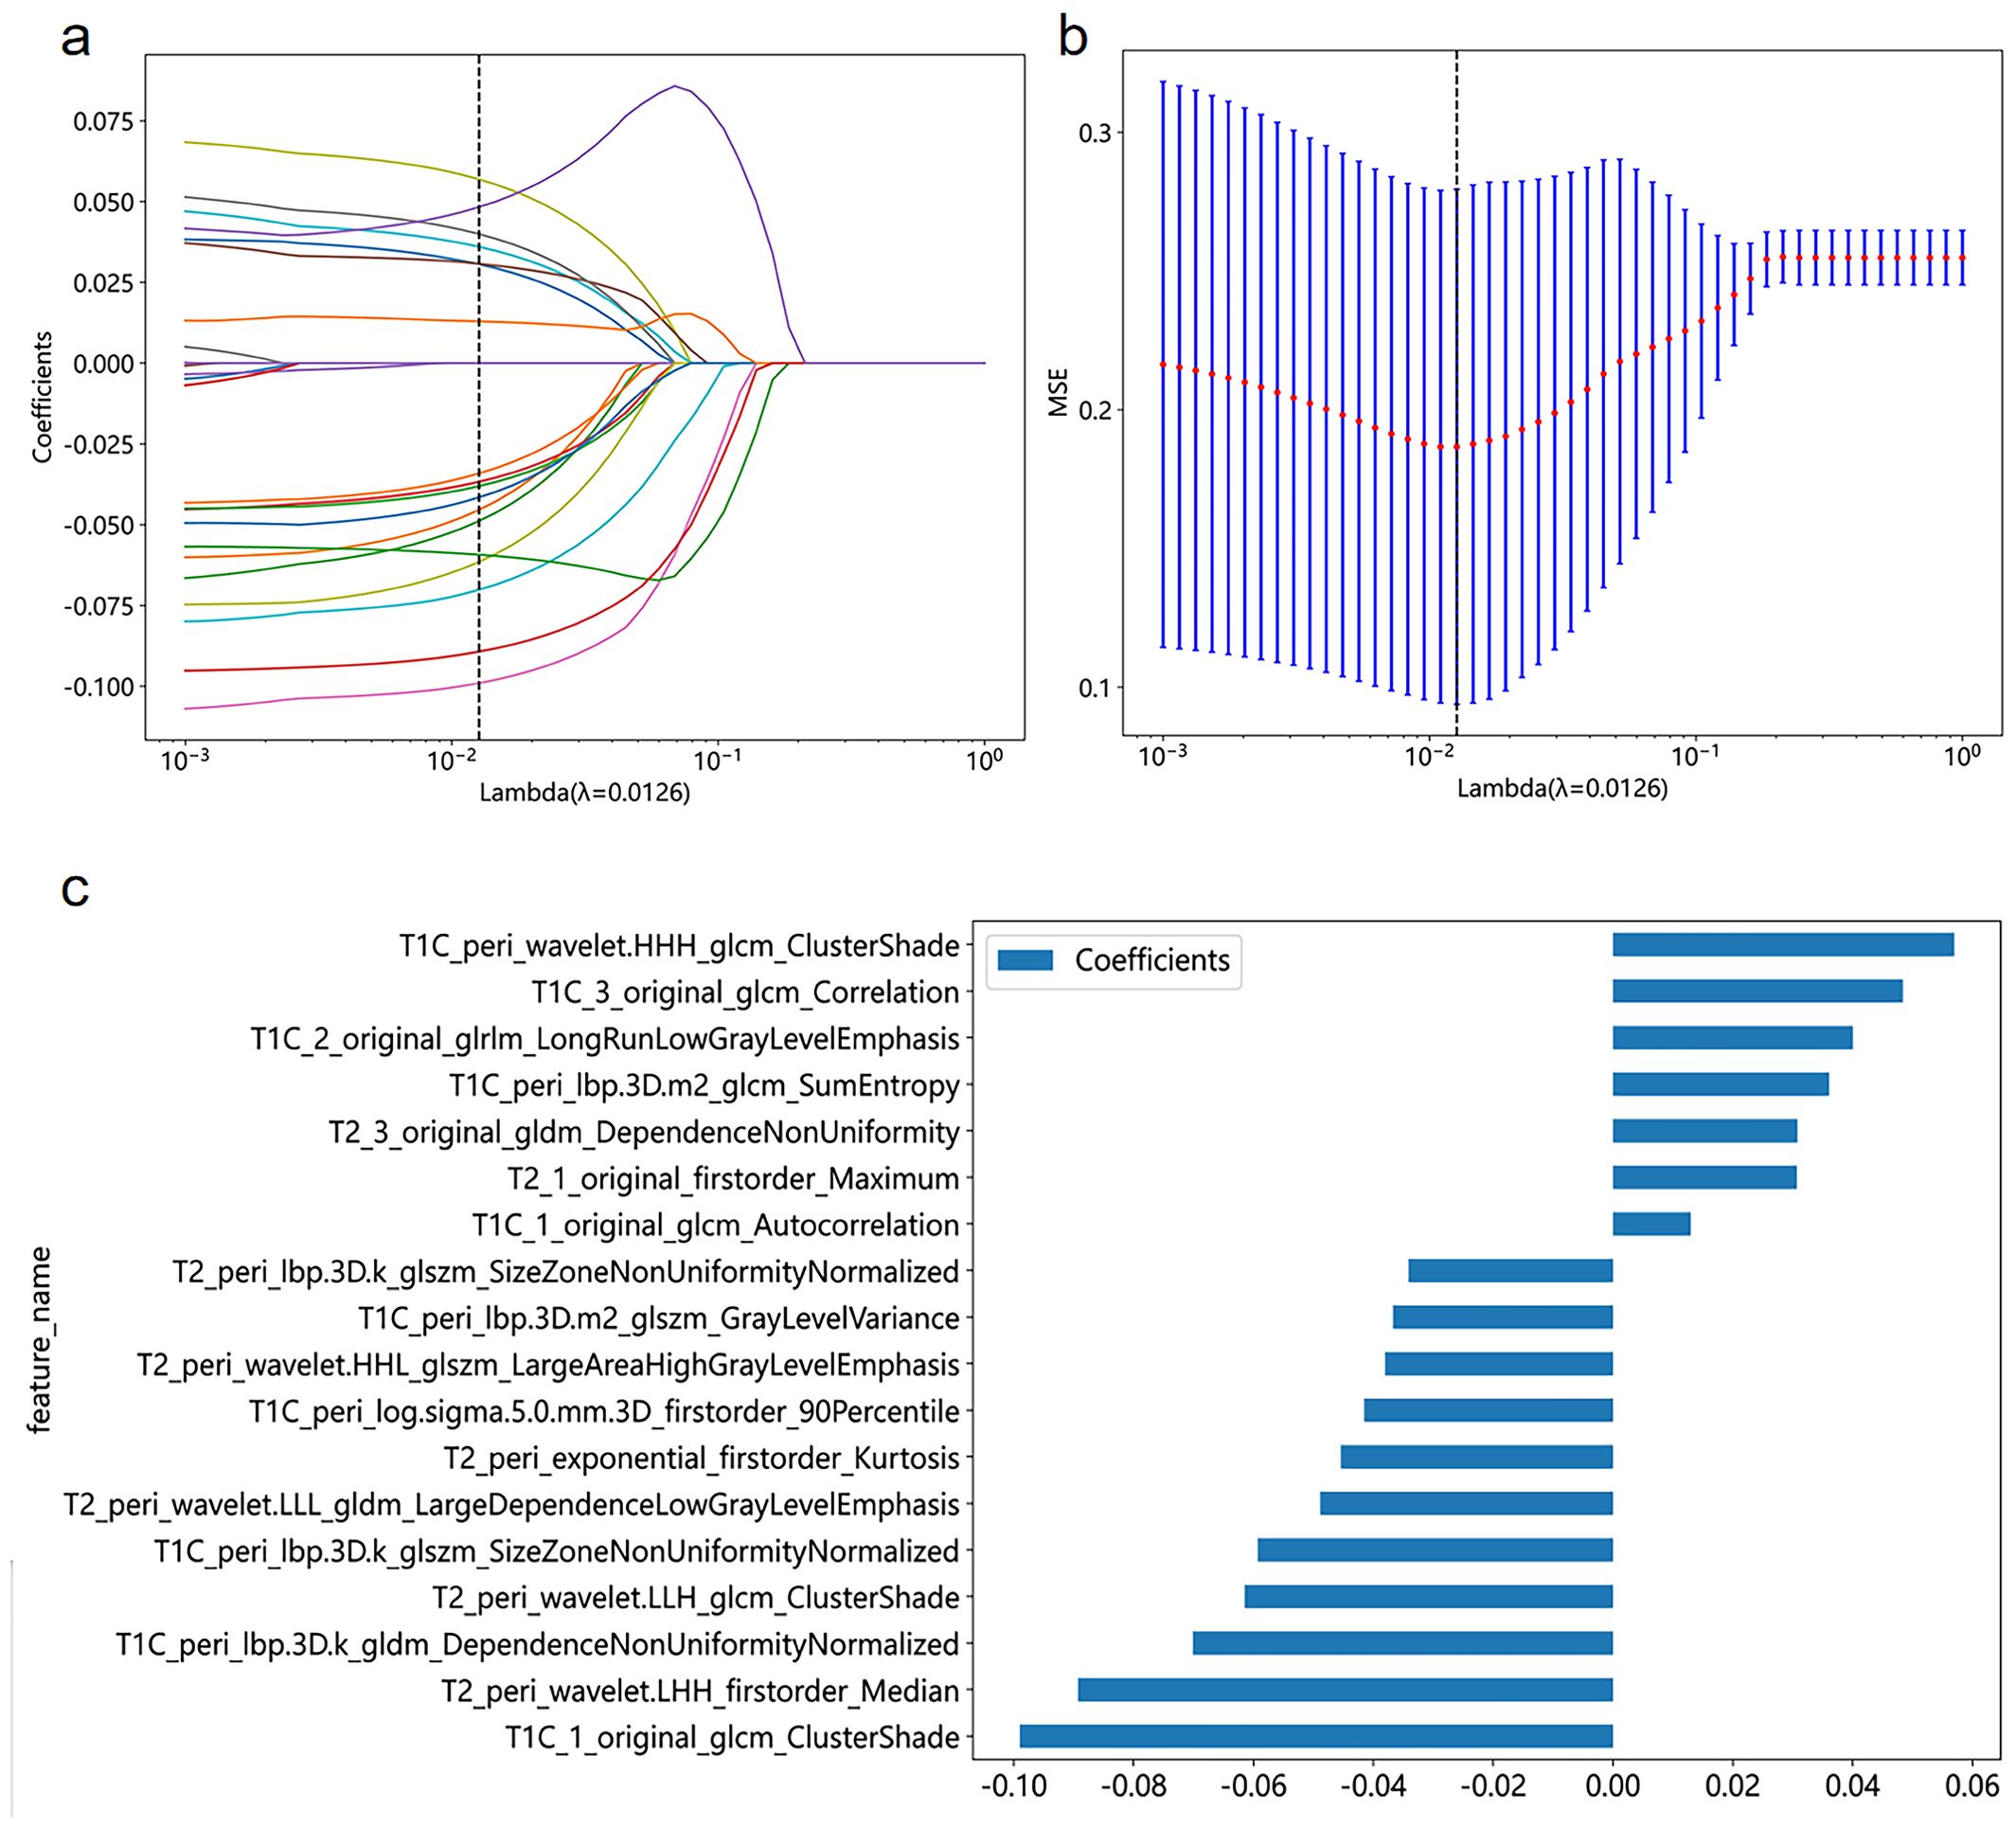
Figure 2. Coefficient profile plot (A), cross-validation plot (B), and histogram of feature weights (C) for the best radiomics features selected in the study.
3.3 Establishment of a radiomics nomogram
A nomogram (Figure 3A) combining the best radiomics signature with the clinical independent predictors was subsequently constructed. Table 4 shows the predictive performance of the radiomics signature, clinical model, and nomogram. The nomogram demonstrated superior performance than the top-performing machine learning signature and clinical model. Figures 3B–D illustrates the calibration curves and DCA of the nomogram. The calibration curves showed good calibration in the training set (Figure 3B) and confirmed favorable calibration in the validation set (Figure 3C), indicating that the nomogram discriminated well. The DCA (Figure 3D) demonstrated that the nomogram provided greater clinical application value than the radiomics signature and the clinical model. Consequently, the nomogram should achieve optimal performance in terms of clinical application.
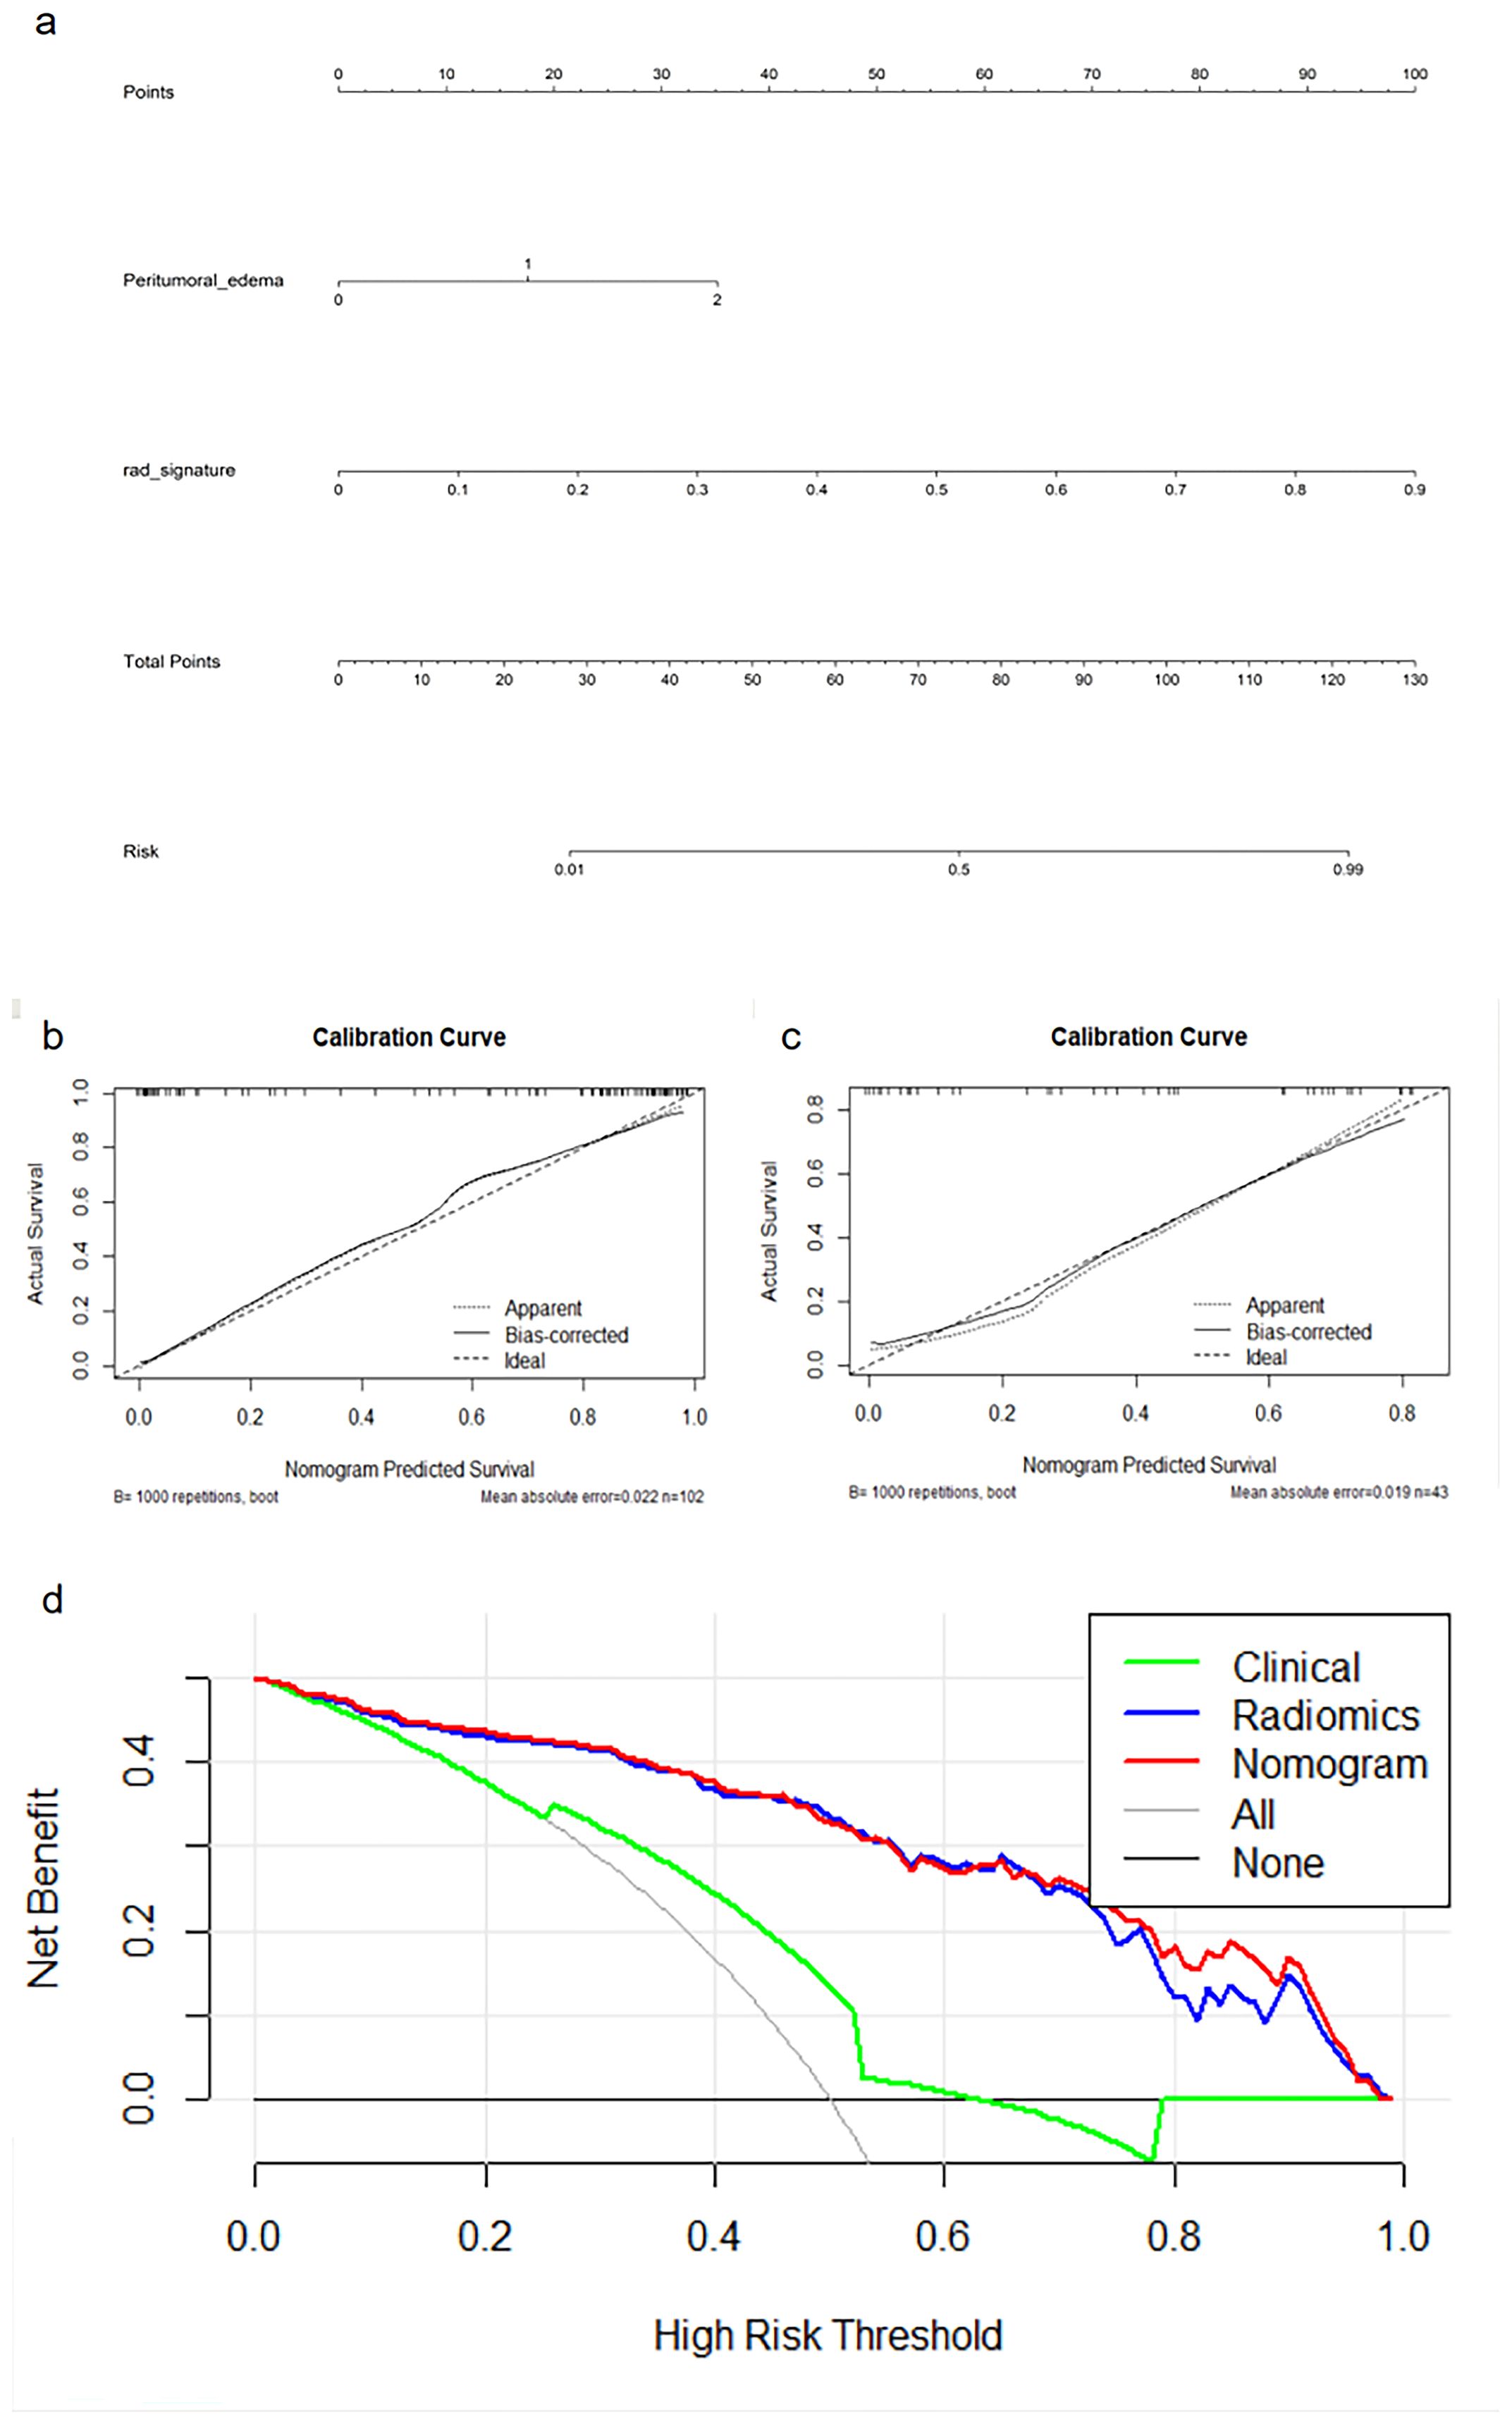
Figure 3. Nomogram (A), calibration curves (B, C) of the nomogram in the training and external validation cohorts, and decision curve analysis (D) for the nomogram.

Table 4. Predictive performance of radiomics signature, clinical model, and nomogram in the training and validation cohorts.
4 Discussion
Knowledge of the STS histological grade of a tumor is essential for formulating a therapeutic strategy and is a key factor affecting the prognosis (4, 25). The results of our study showed that a signature based on the radiomics features of the intratumoral habitats and peritumoral microenvironments extracted from preoperative MRI could predict the grade of STS with high accuracy. By analyzing the radiomics features derived from tumorous regions, intratumoral habitats, and peritumoral areas, we established a total of 77 single or combined radiomics signatures from seven different subgroups. Among these, the HP-combined signature established by the MLP classifier combined with mRMR and LASSO feature screening methods yielded the best predictive performance. Finally, the nomogram showed better prediction performance than the radiomics signature and the clinical model based on peritumoral edema, and could thus provide valuable information to clinicians and patients and help guide clinical decision-making. The nomogram calibration curve demonstrated that both cohorts could benefit from the approach, and the DCA confirmed that the nomogram achieved the best clinically applicable performance.
Several qualitative MRI characteristics have previously been reported as potential imaging biomarkers for STS grading. Zhang et al. (26) found peritumoral hyperintensity to be an independent risk factor for predicting histopathological grade. Crombé et al. (4) confirmed that high-grade STS was linked to the MRI morphological characteristics of heterogeneity, necrosis, and peritumoral enhancement. In addition, some studies have shown that in addition to the general MRI features related to the prognosis of STS, some specific STS subtypes are independent prognostic factors for specific STS subtypes, such as the “Tail sign” of undifferentiated pleomorphic sarcoma, the “Water−like” appearance of myxofibrosarcoma, the “Triple sign” and absence of calcifications in synovial sarcoma, signal heterogeneity in myxoid liposarcoma (22). In our study, we included peritumoral edema to establish the clinical model. The prediction performance of the clinical model was poor, with an AUC value of only 0.665 for the training set and 0.613 for the external validation set. This result indicates that the MRI characteristics and the low-dimensional clinical data only capture a small portion of the relevant information present in the imaging data and omit a great deal of the lesion heterogeneity detail.
One key aspect of our study is that we analyzed intratumoral habitats. Zhou et al. proposed the concept of extracting quantitative features from distinct tumor sub-regions (27), and later studies showed that sub-regional radiomics analysis methods may better quantify the tumorous subregion related to tumorous growth or aggressiveness than conventional radiomics, and obtain prediction models with higher accuracy (17, 19). These studies suggest that intratumoral habitats may provide valuable clues for tumor prediction and prognosis. In our study, to obtain a model for predicting STS grade with high accuracy, we considered integrating high-throughput radiomics feature analysis with voxel-based habitat segmentation to predict STS grade. The results showed that among the optimal signatures for each subgroup, the predictive performance of the intratumoral habitats radiomics signature was better than that of the conventional tumor radiomics signature, and the predictive performance of the HP-combined signature was better than that of the TP-combined signature. These results demonstrate that the intratumoral clustered segmented habitats contain important information for STS grading and are capable of predicting STS grade with higher accuracy than conventional radiomics approaches based on the whole tumor.
Another key aspect of our study is that we analyzed the peritumoral area. Clinical evidence demonstrates that the heterogeneity of STS extends beyond the tumor itself, encompassing the surrounding area (28). Consequently, the surrounding environment of the tumor can provide valuable data for assessing the aggressive biological behavior of the tumor. Combinations of intratumoral and peritumoral radiomics features were successfully used in recent research to identify the histological categories of renal cell carcinoma (29) and to differentiate between benign and malignant pulmonary nodules (30, 31). Previous research also revealed that the peritumoral microenvironment provides supplementary information for predicting STS histopathological grade (26). Among the optimal signatures of each subgroup in our study, the peritumor signature outperformed any other single radiomics signature, and the TP-combined signature and HP-combined signature performed better than the single tumoral region signature and intratumoral habitats signature, respectively. These results demonstrate that peritumoral radiomics features provide added predictive value.
In our study, the best-performing HP-combined signature contained six habitat features and 12 peritumoral features, with “T1C 1 original glcm ClusterShade” contributing the most to the performance. This feature was extracted in Habitat 1, which is a low-enhancing solid subregion, and we deduce that this region may have a greater association with tumor grade than the other regions. In terms of feature types, Gray Level Co-occurrence Matrix (GLCM) texture features (classified as higher-order features) have demonstrated significant clinical impacts in both radiology and nuclear medicine (32, 33). Although the blood supply to STS tumors is reflected in the CE-T1WI signal strength, it is difficult to distinguish minor signal intensity changes within tissue on conventional MRI. Specifically, “T1C 1 original glcm ClusterShade” quantifies the skewness and uniformity of gray-scale variability that is imperceptible to visual inspection. Previous studies showed GLCM features to possess strong predictive capabilities for tumor grade and found that they played an indispensable role in the construction of radiomic signatures (34, 35).
Regarding the selection of features in this study, mRMR is a novel method for feature screening that screens radiomics features by employing more rational coefficients and reducing redundancy (36). In comparison, LASSO is a feature screening technique that prevents overfitting during signature construction (37). In this study, 11 machine learning methods (LR, ExtraTrees, SVM, NaiveBayes, KNN, AdaBoost, RandomForest, XGBoost, MLP, GradientBoosting, and LightGBM) were selected for investigation, and in combination with the seven subgroups they resulted in a total of 77 radiomics signatures. MLP is a supervised learning method that can learn nonlinear models in real-time, achieving high accuracy and good generalization ability (38–40). The present results of this study showed that out of all the tested machine learning signatures, the HP-combined signature built by the MLP classifier combined with the popular mRMR and LASSO feature screening techniques demonstrated the highest predictive ability.
There are some limitations to this study. First, it should be noted that this study was conducted retrospectively, which means that although we had strict inclusion and exclusion criteria, there may still have been selection bias. Second, because of the relatively small sample size, the histological subtypes were not distributed evenly, which may have caused some statistical bias. Additionally, our data were collected from four different institutions utilizing similar but not identical scanners and processes. Therefore, to enhance the stability of features, as well as to account for any variations among them, the combat compensation method and a resampling methodology were employed. Finally, manual segmentation was applied to the work, which may lead to deviations. A recent study (41) demonstrated that automatic segmentation achieved favorable performance. This study is only a preliminary analysis, and further research in a larger prospective clinical series is needed to determine associations between patient tumor grade and spatial habitat analysis.
In summary, we developed a nomogram that can accurately and noninvasively predict STS grade before surgery so that patients can obtain more effective and targeted treatment. By enhancing surveillance and improving adjuvant clinical trial design, our predictive model may help close the gap between radiology and precision healthcare.
Data availability statement
The datasets presented in this study can be found in online repositories. The names of the repository/repositories and accession number(s) can be found in the article/Supplementary Material.
Ethics statement
The studies involving humans were approved by The Affiliated Hospital of Qingdao University, Qingdao, Shandong, China The Puyang Oilfield General Hospital, Puyang, Henan, China The Third Hospital of Hebei Medical University, Hebei, China the Shandong Provincial Hospital affiliated with Shandong First Medical University, Jinan, Shandong, China. The studies were conducted in accordance with the local legislation and institutional requirements. Written informed consent for participation was not required from the participants or the participants’ legal guardians/next of kin in accordance with the national legislation and institutional requirements. Written informed consent was not obtained from the individual(s) for the publication of any potentially identifiable images or data included in this article because This retrospective investigation obtained ethical approval and written informed consent was not required.
Author contributions
BW: Data curation, Investigation, Writing – original draft. HG: Data curation, Investigation, Methodology, Writing – review & editing. MZ: Data curation, Investigation, Writing – review & editing. YH: Conceptualization, Investigation, Methodology, Writing – review & editing. LD: Formal Analysis, Methodology, Writing – review & editing. CH: Writing – review & editing. JX: Data curation, Investigation, Methodology, Validation, Writing – review & editing. HW: Conceptualization, Formal Analysis, Funding acquisition, Methodology, Project administration, Writing – review & editing.
Funding
The author(s) declare financial support was received for the research, authorship, and/or publication of this article. This study was funded by the Project Grant No. ZR2021MH159 and No. ZR2020MH286 supported by the Shandong Provincial Natural Science Foundation. This work was supported by the National Natural Science Foundation of China (Grant No. 82172035). This study was funded by the Clinical Medicine+X Project of the Affiliated Hospital of Qingdao University (Grant No. QDFY+ X2021015). This work was supported by the Medicine and Health Technology Development Program of Shandong Province (Grant No. 2019WS373).
Acknowledgments
We sincerely thank the Platform Onekey AI for Code consultation of this study. We thank Liwen Bianji (Edanz) (www.liwenbianji.cn) for editing the language of a draft of this manuscript.
Conflict of interest
Author CH was employed by the company Beijing Deepwise and League of Philosophy Doctor PHD Technology Co., Ltd.
The remaining authors declare that the research was conducted in the absence of any commercial or financial relationships that could be construed as a potential conflict of interest.
Publisher’s note
All claims expressed in this article are solely those of the authors and do not necessarily represent those of their affiliated organizations, or those of the publisher, the editors and the reviewers. Any product that may be evaluated in this article, or claim that may be made by its manufacturer, is not guaranteed or endorsed by the publisher.
Supplementary material
The Supplementary Material for this article can be found online at: https://www.frontiersin.org/articles/10.3389/fonc.2024.1433196/full#supplementary-material
Abbreviations
STS, soft tissue sarcoma; MRI, magnetic resonance imaging; CE-T1WI, contrast enhanced fat-suppressed T1 weighted imaging; FS-T2WI, fat-suppressed T2 weighted imaging; TNM, the tumor-node-metastasis staging; FNCLCC, Fédération Nationale des Centres de Lutte Contre le Cancer; mRMR, Minimum Redundancy Maximum Relevance; LASSO, least absolute shrinkage and selection operator; TH-combined signature, signature combining tumoral region and intratumoral habitats features; TP-combined signature, signature combining tumoral region and peritumor features; HP-combined signature, signature combining intratumoral habitats and peritumor features; THP-combined signature, signature combining tumoral region, intratumoral habitats, and peritumor features; LR, Logistic regression; ExtraTrees, Extremely randomized trees; SVM, Support vector machine; KNN, K nearest neighbor; XGBoost, EXtreme Gradient Boosting; MLP, Multi-Layer perceptron; LightGBM, Light Gradient Boosting Machine; GLCM, Gray-level co-occurrence matrix.
References
1. Clark MA, Fisher C, Judson I, Thomas JM. Soft-tissue sarcomas in adults. New Engl J Med. (2005) 353:701–11. doi: 10.1056/NEJMra041866
2. Pasquali S, Gronchi A. Neoadjuvant chemotherapy in soft tissue sarcomas: latest evidence and clinical implications. Ther Adv Med Oncol. (2017) 9:415–29. doi: 10.1177/1758834017705588
3. Sundby Hall K, Bruland ØS, Bjerkehagen B, Zaikova O, Engellau J, Hagberg O, et al. Adjuvant chemotherapy and postoperative radiotherapy in high-risk soft tissue sarcoma patients defined by biological risk factors-A Scandinavian Sarcoma Group study (SSG XX). Eur J Cancer. (2018) 99:78–85. doi: 10.1016/j.ejca.2018.05.011
4. Crombé A, Marcellin PJ, Buy X, Stoeckle E, Brouste V, Italiano A, et al. Soft-tissue sarcomas: assessment of MRI features correlating with histologic grade and patient outcome. Radiology. (2019) 291:710–21. doi: 10.1148/radiol.2019181659
5. Coindre JM. Grading of soft tissue sarcomas: review and update. Arch Pathol Lab Med. (2006) 130:1448–53. doi: 10.5858/2006-130-1448-GOSTSR
6. Lin X, Davion S, Bertsch EC, Omar I, Nayar R, Laskin WB. Federation Nationale des Centers de Lutte Contre le Cancer grading of soft tissue sarcomas on needle core biopsies using surrogate markers. Hum Pathol. (2016) 56:147–54. doi: 10.1016/j.humpath.2016.06.008
7. Schneider N, Strauss DC, Smith MJ, Miah AB, Zaidi S, Benson C, et al. The adequacy of core biopsy in the assessment of smooth muscle neoplasms of soft tissues: implications for treatment and prognosis. Am J Surg Pathol. (2017) 41:923–31. doi: 10.1097/PAS.0000000000000867
8. Fang S, Yang Y, Xu N, Tu Y, Yin Z, Zhang Y, et al. An update in imaging evaluation of histopathological grade of soft tissue sarcomas using structural and quantitative imaging and radiomics. J Magn Reson Imaging: JMRI. (2022) 55:1357–75. doi: 10.1002/jmri.27954
9. Gillies RJ, Kinahan PE, Hricak H. Radiomics: images are more than pictures, they are data. Radiology. (2016) 278:563–77. doi: 10.1148/radiol.2015151169
10. Bera K, Braman N, Gupta A, Velcheti V, Madabhushi A. Predicting cancer outcomes with radiomics and artificial intelligence in radiology. Nat Rev Clin Oncol. (2022) 19:132–46. doi: 10.1038/s41571-021-00560-7
11. Aerts HJ, Velazquez ER, Leijenaar RT, Parmar C, Grossmann P, Carvalho S, et al. Decoding tumour phenotype by noninvasive imaging using a quantitative radiomics approach. Nat Commun. (2014) 5:4006. doi: 10.1038/ncomms5006
12. Sun R, Limkin EJ, Vakalopoulou M, Dercle L, Champiat S, Han SR, et al. A radiomics approach to assess tumour-infiltrating CD8 cells and response to anti-PD-1 or anti-PD-L1 immunotherapy: an imaging biomarker, retrospective multicohort study. Lancet Oncol. (2018) 19:1180–91. doi: 10.1016/S1470-2045(18)30413-3
13. Aerts HJ. The potential of radiomic-based phenotyping in precision medicine: A review. JAMA Oncol. (2016) 2:1636–42. doi: 10.1001/jamaoncol.2016.2631
14. Song J, Shi J, Dong D, Fang M, Zhong W, Wang K, et al. A new approach to predict progression-free survival in stage IV EGFR-mutant NSCLC patients with EGFR-TKI therapy. Clin Cancer Res. (2018) 24:3583–92. doi: 10.1158/1078-0432.CCR-17-2507
15. Gatenby RA, Grove O, Gillies RJ. Quantitative imaging in cancer evolution and ecology. Radiology. (2013) 269:8–15. doi: 10.1148/radiol.13122697
16. Park JE, Kim HS, Kim N, Park SY, Kim YH, Kim JH. Spatiotemporal heterogeneity in multiparametric physiologic MRI is associated with patient outcomes in IDH-wildtype glioblastoma. Clin Cancer Res. (2021) 27:237–45. doi: 10.1158/1078-0432.CCR-20-2156
17. Wu J, Cao G, Sun X, Lee J, Rubin DL, Napel S, et al. Intratumoral spatial heterogeneity at perfusion MR imaging predicts recurrence-free survival in locally advanced breast cancer treated with neoadjuvant chemotherapy. Radiology. (2018) 288:26–35. doi: 10.1148/radiol.2018172462
18. Kim J, Ryu SY, Lee SH, Lee HY, Park H. Clustering approach to identify intratumour heterogeneity combining FDG PET and diffusion-weighted MRI in lung adenocarcinoma. Eur Radiol. (2019) 29:468–75. doi: 10.1007/s00330-018-5590-0
19. Feng S, Yin J. Dynamic contrast-enhanced magnetic resonance imaging radiomics analysis based on intratumoral subregions for predicting luminal and nonluminal breast cancer. Quant Imaging Med Surg. (2023) 13:6735–49. doi: 10.21037/qims-22-1073
20. Semenza GL, Ruvolo PP. Introduction to tumor microenvironment regulation of cancer cell survival, metastasis, inflammation, and immune surveillance. Biochim Biophys Acta. (2016) 1863:379–81. doi: 10.1016/j.bbamcr.2015.12.015
21. Spinnato P, Clinca R. MRI tail sign in soft-tissue sarcoma. Radiology. (2021) 299:276. doi: 10.1148/radiol.2021203877
22. Scalas G, Parmeggiani A, Martella C, Tuzzato G, Bianchi G, Facchini G, et al. Magnetic resonance imaging of soft tissue sarcoma: features related to prognosis. Eur J Orthop Surg Traumatol: Orthop Traumatol. (2021) 31:1567–75. doi: 10.1007/s00590-021-03003-2
23. Madabhushi A, Udupa JK. New methods of MR image intensity standardization via generalized scale. Med Phys. (2006) 33:3426–34. doi: 10.1118/1.2335487
24. Fortin JP, Cullen N, Sheline YI, Taylor WD, Aselcioglu I, Cook PA, et al. Harmonization of cortical thickness measurements across scanners and sites. NeuroImage. (2018) 167:104–20. doi: 10.1016/j.neuroimage.2017.11.024
25. Zhao F, Ahlawat S, Farahani SJ, Weber KL, Montgomery EA, Carrino JA, et al. Can MR imaging be used to predict tumor grade in soft-tissue sarcoma? Radiology. (2014) 272:192–201. doi: 10.1148/radiol.14131871
26. Zhang L, Yang Y, Wang T, Chen X, Tang M, Deng J, et al. Intratumoral and peritumoral MRI-based radiomics prediction of histopathological grade in soft tissue sarcomas: a two-center study. Cancer Imaging: Off Publ Int Cancer Imaging Society. (2023) 23:103. doi: 10.1186/s40644-023-00622-2
27. Zhou M, Hall L, Goldgof D, Russo R, Balagurunathan Y, Gillies R, et al. Radiologically defined ecological dynamics and clinical outcomes in glioblastoma multiforme: preliminary results. Transl Oncol. (2014) 7:5–13. doi: 10.1593/tlo.13730
28. Hoefkens F, Dehandschutter C, Somville J, Meijnders P, Van Gestel D. Soft tissue sarcoma of the extremities: pending questions on surgery and radiotherapy. Radiat Oncol. (2016) 11:136. doi: 10.1186/s13014-016-0668-9
29. Zhou Z, Qian X, Hu J, Ma X, Zhou S, Dai Y, et al. CT-based peritumoral radiomics signatures for Malignancy grading of clear cell renal cell carcinoma. Abdominal Radiol (New York). (2021) 46:2690–8. doi: 10.1007/s00261-020-02890-z
30. Pérez-Morales J, Tunali I, Stringfield O, Eschrich SA, Balagurunathan Y, Gillies RJ, et al. Peritumoral and intratumoral radiomic features predict survival outcomes among patients diagnosed in lung cancer screening. Sci Rep. (2020) 10:10528. doi: 10.1038/s41598-020-67378-8
31. Das SK, Fang KW, Xu L, Li B, Zhang X, Yang HF. Integrative nomogram of intratumoral, peritumoral, and lymph node radiomic features for prediction of lymph node metastasis in cT1N0M0 lung adenocarcinomas. Sci Rep. (2021) 11:10829. doi: 10.1038/s41598-021-90367-4
32. Galavis PE, Hollensen C, Jallow N, Paliwal B, Jeraj R. Variability of textural features in FDG PET images due to different acquisition modes and reconstruction parameters. Acta Oncol (Stockholm Sweden). (2010) 49:1012–6. doi: 10.3109/0284186X.2010.498437
33. Shirvaikar M, Huang N, Dong XN. The measurement of bone quality using gray level co-occurrence matrix textural features. J Med Imaging Health Inform. (2016) 6:1357–62. doi: 10.1166/jmihi.2016.1812
34. Zhang X, Xu X, Tian Q, Li B, Wu Y, Yang Z, et al. Radiomics assessment of bladder cancer grade using texture features from diffusion-weighted imaging. J Magn Reson Imaging: JMRI. (2017) 46:1281–8. doi: 10.1002/jmri.25669
35. Kandalgaonkar P, Sahu A, Saju AC, Joshi A, Mahajan A, Thakur M, et al. Predicting IDH subtype of grade 4 astrocytoma and glioblastoma from tumor radiomic patterns extracted from multiparametric magnetic resonance images using a machine learning approach. Front Oncol. (2022) 12:879376. doi: 10.3389/fonc.2022.879376
36. Peng H, Long F, Ding C. Feature selection based on mutual information: criteria of max-dependency, max-relevance, and min-redundancy. IEEE Trans Pattern Anal Mach Intell. (2005) 27:1226–38. doi: 10.1109/TPAMI.2005.159
37. Gui J, Li H. Penalized Cox regression analysis in the high-dimensional and low-sample size settings, with applications to microarray gene expression data. Bioinf (Oxford England). (2005) 21:3001–8. doi: 10.1093/bioinformatics/bti422
38. Ramkumar M, Shanmugaraja P, Anusuya V, Dhiyanesh B. Identifying cancer risks using spectral subset feature selection based on multi-layer perception neural network for premature treatment. Comput Methods Biomech Biomed Eng. (2023) 27:1804–16. doi: 10.1080/10255842.2023.2262662.
39. Makris GM, Pouliakis A, Siristatidis C, Margari N, Terzakis E, Koureas N, et al. Image analysis and multi-layer perceptron artificial neural networks for the discrimination between benign and Malignant endometrial lesions. Diagn Cytopathol. (2017) 45:202–11. doi: 10.1002/dc.23649
40. Schmidhuber J. Deep learning in neural networks: an overview. Neural Netw: Off J Int Neural Netw Society. (2015) 61:85–117. doi: 10.1016/j.neunet.2014.09.003
Keywords: soft tissue sarcoma, habitats, nomogram, radiomics, grade
Citation: Wang B, Guo H, Zhang M, Huang Y, Duan L, Huang C, Xu J and Wang H (2024) Prediction of soft tissue sarcoma grading using intratumoral habitats and a peritumoral radiomics nomogram: a multi-center preliminary study. Front. Oncol. 14:1433196. doi: 10.3389/fonc.2024.1433196
Received: 16 May 2024; Accepted: 22 November 2024;
Published: 11 December 2024.
Edited by:
Morgan Michalet, Institut du Cancer de Montpellier (ICM), FranceReviewed by:
Paolo Spinnato, Rizzoli Orthopedic Institute (IRCCS), ItalyYanfen Cui, Chinese Academy of Medical Sciences/Cancer Hospital Affiliated to Shanxi Medical University, China
Copyright © 2024 Wang, Guo, Zhang, Huang, Duan, Huang, Xu and Wang. This is an open-access article distributed under the terms of the Creative Commons Attribution License (CC BY). The use, distribution or reproduction in other forums is permitted, provided the original author(s) and the copyright owner(s) are credited and that the original publication in this journal is cited, in accordance with accepted academic practice. No use, distribution or reproduction is permitted which does not comply with these terms.
*Correspondence: Jun Xu, eGoxODg2MzYwOTE1M0AxNjMuY29t; Hexiang Wang, d2FuZ2hleGlhbmdAcWR1LmVkdS5jbg==
†These authors have contributed equally to this work and share first authorship
 Bo Wang1†
 Lisha Duan
 Chencui Huang
 Jun Xu
 Hexiang Wang