 Leticia Szadai1*
 Aron Bartha2,3Indira Pla Parada4Alexandra I.T. Lakatos5,6,7
 Dorottya M.P. Pál5,6,7
 Anna Sára Lengyel5,6,7Natália Pinto de Almeida8,9Ágnes Judit Jánosi1
 Fábio Nogueira9
 Beata Szeitz10Viktória Doma7Nicole Woldmar8,9
 Jéssica Guedes4,8Zsuzsanna Ujfaludi11,12Zoltán Gábor Pahi11,12,13
 Tibor Pankotai11,12,13Yonghyo Kim14
 Balázs Győrffy2,15Bo Baldetorp16Charlotte Welinder16
 A. Marcell Szasz10
 Lazaro Betancourt8
 Jeovanis Gil8Roger Appelqvist8
 Ho Jeong Kwon17
 Sarolta Kárpáti7Magdalena Kuras8
 Jimmy Rodriguez Murillo18
 István Balázs Németh1
 Johan Malm4
 David Fenyö19Krzysztof Pawłowski20Peter Horvatovich21Elisabet Wieslander16
 Lajos V. Kemény5,6,7Gilberto Domont9
 György Marko-Varga8,22†
 Aniel Sanchez4†
- 1Department of Dermatology and Allergology, University of Szeged, Szeged, Hungary
- 2Department of Bioinformatics, Semmelweis University, Budapest, Hungary
- 3Department of Pediatrics, Semmelweis University, Budapest, Hungary
- 4Section for Clinical Chemistry, Department of Translational Medicine, Lund University, Skåne University Hospital Malmö, Malmö, Sweden
- 5HCEMM-SU Translational Dermatology Research Group, Semmelweis University, Budapest, Hungary
- 6Department of Physiology, Semmelweis University, Budapest, Hungary
- 7Department of Dermatology, Venereology, and Dermatooncology, Semmelweis University, Budapest, Hungary
- 8Clinical Protein Science & Imaging, Biomedical Centre, Department of Biomedical Engineering, Lund University, Lund, Sweden
- 9Chemistry Institute Federal, University of Rio de Janeiro, Rio de Janiero, Brazil
- 10Department of Internal Medicine and Oncology, Semmelweis University, Budapest, Hungary
- 11Department of Pathology, Albert Szent-Györgyi Medical School, University of Szeged, Szeged, Hungary
- 12Competence Centre of the Life Sciences Cluster of the Centre of Excellence for Interdisciplinary Research, Development and Innovation, University of Szeged, Szeged, Hungary
- 13Hungarian Centre of Excellence for Molecular Medicine (HCEMM), Genome Integrity and DNA Repair Core Group, University of Szeged, Szeged, Hungary
- 14Therapeutics & Biotechnology Division, Korea Research Institute of Chemical Technology (KRICT), Daejeon, Republic of Korea
- 15Research Centre for Natural Sciences, Institute of Molecular Life Sciences, Budapest, Hungary
- 16Division of Oncology, Department of Clinical Sciences Lund, Lund University, Lund, Sweden
- 17Chemical Genomics Global Research Lab, Department of Biotechnology, College of Life Science and Biotechnology, Yonsei University, Seoul, Republic of Korea
- 18Department of Biochemistry and Biophysics, Karolinska Institute, Stockholm, Sweden
- 19Department of Biochemistry and Molecular Pharmacology, NYU Grossman School of Medicine, New York, NY, United States
- 20Department of Molecular Biology, University of Texas Southwestern Medical Center, Dallas, TX, United States
- 21Analytical Biochemistry, Department of Pharmacy, University of Groningen, Groningen, Netherlands
- 22First Department of Surgery, Tokyo Medical University, Nishishinjiku, Shinjiku-ku, Tokyo, Japan
Introduction: While Immune checkpoint inhibition (ICI) therapy shows significant efficacy in metastatic melanoma, only about 50% respond, lacking reliable predictive methods. We introduce a panel of six proteins aimed at predicting response to ICI therapy.
Methods: Evaluating previously reported proteins in two untreated melanoma cohorts, we used a published predictive model (EaSIeR score) to identify potential proteins distinguishing responders and non-responders.
Results: Six proteins initially identified in the ICI cohort correlated with predicted response in the untreated cohort. Additionally, three proteins correlated with patient survival, both at the protein, and at the transcript levels, in an independent immunotherapy treated cohort.
Discussion: Our study identifies predictive biomarkers across three melanoma cohorts, suggesting their use in therapeutic decision-making.
1 Introduction
Cutaneous malignant melanoma is among the most therapy-resistant cancers with a high metastatic potential to distant organs.
Over the past decade, the treatment landscape of advanced and unresectable melanomas has been profoundly transformed, largely driven by advancements in our understanding of cancer biology and pathogenesis (1–6). This surge in knowledge has paved the way for innovative biological therapies, most notably immune-checkpoint inhibitors (ICI). However, the efficacy of ICI remains limited to a specific subset of patients, and the current clinical landscape lacks reliable biomarkers to assess the suitability of ICI therapy for individual patients.
Attributes of the melanoma sample could enhance the prediction of the immunotherapy response, such as; proteins related to antigen presentation (4–6), tumor mutation burden (7–9), CD8 protein in T-cells (10), the presence of tumor-infiltrating lymph cells (11, 12), the composition of the tumor microenvironment (TME) (13, 14), expression of self-antigens (15). Furthermore, Garutti et al. and Blank et al. (16, 17)emphasize the concept of “immunogram” which combines several parameters (e.g., mutational burden – tumor foreignness, general immune status – lymphocyte count, immune cell infiltration – intratumoral T cells, absence of checkpoints – PD-L1, absence of soluble inhibitors – Il-6, absence of inhibitory tumor metabolisms – LDH, glucose utilization, tumor sensitivity to immune effectors – MHC expression etc.) to estimate the efficacy of immunologic treatments. Nevertheless, a critical unmet need in melanoma management remains: the identification of robust biomarkers capable of distinguishing responders from non-responders to ICI therapy in the early stage of melanoma progression.
Recently, a computational method predicting the immunotherapy response (ITR) of cancer patients was developed by quantifying signatures of the TME and its association with 14 different transcriptome-based predictors of anticancer immune responses. These predictors model different hallmarks of response to immune-checkpoint inhibitors (18). Based on this information, the authors constructed a machine learning model designated as the Estimate Systems Immune Response (EaSIeR) score, aimed at discerning the potential ITR in patients. The underlying algorithms for this model rely on RNA-seq data of the antitumoral immune response of 7,550 patients treated with PD-1/PD-L1 inhibitors across a spectrum of 18 solid tumors, including melanoma (18). Throughout this manuscript, we refer to the categorization that the EaSIeR score provides (ITR for responders and non-responders).
Here, we utilized data generated from the Human Melanoma Proteome Atlas project (19, 20). Within the scope of this study, quantitative proteomics and comprehensive histopathological characterizations were conducted on 505 tumor samples, encompassing primary tumors and metastases across 26 organs. Building on this foundational work, we identified 401 potential biomarkers associated with ICI response (14) in the first cohort (Cohort 1), where immunotherapy data was available for 22 melanoma patients. In the present study, we assess the immunotherapy response association of these proteins in two independent cohorts of metastatic melanoma patients who have not received immunotherapy (Cohort 2 and Cohort 3). Our analysis involved predicting the patient’s potential immunotherapy response utilizing the EaSIeR scoring system. The overarching aim of our study is to elucidate the potential immune-response associations of these 401 protein candidates within two large, independent melanoma patient cohorts naive to immunotherapy, and validate the top candidate hits through transcriptomic datasets. (For detailed data about the clinical information of Cohort 1, Cohort 2, and Cohort 3, see Supplementary Tables S3A–S3C and Materials and Methods).
2 Materials and methods
2.1 The melanoma patient cohorts
In this study, we included three independent cohorts of metastatic melanoma patients. The first dataset, also referred to as Cohort 1, served as our discovery cohort to investigate proteins that potentially could predict the response to immunotherapy. We used this cohort as the groundwork for our study. Cohort 1 consisted of twenty-four melanoma samples from twenty-two patients, all of which had not received any prior immunotherapy treatment at the time of sampling, ensuring that the assessment of protein expression profiles occurred prior to any therapeutic interventions. Based on the progression data from patients undergoing immune checkpoint inhibitor (ICI) treatment, we defined two distinct subgroups: one characterized by progression (progressed subgroup) and the other by non-progression (non-progressed subgroup) during immunotherapy. Subsequently, we identified proteins within these subgroups that predict either better outcomes (no progression during immunotherapy, resulting in long progression-free survival) or worse outcomes (progression during immunotherapy, leading to short progression-free survival) in response to immunotherapy. The quantitative proteomics analysis led to the identification of a set of proteins that were significantly correlated with short or long progression-free survival and therefore were considered potential predictors of better or worse ITR. (Multiple Cox regression *p-value < 0.05). The detailed clinicopathological data of the cohort is presented in the Supplementary Material (Supplementary Table S3A) (14).
The proteins that were identified in Cohort 1 were also examined in two independent melanoma cohorts (Cohort 2 and Cohort 3). Cohort 2 included 142 metastatic melanoma samples and also served as a first selection cohort in our analysis. At the time of sample collection, the patients had not received any prior treatment, and we have limited information about the subsequent application of immunotherapy in Cohort 2 patients. From the samples of Cohort 2 information of histopathology, and both quantitative proteomics and transcriptomics analyses were available. By proteomics and transcriptomics, 12,695 proteins and 11,468 genes were quantified. The resulting data from proteomics and transcriptomics served as a basis for the adjustment of protein scoring in our study. In Cohort 2, we utilized the EaSIeR scoring system to predict the responders and non-responders to immunotherapy based on the mechanistic signatures (e.g., immune cell quantification, pathway activity, transcription factor activity, ligand-receptor pairs, cell-cell interactions (18)) which determine the responsiveness of the samples at protein level. By scoring the responder and non-responder samples, we were able to identify the proteins in both groups and compare with the proteins from Cohort 1. The comprehensive clinicopathological information about the aforementioned cohort is involved in the Supplementary Material (Supplementary Table S3B). A manuscript describing this cohort is submitted to biorxiv.org (21).
Cohort 3, also referred to as a second selection cohort, consisted of a total of 44 metastatic melanoma samples. These patients had not undergone any immunotherapy treatment at the time of sample collection. Although we have information about the use of immunotherapy in this cohort, there is no available data on the immunotherapy response. From Cohort 3 quantitative proteomics information was available, all together 9040 proteins were identified and quantified by LC-MS/MS in Cohort 3. Therefore, we were able to correlate these proteins with transcriptome-based mechanistic signatures (e.g., immune cell quantification, pathway activity, transcription factor activity, ligand-receptor pairs, cell-cell interactions (18)) which contribute to anticancer immune responses. Based on the correlation, ITR score could be investigated in the samples. The detailed clinicopathological information about the aforementioned cohort is described in the Supplementary Material (Supplementary Table S3C).
2.2 Data generation steps for the three cohorts
The transcript expression profiling of samples from Cohort 2 was obtained from a previous study (22) and can be found in the NCBI Gene Expression Omnibus (GEO) database (GSE65904) (23). Proteomic data obtained from the Human Melanoma Proteome Atlas project (19, 20) are related to mass spectrometry (LC-MS/MS) analyses carried out in protein extracts obtained from formalin-fixed and paraffin-embedded (FFPE) (Cohort 1) and from fresh-frozen (Cohort 2 and Cohort 3)melanoma tissues. LC-MS/MS data were collected in both Data-Dependent Acquisition (DDA) and Data-Independent Acquisition (DIA) modes, for Cohort 2 and Cohort 1, Cohort 3, respectively. For data analysis, peptide, protein identification and quantification in DDA and DIA experiments were performed using the Proteome Discoverer Software (Thermo Fisher Scientific) and Spectronaut X platform (Biognosis AG), respectively. Searches were conducted using the Homo sapiens database from Uniprot, containing isoforms, with the following parameters: cysteine carbamidomethylation (+57.0215 Da) as fixed modification and methionine oxidation (+15.9949 Da), N-terminal acetylation (+42.0105 Da) as dynamic modifications. A maximum of two missed cleavages were accepted. FDR was set at 1% for peptides and proteins identification. The raw protein intensities were normalized by log2 transformation, and standardization was performed by subtracting individual values by the median in each sample (Cohort 1 and Cohort 3). For TMT-11 labeled samples (Cohort 2), the protein intensities from a pooled reference sample (in channel 126 in each batch) were subtracted from each channel in the corresponding batch to obtain the final relative protein abundance values (log2 transformed and zero centered).
2.3 Selection of proteins from a previously published dataset, testing and calculation of the predicted immune response in additional melanoma patients
Based on Szadai et al. (Cohort 1 (14),) proteins associated with response to immunotherapy from 22 patients were selected to analyze this association in two new different cohorts (Cohort 2, Cohort 3). Firstly, the ITR scoring system, based on RNA-seq data proposed by Óscar Lapuente-Santana et al. (18), which estimates the likelihood of patients responding to immune checkpoint blockade therapy was used. To test whether this scoring can be applied also at the protein level we used the Cohort 2 (142 patients) to correlate the predicted EaSIeR scoring obtained from RNA-seq data and the predicted EaSIeR scoring obtained from proteomic data (both datasets collected from the same cohort). The correlation was evaluated using a Pearson correlation test, with *p-values < 0.05 considered statistically significant. (Supplementary Tables S2A, B). After observing a significant correlation between EaSIeR scores derived from RNA and protein levels in Cohort 2, we calculated the EaSIeR score for each of the 44 patients in Cohort 3. This allowed us to assign an ITR (immune checkpoint blockade therapy response) scoring to each patient in Cohort 3 (Supplementary Table S3D).
2.4 Correlation between proteins linked to ITR and the scoring of ITR in patients
To determine which of the potential immune-response-related proteins selected from Cohort 1 (14) could be found in Cohorts 2 and 3, we first correlated the EaSIeR scores assigned to the patients in each cohort with the expression levels of each protein. Pearson correlations with adjusted p-values < 0.05 were considered significant. Second, patients from Cohorts 2 and 3 were stratified based on EaSIeR score (i.e., predicted ITR) to quartiles (Q1-Q4). The best potential responder patients were grouped in Q4 and poorest potential responders were in Q1. Next, a Student’s T-test was used to identify differentially expressed proteins (DEP) between poorest responders (Q1) and the best responders (Q4). Proteins with adjusted p-values (using Benjamini-Hochberg (FDR) method) < 0.05 were considered differentially expressed (Supplementary Table S2A).
All analyses described in Figures 1–3 were performed using RStudio version 4.2.1. The summary results of the analysis can be found in Supplementary Material 3. The code used for the analysis of this section is available in Supplementary Material 3.
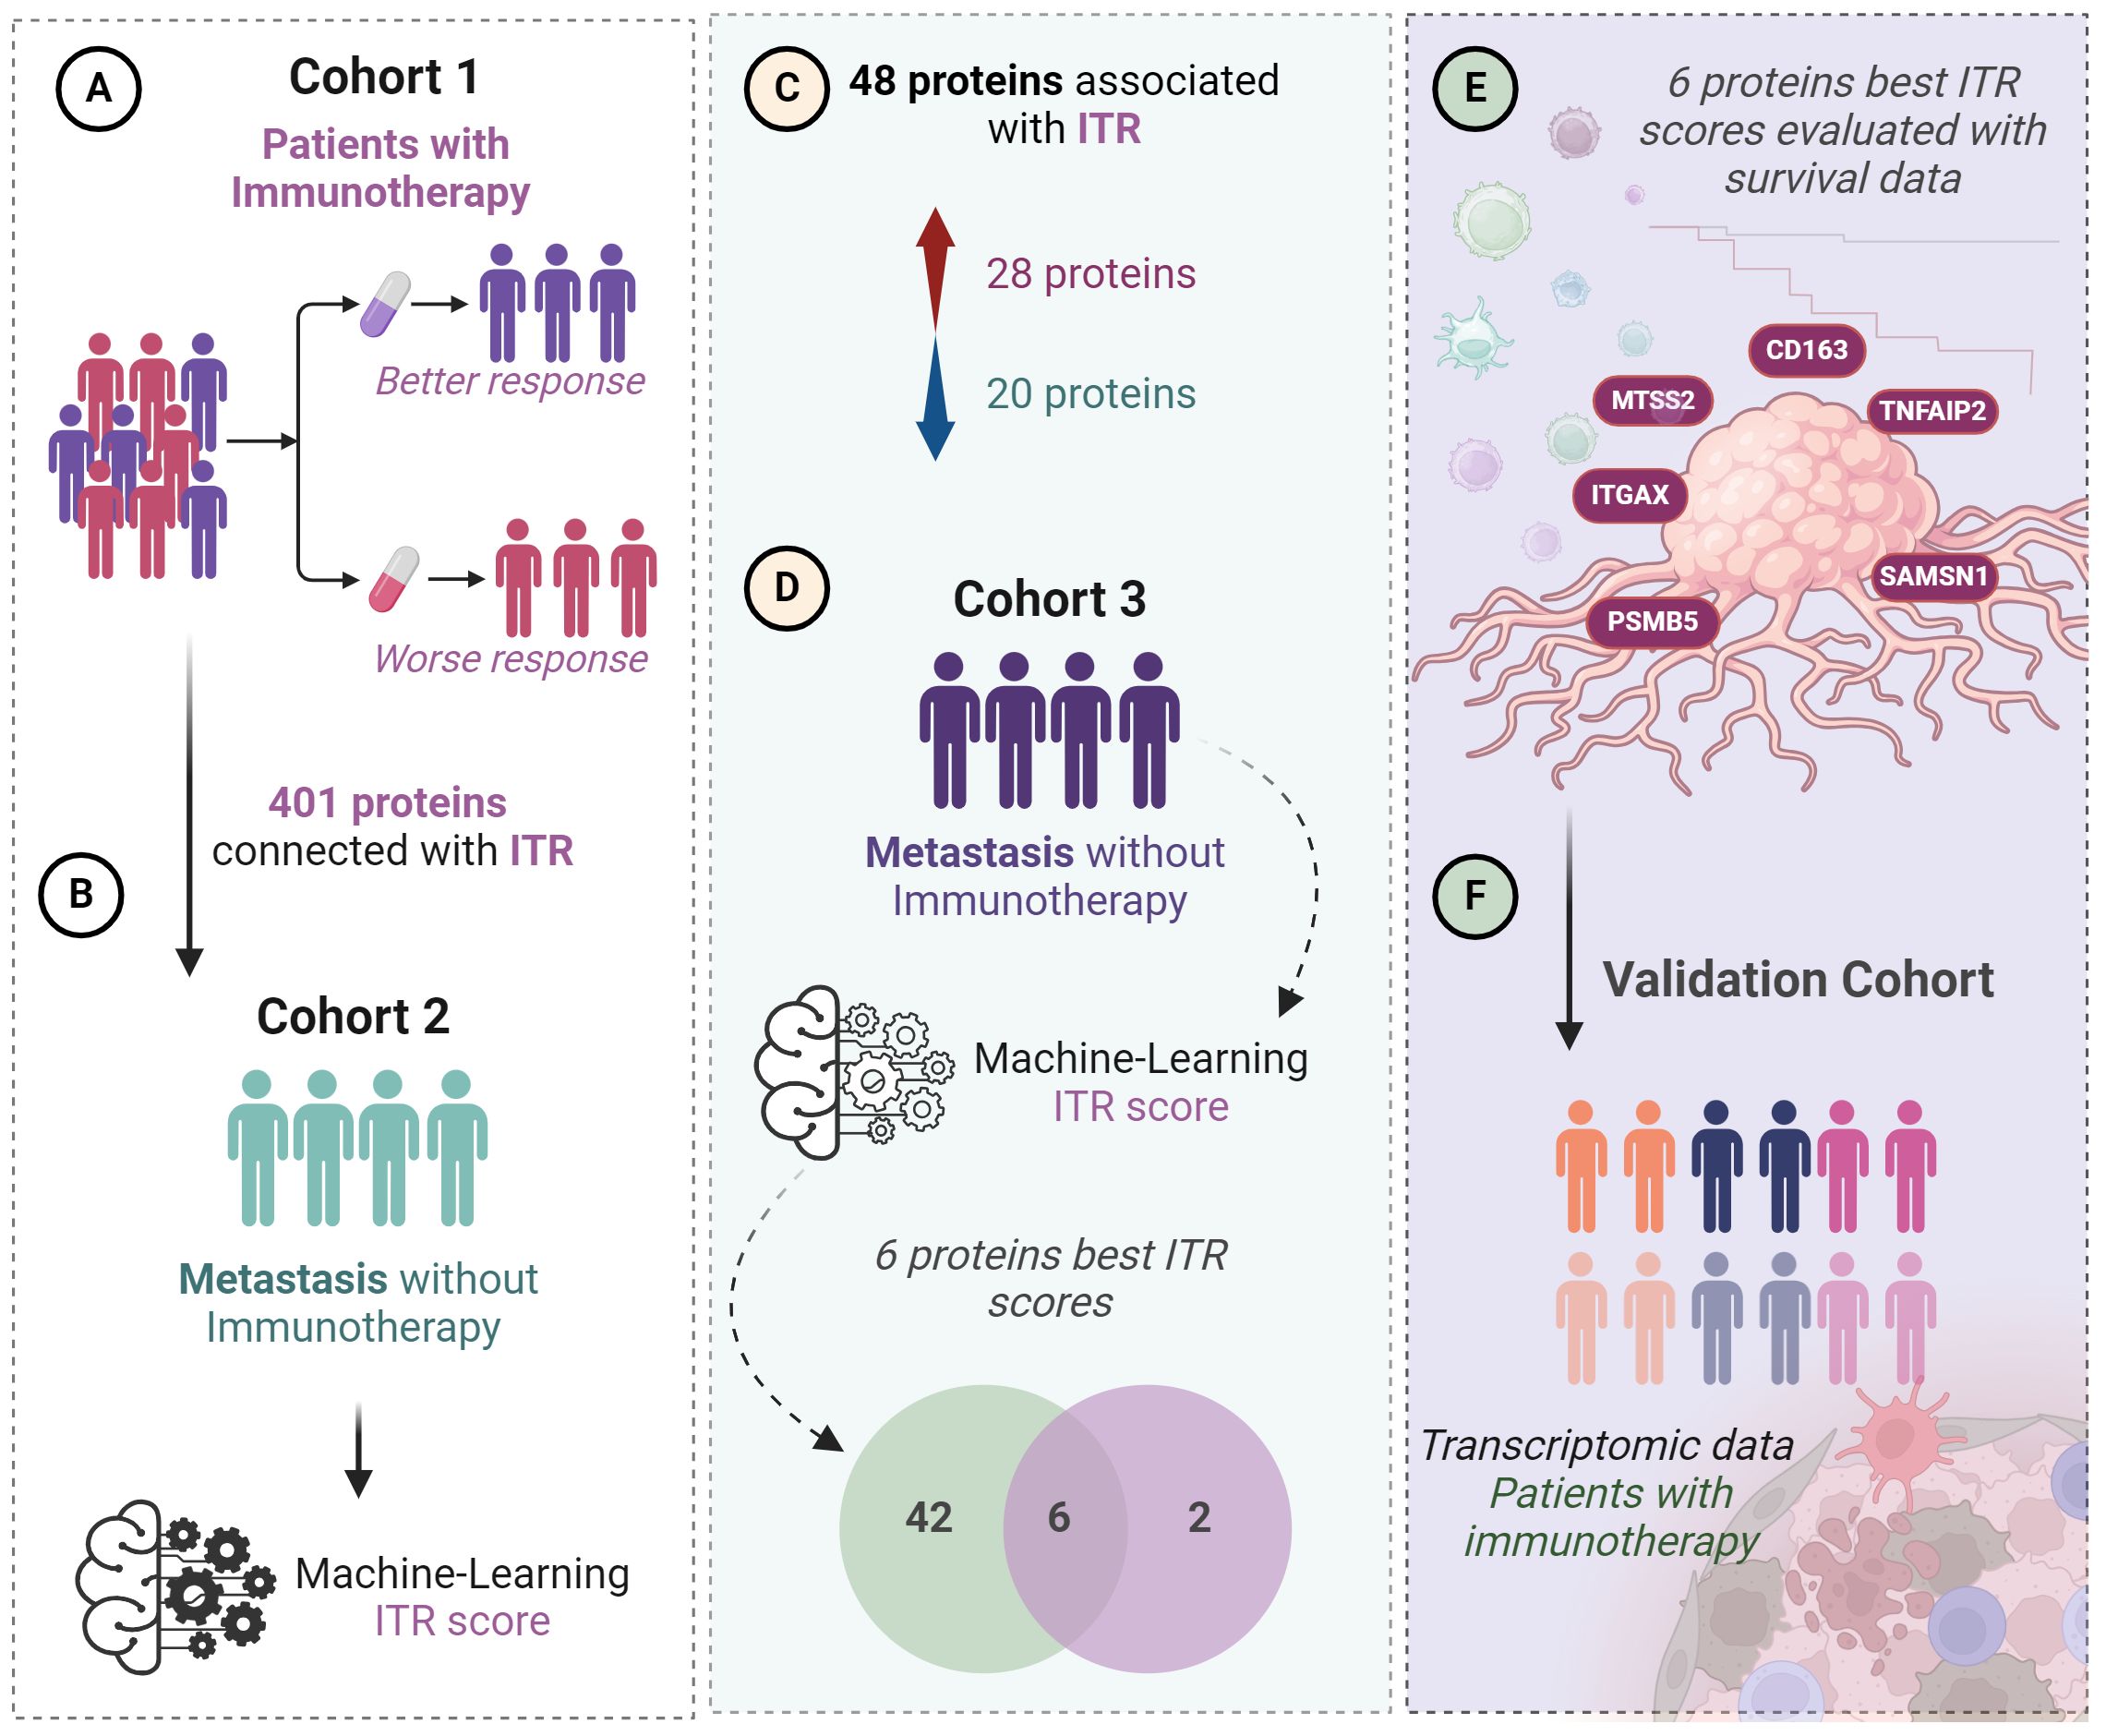
Figure 1 Workflow of the study step by step. From the first identified proteins through the testing of the ITR scoring until the final selection of the top six proteins. (A) 401 proteins were previously identified predicting ITR from a discovery cohort (Cohort 1, n=22). (B) Global proteomics outcomes were scored (ITR score) for immunotherapy response based on a machine-learning algorithm in a second independent cohort of patients with metastatic melanoma without immunotherapy (n=142). (C) 48 proteins were associated with ITR in Cohorts 1 and 2, 28 proteins upregulated and 20 downregulated. (D) Among these 48 proteins, 6 showed the best ITR score in Cohort 3, which is also composed of patients with metastatic melanoma (n=44). (E) correlation of the 6 proteins with the best ITR score with survival. (F) Validation using transcriptomic data in a cohort where patients received immunotherapy.
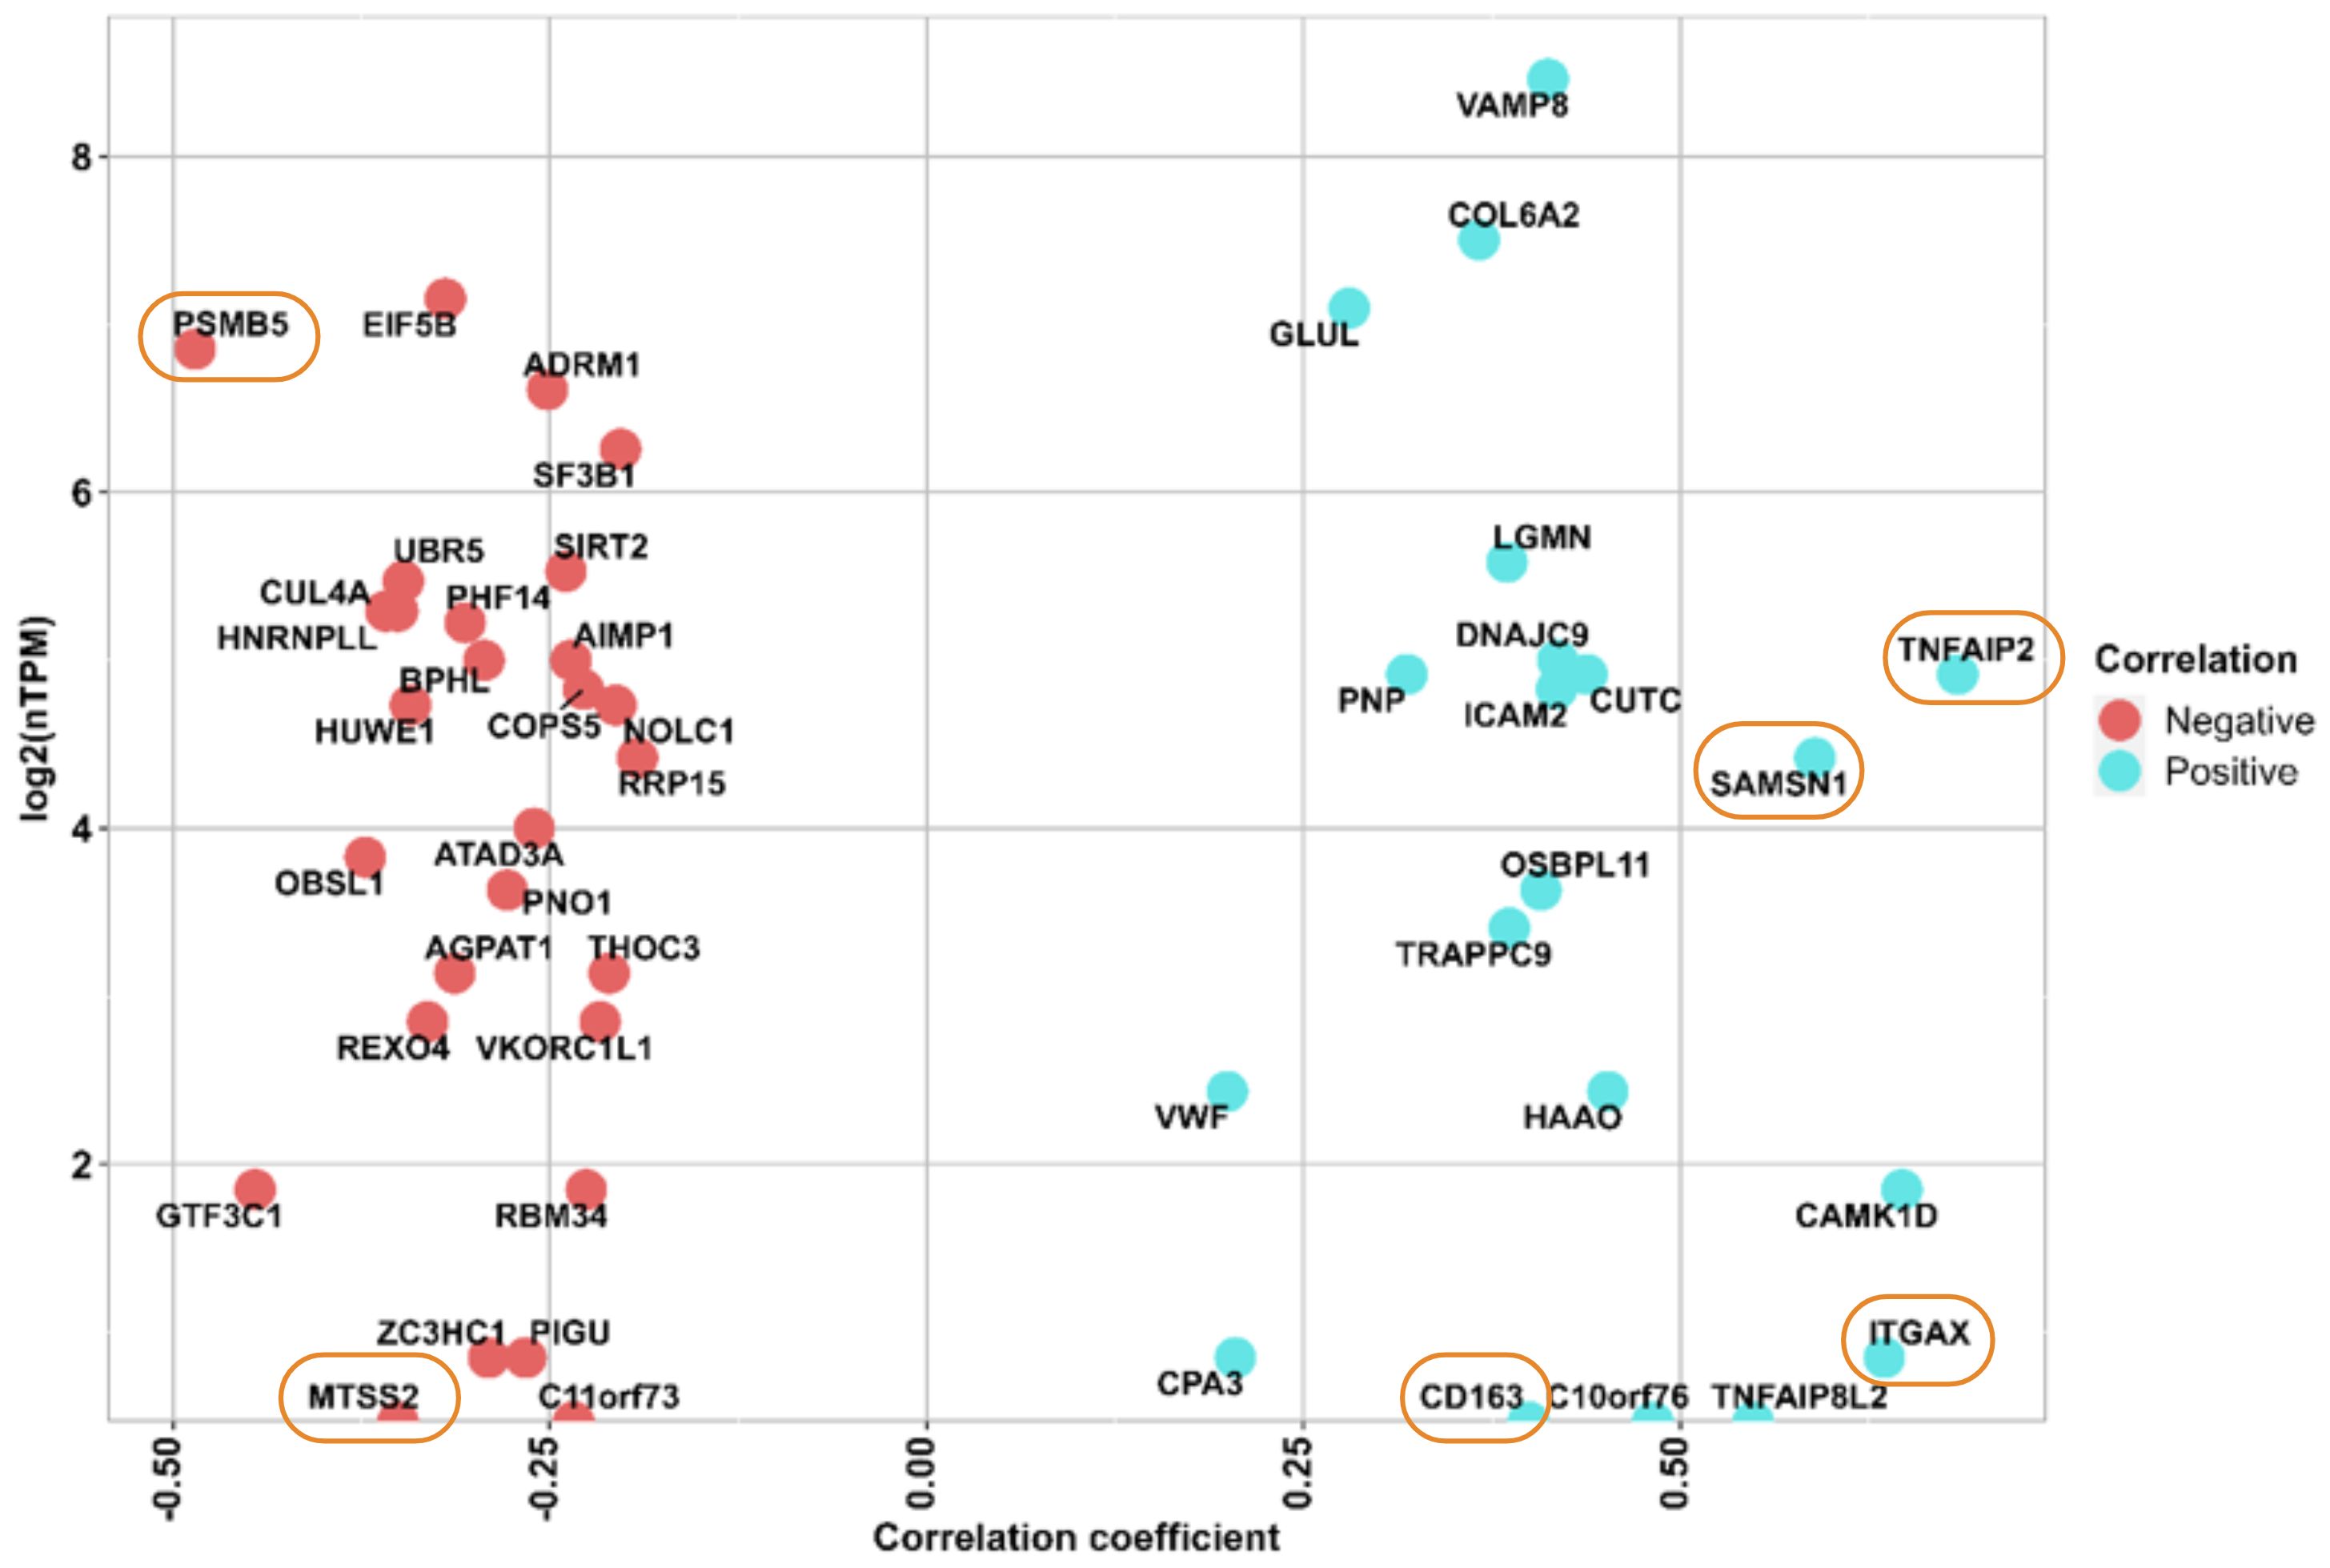
Figure 2 The y axis shows the RNA expression at single cell level (nTMP) values, x axis shows the correlation between protein intensity and ITR, and the identified 6 proteins marked with orange circle. Negatively correlated proteins are illustrated in red color, and positively correlated proteins are shown in blue color.
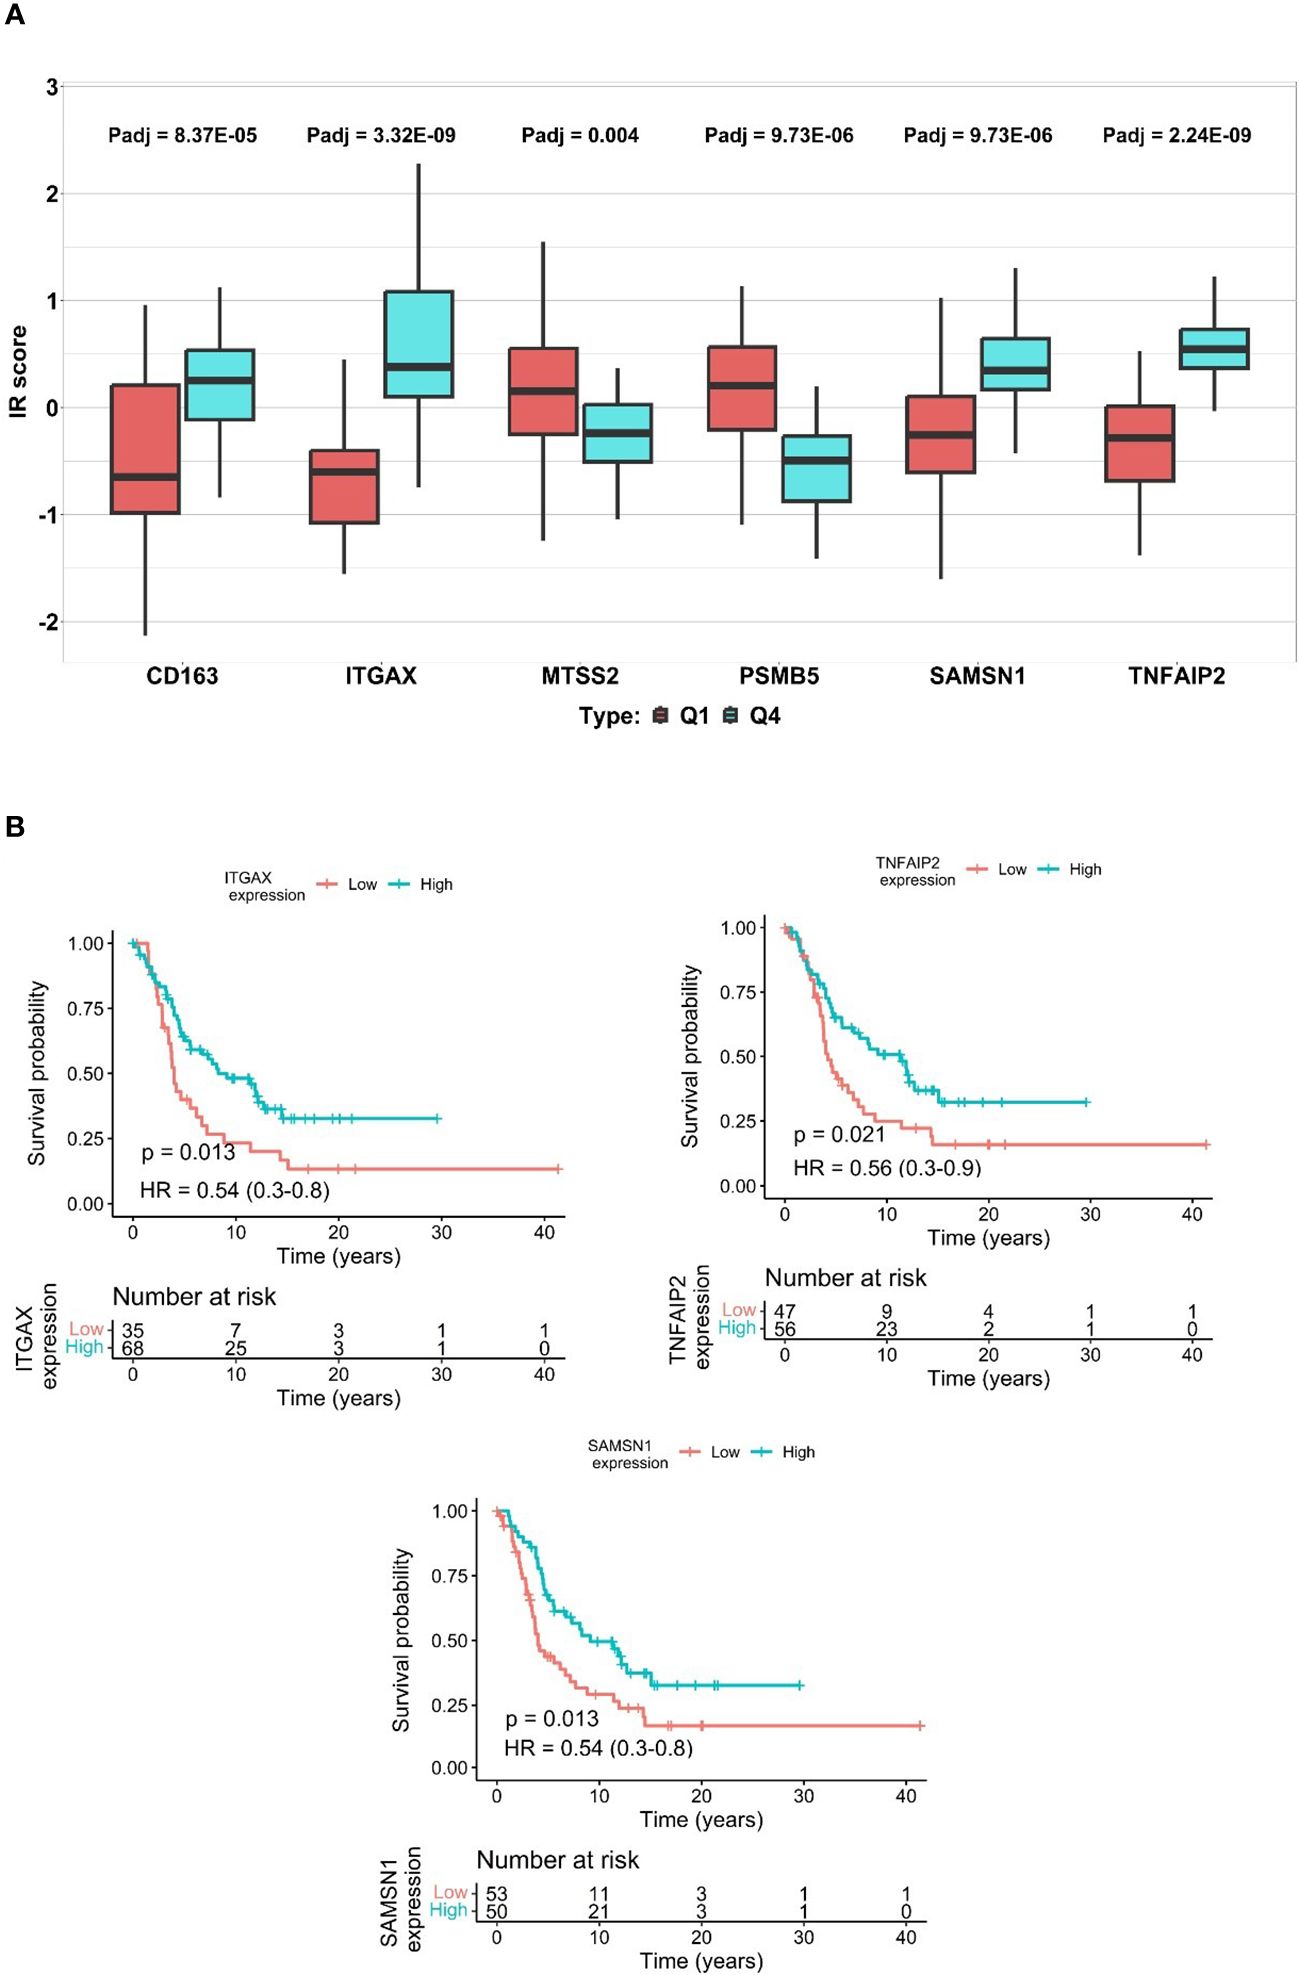
Figure 3 The differences of ITR scores in immunotherapy response and disparities in protein expression predicting survival. (A) represents ITR boxplot of the 6 proteins, Q1 vs Q4 values for each protein are shown to the left and the right side, respectively. Q1 representing potential non-responders is highlighted by a red box, while Q4 signifying potential responders are presented with a blue box. (*p-value < 0.05, Student-T test). (Supplementary Tables S2A, B, S3E). (B) Kaplan-Meier plots of the SAMSN1, TNFAIP2, and ITGAX, in patients where elevated expression of these proteins show a significant correlation with increased overall survival.
2.5 Selection of the proteins best associated with ITR and their gene ontology enrichment analysis
Proteins identified in Cohorts 2 and 3, which were found to be significantly associated with immune therapy response (ITR) [as observed by Szadai et al. (14)], were combined using Venn diagram and common proteins were considered for further analyses.
To investigate the molecular functionality of the proteins associated with ITR, we selected the list of proteins that were observed as significant in Cohort 2, as it was the largest list. We then conducted a Gene Ontology (GO) Enrichment Analysis (see Supplementary Tables S2F, S3E).
2.6 Relationship of the top selected proteins with survival
Significant proteins found to be potentially related to ITR in both Cohorts 2 and 3 were considered the top significant proteins. To analyze the relationship of each of these proteins with survival, we used data from Cohort 2. First, a univariate analysis per protein was performed based on Kaplan–Meier (KM) curves. Secondly, we conducted Cox regression analysis to adjust the models for age at diagnosis, gender, tumor content of the sample, and clinical stage. To create Kaplan–Meier (KM) curves, proteins were categorized into low and high expression groups. This categorization was done by applying a receiver operating characteristic (ROC) curve per protein to detect the best cut-off point (based on Youden index) for discriminating between less or more than 2 years of survival. The protein expression (categorical variable) was used as the independent variable and the survival time of the patients served as the dependent variable. Patients whose protein values exceeded or fell below the cut-off point were categorized as having high or low protein expression, respectively.
2.7 Validation of the top proteins in transcriptomic cohorts with immunotherapy
Publicly available transcriptomic data obtained from melanoma tumors harvested before the initiation of PD1 inhibitor (24) and CTLA4 inhibitor (9) were used to investigate the top genes associated with progression-free and overall survival. Patients were ranked based on the gene expression of each gene. The survival of patients with the highest gene expression (top 10, 20 and 30% expression) was compared to survival of patients with the lowest expression) bottom 10, 20, 30%, respectively) for the Liu et al. dataset (24). To avoid selection bias, multiple cutoffs were used to avoid (see Supplementary Table S2E). For the Van Allen dataset (9) due to the lower number of samples, the top 25% and 50% were compared to the bottom 25% and 50%. The Log-rank test was used to determine significance.
2.8 Illustrations
The illustrions of Figure 1 and Figure 4 were created with Biorender 2021 Software (25). The Kaplan-Meier survival analysis was created by GraphpadPrism 8.0.1 (26). For the references Zotero Reference program was used (27).
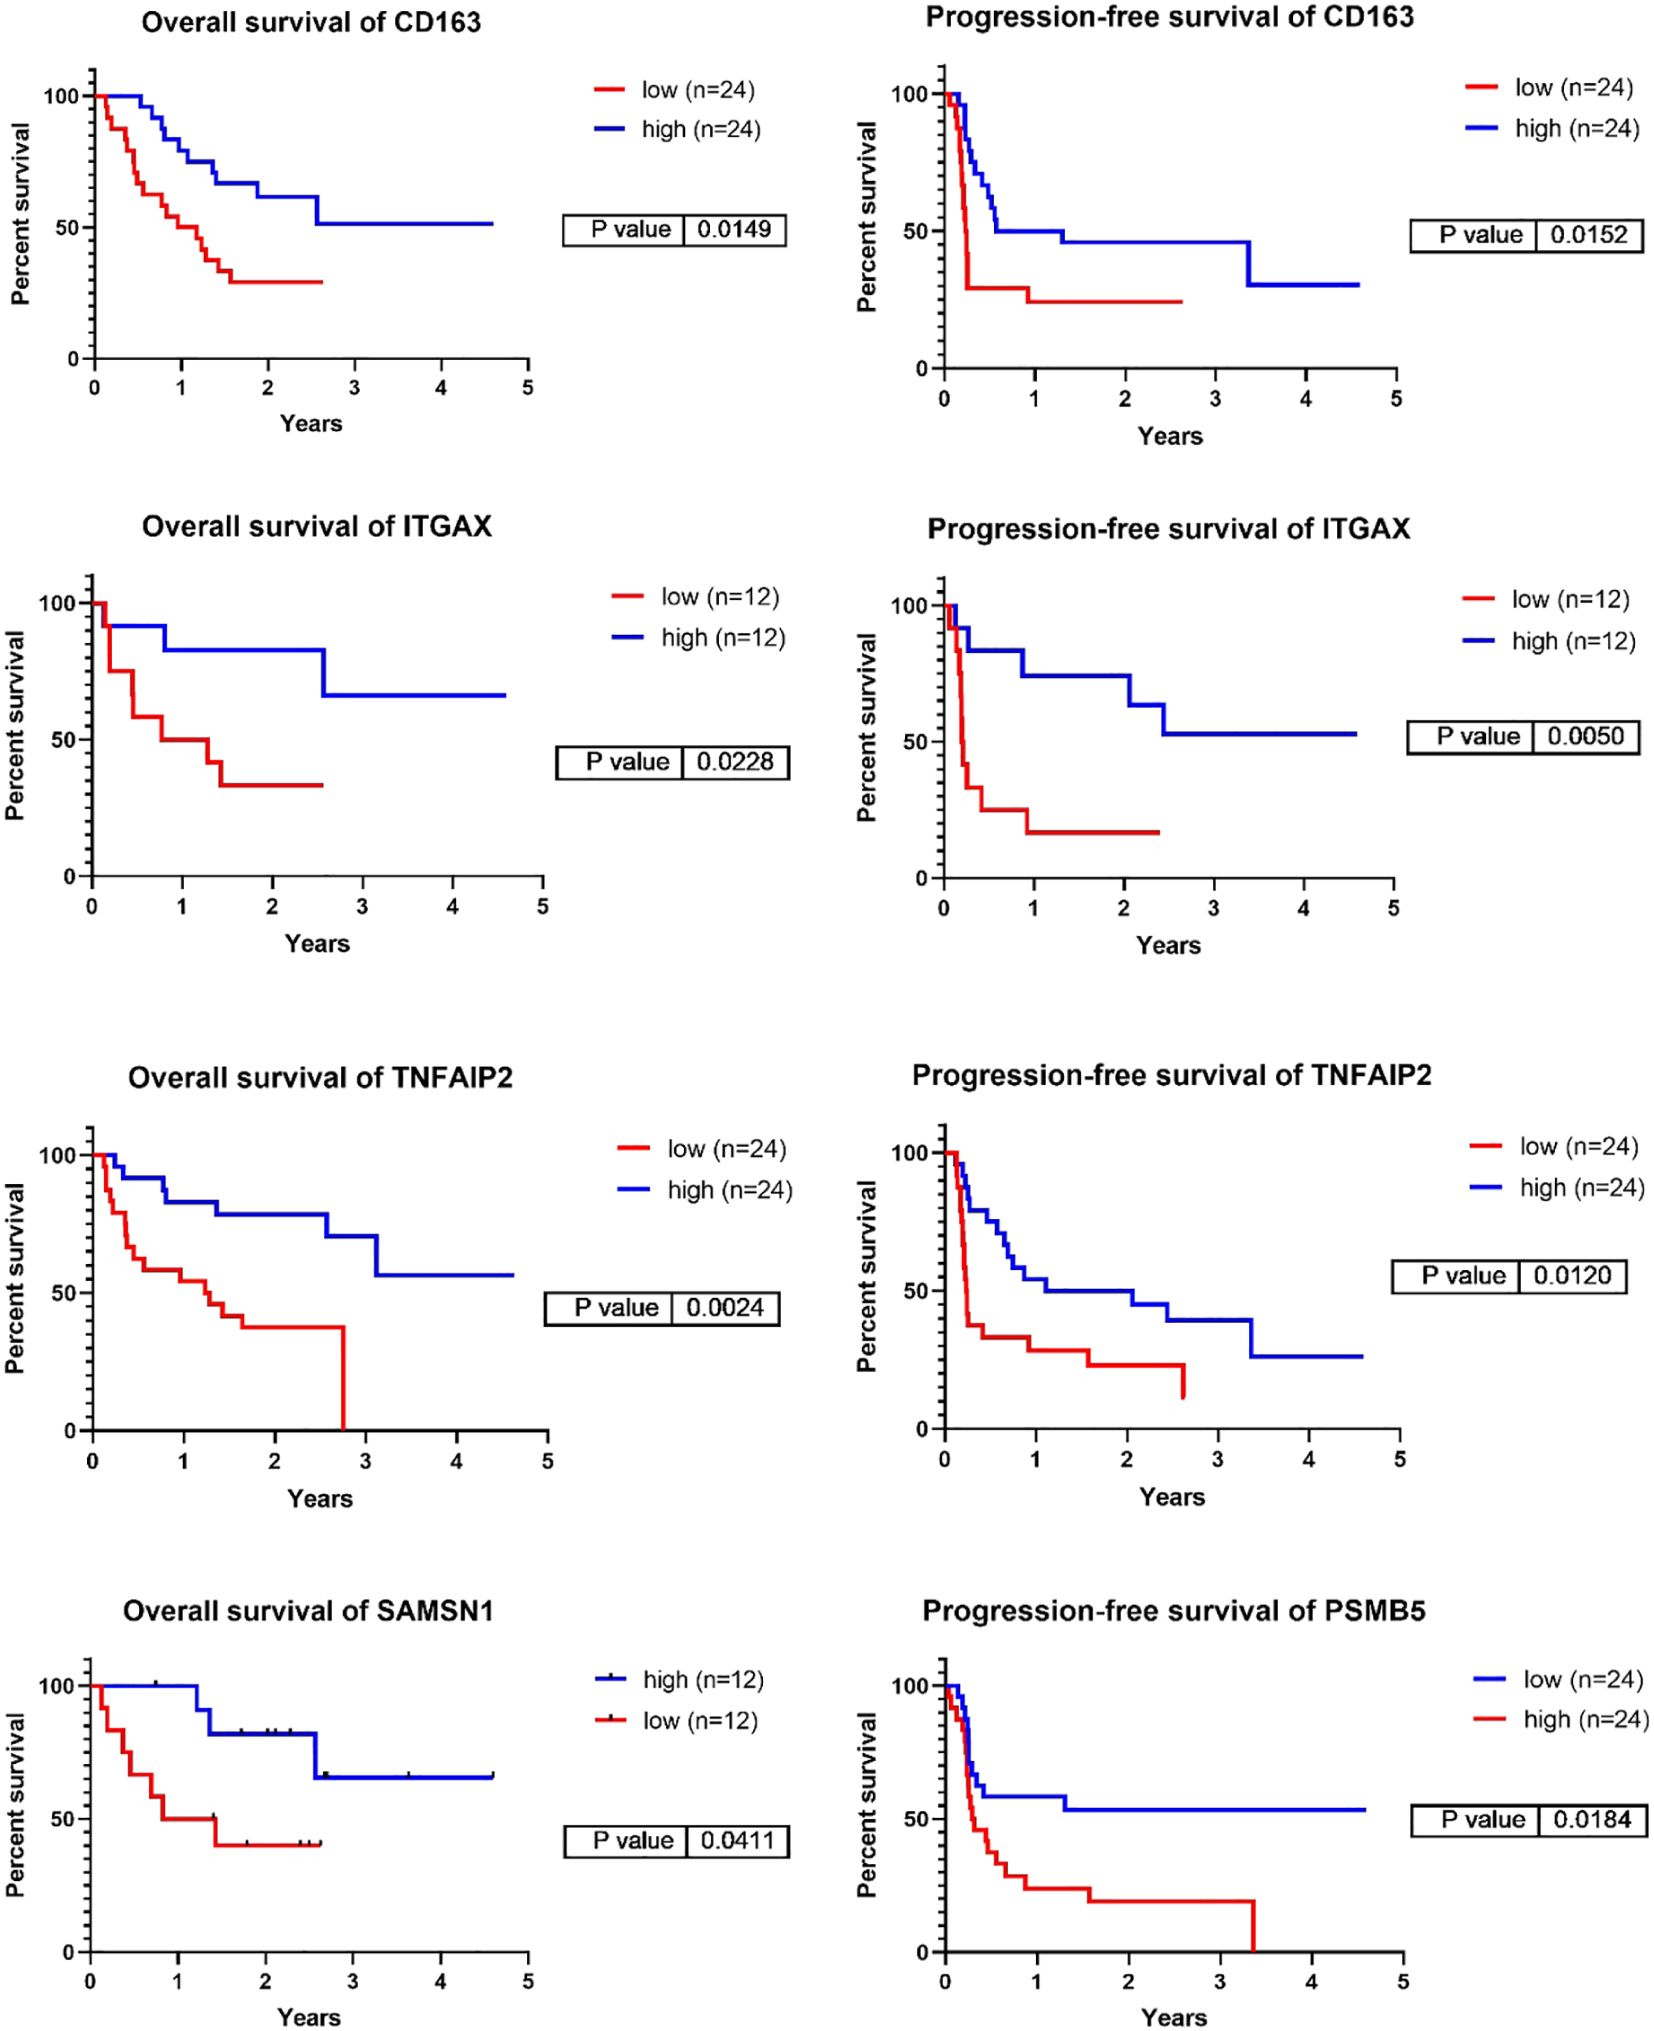
Figure 4 Representative Kaplan-Meier survival analyses of the genes corresponding to the six top identified proteins focusing on overall-, and progression-free survival in the validation cohort of PD1 immunotherapy transcriptomic cohort. The cut off values used are the following: CD163 – PFS:20%, OS:20%, ITGAX – PFS10%, OS:10%, TNFAIP2 – PFS:20%, OS:20%, SAMSN1 – OS:10%, PSMB5 – PFS:20%. (PFS/ Progression-free survival/, OS/Overall Survival/).
2.9 Statistical analyses
For the correlation of the predicted EaSIeR scoring obtained from RNA-seq data and the predicted EaSIeR scoring obtained from proteomic data Pearson correlation test was used, with *p-values < 0.05 were considered statistically significant. To compare the responders and non-responders in Cohort 2 and Cohort 3, patients were were stratified based on EaSIeR score (i.e., predicted ITR) to quartiles (Q1-Q4). Best responders were grouped in Q4 and the poorest responders were in Q1. Student’s T-test was used to identify differentially expressed proteins (DEP) between poorest responders (Q1) and best responders (Q4). Proteins with adjusted p-values (Benjamini-Hochberg (FDR) method) < 0.05 were considered differentially expressed. To filter the common proteins from Cohort 2 and 3, Venn diagram was utilized. For the enrichment analysis for Gene Ontology Molecular Function (GOMF) plot from Cohort 2, we represented the top statistically significantly expressed proteins. Proteins with adjusted p-values < 0.05 were considered differentially expressed. This analysis was done using the R package clusterProfiler (version no. 4.4.4) (28), and ggplot2 (version no. 3.3.6) (29) for visualization. The code for the enrichment analysis can be found in Supplementary Table S3E. To investigate the relationship of each of these proteins with survival we used data from Cohort 2.
The ROC curve was produced using IBM SPSS statistics package (26.0 version) software (30), with a significant threshold of P < 0.05.
For the Kaplan-Meier survival analyses, we considered six proteins from the survival data of Cohort 2. These analyses were conducted for overall survival intervals (measured in years) and the calculations were based on models generated by the optimal cut-off value of each protein (Supplementary Tables S2B–D, Supplementary Figure S2). The KM curves were created using ‘ggsurvival’ and ‘ggsurvminer’ R packages. Additionally, Cox regression analysis was performed using ‘survival’ and ‘survminer’ R packages with p-values < 0.05 considered significant. To assess the goodness of fit for the Cox regression, we calculated the Log-Likelihood ratio and Harrell’s C-statistic for the six selected proteins. The analysis was performed using GraphPad Prism 10 (version 10.11(323)) (31) (Supplementary Table S2C). Furthermore, the ROC analysis was conducted using SPSS 25 software (SPSS Inc, Chicago, IL, USA) (32) (Supplementary Table S2B, D, Supplementary Material 3). For the Kaplan-Meier survival analyses of the validation cohort we performed analysis for overall-survival, progression free-survival and disease-free survival, measured in years (Supplementary Figure S3). Patients in the Liu et al. (24) dataset were categorized based on gene expression levels, with the top 10%, 20%, and 30% compared to the bottom 10%, 20%, and 30% for survival analysis. Multiple cutoffs were employed to mitigate selection bias (refer to Supplementary Table S2E). In the Van Allan dataset (9), due to fewer samples, comparisons were made between the top 25% and 50% versus the bottom 25% and 50%. Significance was determined using the log-rank test.
For the validation cohort, Kaplan-Meier survival analysis and figures including showing p-values, quartile values, mean values and 95% confidence intervals were produced was produced using Graphpad Prism 8 (26) (Supplementary Figure S3).
From the KM analysis, we extracted p-values based on Log-rank, Breslow, and Tarone-Ware tests. Proteins with a p-value < 0.05 in at least one of the three tests were considered significantly related to survival (Supplementary Tables S2B–S2D).
3 Results
3.1 Selection of the immune checkpoint predictor proteins from cohort 1 and the potential immune therapy response based on protein expression levels in cohort 2 and 3
The three cohorts of metastatic malignant melanoma patients included in this study served multiple purposes: (a) the selection of potential immune-response-associated proteins (Cohort 1), (b) the identification and analysis of these proteins in treatment-naive cohorts (Cohort 2 and 3), (c) the exploration of their relationship with patient survival, and (d) their validation in independent cohorts treated with immunotherapy. The top candidates were further corroborated using transcriptomic data obtained from tumor samples in a cohort of patients that were administered either PD1 inhibitor (24) or CTLA4 inhibitor therapies (9). Tumor samples from Cohort 1-3 were included in the first human melanoma proteome atlas study. Detailed information concerning these cohorts and the data analysis workflow (Figure 1).
A total of 401 proteins were initially identified from Cohort 1 as potential immune-response-associated proteins. Within this metastatic cohort, 22 patients had undergone immunotherapy with varying degrees of treatment outcomes. Proteomic analyses conducted on samples from Cohort 1 (14) revealed that these 401 proteins were significantly correlated with progression-free survival, as evidenced by multiple Cox regression analyses (*p-value < 0.05), thereby positioning them as potential predictors of immunotherapy efficacy.
In order to expand the implications of these findings to Cohorts 2 and 3, we initially assess the utility of these proteins as potential indicators of immunotherapy response within these treatment-naive cohorts.
Considering that the samples from these cohorts were treatment-naïve at the time of evaluation, a non-conventional approach was employed to estimate the potential immunotherapy response in patients from Cohorts 2 and 3. Utilizing the EaSIeR scoring system (ITR scoring), we first estimated the ITR of 142 samples from 119 patients in Cohort 2. A statistically significant correlation (Pearson correlation test, *p-value < 0.0001, r = 0.7) (Supplementary Figure S1, Supplementary Table S2A) was observed between transcriptomics and proteomics data across these samples, enabling us to estimate the ITR of patients from Cohort 2 and 3 based proteomics data. After computing the estimated immunotherapy response score, based on protein expression profiles in samples from both Cohort 2 and 3, we further examined if the previously identified 401 proteins could be associated with the immunotherapy response scores in these independent, non-treated cohorts (Cohort 2 and 3).
3.2 Significant proteins associated with ITR
After performing a Pearson correlation between the abundance profiles of each of the 401 previously identified proteins and the immunotherapy response scores in patients from Cohort 2, we found 48 proteins that exhibit significant correlation (*p-value < 0.05). Within this subset, 20 proteins were positively correlated with ITR (Pearson correlation coefficient (r), r (0.684) > 0), while 28 were negatively correlated (Pearson correlation coefficient (r), r (-0.485) < 0). A similar analysis performed on data from Cohort 3 resulted in eight proteins with significant correlation (*p-value < 0.05), two of them were negatively correlated with ITR, and six were positively correlated. To see the proteins that exhibited significant upregulation and downregulation, they were displayed at the single-cell level, based on the expression of RNA representing the production of these proteins in melanocytes. (Figure 2, Supplementary Tables S1, S2A, S3D, E).
Based on this analysis, we opted to prioritize six proteins (ITGAX, SAMSN1, CD163, TNFAIP2, MTSS2, PSMB5) as they emerged as the foremost candidates by virtue of their significant correlation to immunotherapy response in both Cohorts 2 and 3.
3.3 Impact of the six proteins on ITR prediction
To determine the influence of the six identified proteins on ITR prediction within the two distinct cohorts (Cohort 2 and 3), we categorized the ITR into quartiles (Q1-Q4). The magnitude of the difference between the upper Q4 and lower Q1 quartiles served as a proxy for the protein’s predictive power in distinguishing the responsiveness to therapy. In our analysis, all six proteins demonstrated significant differences between Q1 and Q4 (Student T test, *p-value < 0.05) (depicted in Figure 3A, Supplementary Table S2A). Specifically, ITGAX, SAMSN1, TNFAIP2, and CD163 proteins were upregulated and associated with higher scores in potential responders. Conversely, MTSS2 and PSMB5 showed lower scores and were downregulated in the same group. As expected, these findings are in concordance with the trends observed in the previous Pearson correlation analysis (Supplementary Tables S2A, B).
3.4 Association between the selected six proteins and survival
3.4.1 Kaplan-Meier univariate analysis
We analyzed the impact of these proteins on overall survival. The survival information was obtained from 127 patients of Cohort 2. The Kaplan-Meier curves unveiled that different levels of ITGAX, SAMSN1, and TNFAIP2 proteins were significantly associated with 2-year survival (depicted in Figure 3B) (Cox regression, *p-value < 0.05). On the other hand, proteins CD163, PSMB5, and MTSS2 did not significantly associate with 2-year survival (Supplementary Figure S2, Supplementary Tables S2B–D).
3.4.2 Independent survival prognostic values of the selected six proteins
Furthermore, we delved into the prognostic survival values of these proteins in relation to other clinical parameters (e.g., age at diagnosis, gender, tumor content (%), and disease stage) within Cohort 2. Cox-regression models were created based on the clinical parameters (Cox model 1: associations with survival, Cox model 2: associations with Cox model 1 plus age at diagnosis, gender, and tumor content (%), Cox model 3: associations with Cox model 2 plus disease stage) and the independence of the identified proteins was analyzed from the clinical parameters. Interestingly, distinct outcomes emerged from the Cox regression survival analyses (Cox models 1, 2, and 3). ITGAX, SAMSN1, and TNFAIP2 were significant favorable predictors of survival from Cox model 1 (Cox regression, *p-value <0.05). Involving other clinical parameters such as age at diagnosis, gender, and tumor content (%) in Cox survival analysis model 2, ITGAX,SAMSN1, TNFAIP2 and CD163 showed significant values. Three proteins (TNFAIP2, SAMSN1, CD163) for the third Cox survival analysis model represented significant independence from the clinical parameters, meaning that these proteins may be survival predictors regardless of clinical parameters such as gender, age at diagnosis, tumor content (%) or disease stage. Furthermore, we performed the Goodness-of fit for Cox estimation for all the three models. In the results, SAMSN1, TNFAIP2 showed significant results in model 1 and model 2, additionally in model 1 ITGAX represented significant fitting results as well. In model 3, all the 6 proteins showed significance (Supplementary Table S2C). To support our data, we compared our results with the survival data from TCGA database. Based on the comparison, SAMSN1, CD163, TNFAIP2 and ITGAX showed significant upregulation in parallel with survival, in contrast PSMB5 displayed significant downregulation in association with the survival (Supplementary Table S2A). Notably, when considering the investigated clinical parameters in our results, SAMSN1 and TNFAIP2 proteins appeared as the most independent survival predictors (Table 1, Supplementary Tables S2B–D).
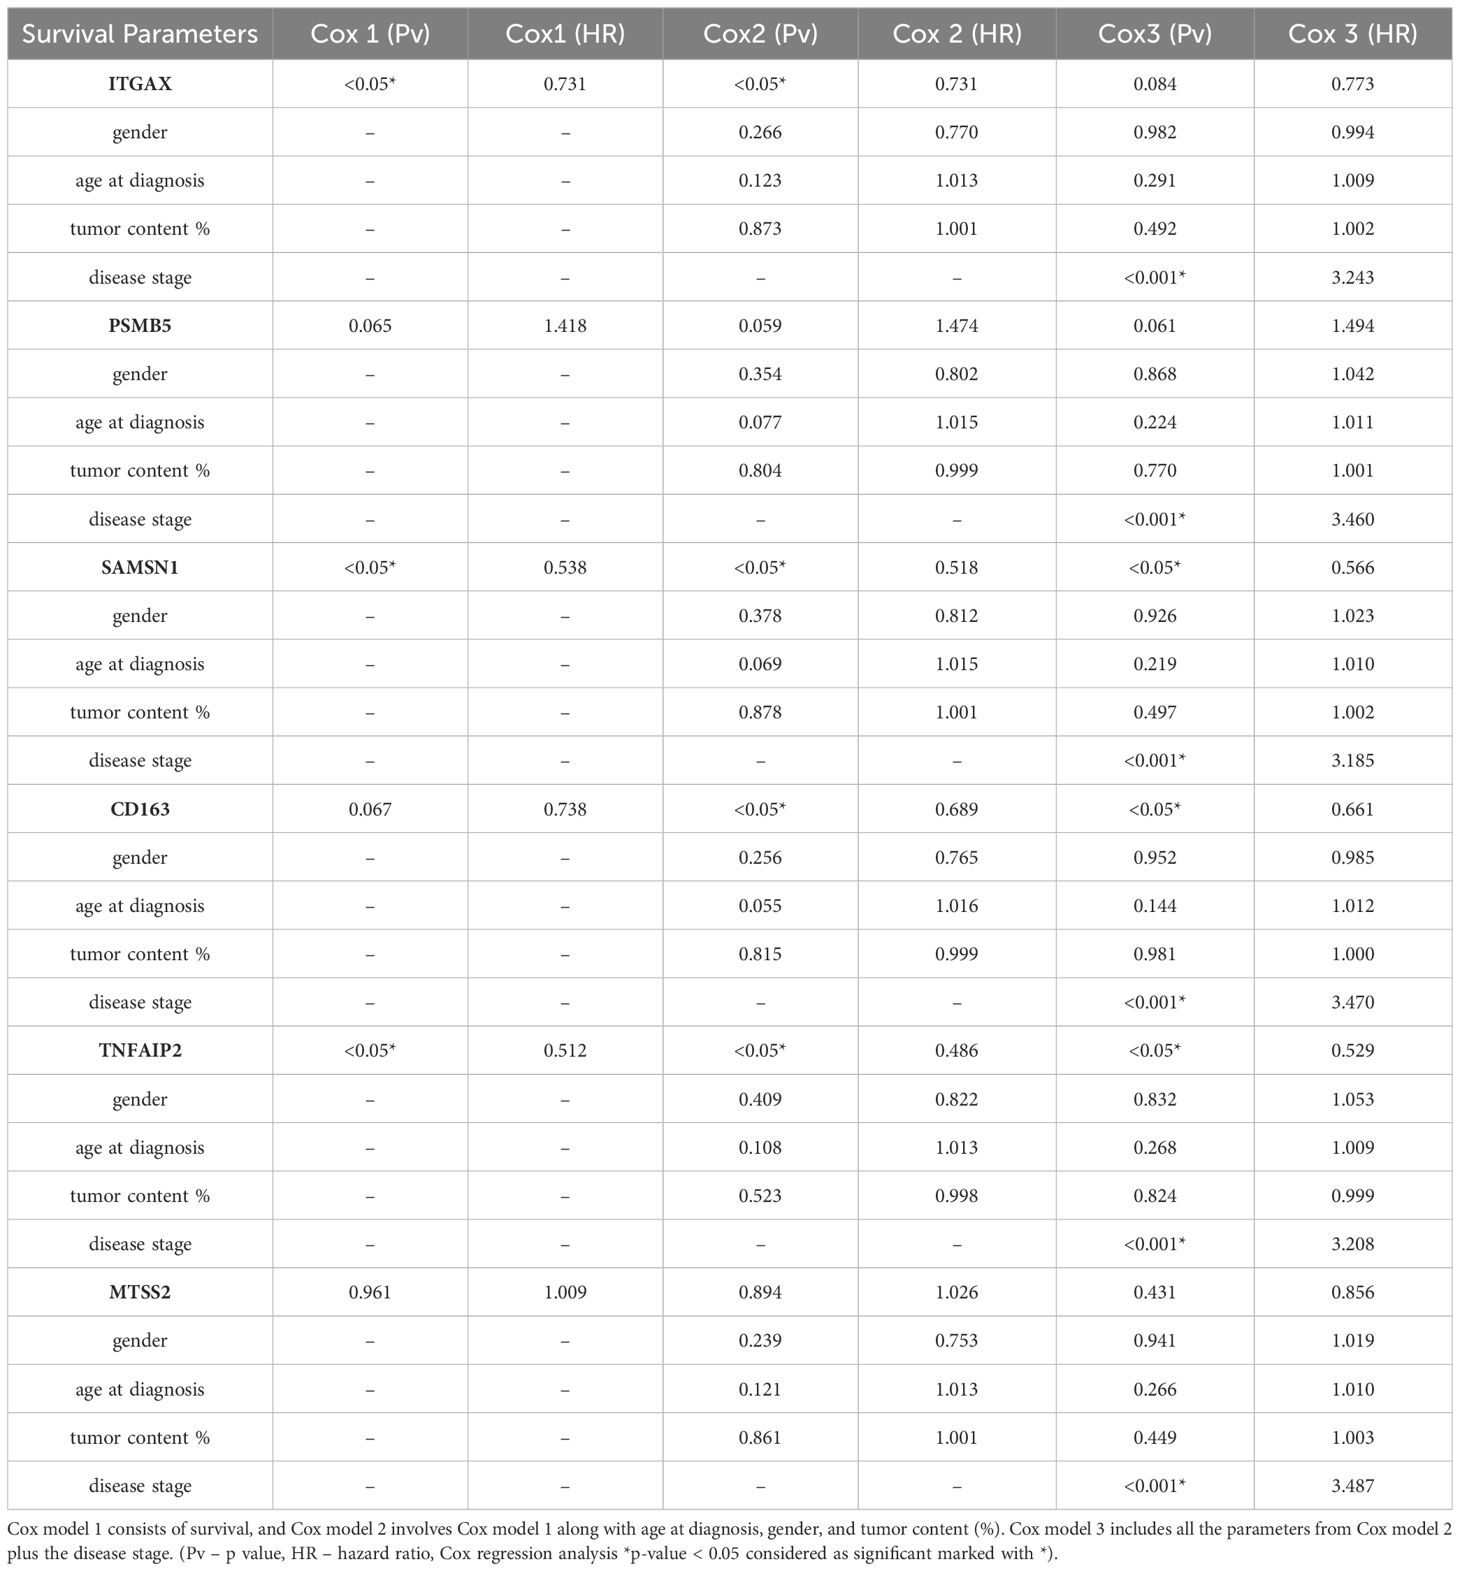
Table 1 The identified proteins with their corresponding genes, accompanied by the outcomes of Cox regression survival analysis.
3.5 Validation of the identified proteins using transcriptomic data from patient cohorts undergoing immunotherapy
We selected the top 6 proteins that displayed a significant association with survival above and investigated whether the transcript levels of the genes encoding these proteins could predict the prognosis of patients receiving PD1 inhibitor (24) or CTLA4 inhibitor therapies (9). Among the 6 genes investigated, 5 demonstrated a significant prognostic association (summary of all genes in all datasets tested displayed in Supplementary Table S2E). Expression of CD163, ITGAX and TNFAIP2 were associated with better PFS and OS in response to PD1 inhibitor therapies (Log rank test, *p-value <0.05). ITGAX and TNFAIP2 were associated to both PD1 inhibitor and CTLA4 inhibitor therapies, whereas high expression of PSMB5 was linked to poorer PFS following PD1 inhibition (Figure 4, Supplementary Figure S3, Supplementary Table S2E). SAMSN1 gene exhibited a weak association with overall survival in the PD1 inhibitor therapy dataset, whereas MTSS1L did not demonstrate a connection with either progression-free or overall survival in the two datasets tested. These results collectively support our earlier findings that expression of CD163, ITGAX, TNFAIP2 and SAMSN1 may be linked to positive responses to immune-based therapies, whereas PSMB5 expression may correspond to resistance against such therapies.
3.6 Biological function of the identified biomarkers
We investigated the molecular functions of the initial set of 48 proteins that displayed association with immunotherapy response in Cohort 2. Based on the Gene Ontology Molecular Function (GOMF) enrichment analysis, we observed that ITGAX as well as ICAM2, and VWF were linked to integrin binding. PSMB5 was found to be involved in the threonine-type endopeptidase activity, while TNFAIP2 and VAMP8 were implicated in SNARE binding, implying cell communication across membranes and exocytosis (33) (This is summarized in Figure 5 and detailed in Supplementary Tables S2F, S3E). Furthermore, utilizing the mRNA expression values (nTPM) at single cell level as published in The Human Protein Atlas (34), we determined that ITGAX, TNFAIP2, SAMSN1, and PSMB5 exhibit high mRNA levels in melanocytes. Conversely, the mRNA expression of CD163 and MTSS2 in melanocytes is absent, implying that the source of these proteins could be from other cells in the microenvironment (for more detailed information, please refer to Supplementary Tables S2F, S3E).
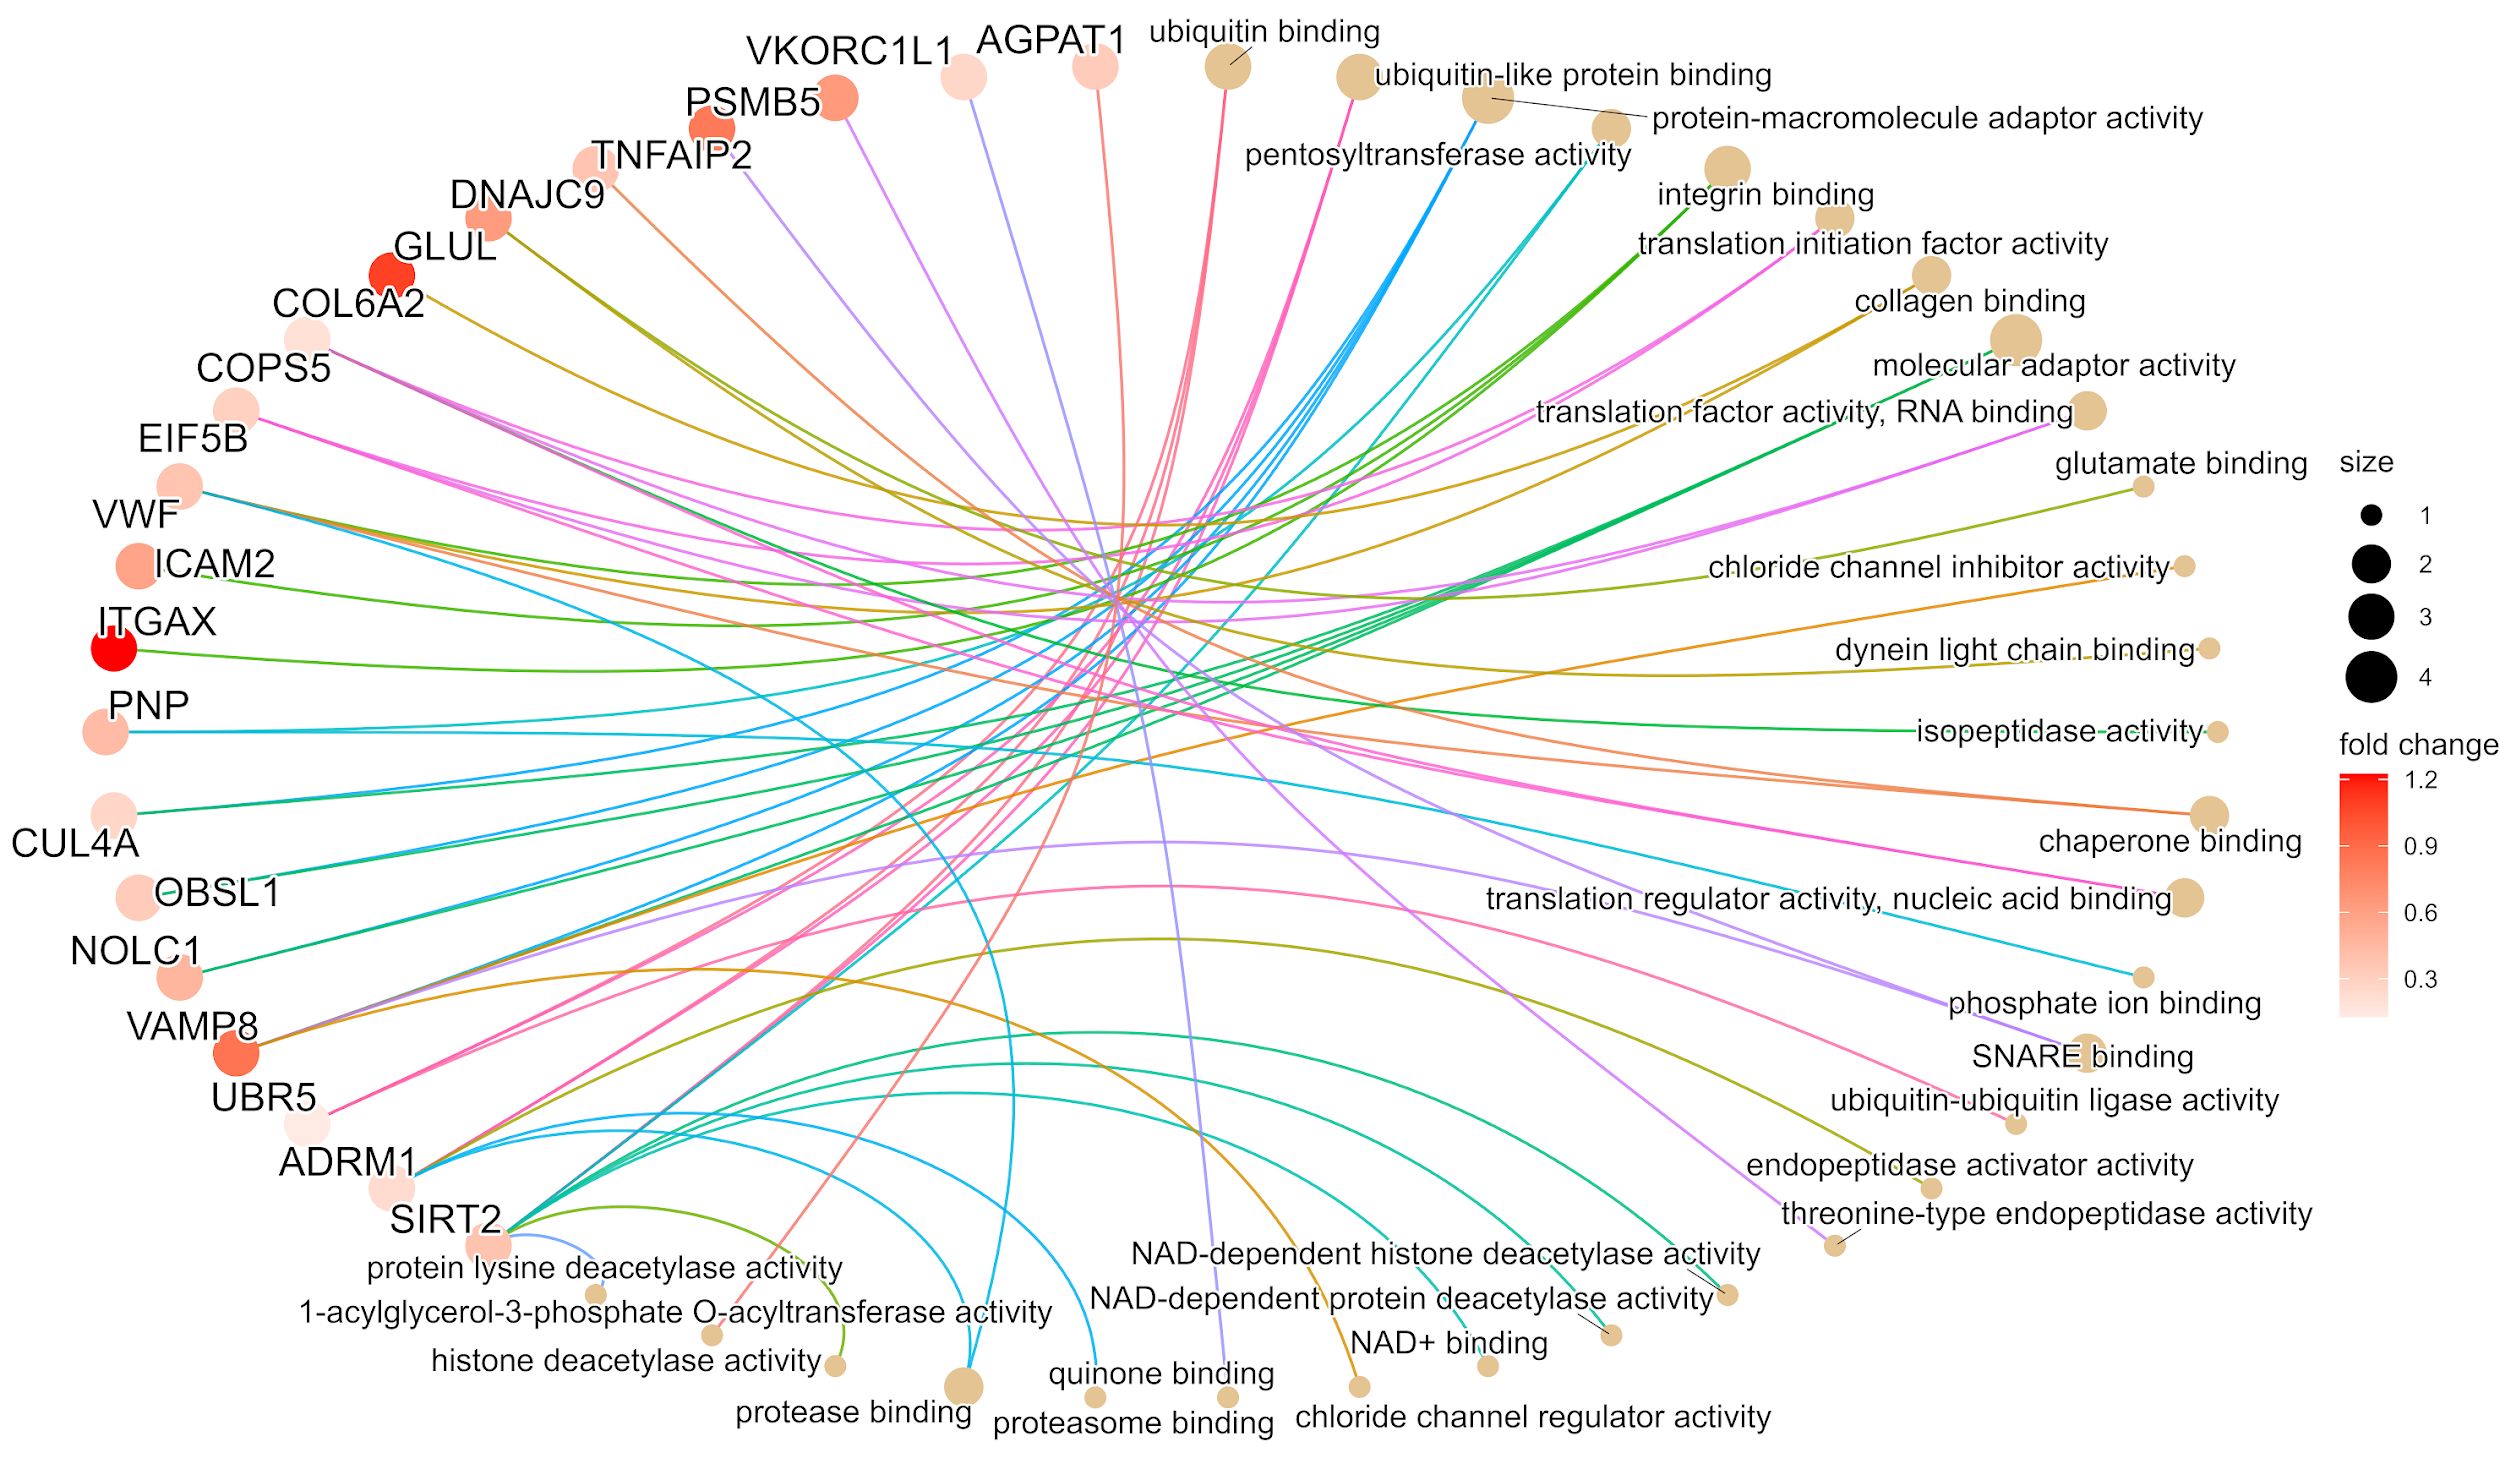
Figure 5 The gene ontology molecular function (GOMF) plot of the top 20 proteins from cohort 2 based on the enrichment analysis. The image illustrates the most relevant molecular pathways connected to the first selected 48 proteins. In the case of pathways, the size of circles indicates the number of proteins involved in the functions. The proteins are presented in colors based on the magnitude of fold change.
4 Discussion
Identifying suitable biomarkers to predict immunotherapy response presents a significant challenge within melanoma research and clinical practice. Currently, in the case of advanced melanoma patients, molecular-level assessment of the BRAF mutation status guides the selection of kinase inhibitors. However, the efficacy of targeted therapy remains uncertain owing to intricate mechanisms of resistance (35). Additionally, the expression of PD-L and PD-L1 proteins can exert an impact on the response within the tumor microenvironment (TME) enhancing the ability of immune cells to counteract undesirable signals originating from melanoma cells (36).
Although PD-L1, and PD-1-based immunotherapies currently serve as first-line treatments for advanced metastatic melanomas, the emergence of resistance remains a prevalent concern (35). Other approaches, such as digital imaging, have been explored for assessing PD-1/PD-L1 expression within melanoma tumor samples, aiding in identifying suitable therapy composition and timing (37). Moreover, factors such as PD-1/PD-L1 expression, tumor stage, driver mutation status, and metastatic extent can offer valuable insights into the prognosis (37).
Due to the complexity of molecular pathways influencing melanoma progression, therapy response, and resistance, identifying a solitary protein biomarker that mirrors these events is challenging. In our study, we leveraged a previously published dataset, the Human Melanoma Proteome Atlas project study (19, 20), which offers proteomic and clinical insights from 263 primary and metastatic melanoma samples. Amidst the diverse patient cohorts in theHuman Melanoma Proteome Atlas study (19, 20), we narrowed our focus to individuals who received immunotherapy and exhibited a treatment response. To manage the extensive array of proteins within the immunotherapy patient pools, we employed a machine learning tool to predict the Immune-Therapy Response (ITR) (18). The scoring system incorporates all information on cell compartments from the melanoma samples and gives a score that may help in decision-making regarding therapy response. Through an extensive proteomic analysis conducted across three independent cohorts we identified six candidate proteins. Notably, the protein levels of ITGAX, SAMSN1, MTSS1L, PSMB5, TNFAIP2, and CD163 exhibited a correlation with the predicted ITR. Moreover, CD163, TNFAIP2, and SAMSN1 displayed a robust association with survival outcomes that remained significant independently of key clinical parameters such as gender, age at diagnosis, tumor content (%), and disease stage. Moreover, when delving into published transcriptomic databases containing immunotherapy-related information, we observed a substantial correlation between the expression pattern of the identified proteins and both overall and progression-free survival. In parallel with the TCGA dataset, five (PSMB5, SAMSN1, CD163, TNFAIP2, ITGAX) out of the six identified proteins showed significant association with survival (38).
Furthermore, the six proteins that were identified exhibit association with distinct mechanisms. ITGAX (Uniprot: P20702), also known as CD11c serves as a receptor for fibrinogen and has an important role in cell adhesion mechanisms (39). This function likely extends to the tumor microenvironment (TME), where it participates in cell adhesion modulator (40), and cell-cell interactions during inflammatory responses (41) and is also produced in lower amounts by melanocytes (42). The ITGAX subunits are one of the most widely overexpressed proteins in various cancers (43), rendering them potential targets for antitumor therapies (44). Macrophages and T-cells are enriched with ITGAX. However, there are debated findings regarding integrin subunits in the context of melanoma, they may be related to the pathological stage, disease-free survival and melanoma metastasis. Moreover, a strong correlation has been established between the expression of integrin subunits and immune cell infiltration (45). These observations provide a plausible rationale for the positive role attributed to ITGAX. In our dataset, we observed an upregulation of ITGAX in parallel with better survival and enhanced therapy response. The transcriptomic data further strengthen this notion, as the ITGAX gene exhibited significant overexpression within the long-survival group marked by prolonged PFS and OS in both the PD1 inhibitor and CTLA4 inhibitor datasets. This consistency underscores the robust predictive potential of ITGAX. Further, treatments targeting integrin subunits have been successfully employed against various diseases. Notably, FDA-approved monoclonal antibodies, such as etrolizumab, have been deployed to obstruct CD11a units and ITGB7 (integrin subunit beta 7) in inflammatory diseases such as severe plaque psoriasis, Crohn’s disease or ulcerative colitis, respectively (46, 47). Based on our results, we hypothesize that the role played by ITGAX holds promise in predicting the response to immunotherapy in melanoma.
The SAMSN1 (SAM domain, SH3 domain, and nuclear localization signals 1 (48) Uniprot: Q9NSI8) protein was also identified in patients exhibiting enhanced therapy response and higher survival rates. Interestingly, we observed a substantial upregulation in the expression of SAMSN1 gene related to overall survival in patients who received PD1 inhibitor therapy. SAMSN1 is implicated as a negative regulator in B-cell activation (48). Addition to this notion, Jönsson et al. underscored the association of the CD20-positive B-cell subset with a favorable prognosis for patients diagnosed with metastatic melanoma (49). In addition, Helmank et al. found that responders to neoadjuvant immunotherapy exhibited elevated levels of a predetermined B-cell signature in both baseline and early on-treatment samples (50). Moreover, in vitro studies have demonstrated that SAMSN1 contributes to the downregulation of cell proliferation and is also synthesized by melanocytes (34, 51). As a tumor suppressor gene, the decreased expression of SAMSN1 was found in several cancers (52). Additionally, low SAMSN1 protein production in hepatocellular carcinoma and gastric cancer was associated with decreased overall survival and expanded tumor size (52–54). Thus, our results are in line with recent publications advocating that the levels of SAMSN1 protein can be associated with better immunotherapy response.
The TNFAIP2 (TNF alpha-induced protein 2, Uniprot: Q03169) was identified in our study as a predictor of better therapy response and was also upregulated in melanoma patients in correlation with long survival both in proteomic and in PD1 and CTLA4 immunotherapy transcriptomic cohorts. TNFAIP2 protein is known as an important player in inflammation, angiogenesis, proliferation, and migration and it is a cancer-related gene (55, 56). The TNF alpha-induced protein 2 is produced mostly by lymphocytes, macrophages, mast cells in inflammation, and melanocytes (55, 57). The TNFAIP2 expression can exhibit variation across different cancer types. For instance, in a recent publication, there was a comparison of normal and tumor tissue for mRNA variants of TNFAIP2 among all the cancers in the TCGA database. Lin Jia et al. discovered that TNFAIP2 mRNAs were upregulated in renal clear cell carcinoma, while in skin cutaneous melanoma, a contrasting pattern emerged where TNFAIP2 mRNAs were downregulated (55). Furthermore, a Kaplan-Meier survival analysis revealed that high TNFAP2 mRNA expression correlated with extended survival (55), aligning with the outcome observed in our study at the proteomic level.
The PSMB5 or proteasome 20S subunit beta 5 (Uniprot: P28074), demonstrated a correlation with decreased expression alongside improved survival and a positive response to immunotherapy. At the transcriptomic level, a significantly decreased gene expression was observed during progression-free survival in the PD1 immunotherapy dataset. The functional role of PSMB5 is intricate, primarily revolving around proteolytic functions, including degrading ubiquitinated proteins in the cell. Moreover, PSMB5 is produced by melanocytes, further accentuating its relevance in the context of melanoma (58, 59). FDA-approved anti-proteasome agents like Bortezomib are used to treat multiple myeloma and mantle cell lymphoma in which the proteasome activity is high and associated with oncogenic functions (60). Wei et al. also demonstrated in triple-negative breast cancer that PSMB5 is an indicator of poor prognosis and the silencing of the PSMB5 gene can increase the sensitivity of breast cancer cells to chemotherapy and subsequently to apoptosis (61). Moreover, Harel et al. found similar results in PSMB5 downregulation in responders of melanoma patients with advanced stage (62). Our results are in strong agreement with existing literature, suggesting that decreased PSMB5 protein expression might serve as a marker for enhanced prognosis in melanoma immunotherapy response.
Lastly, CD163 is an acute phase-regulated receptor involved in protecting tissues from free hemoglobin-mediated oxidative damage (63) (Uniprot: Q86VB7), and MTSS2 (MTSS I-BAR domain containing 2, Uniprot: Q765P7) is related to tumor metastasis and cancer progression via interactions with the actin cytoskeleton, and belongs to the MTSS family (64). Notably, both identified proteins seem not to be produced by melanocytes (65, 66). Our findings showed an upregulation of CD163 associated with improved immunotherapy response and improved survival. Moreover, the gene expression of CD163 was significantly upregulated in the long-survival group (prolonged progression-free and overall survival) in the PD1 and CTLA4 immunotherapy transcriptomic cohorts. Contrary to our data, a recent publication presented that CD163+ tumor-associated macrophages in melanoma were positively correlated with deeper Breslow level, advanced stage of the disease, and shorter overall survival (67). Interestingly, in 2018, a previous report showed that soluble CD163 expression in serum was significantly increased in advanced cutaneous melanoma patients who were responders to the nivolumab immunotherapy (68).
In addition to these results, we were able to analyze CD163 protein expression in the tumor tissue, which was correlated with immunotherapy information. This added another layer to our understanding of proteins with predictive values in immunotherapy response.
Furthermore, MTSS2, was found to be significantly downregulated in patients with better therapy response. However, we have not seen a significant correlation between the expression of MTSS2 and survival in immunotherapy cohorts with transcriptomic data. MTSS2, previously named MTSS1L (69) is expressed in the central nervous system (CNS) (70) and is part of the MTSS protein family (71). Despite this, we have limited information about the role of the MTSS2 protein in melanoma progression or therapy response, Hubert et al. suggested that the MTSS2 gene might play a role in cancer susceptibility (72).
MTSS2 belongs to the subgroup of I-BAR (Bin/amphiphysin/Rvs) domain-containing proteins (73) similar to MTSS1. Notably, MTSS1 has a closer association with melanoma progression where it plays a pivotal role in driving melanocyte metastasis, and elevated MTSS1 expression identifies a subgroup within primary melanomas associated with adverse prognosis (74) (Figure 6).
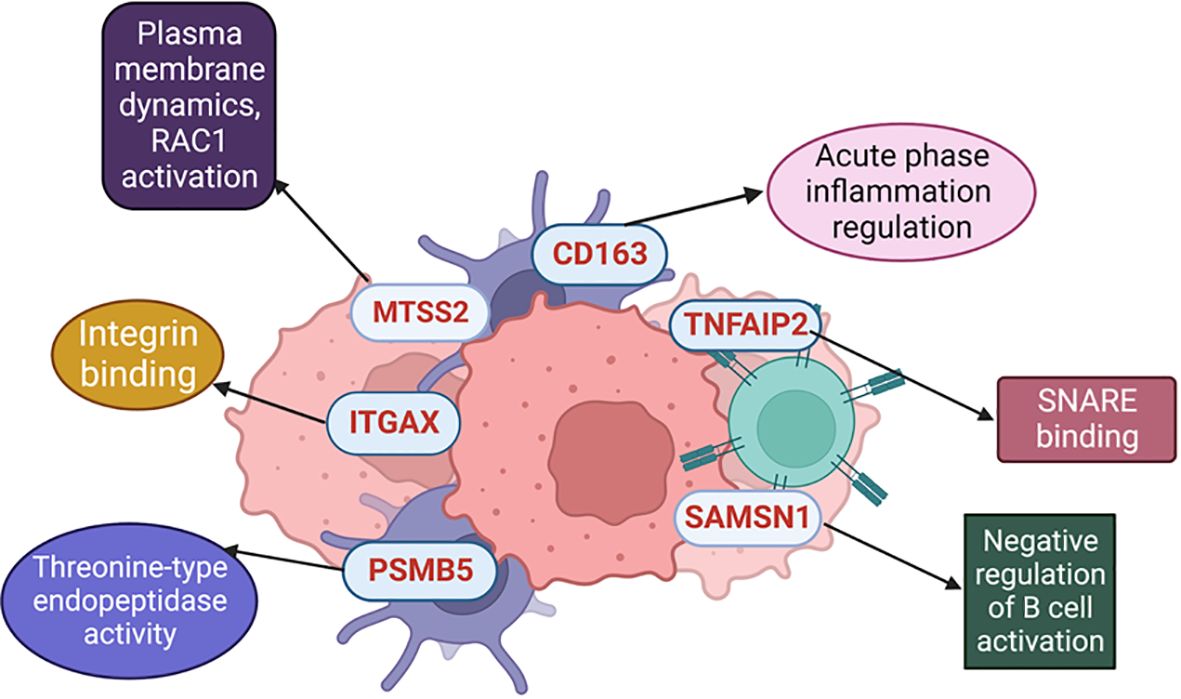
Figure 6 Different molecular mechanisms where the selected proteins are involved.
Moreover, it is noteworthy to mention that among the 6 identified proteins in our findings, two were associated with immune mechanisms (SAMSN1 and CD163), while another two played roles in functions in the tumor microenvironment (TNFAIP2 and ITGAX).). Additionally, exploring the use of these identified proteins in adjuvant immunotherapy settings would be more informative. However, there is limited literature in this era, CD163, as a macrophage marker (63), ITGAX, as a dendritic cell marker (39), and SAMSN1, which is a negative regulator in B cell activation (48), could serve as ideal targets to study even for adjuvant immunotherapy response.
Furthermore, utilizing the identified biomarkers through histopathology is one of the most effective approaches to translate our findings to clinical practice. Since antibodies are available for immunohistochemistry staining of SAMSN1, ITGAX (as CD11c), and CD163, this method could obtain information to predict responders and non-responders before initiating therapy. Nonetheless, further investigations are needed in this area.
In conclusion, we highlight for the first time an analysis of one of the largest proteomic datasets in melanoma, searching for predictors which may be associated with immunotherapy response. Through a comprehensive analysis of more than 200 samples from both treated and untreated patients, ranked by a well-defined scoring system, we have identified six candidate proteins.
These six identified proteins as potential biomarkers have been studied across three different metastatic patient cohorts. They exhibit significant correlations with immunotherapy response when evaluated through modelling, as well as independent associations irrespective of other clinical parameters. Moreover, we were able to validate the indicated proteins in various immunotherapy transcriptomic datasets.The necessity for well-defined biomarkers capable of predicting immunotherapy response as well as survival, and disease progression has reached a critical juncture in the realm of melanoma patient care. Our findings showed functional relationships that some of these biomarkers have with the stroma (e.g., ITGAX, PSMB5, TNFAIP2, and MTSS2). Others exhibit stronger connections with immune cells (e.g., CD163, SAMSN1). These proteins hold the promise for sparkling further investigations and may serve as foundation for advancing diagnostics, guiding tailored therapy decisions, aiding in personalized decisions, and ultimately enhancing the life expectancy of metastatic melanoma patients.
5 Limitations
We acknowledge that our study has certain limitations. For instance, there is no available data on the treatments applied in the two untreated cohorts (Cohort 2 and Cohort 3). Additionally, there is a difference among the sample sizes of the indicated cohorts, with some having fewer than 100 patients and others having more than 100 patients. To test these proteins in independent cohorts (e.g., IHC cohorts) with a larger number of patients, and to translate the utilization of these proteins to clinical practice is one of our main future aims.
Data availability statement
All original code is available in Supplemental Material 3 and Table S3E. The scripts used for the statistics are available at https://github.com/indirapla/MM500_ImmuneResponse Github repository (75). The data that support the findings of this study are openly available in ProteomeXchange (76) at https://www.proteomexchange.org/, reference numbers PXD001725, PXD001724, PXD009630, PXD017968, and PXD026086. The TCGA data was downloaded from cBioPortal https://www.cbioportal.org (77). The code for Cohort 2 and 3 can be found at https://github.com/rhong3/TCGA_melanoma (75).
Ethics statement
Cohort 1 was conducted according to the guidelines of the Declarations of Helsinki and approved by the Hungarian Ministry of Human Resources, Deputy State Secretary for National Chief Medical Officer, Department of Health Administration. The protocol code is MEL-PROTEO-001, the approval number is 4463-6/2018/EÜIG and the date of approval is 12 March 2018. Due to the retrospective anonymized FFPE samples, informed consent was not applicable, referring to the MEL-PROTEO-001, 4463-6/2018/EÜIG ethical approval. Cohort 2 was approved by the Regional Ethical Committee at Lund University, Southern Sweden (DNR 191/2007, 101/2013 (BioMEL biobank), 2015/266 and 2015/618). All patients provided written informed consent. The study has been performed in compliance with GDPR. Cohort 3 was carried out in strict accordance with the Declarations of Helsinki and was approved by the Semmelweis University Regional and Institutional Committee of Science and Research Ethics (IRB, SE TUKEB 114/2012 and SE IKEB 191-4/2014). Samples were obtained from the Department of Dermatology and Venereology, Semmelweis University, Budapest, Hungary, under informed consent and a clinical protocol.
Author contributions
LS: Conceptualization, Data curation, Formal analysis, Methodology, Project administration, Validation, Visualization, Writing – original draft. AB: Conceptualization, Formal analysis, Methodology, Software, Validation, Visualization, Writing – original draft, Writing – review & editing. IP: Conceptualization, Formal analysis, Methodology, Software, Validation, Writing – original draft, Writing – review & editing. AL: Formal analysis, Methodology, Writing – review & editing. DP: Formal analysis, Methodology, Writing – review & editing. ASL: Formal analysis, Methodology, Writing – review & editing. NA: Investigation, Writing – review & editing. ÁJ: Writing – review & editing. FN: Writing – review & editing. BS: Formal analysis, Writing – review & editing. VD: Writing – review & editing. NW: Writing – review & editing. JGu: Visualization, Writing – review & editing. ZU: Writing – review & editing. ZP: Writing – review & editing. TP: Writing – review & editing. YK: Writing – review & editing. BG: Writing – review & editing. BB: Writing – review & editing. CW: Writing – review & editing. AMS: Writing – review & editing. LB: Investigation, Writing – review & editing. JGi: Data curation, Investigation, Writing – review & editing. RA: Project administration, Writing – review & editing. HJK: Writing – review & editing. SK: Writing – review & editing. MK: Investigation, Writing – review & editing. JRM: Investigation, Writing – review & editing. IN: Writing – review & editing. JM: Writing – review & editing. DF: Supervision, Writing – original draft, Writing – review & editing. KP: Supervision, Writing – original draft, Writing – review & editing. PH: Supervision, Writing – review & editing. EW: Supervision, Writing – original draft, Writing – review & editing. LK: Conceptualization, Data curation, Formal analysis, Methodology, Supervision, Validation, Writing – original draft, Writing – review & editing. GD: Conceptualization, Methodology, Supervision, Writing – original draft, Writing – review & editing. GM-V: Funding acquisition, Resources, Supervision, Writing – original draft, Writing – review & editing. AS: Conceptualization, Data curation, Formal analysis, Investigation, Methodology, Software, Supervision, Validation, Writing – original draft, Writing – review & editing.
Funding
The author(s) declare financial support was received for the research, authorship, and/or publication of this article. This study was supported by grants from the Berta Kamprad Foundation, Lund, Sweden. The generous support by Thermo Scientific, Liconic UK, and Tecan was absolutely key for this study. This work was done under the auspices of a Memorandum of Understanding between the European Cancer Moonshot Center in Lund and the U.S. National Cancer Institute’s International Cancer Proteogenome Consortium (ICPC). ICPC encourages international cooperation among institutions and nations in proteogenomic cancer research in which proteogenomic datasets are made available to the public. This work was also done in collaboration with the U.S. National Cancer Institute’s Clinical Proteomic Tumor Analysis Consortium (CPTAC). Further support came from the National Cancer Institute (NCI) CPTAC grants U24CA210972 to DF. LVK is a recipient of the János Bolyai Research Scholarship of the Hungarian Academy of Sciences and is supported by the Hungarian National Research, Development and Innovation Office (OTKA FK138696) and Semmelweis University STIA-KFI2021 grants. The project has received funding from the EU’s Horizon 2020 research and innovation program under grant agreement no. 739593. IBN was supported by the Hungarian Academy of Sciences, the grant of OTKA-125509. LS was supported by the ÚNKP-21-3-SZTE-102 New National Excellence Program of the Ministry for Innovation and Technology from the source of the National Research, Development and Innovation Fund (University of Szeged, Szeged, Hungary). GD was funded by grants (CNPq 440613/2016-7; 308241/2019-8) and FAPERJ (E-26/210.173/2 and E-26/201.052/2021) under the Memorandum of Understanding between the Federal University of Rio de Janeiro, Brazil, and Lund University, Sweden. SK is acknowledging the support of the Hungarian National Research, Development and Innovation Office (OTKA) support (N-OTKA 114-460). This research was funded by the National Research, Development and Innovation Office under NKFI-FK 13208 grant (T.P.). The project received funding from the EU's Horizon 2020 Research and Innovation Program with grant agreement No. 739593 (T.P.). Project no. TKP-2021-EGA-05 has been implemented with the support provided by the Ministry of Culture and Innovation of Hungary from the National Research, Development and Innovation Fund, financed under the TKP2021-EGA funding scheme (T.P.). Project no. 2022-2.1.1-NL-2022-00005 has been implemented with the support provided by the Ministry of Culture and Innovation of Hungary from the National Research, Development and Innovation Fund, financed under the 2022-2.1.1-NL funding scheme (T.P.). The project was also funded by the Hungarian Academy of Sciences under the project number POST-COVID2021-36. Thermo Scientific, Liconic UK and Tecan were not involved in the study design, collection, analysis, interpretation of data, the writing of this article, or the decision to submit it for publication. This work was also supported by grants from the the government of the Republic of Korea (MSIP; 2021R1A3B1077371).
Acknowledgments
The authors used ChatGPT 3.5/OpenAI (78) in order to improve language and readability during the preparation of this work. After employing this tool, the authors reviewed and edited the content as needed, and take full responsibility for the final version of the publication.
Conflict of interest
The authors declare that the research was conducted in the absence of any commercial or financial relationships that could be construed as a potential conflict of interest.
Publisher’s note
All claims expressed in this article are solely those of the authors and do not necessarily represent those of their affiliated organizations, or those of the publisher, the editors and the reviewers. Any product that may be evaluated in this article, or claim that may be made by its manufacturer, is not guaranteed or endorsed by the publisher.
Supplementary material
The Supplementary Material for this article can be found online at: https://www.frontiersin.org/articles/10.3389/fonc.2024.1428182/full#supplementary-material
References
1. Keung EZ, Gershenwald JE. The eighth edition American Joint Committee on Cancer (AJCC) melanoma staging system: implications for melanoma treatment and care. Expert Rev Anticancer Ther. (2018) 18:775–84. doi: 10.1080/14737140.2018.1489246
2. Chapman PB, Hauschild A, Robert C, Haanen JB, Ascierto P, Larkin J, et al. Improved survival with vemurafenib in melanoma with BRAF V600E mutation. N Engl J Med. (2011) 364:2507–16. doi: 10.1056/NEJMoa1103782
3. Hodi FS, O’Day SJ, McDermott DF, Weber RW, Sosman JA, Haanen JB, et al. Improved survival with ipilimumab in patients with metastatic melanoma. N Engl J Med. (2010) 363:711–23. doi: 10.1056/NEJMoa1003466
4. Johnson DB, Estrada MV, Salgado R, Sanchez V, Doxie DB, Opalenik SR, et al. Melanoma-specific MHC-II expression represents a tumour-autonomous phenotype and predicts response to anti-PD-1/PD-L1 therapy. Nat Commun. (2016) 7:10582. doi: 10.1038/ncomms10582
5. Lauss M, Donia M, Harbst K, Andersen R, Mitra S, Rosengren F, et al. Mutational and putative neoantigen load predict clinical benefit of adoptive T cell therapy in melanoma. Nat Commun. (2017) 8:1738. doi: 10.1038/s41467-017-01460-0
6. Riaz N, Havel JJ, Makarov V, Desrichard A, Urba WJ, Sims JS, et al. Tumor and microenvironment evolution during immunotherapy with nivolumab. Cell. (2017) 171:934–949.e16. doi: 10.1016/j.cell.2017.09.028
7. Yarchoan M, Albacker LA, Hopkins AC, Montesion M, Murugesan K, Vithayathil TT, et al. PD-L1 expression and tumor mutational burden are independent biomarkers in most cancers. JCI Insight. (2019) 4:e126908. doi: 10.1172/jci.insight.126908
8. Morrison C, Pabla S, Conroy JM, Nesline MK, Glenn ST, Dressman D, et al. Predicting response to checkpoint inhibitors in melanoma beyond PD-L1 and mutational burden. J Immunother Cancer. (2018) 6:32. doi: 10.1186/s40425-018-0344-8
9. Van Allen EM, Miao D, Schilling B, Shukla SA, Blank C, Zimmer L, et al. Genomic correlates of response to CTLA-4 blockade in metastatic melanoma. Science. (2015) 350:207–11. doi: 10.1126/science.aad0095
10. Fairfax BP, Taylor CA, Watson RA, Nassiri I, Danielli S, Fang H, et al. Peripheral CD8+ T cell characteristics associated with durable responses to immune checkpoint blockade in patients with metastatic melanoma. Nat Med. (2020) 26:193–9. doi: 10.1038/s41591-019-0734-6
11. Morrison SL, Han G, Elenwa F, Vetto JT, Fowler G, Leong SP, et al. Is the presence of tumor-infiltrating lymphocytes predictive of outcomes in patients with melanoma? Cancer. (2022) 128:1418–28. doi: 10.1002/cncr.34013
12. Antohe M, Nedelcu RI, Nichita L, Popp CG, Cioplea M, Brinzea A, et al. Tumor infiltrating lymphocytes: The regulator of melanoma evolution. Oncol Lett. (2019) 17:4155–61. doi: 10.3892/ol
13. Liu D, Yang X, Wu X. Tumor immune microenvironment characterization identifies prognosis and immunotherapy-related gene signatures in melanoma. Front Immunol. (2021) 12:663495. doi: 10.3389/fimmu.2021.663495
14. Szadai L, Velasquez E, Szeitz B, de Almeida NP, Domont G, Betancourt LH, et al. Deep proteomic analysis on biobanked paraffine-archived melanoma with prognostic/predictive biomarker read-out. Cancers (Basel). (2021) 13:6105. doi: 10.3390/cancers13236105
15. Byrne EH, Fisher DE. Immune and molecular correlates in melanoma treated with immune checkpoint blockade. Cancer. (2017) 123:2143–53. doi: 10.1002/cncr.30444
16. Garutti M, Bonin S, Buriolla S, Bertoli E, Pizzichetta MA, Zalaudek I, et al. Find the flame: predictive biomarkers for immunotherapy in melanoma. Cancers. (2021) 13:1819. doi: 10.3390/cancers13081819
17. Blank CU, Haanen JB, Ribas A, Schumacher TN. The “cancer immunogram. Science. (2016) 352:658–60. doi: 10.1126/science.aaf2834
18. Lapuente-Santana Ó, van Genderen M, Hilbers PAJ, Finotello F, Eduati F. Interpretable systems biomarkers predict response to immune-checkpoint inhibitors. Patterns (N Y). (2021) 2:100293. doi: 10.1016/j.patter.2021.100293
19. Betancourt LH, Gil J, Sanchez A, Doma V, Kuras M, Murillo JR, et al. The Human Melanoma Proteome Atlas-Complementing the melanoma transcriptome. Clin Transl Med. (2021) 11:e451. doi: 10.1002/ctm2.451
20. Betancourt LH, Gil J, Kim Y, Doma V, Çakır U, Sanchez A, et al. The human melanoma proteome atlas-Defining the molecular pathology. Clin Transl Med. (2021) 11:e473. doi: 10.1002/ctm2.473
21. Kuras M, Betancourt LH, Hong R, Szadai L, Rodriguez J, Horvatovich P, et al. Histopathology-assisted proteogenomics provides foundations for stratification of melanoma metastases. bioRxiv. (2023) 09.29.559755. doi: 10.1101/2023.09.29.559755
22. Cirenajwis H, Ekedahl H, Lauss M, Harbst K, Carneiro A, Enoksson J, et al. Molecular stratification of metastatic melanoma using gene expression profiling : Prediction of survival outcome and benefit from molecular targeted therapy. Oncotarget. (2015) 6:12297–309. doi: 10.18632/oncotarget.v6i14
23. Clough E, Barrett T. The Gene Expression Omnibus Database. In: Mathé E, Davis S, editors. Statistical Genomics, vol. 1418 . Springer New York, New York, NY (2016). p. 93–110. Methods in Molecular Biology. doi: 10.1007/978-1-4939-3578-9_5
24. Liu D, Schilling B, Liu D, Sucker A, Livingstone E, Jerby-Arnon L, et al. Integrative molecular and clinical modeling of clinical outcomes to PD1 blockade in patients with metastatic melanoma. Nat Med. (2019) 25:1916–27. doi: 10.1038/s41591-019-0654-5
25. Biorender (2024). Available online at: https://biorender.com/.
28. Wu T, Hu E, Xu S, Chen M, Guo P, Dai Z, et al. clusterProfiler 4.0: A universal enrichment tool for interpreting omics data. Innovation (Camb). (2021) 2:100141. doi: 10.1016/j.xinn.2021.100141
29. Wickham H. ggplot2 Elegant Graphics for Data Analysis. New York: Springer-Verlag (2016). doi: 10.1007/978-3-319-24277-4
31. GraphPad Prism 10 (version 10.1.1). (2023) San Diego, California, USA: GraphPad Software. Available at: https://www.graphpad.com/updates/prism-10-1-1-release-notes.
33. Han J, Pluhackova K, Böckmann RA. The multifaceted role of SNARE proteins in membrane fusion. Front Physiol. (2017) 8:5. doi: 10.3389/fphys.2017.00005
34. The Human Protein Atlas - The single cell type section (2023). Available online at: https://www.proteinatlas.org/humanproteome/single+cell+type.
35. Garbe C, Amaral T, Peris K, Hauschild A, Arenberger P, Bastholt L, et al. European consensus-based interdisciplinary guideline for melanoma. Part 2: Treatment - Update 2019. Eur J Cancer. (2020) 126:159–77. doi: 10.1016/j.ejca.2019.11.015
36. Song WM, Agrawal P, Von Itter R, Fontanals-Cirera B, Wang M, Zhou X, et al. Network models of primary melanoma microenvironments identify key melanoma regulators underlying prognosis. Nat Commun. (2021) 12:1214. doi: 10.1038/s41467-021-21457-0
37. Koelzer VH, Gisler A, Hanhart JC, Griss J, Wagner SN, Willi N, et al. Digital image analysis improves precision of PD-L1 scoring in cutaneous melanoma. Histopathology. (2018) 73:397–406. doi: 10.1111/his.13528
38. Anaya J. OncoLnc: linking TCGA survival data to mRNAs, miRNAs, and lncRNAs. PeerJ Comput Sci. (2016) 2:e67. doi: 10.7717/peerj-cs.67
39. The Human Protein Atlas - ITGAX (2023). Available online at: https://www.proteinatlas.org/ENSG00000140678-ITGAX.
40. Cell Adhesion Receptors as Drug Targets (2023). Available online at: https://www.sinobiological.com/research/receptors/cell-adhesion-receptors-drug-target.
41. Uniprot - ITGAX (2023). Available online at: https://www.uniprot.org/uniprotkb/P20702/entry.
42. The Human Protein Atlas - ITGAX - Single Cell Type (2023). Available online at: https://www.proteinatlas.org/ENSG00000140678-ITGAX/single+cell+type/skin.
43. Arun AS, Tepper CG, Lam KS. Identification of integrin drug targets for 17 solid tumor types. Oncotarget. (2018) 9:30146–62. doi: 10.18632/oncotarget.v9i53
44. Niu G, Chen X. Why integrin as a primary target for imaging and therapy. Theranostics. (2011) 1:30–47. doi: 10.7150/thno/v01p0030
45. Nurzat Y, Su W, Min P, Li K, Xu H, Zhang Y. Identification of therapeutic targets and prognostic biomarkers among integrin subunits in the skin cutaneous melanoma microenvironment. Front Oncol. (2021) 11:751875. doi: 10.3389/fonc.2021.751875
46. Drugbank online - Efalizumab (2023). Available online at: https://go.drugbank.com/drugs/DB00095.
47. Drugbank online - Etrolizumab (2023). Available online at: https://go.drugbank.com/drugs/DB12189.
48. The Human Protein Atlas – SAMSN1 (2023). Available online at: https://www.proteinatlas.org/ENSG00000155307-SAMSN1.
49. Becht E, Giraldo NA, Lacroix L, Buttard B, Elarouci N, Petitprez F, et al. Estimating the population abundance of tissue-infiltrating immune and stromal cell populations using gene expression. Genome Biol. (2016) 17:218. doi: 10.1186/s13059-016-1070-5
50. Lauss M, Donia M, Svane IM, Jönsson G. B cells and tertiary lymphoid structures: friends or foes in cancer immunotherapy? Clin Cancer Res. (2022) 28:1751–8. doi: 10.1158/1078-0432.CCR-21-1130
51. The Human Protein Atlas – SAMSN1 – Single Cell Type (2023). Available online at: https://www.proteinatlas.org/ENSG00000155307-SAMSN1/single+cell+type/skin.
52. Sueoka S, Kanda M, Sugimoto H, Shimizu D, Nomoto S, Oya H, et al. Suppression of SAMSN1 expression is associated with the Malignant phenotype of hepatocellular carcinoma. Ann Surg Oncol. (2015) 22 Suppl 3:S1453–1460. doi: 10.1245/s10434-015-4524-1
53. Friend NL, Hewett DR, Panagopoulos V, Noll JE, Vandyke K, Mrozik KM, et al. Characterization of the role of Samsn1 loss in multiple myeloma development. FASEB Bioadv. (2020) 2:554–72. doi: 10.1096/fba.2020-00027
54. Kanda M, Shimizu D, Sueoka S, Nomoto S, Oya H, Takami H, et al. Prognostic relevance of SAMSN1 expression in gastric cancer. Oncol Lett. (2016) 12:4708–16. doi: 10.3892/ol.2016.5233
55. Jia L, Shi Y, Wen Y, Li W, Feng J, Chen C. The roles of TNFAIP2 in cancers and infectious diseases. J Cell Mol Med. (2018) 22:5188–95. doi: 10.1111/jcmm.13822
56. The Human Protein Atlas – TNFAIP2 (2023). Available online at: https://www.proteinatlas.org/ENSG00000185215-TNFAIP2/.
57. The Human Protein Atlas – TNFAIP2 – Single Cell Type (2023). Available online at: https://www.proteinatlas.org/ENSG00000185215-TNFAIP2/single+cell+type/skin.
58. The Human Protein Atlas – PSMB5 (2023). Available online at: https://www.proteinatlas.org/ENSG00000100804-PSMB5/.
59. The Human Protein Atlas – PSMB5 – Single Cell Type (2023). Available online at: https://www.proteinatlas.org/ENSG00000100804-PSMB5/single+cell+type/skin.
60. Dou QP, Zonder JA. Overview of proteasome inhibitor-based anti-cancer therapies: perspective on bortezomib and second generation proteasome inhibitors versus future generation inhibitors of ubiquitin-proteasome system. Curr Cancer Drug Targets. (2014) 14:517–36. doi: 10.2174/1568009614666140804154511
61. Wei W, Zou Y, Jiang Q, Zhou Z, Ding H, Yan L, et al. PSMB5 is associated with proliferation and drug resistance in triple-negative breast cancer. Int J Biol Mark. (2018) 33:102–8. doi: 10.5301/ijbm.5000283
62. Harel M, Ortenberg R, Varanasi SK, Mangalhara KC, Mardamshina M, Markovits E, et al. Proteomics of melanoma response to immunotherapy reveals mitochondrial dependence. Cell. (2019) 179:236–250.e18. doi: 10.1016/j.cell.2019.08.012
63. The Human Protein Atlas – CD163 (2023). Available online at: https://www.proteinatlas.org/ENSG00000177575-CD163/.
64. Harminozome 3.0 - MTSS1_HUMAN Protein (2023). Available online at: https://maayanlab.cloud/Harmonizome/protein/MTSS1_HUMAN.
65. The Human Protein Atlas – CD163 – Single Cell Type (2023). Available online at: https://www.proteinatlas.org/ENSG00000177575-CD163/single+cell+type/skin.
66. The Human Protein Atlas – MTSS2 – Single Cell Type (2023). Available online at: https://www.proteinatlas.org/ENSG00000132613-MTSS2/single+cell+type/skin.
67. Salmi S, Siiskonen H, Sironen R, Tyynelä-Korhonen K, Hirschovits-Gerz B, Valkonen M, et al. The number and localization of CD68+ and CD163+ macrophages in different stages of cutaneous melanoma. Melanoma Res. (2019) 29:237–47. doi: 10.1097/CMR.0000000000000522
68. Fujimura T, Sato Y, Tanita K, Kambayashi Y, Otsuka A, Fujisawa Y, et al. Serum level of soluble CD163 may be a predictive marker of the effectiveness of nivolumab in patients with advanced cutaneous melanoma. Front Oncol. (2018) 8:530. doi: 10.3389/fonc.2018.00530
69. Undiagnosed Disease Network – MTSS2 (2023). Available online at: https://undiagnosed.hms.harvard.edu/genes/mtss2/.
70. Huang Y, Lemire G, Briere LC, Liu F, Wessels MW, Wang X, et al. The recurrent de novo c.2011C>T missense variant in MTSS2 causes syndromic intellectual disability. Am J Hum Genet. (2022) 109:1923–31. doi: 10.1016/j.ajhg.2022.08.011
71. Uniprot – MTSS2 (2023). Available online at: https://www.uniprot.org/uniprotkb/Q765P7/entry#family_and_domains.
72. Hubert JN, Suybeng V, Vallée M, Delhomme TM, Maubec E, Boland A, et al. The PI3K/mTOR pathway is targeted by rare germline variants in patients with both melanoma and renal cell carcinoma. Cancers (Basel). (2021) 13:2243. doi: 10.3390/cancers13092243
73. InterPro Classification of protein families - I-BAR domain containing protein MTSS1/MTSS2 (2023). Available online at: https://www.ebi.ac.uk/interpro/entry/InterPro/IPR030127/.
74. Mertz KD, Pathria G, Wagner C, Saarikangas J, Sboner A, Romanov J, et al. MTSS1 is a metastasis driver in a subset of human melanomas. Nat Commun. (2014) 5:3465. doi: 10.1038/ncomms4465
75. Github Repository. San Francisco, California, the US: GitHub, Inc (2024). Available at: https://github.com/indirapla/MM500https://github.com/rhong3/TCGA_melanoma_ImmuneResponse.
76. ProteomeXchange Repository . Available online at: http://www.proteomexchange.org/.
77. cBioPortal For Cancer Genomics Repository v6.0.5 . Available online at: https://www.cbioportal.org/.
78. ChatGPT3.5 . Available online at: https://chat.openai.com/?model=text-davinci-002-render-sha.
Keywords: metastatic melanoma, immunotherapy, immunotherapy response, responders, non-responders, proteomics
Citation: Szadai L, Bartha A, Parada IP, Lakatos AIT, Pál DMP, Lengyel AS, de Almeida NP, Jánosi ÁJ, Nogueira F, Szeitz B, Doma V, Woldmar N, Guedes J, Ujfaludi Z, Pahi ZG, Pankotai T, Kim Y, Győrffy B, Baldetorp B, Welinder C, Szasz AM, Betancourt L, Gil J, Appelqvist R, Kwon HJ, Kárpáti S, Kuras M, Murillo JR, Németh IB, Malm J, Fenyö D, Pawłowski K, Horvatovich P, Wieslander E, Kemény LV, Domont G, Marko-Varga G and Sanchez A (2024) Predicting immune checkpoint therapy response in three independent metastatic melanoma cohorts. Front. Oncol. 14:1428182. doi: 10.3389/fonc.2024.1428182
Received: 05 May 2024; Accepted: 10 June 2024;
Published: 02 July 2024.
Edited by:
Giuseppe Palmieri, University of Sassari, ItalyReviewed by:
Serena Bonin, University of Trieste, ItalyYanlin Yu, National Institutes of Health (NIH), United States
Copyright © 2024 Szadai, Bartha, Parada, Lakatos, Pál, Lengyel, de Almeida, Jánosi, Nogueira, Szeitz, Doma, Woldmar, Guedes, Ujfaludi, Pahi, Pankotai, Kim, Győrffy, Baldetorp, Welinder, Szasz, Betancourt, Gil, Appelqvist, Kwon, Kárpáti, Kuras, Murillo, Németh, Malm, Fenyö, Pawłowski, Horvatovich, Wieslander, Kemény, Domont, Marko-Varga and Sanchez. This is an open-access article distributed under the terms of the Creative Commons Attribution License (CC BY). The use, distribution or reproduction in other forums is permitted, provided the original author(s) and the copyright owner(s) are credited and that the original publication in this journal is cited, in accordance with accepted academic practice. No use, distribution or reproduction is permitted which does not comply with these terms.
*Correspondence: Leticia Szadai, bGV0aWNpYS5zemFkYWlAZ21haWwuY29t; c3phZGFpLmxldGljaWFAbWVkLnUtszeged.hu
†These authors have contributed equally to this work and share last authorship