 Rihui Zhang1
 Haiming Zhu1
 Minbin Chen2Weiwei Sang1Ke Lu3
 Zhen Li4
 Chunhao Wang3
 Lei Zhang1
 Fang-Fang Yin1
 Zhenyu Yang1*
- 1Medical Physics Graduate Program, Duke Kunshan University, Kunshan, Jiangsu, China
- 2Department of Radiotherapy & Oncology, The First People’s Hospital of Kunshan, Kunshan, Jiangsu, China
- 3Deparment of Radiation Oncology, Duke University, Durham, NC, United States
- 4Radiation Oncology Department, Shanghai Sixth People’s Hospital, Shanghai, China
Introduction: Radiation therapy (RT) is one of the primary treatment options for early-stage non-small cell lung cancer (ES-NSCLC). Therefore, accurately predicting the overall survival (OS) rate following radiotherapy is crucial for implementing personalized treatment strategies. This work aims to develop a dual-radiomics (DR) model to (1) predict 3-year OS in ES-NSCLC patients receiving RT using pre-treatment CT images, and (2) provide explanations between feature importanceand model prediction performance.
Methods: The publicly available TCIA Lung1 dataset with 132 ES-NSCLC patients received RT were studied: 89/43 patients in the under/over 3-year OS group. For each patient, two types of radiomic features were examined: 56 handcrafted radiomic features (HRFs) extracted within gross tumor volume, and 512 image deep features (IDFs) extracted using a pre-trained U-Net encoder. They were combined as inputs to an explainable boosting machine (EBM) model for OS prediction. The EBM’s mean absolute scores for HRFs and IDFs were used as feature importance explanations. To evaluate identified feature importance, the DR model was compared with EBM using either (1) key or (2) non-key feature type only. Comparison studies with other models, including supporting vector machine (SVM) and random forest (RF), were also included. The performance was evaluated by the area under the receiver operating characteristic curve (AUCROC), accuracy, sensitivity, and specificity with a 100-fold Monte Carlo cross-validation.
Results: The DR model showed highestperformance in predicting 3-year OS (AUCROC=0.81 ± 0.04), and EBM scores suggested that IDFs showed significantly greater importance (normalized mean score=0.0019) than HRFs (score=0.0008). The comparison studies showed that EBM with key feature type (IDFs-only demonstrated comparable AUCROC results (0.81 ± 0.04), while EBM with non-key feature type (HRFs-only) showed limited AUCROC (0.64 ± 0.10). The results suggested that feature importance score identified by EBM is highly correlated with OS prediction performance. Both SVM and RF models were unable to explain key feature type while showing limited overall AUCROC=0.66 ± 0.07 and 0.77 ± 0.06, respectively. Accuracy, sensitivity, and specificity showed a similar trend.
Discussion: In conclusion, a DR model was successfully developed to predict ES-NSCLC OS based on pre-treatment CT images. The results suggested that the feature importance from DR model is highly correlated to the model prediction power.
Introduction
Lung cancer is the leading cause of cancer death worldwide (1, 2). Non-small cell lung cancer (NSCLC) is the most common type, accounting for 80% of all lung cancers (3). Early-stage NSCLC (ES-NSCLC) refers to stages I and II of the disease (4), and over one-fifth of NSCLC cases were detected at ES-NSCLC (5). Surgery is the current standard-of-care treatment strategy for ES-NSCLC (3, 6, 7), while only approximately 70% of ES-NSCLC patients receive surgical treatment (8, 9). The remaining patients opt out of surgery due to medical or technical inoperability or personal preferences (10, 11). Radiation therapy (RT) has emerged as a standard noninvasive alternative to surgical resection (10). RT has been showing promising results in treating ES-NSCLC with high safety and efficiency (11). Nonetheless, the reported 3-year overall survival (OS) rate following RT varies widely, typically ranging from 39% ± 10% (12–14). Therefore, accurate OS prediction is thus crucial for personalizing medical treatment and informing decisions for optimizing therapeutic strategies.
Medical image-based OS prediction has been recently intensively studied and shown promising accuracy (15–17). Techniques such as radiomics and deep learning analyze image data to identify patterns that may be associated with underlying physiological and pathological conditions. Radiomic analysis, in particular, is a widely used non-invasive imaging quantification method (18). Typically, radiomics first determines the volume-of-interest (VOI), e.g., tumor in OS prediction tasks, and extracts the features that are defined based on experts’ domain knowledge to quantitatively capture the intensity, shape, size or volume, and texture information of VOIs, namely handcrafted radiomic features (HRFs) (17, 19). The extracted HRFs can be considered as the potential biomarkers that reflect patient underlying pathophysiology, and the classic machine learning classifiers can be employed to establish the correlations between OS and HRFs (20, 21). Several pilot studies have shown that the radiomic analysis based on the pre-treatment CT has the potential to accurately predict OS in ES-NSCLC following RT treatment (22, 23). Deep learning is a new approach for image quantification and characterization (24). Deep learning networks, which consist of multi-layer feed-forward neural networks, can be trained end-to-end in a supervised manner using medical images paired with observed OS data (19, 25). Through hierarchical progressive operations on the images, deep learning networks learn the high-level abstractions that capture the intrinsic representation of the image linking the input image to the outcome (26). These hidden high-level abstractions can also be explicitly derived from the trained deep learning models as the image deep features (IDFs) (26, 27). Deep learning methods have successfully demonstrated their effectiveness in OS prediction in ES-NSCLC following RT treatment (28, 29).
As HRFs are manually defined to capture specific characteristics within VOIs (17, 19), and IDFs are learned automatically from image data to discover complex patterns that may not be easily defined manually (19, 25), the combination of HRFs and IDFs has been recently investigated as a popular research direction (25, 30). Combining HRFs and IDFs can leverage the strengths of both approaches and has been shown to enhance the overall predictive accuracy and robustness of models (19, 31–33). As different image feature sources can be combined and fed into the model, the explanation and identification of key features are thus crucial for explaining the OS prediction mechanisms, optimizing feature extraction, and potentially improving model performance (34, 35). However, few studies have focused on evaluating the importance of each radiomic feature source and quantitatively explaining their contributions to the final prediction performance. The ML models producing state-of-the-art results possess a black-box nature; they use non-linear and nested fashion to process data, making them challenging to explain straightforwardly to humans (36). Although several explainability techniques have been proposed, including Local Interpretable Model-agnostic Explanations (LIME) (37), and Shapley Additive exPlanations (SHAP) (38), these explainability techniques each exhibit distinct limitations (39). For instance, LIME-generated explanations may be highly sensitive to minor variations in input data, potentially leading to inconsistent and unreliable explanations for the instance (39–41). SHAP has a high computational complexity, often requiring the use of various approximations of Shapley values, which may result in misleading explanations (38, 42). Recently, explainable boosting machine (EBM) has emerged as a promising alternative. EBM is designed to train on a single feature at a time in a round-robin fashion using a low learning rate (43, 44). As such, the effect of co-linearity between features can be mitigated, and the optimal feature function can be learned independently for each feature. Therefore, EBM maintains comparable prediction accuracy to state-of-the-art ML models while providing transparency in its decision-making process (43, 45).
This work developed a dual-radiomics (DR) model based on EBM to (1) predict 3-year OS in ES-NSCLC patients undergoing RT using pre-treatment CT images, and (2) provide explanations to the relationship between feature importance and prediction performance. In this work, 1) the handcrafted radiomic features (HRFs) extracted from gross tumor volume (GTV) and 2) image deep features (IDFs) extracted by a pre-trained Convolutional Neural Network (CNN) model were combined, and a novel EBM classifier was adopted for OS prediction as well as direct feature importance explanation.
Materials and methods
Imaging data
This work resorted to 132 RT patients with ES-NSCLC from the publicly available The Cancer Imaging Archive Lung1 (TCIA Lung1) dataset (46).
All patients underwent an FDG PET-CT scan for RT treatment planning. A spiral CT covering the entire thoracic region was acquired for each patient, with a resolution of 0.97 (mm) × 0.97 (mm) × 3 (mm, slice thickness). The GTV delineations for all patients were performed by experienced radiation oncologists on fused PET-CT images. The standard clinical delineation protocol with fixed window level settings of both CT (lung W1700; L-300, mediastinum W600; L40) and PET scan (W30000; L15000) was used for delineation (46). Figure 1 displays a representative CT slice for several patients, each with the GTV delineations superimposed on it. All pre-treatment CT images and corresponding GTV masks were resampled to 1 × 1 × 1 mm3 isotropic voxel size for the following radiomic analysis and modelling. Based on the survival outcome (46), 89 and 43 patients were identified as under and over the 3-year OS group, respectively. All methods concerning the acquisition and usage of this dataset were in accordance with relevant guidelines and regulations.
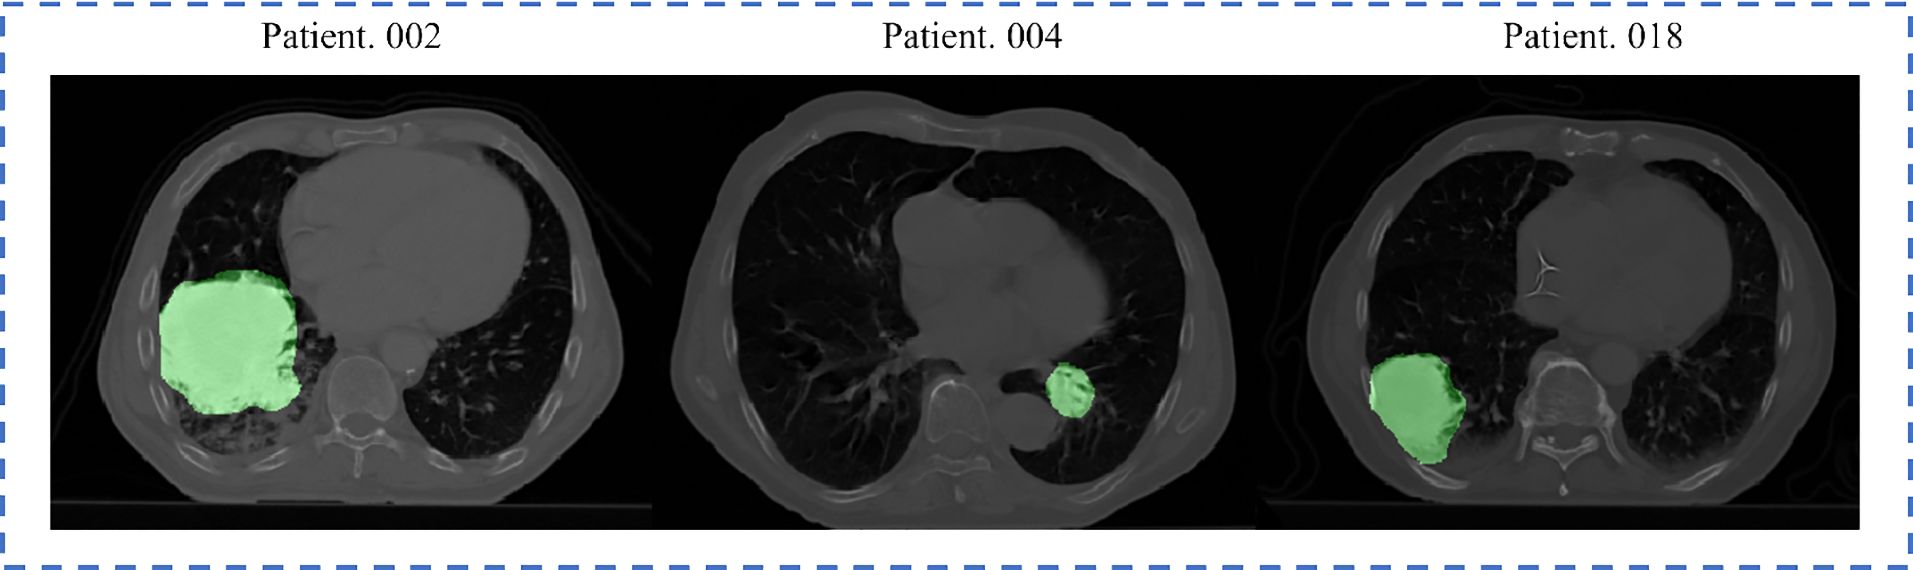
Figure 1. Representative slices from three Lung1 patients, with delineated GTV overlaid. The brighter areas on the figure represent the GTVs.
DR model design
The overall design of the proposed DR model is shown in Figure 2, which includes three key steps: (1) IDF extraction, (2) HRF extraction, and (3) EBM modelling for OS prediction.
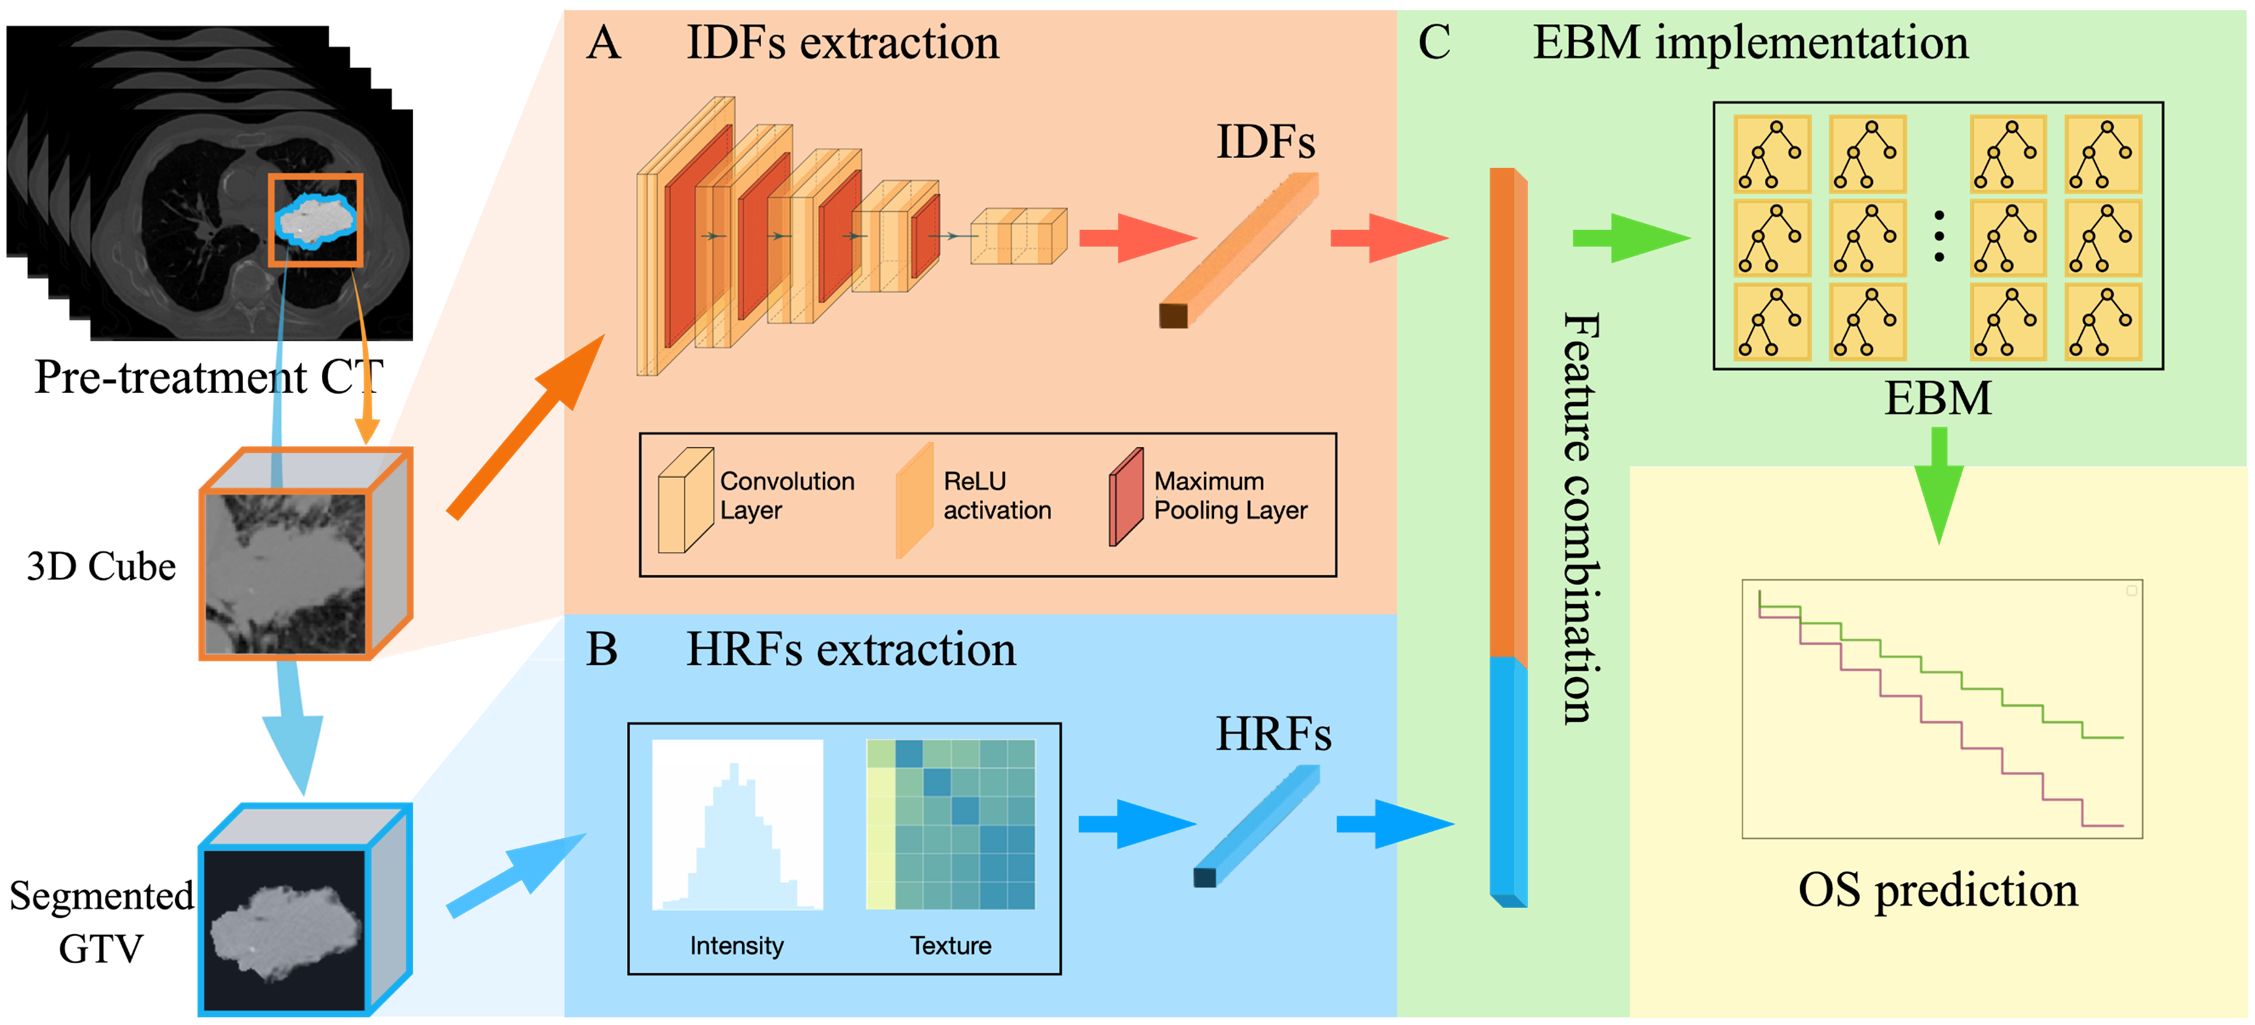
Figure 2. The overall design of the DR model, including three key steps: (A) IDFs extraction workflow using a pre-trained CNN-based encoder; (B) HRFs extraction that extracts 56 radiomic feature from segmented GTV; (C) EBM implementation for OS prediction (i.e., over 3-year OS or under).
IDFs extraction
The workflow for extracting image deep features (IDFs) is illustrated in Figure 2A. The input for this process was a GTV-centered 20×20×20 cm³ cube, which encompassed the GTV and surrounding tissue. Given the intricate and repetitive nature of patient anatomy of medical images, deep learning models are able to autonomously learn generic anatomical representations through self-supervision (30, 47). In this study, a publicly available pre-trained Models Genesis CNN U-Net encoder was employed (30). Models Genesis leverages self-supervised learning techniques to understand and extract anatomical features across multiple medical image datasets and has been reported to achieve state-of-the-art results in various medical image reorganization tasks (30, 48, 49). Specifically, the encoder includes four convolutional blocks, each comprising two convolutional layers followed by a max pooling layer. This architecture reduces the spatial dimension of the input image while increasing the feature information, resulting in a 512-channel deep image feature tensor representation. A global average pooling layer was then employed to average out each feature channel, forming the 512-dimensional feature vector. Therefore, by utilizing the pre-trained weights from Models Genesis to initialize the U-Net encoder, raw images were encoded into 512-dimensional feature vectors as IDFs. In addition, we utilized the CNN U-Net encoder that was trained from scratch to investigate the impact of different IDF extraction methods, i.e., pre-trained encoder vs. encoder trained from scratch. The entire deep feature extraction workflow was implemented in TensorFlow environment version 2.6.0.
HRFs extraction
Figure 2B illustrates the HRF extraction workflow. The 3D GTV volumes were first segmented from the pre-treatment CT images for all patients as the VOI. Compared to the 3D cube used in the IDFs extraction, the segmented GTV volume contains only the GTV itself following standard radiomic processing workflow (26, 50, 51). For each patient, 56 HRFs were extracted to capture the intensity and texture characteristics within the segmented GTV. These HRFs (Table 1) can be categorized into three groups according to their distinct joint density functions: 18 intensity-based features, 22 gray-level co-occurrence matrix (GLCM)-based features, and 16 gray-level run length matrix (GLRLM)-based features. Following the standard radiomic analysis pipeline (26, 50, 51), the intensity-based features were extracted using the raw GTV images; the second-order features (i.e., GLCM-based and GLRLM-based features) were derived from discretized images, which were obtained by employing a fixed bin number (=32) discretization to the resampled GTV images. The radiomic calculation was performed based on our in-house radiomics calculation platform using MATLAB (MATLAB R2022a; MathWorks, Natick, MA) (52). The entire feature extraction workflow has been fully calibrated against the image biomarker standardization initiative (IBSI) (53, 54).
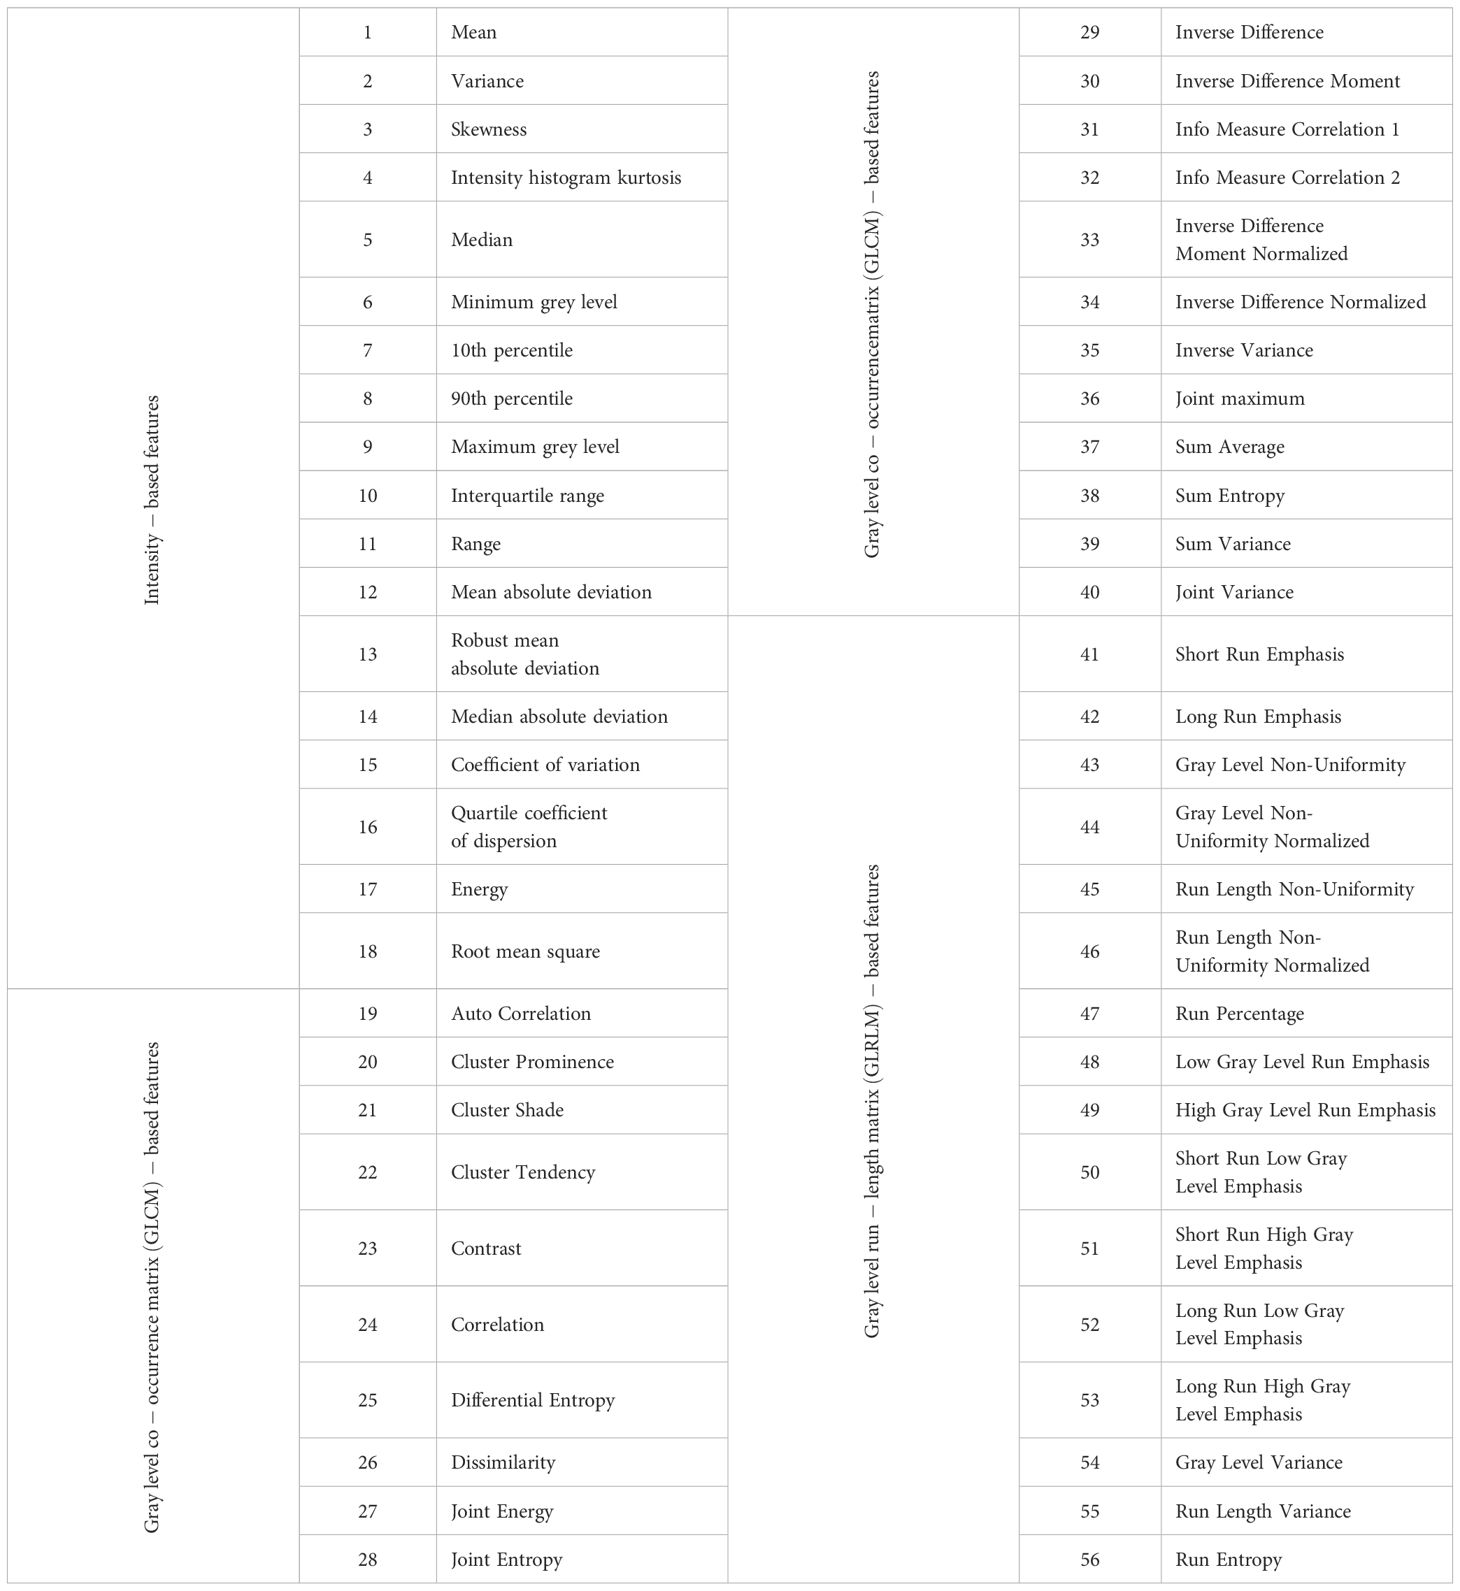
Table 1. Fifty-six radiomic features included in this study.
OS prediction with EBM implementation
Figure 2C summarizes the EBM implementation for OS prediction. For each patient, a 512-dimensional IDF vector was directly concatenated with a 56-dimensional HRF vector, resulting in a single 568-dimensional feature vector. The obtained vector was utilized as the input for an EBM. Specifically, EBM is an inherent explainable model based upon Generalized Additive Models (GAMs) (45), which can be mathematically formed as:
where represents the bias term.
In contrast to linear and multiple linear regression models, GAMs do not assume a linear relationship between predictor features and the response variable . Instead, the prediction of involves learning an intercept along with functions that describe the non-linear relationship between the and each predictor feature . The coefficients in a multiple linear regression model are replaced with learned functions that are not restricted to linear relationships. As suggested by Equation 1, the separated functions are learned for each predictor feature independently, allowing for the separate explanation of the importance of each predictor feature . Therefore, the mean value of the sum of across all samples, referred to as the EBM’s mean absolute score, can directly quantify the importance of predictor feature . A link function was adopted to give the final binary OS prediction results. The EBM was implemented in Python environment with the InterpretML library (43).
The OS prediction performance was evaluated using the area under the receiver operating characteristic curve (AUCROC), accuracy, sensitivity, and specificity with a 100-fold Monte Carlo cross-validation. In the 100-fold Monte Carlo cross-validation, the model underwent independent training with 100 different versions of randomly assigned training and test sets, adhering to an 80%-20% split (i.e., 34 over 3-year and 71 under 3-year samples for training; 9 over 3-year and 18 under 3-year samples for test). The EBM’s mean absolute scores were calculated as feature importance for both HRFs and IDFs feature sources, respectively. The key feature source was identified by the higher mean importance score. The student’s t-tests were also conducted to compare the importance scores of HRFs and IDFs derived from EBM. All calculations were performed on a computation workstation equipped with a 16-core Intel Core i7-13700KF CPU at 3.4 GHz, 16 GB of RAM, and an Nvidia GeForce RTX 4070 graphics card.
Comparison study
To investigate the prediction performance and the feature importance explanation of the DR model, another two classic machine learning-based models were investigated:
1. Supporting vector machine (SVM) model: the prediction model based on SVM with linear kernel function using the combination of 512 IDFs and 56 HRFs. The linear kernel SVM distinguishes different categories by finding a maximal margin hyperplane in the input feature space (55). Such the linear modeling approach can be expressed using a common functional form, (56), where is the coefficient and b is an offset constant. The coefficients were used as estimators of feature importance to identify the key feature source.
2. Random forest (RF) model: the prediction model based on RF using the combination of 512 IDFs and 56 HRFs. The key feature source in the RF model was estimated using Mean Decrease Impurity (MDI) (57, 58). The MDI calculates the contribution of each feature to the homogeneity of the nodes and leaves by averaging the decrease in impurity caused by splits on that feature across all trees in the forest, thereby providing a rough estimation of the feature’s overall importance.
To assess the effectiveness of feature importance explanations, the following comparison experiments were subsequently performed:
1. For the DR model, the model performance was compared with (1) EBM model with key feature source (identified by mean EBM score) as input, and (2) EBM with the rest feature source as input.
2. For the SVM model using both IDFs and HRFs, the performance was compared with (1) SVM model with key feature source (identified by mean SVM coefficient) as input, and (2) SVM with the rest feature source as input.
3. For the RF model using both IDFs and HRFs, the model performance was compared with (1) RF model with key feature source (identified by mean RF MDI) as input, and (2) RF with the rest feature source as input.
For all the above comparison experiments, AUCROC, accuracy, sensitivity, and specificity evaluation matrices with 100-fold Monte Carlo cross-validation were also employed. The student’s t-tests were employed to measure the performance differences with a significance level of 0.01 when applicable.
Results
Table 2 provides the evaluation metrics results of comparative studies. The DR model demonstrated superior performance in predicting 3-year OS, with a mean AUCROC = 0.81, mean sensitivity = 0.75, mean specificity = 0.82, and mean accuracy = 0.80. EBM with IDFs only showed a comparable AUCROC and specificity to the DR model, and its sensitivity and accuracy were reduced at 0.73 and 0.79, respectively. EBM with HRFs only showed limited results, with a mean AUCROC = 0.64, mean sensitivity = 0.65, mean specificity = 0.61, and mean accuracy = 0.62. Both RF-based models and SVM-based models demonstrated the same trends, i.e., models with combined IDFs and HRFs outperforming models with IDFs or HRFs only. The RF model incorporating both HRFs and IDFs, alongside the RF with IDFs only, achieved the second-highest mean AUCROC (=0.77), while they exhibited limited sensitivity, measured at 0.30 and 0.29, respectively. All SVM-based models showed limited performances. Figure 3 compares the ROC curves derived from (A) RF-based models, (B) SVM-based models, (C) EBM-based models, and our DR model. In Figure 3, green lines represent the models with HRFs only, red lines represent models with IDFs only, and blue lines represent models with combined features. Table 3 shows the P-value results of the AUCROC comparison results, where marker “*” indicates the statistical significance (i.e., P-value<0.01).

Table 2. AUCROC, sensitivity, specificity, and accuracy results of comparative studies.
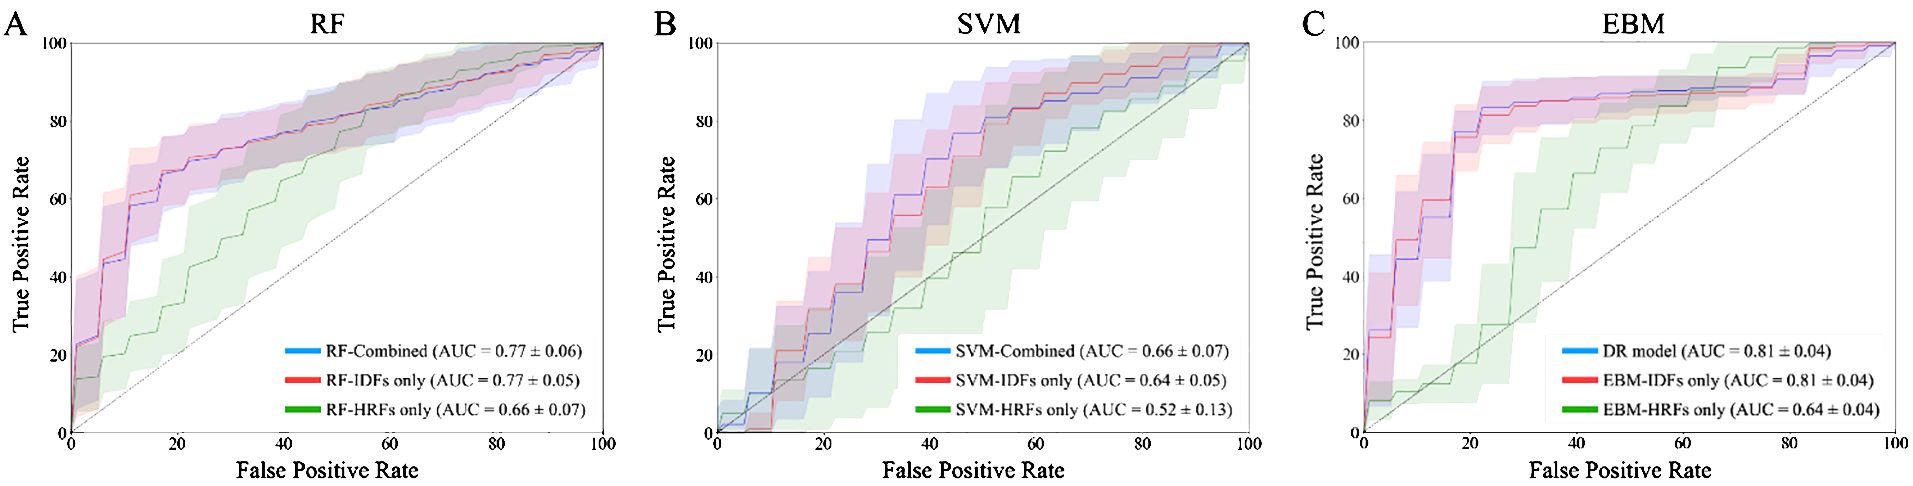
Figure 3. ROC curves of 100-fold Monte Carlo cross-validation from (A) RF-based models; (B) SVM-based models; (C) EBM-based models and our DR model. Green lines represent the models with HRFs only. Red lines represent models with IDFs only. Blue lines represent models with combined IDFs and HRFs.
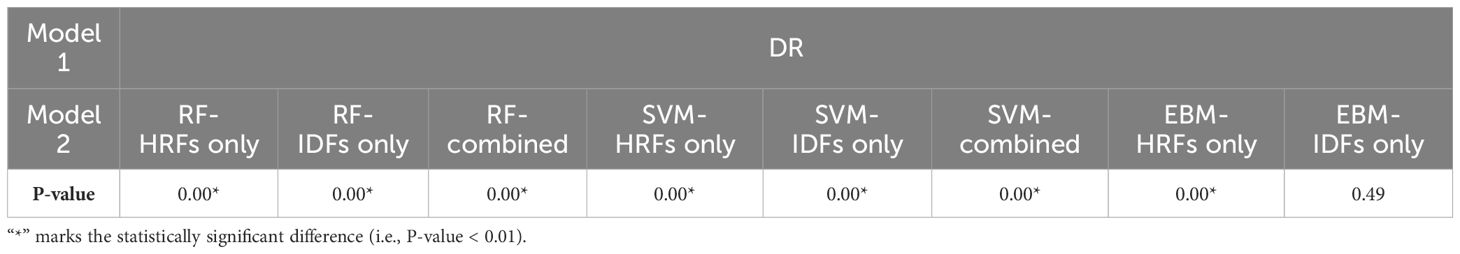
Table 3. P-values of AUCROC results of the DR model compared to the RF-based models, SVM-based models, and EBM-based models in Monte Carlo cross-validation.
EBM scores suggested that IDFs held significantly greater importance (normalized average score = 0.0019) than HRFs (0.0008). This discrepancy in feature importance was reflected in the comparative analyses: the EBM model utilizing solely IDFs achieved a comparable AUCROC to the DR model, whereas the EBM with HRFs only exhibited a markedly reduced AUCROC. In contrast, models based on RF and SVM achieved limited performance compared to the DR model. The importance scores derived from RF and SVM suggested that IDFs (0.0017/0.0016 in RF/SVM) showed lower importance than HRFs (0.0027/0.0031), which is not aligned with the model performance. This inversion contradicts the observed model performance trends. Table 4 shows the P-value results for comparing importance scores of IDFs and HRFs derived from RF, SVM, and EBM, where marker “*” indicated the statistical significance (i.e., P-value<0.01).
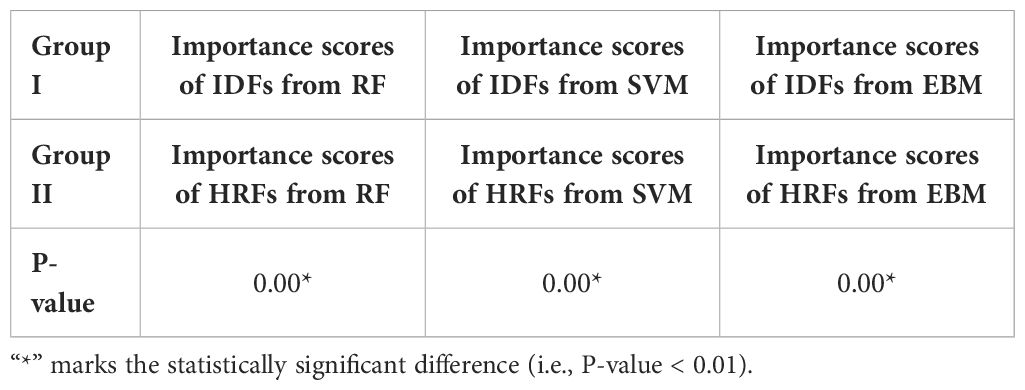
Table 4. P-values for comparing importance scores of IDFs and HRFs derived from RF, SVM, and EBM.
Supplementary Table S1 in the Supplementary Materials summarized the prediction results based on the IDFs training from scratch. The EBM model with the combination of IDFs (trained from scratch) and HRFs achieved a mean AUCROC = 0.75, a mean sensitivity = 0.77, a mean specificity = 0.79, and a mean accuracy = 0.79. The EBM using only IDFs (trained from scratch) obtained a mean AUCROC = of 0.77, a mean sensitivity = 0.80, a mean specificity = 0.80, and a mean accuracy = 0.80. Both these two models were inferior to our DR model, and EBM with IDFs (from Model Genesis) also outperformed the EBM with IDFs (trained from scratch). Supplementary Table S2 in the Supplementary Materials provides the 95% confidence interval of AUCROC for all comparative models.
Discussion
In this study, we successfully developed a DR model to predict the OS of ES-NSCLC patients following RT based on pre-treatment CT images. Compared to the previous image-based ES-NSCLC OS prediction tasks (59, 60), our DR model achieved high prediction performance with a mean AUCROC of 0.81, sensitivity of 0.75, specificity of 0.82, and accuracy of 0.80. It also outperformed all comparative models (i.e., SVM-based models, RF-based models, and EBM-based models) in this study. The proposed DR model integrates both HRFs and IDFs, where (1) HRFs are manually created at a lower level of abstraction based on expert knowledge and predefined rules to capture specific and interpretable characteristics of the GTV (17, 19), and (2) IDFs automatically learn high-level abstractions through multiple layers of processing to capture intricate patterns in the GTV (25, 30). The prediction results suggested that the combination of features from different sources may leverage the strengths of both approaches and provide a more comprehensive description of image characteristics. It is worth mentioning that there are few existing studies that investigated ES-NSCLC patients from the TCIA Lung1 dataset. Consequently, there are no existing results that can be directly compared with our work. Although higher AUCROC values can be observed in other NSCLC OS prediction studies (24, 32, 33, 59–61), the comparisons between the state-of-the-art results for NSCLC OS prediction and our DR model should be interpreted with caution due to differences in cancer stages and datasets.
In this study, direct feature concatenation was employed to combine the HRFs and IDFs. Unlike more complex fusion methods such as feature transformation (62) or neural network-based fusion (63), direct concatenation preserves the transparency of the feature space. As EBM quantitatively evaluates each feature’s contribution using mean absolute score, each component of the concatenated vector thus directly corresponds to a specific feature source. Additionally, since decision trees partition the feature space based on simple thresholding rules (64), direct concatenation can be computationally efficient. The reliability of the feature importance has been proven by comparison studies. The DR model identified IDF as the key feature source, attributing to it a higher normalized average importance score (=0.0019) compared to HRF (scored 0.0008), and the P-value for the importance scores of IDFs and HRFs derived from EBM is 0.00. This discrepancy in feature importance is consistent with the model prediction performance, i.e., EBM with IDFs only achieved a comparable average AUCROC (=0.81) to the DR model, while EBM with HRFs only achieved a limited average AUCROC (=0.64). In contrast, RF and SVM models suggested an inverse feature importance, with IDFs registering lower importance scores (0.0017/0.0016 for RF/SVM, respectively) compared to HRFs (0.0027/0.0031) and the P-values for the importance scores of IDFs and HRFs derived from RF and SVM are both 0.00. Such results contradict the observed model performance trends, i.e., RF/SVM with IDFs only outperformed the RF/SVM with HRFs only. For the SVM model with linear kernel, feature coefficients were utilized to explain feature importance. The coefficients of individual features still might provide a misleading representation of their actual importance due to the relevance and interaction among features (36). For the RF model, MDI was used to assess feature importance. RF splits nodes based on decreases in feature impurity (65). If noise features coincidentally reduce impurity in specific data subsets, they can receive undeservedly high MDI scores (36, 57). This can introduce a systematic bias in the explanation of feature importance, potentially misleading the assessment (57). The feature importance explanation results suggested that the DR model based on EBM has demonstrated its effectiveness in explainability and can be potentially generalized in other multi-feature fusion studies for enhancing explanatory power.
In this work, the public available Model Genesis model was adopted as the pre-trained weights of the CNN U-Net encoder (30). The Model Genesis was trained using a large and diverse LUNA 2016 dataset (66) to learn broader and more generalized feature representations (25, 30). The pre-trained weight has been reported to show the state-of-the art performance on various medical image analysis tasks, including reducing false positives in detecting lung nodules (NCC) and pulmonary embolism (ECC) (30). To investigate the impact of the pre-trained encoder, the CNN U-Net encoder trained from scratch was also explored. The results suggested that EBM using IDFs that were trained from scratch showed limited performance, and the performance of EBM using the combination of IDFs (trained from scratch) and HRFs was also inferior to our DR model. Due to the limited sample size of our dataset, the model trained from scratch may have failed to learn strongly discriminative features effectively. Future investigation on other CNN or transformer-based pre-trained model are also needed to test the impact of deep learning image encoders. This study selected a subgroup of 132 patients with ES-NSCLC from the TCIA Lung1 dataset, rather than including all patients. The OS of patients with advanced or locally advanced NSCLC involves multiple factors, such as patient conditions (67), complications (e.g., second tobacco-caused neoplasms (67), chemotherapy-induced bone marrow failure (68)), treatment modalities (69), etc. The current TCIA Lung1 dataset lacks details on treatment procedures (e.g., lack of chemotherapy information). Therefore, OS modeling for advanced or locally advanced NSCLC can be challenging (70–73). Our analysis was finally restricted to the 132 patients with ES-NSCLC and primarily focused on technical development. Meanwhile, the choice of chemotherapy has been reported to depend on the patient’s genetics, cancer stage, and gender (74–77), and its administration could potentially impact patient OS outcomes (78–80). The lack of detailed chemotherapy information in the TCIA Lung1 dataset (i.e., unspecified details about which patients received chemotherapy) limits our ability to fully explain its impact on survival rates. Further research with comprehensive information (including chemotherapy, immunotherapy, etc.) is needed to test our model on patients with ES-NSCLC, advanced, or locally advanced NSCLC. Furthermore, the data distribution was 33% of patients with OS over 3 years and 67% with OS under 3 years; no severe data imbalance was observed in this task. Therefore, we did not include class-balancing approaches during the training process. In future work, class-balancing approaches can be explored to determine if they can further enhance model performance.
Conclusion
In this work, we successfully developed a DR model to predict ES-NSCLC OS based on pre-treatment CT images, and the results suggested that feature importance from DR model is highly correlated to model prediction power. The proposed methodology can be generalized to other employing multi-feature fusion models to evaluate feature importance.
Data availability statement
The original contributions presented in the study are included in the article/Supplementary Material. Further inquiries can be directed to the corresponding author. All imaging data used in this study is obtained from the publicly available TCIA Lung1 dataset, which can be downloaded via request from the TCIA Lung1 website: https://wiki.cancerimagingarchive.net/display/Public/NSCLC-Radiomics.
Author contributions
RZ: Data curation, Formal analysis, Investigation, Methodology, Software, Visualization, Writing – original draft, Writing – review & editing. HZ: Validation, Writing – review & editing. MC: Resources, Validation, Writing – review & editing. WS: Validation, Writing – review & editing. KL: Resources, Writing – review & editing. ZL: Resources, Writing – review & editing. CW: Conceptualization, Resources, Writing – review & editing. LZ: Writing – review & editing. FY: Conceptualization, Funding acquisition, Writing – review & editing, Resources. ZY: Writing – review & editing, Conceptualization, Funding acquisition, Methodology, Project administration, Supervision.
Funding
The author(s) declare financial support was received for the research, authorship, and/or publication of this article. The research results of this article are sponsored by the Kunshan Municipal Government research funding.
Acknowledgments
The authors would like to thank Dr. Leonard Wee, Dr. Dirk de Ruysscher, Dr. Andre Dekker, Dr. Hugo Aerts, et al., for sharing the TCIA Lung1 dataset.
Conflict of interest
The authors declare that the research was conducted in the absence of any commercial or financial relationships that could be construed as a potential conflict of interest.
Publisher’s note
All claims expressed in this article are solely those of the authors and do not necessarily represent those of their affiliated organizations, or those of the publisher, the editors and the reviewers. Any product that may be evaluated in this article, or claim that may be made by its manufacturer, is not guaranteed or endorsed by the publisher.
Supplementary material
The Supplementary Material for this article can be found online at: https://www.frontiersin.org/articles/10.3389/fonc.2024.1419621/full#supplementary-material
References
1. Sung H, Ferlay J, Siegel RL, Laversanne M, Soerjomataram I, Jemal A, et al. Global cancer statistics 2020: GLOBOCAN estimates of incidence and mortality worldwide for 36 cancers in 185 countries. CA: Cancer J Clin. (2021) 71:209–49. doi: 10.3322/caac.21660
2. Ferlay J, Colombet M, Soerjomataram I, Parkin DM, Piñeros M, Znaor A, et al. Cancer statistics for the year 2020: An overview. Int J Cancer. (2021) 149:778–89. doi: 10.1002/ijc.33588
3. Molina JR, Yang P, Cassivi SD, Schild SE, Adjei AA. (Eds). Non-small cell lung cancer: epidemiology, risk factors, treatment, and survivorship. Mayo clinic Proc. (2008) 83:584–94. doi: 10.1016/S0025-6196(11)60735-0
4. Albano D, Bilfinger T, Nemesure B. 1-, 3-, and 5-year survival among early-stage lung cancer patients treated with lobectomy vs SBRT. Lung Cancer: Targets Ther. (2018) p:65–71. doi: 10.2147/LCTT.S166320
5. Team N.L.S.T.R. Reduced lung-cancer mortality with low-dose computed tomographic screening. New Engl J Med. (2011) 365:395–409. doi: 10.1056/NEJMoa1102873
6. Zappa C, Mousa SA. Non-small cell lung cancer: current treatment and future advances. Trans Lung Cancer Res. (2016) 5:288. doi: 10.21037/tlcr
7. Rosell R, Karachaliou N. Optimizing lung cancer treatment approaches. Nat Rev Clin Oncol. (2015) 12:75–6. doi: 10.1038/nrclinonc.2014.225
8. Raz DJ, Zell JA, Ou SI, Gandara DR, Anton-Culver H, Jablons DM. Natural history of stage I non-small cell lung cancer: implications for early detection. Chest. (2007) 132:193–9. doi: 10.1378/chest.06-3096
9. Wisnivesky JP, Bonomi M, Henschke C, Iannuzzi M, McGinn T. Radiation therapy for the treatment of unresected stage I-II non-small cell lung cancer. Chest. (2005) 128:1461–7. doi: 10.1378/chest.128.3.1461
10. von Reibnitz D, Shaikh F, Wu AJ, Treharne GC, Dick-Godfrey R, Foster A, et al. Stereotactic body radiation therapy (SBRT) improves local control and overall survival compared to conventionally fractionated radiation for stage I non-small cell lung cancer (NSCLC). Acta Oncol. (2018) 57:1567–73. doi: 10.1080/0284186X.2018.1481292
11. Timmerman RD, Paulus R, Pass HI, Gore E, Edelman MJ, Galvin JM, et al. RTOG 0618: Stereotactic body radiation therapy (SBRT) to treat operable early-stage lung cancer patients. Am Soc Clin Oncol. (2013) 31:7523. doi: 10.1200/jco.2013.31.15_suppl.7523
12. Kaskowitz L, Graham MV, Emami B, Halverson KJ, Rush C. Radiation therapy alone for stage I non-small cell lung cancer. Int J Radiat Oncol Biol Phys. (1993) 27:517–23. doi: 10.1016/0360-3016(93)90374-5
13. Cheung PC, Mackillop WJ, Dixon P, Brundage MD, Youssef YM, Zhou S. Involved-field radiotherapy alone for early-stage non–small-cell lung cancer. Int J Radiat Oncol Biol Phys. (2000) 48:703–10. doi: 10.1016/S0360-3016(00)00667-2
14. Qiao X, Tullgren O, Lax I, Sirzén F, Lewensohn R. The role of radiotherapy in treatment of stage I non-small cell lung cancer. Lung Cancer. (2003) 41:1–11. doi: 10.1016/S0169-5002(03)00152-1
15. Chaddad A, Desrosiers C, Toews M, Abdulkarim B. Predicting survival time of lung cancer patients using radiomic analysis. Oncotarget. (2017) 8:104393. doi: 10.18632/oncotarget.v8i61
16. Braghetto A, Marturano F, Paiusco M, Baiesi M, Bettinelli A. Radiomics and deep learning methods for the prediction of 2-year overall survival in LUNG1 dataset. Sci Rep. (2022) 12:14132. doi: 10.1038/s41598-022-18085-z
17. Wan Y, Yang P, Xu L, Yang J, Luo C, Wang J, et al. Radiomics analysis combining unsupervised learning and handcrafted features: A multiple-disease study. Med Phys. (2021) 48:7003–15. doi: 10.1002/mp.15199
18. Lambin P, Rios-Velazquez E, Leijenaar R, Carvalho S, Van Stiphout RG, Granton P, et al. Radiomics: extracting more information from medical images using advanced feature analysis. Eur J Cancer. (2012) 48:441–6. doi: 10.1016/j.ejca.2011.11.036
19. Avanzo M, Stancanello J, Pirrone G, Sartor G. Radiomics and deep learning in lung cancer. Strahlentherapie und Onkologie. (2020) 196:879–87. doi: 10.1007/s00066-020-01625-9
20. Afshar P, Mohammadi A, Plataniotis KN, Oikonomou A, Benali H. From handcrafted to deep-learning-based cancer radiomics: challenges and opportunities. IEEE Signal Process Magazine. (2019) 36:132–60. doi: 10.1109/MSP.79
21. Lafata KJ, Wang Y, Konkel B, Yin F-F, Bashir MR. Radiomics: a primer on high-throughput image phenotyping. Abdominal Radiol. (2021) 47:2986–3002. doi: 10.1007/s00261-021-03254-x
22. Li H, Galperin-Aizenberg M, Pryma D, Simone CB II, Fan Y. Unsupervised machine learning of radiomic features for predicting treatment response and overall survival of early stage non-small cell lung cancer patients treated with stereotactic body radiation therapy. Radiotherapy Oncol. (2018) 129:218–26. doi: 10.1016/j.radonc.2018.06.025
23. Starkov P, Aguilera TA, Golden DI, Shultz DB, Trakul N, Maxim PG, et al. The use of texture-based radiomics CT analysis to predict outcomes in early-stage non-small cell lung cancer treated with stereotactic ablative radiotherapy. Br J Radiol. (2019) 92:20180228. doi: 10.1259/bjr.20180228
24. Xu Y, Hosny A, Zeleznik R, Parmar C, Coroller T, Franco I, et al. Deep learning predicts lung cancer treatment response from serial medical imaging. Clin Cancer Res. (2019) 25:3266–75. doi: 10.1158/1078-0432.CCR-18-2495
25. Dara S, Tumma P. (2018). “Feature extraction by using deep learning: A survey,” in: 2018 Second international conference on electronics, communication and aerospace technology (ICECA), March 29-31, 2018, Coimbatore, India: IEEE. doi: 10.1109/ICECA.2018.8474912
26. Yang Z, Wang C, Wang Y, Lafata KJ, Zhang H, Ackerson BG, et al. Development of a multi-feature-combined model: proof-of-concept with application to local failure prediction of post-SBRT or surgery early-stage NSCLC patients. Front Oncol. (2023) 13. doi: 10.3389/fonc.2023.1185771
27. Kumar D, Wong A, Clausi DA. (2015). “Lung nodule classification using deep features in CT images,” in: 2015 12th Conference on Computer and Robot Vision, June 03-05, 2015, Halifax, NS, Canada: IEEE. doi: 10.1109/CRV.2015.25
28. Zhong Y, She Y, Deng J, Chen S, Wang T, Yang M, et al. Deep learning for prediction of N2 metastasis and survival for clinical stage I non–small cell lung cancer. Radiology. (2022) 302:200–11. doi: 10.1148/radiol.2021210902
29. Lian J, Deng J, Hui ES, Koohi-Moghadam M, She Y, Chen C, et al. Early stage NSCLS patients’ prognostic prediction with multi-information using transformer and graph neural network model. Elife. (2022) 11:e80547. doi: 10.7554/eLife.80547.sa2
30. Zhou Z, Sodha V, Pang J, Gotway MB, Liang J. Models genesis. Med image Anal. (2021) 67:101840. doi: 10.1016/j.media.2020.101840
31. Lin Q, Wu HJ, Song QS, Tang YK. CT-based radiomics in predicting pathological response in non-small cell lung cancer patients receiving neoadjuvant immunotherapy. Front Oncol. (2022) 12:937277. doi: 10.3389/fonc.2022.937277
32. Hosny A, Parmar C, Coroller TP, Grossmann P, Zeleznik R, Kumar A, et al. Deep learning for lung cancer prognostication: a retrospective multi-cohort radiomics study. PloS Med. (2018) 15:e1002711. doi: 10.1371/journal.pmed.1002711
33. Chen N-B, Xiong M, Zhou R, Zhou Y, Qiu B, Luo Y-F, et al. CT radiomics-based long-term survival prediction for locally advanced non-small cell lung cancer patients treated with concurrent chemoradiotherapy using features from tumor and tumor organismal environment. Radiat Oncol. (2022) 17:184. doi: 10.1186/s13014-022-02136-w
34. Vial A, Stirling D, Field M, Ros M, Ritz C, Carolan M, et al. The role of deep learning and radiomic feature extraction in cancer-specific predictive modelling: a review. Trans Cancer Res. (2018) 7:803–16. doi: 10.21037/tcr
35. Perakakis N, Yazdani A, Karniadakis GE, Mantzoros C. Omics, big data and machine learning as tools to propel understanding of biological mechanisms and to discover novel diagnostics and therapeutics. Amsterdam, Netherlands: Elsevier (2018) p. A1–9.
36. Petch J, Di S, Nelson W. Opening the black box: the promise and limitations of explainable machine learning in cardiology. Can J Cardiol. (2022) 38:204–13. doi: 10.1016/j.cjca.2021.09.004
37. Ribeiro MT, Singh S, Guestrin C. (2016). “Why should i trust you?” Explaining the predictions of any classifier,” in: KDD '16: Proceedings of the 22nd ACM SIGKDD International Conference on Knowledge Discovery and Data Mining, August 13-17, 2016, San Francisco, CA, USA: ACM, 1135–44. doi: 10.1145/2939672.2939778
38. Lundberg SM, Lee S-I. A unified approach to interpreting model predictions. Adv Neural Inf Process Syst. (2017) 30.
39. Abdullah TA, Zahid MSM, Turki AF, Ali W, Jiman AA, Abdulaal MJ, et al. Sig-LIME: a Signal-based Enhancement of LIME Explanation Technique. Piscataway, USA: IEEE Access (2024). doi: 10.1109/ACCESS.2024.3384277
40. Li X, Xiong H, Li X, Zhang X, Liu J, Jiang H, et al. G-LIME: Statistical learning for local interpretations of deep neural networks using global priors. Artif Intell. (2023) 314:103823. doi: 10.1016/j.artint.2022.103823
41. Visani G, Bagli E, Chesani F. Optilime: Optimized lime explanations for diagnostic computer algorithms. (arXiv, New York, USA) (2020), arXiv preprint arXiv:2006.05714.
42. Li Z. Extracting spatial effects from machine learning model using local interpretation method: An example of SHAP and XGBoost. Computers Environ Urban Syst. (2022) 96:101845. doi: 10.1016/j.compenvurbsys.2022.101845
43. Nori H, Jenkins S, Koch P, Caruana R. Interpretml: A unified framework for machine learning interpretability. (arXiv, New York, USA) (2019), arXiv preprint arXiv:1909.09223.
44. Bodria F, Giannotti F, Guidotti R, Naretto F, Pedreschi D, Rinzivillo S. Benchmarking and survey of explanation methods for black box models. Data Min Knowledge Discovery. (2023) 37:1719–78. doi: 10.1007/s10618-023-00933-9
45. Maxwell AE, Sharma M, Donaldson KA. Explainable boosting machines for slope failure spatial predictive modeling. Remote Sens. (2021) 13:4991. doi: 10.3390/rs13244991
46. Aerts HJWL, Velazquez ER, Leijenaar RTH, Parmar C, Grossmann P, Carvalho S, et al. Decoding tumor phenotype by noninvasive imaging using a quantitative radiomics approach. Nat Commun. (2014) 5:4006. doi: 10.1038/ncomms5644
47. Shurrab S, Duwairi R. Self-supervised learning methods and applications in medical imaging analysis: A survey. PeerJ Comput Sci. (2022) 8:e1045. doi: 10.7717/peerj-cs.1045
48. Chen X, Wang X, Zhang K, Fung K-M, Thai TC, Moore K, et al. Recent advances and clinical applications of deep learning in medical image analysis. Med Image Anal. (2022) 79:102444. doi: 10.1016/j.media.2022.102444
49. Bilic P, Christ P, Li HB, Vorontsov E, Ben-Cohen A, Kaissis G, et al. The liver tumor segmentation benchmark (lits). Med Image Anal. (2023) 84:102680. doi: 10.1016/j.media.2022.102680
50. Duron L, Balvay D, Vande Perre S, Bouchouicha A, Savatovsky J, Sadik J-C, et al. Gray-level discretization impacts reproducible MRI radiomics texture features. PloS One. (2019) 14:e0213459. doi: 10.1371/journal.pone.0213459
51. Crombé A, Kind M, Fadli D, Le Loarer F, Italiano A, Buy X, et al. Intensity harmonization techniques influence radiomics features and radiomics-based predictions in sarcoma patients. Sci Rep. (2020) 10:15496. doi: 10.1038/s41598-020-72535-0
52. Yang Z, Lafata KJ, Chen X, Bowsher J, Chang Y, Wang C, et al. Quantification of lung function on CT images based on pulmonary radiomic filtering. Med Phys. (2022) 49:7278–86. doi: 10.1002/mp.15837
53. Zwanenburg A, Vallières M, Abdalah MA, Aerts HJWL, Andrearczyk V, Apte A, et al. The image biomarker standardization initiative: standardized quantitative radiomics for high-throughput image-based phenotyping. Radiology. (2020) 295:328–38. doi: 10.1148/radiol.2020191145
54. Chang Y, Lafata K, Wang C, Duan X, Geng R, Yang Z, et al. Digital phantoms for characterizing inconsistencies among radiomics extraction toolboxes. Biomed Phys Eng Express. (2020) 6:025016. doi: 10.1088/2057-1976/ab779c
55. Cristianini N, Scholkopf B. Support vector machines and kernel methods: the new generation of learning machines. Ai Magazine. (2002) 23:31–1. doi: 10.1609/aimag.v23i3.1655
56. Marchese Robinson RL, Palczewska A, Palczewski J, Kidley N. Comparison of the predictive performance and interpretability of random forest and linear models on benchmark data sets. J Chem Inf modeling. (2017) 57:1773–92. doi: 10.1021/acs.jcim.6b00753
57. Li X, Wang Y, Basu S, Kumbier K, Yu B. A debiased MDI feature importance measure for random forests. Adv Neural Inf Process Syst. (2019) 32.
58. Loh WY. Classification and regression trees. Wiley Interdiscip reviews: Data Min knowledge Discovery. (2011) 1:14–23. doi: 10.1002/widm.8
59. Jiao Z, Li H, Xiao Y, Aggarwal C, Galperin-Aizenberg M, Pryma D, et al. Integration of risk survival measures estimated from pre-and posttreatment computed tomography scans improves stratification of patients with early-stage non-small cell lung cancer treated with stereotactic body radiation therapy. Int J Radiat Oncol Biol Phys. (2021) 109:1647–56. doi: 10.1016/j.ijrobp.2020.12.014
60. Kang J, Ning MS, Feng H, Li H, Bahig H, Brooks ED, et al. Predicting 5-year progression and survival outcomes for early stage non-small cell lung cancer treated with stereotactic ablative radiation therapy: development and validation of robust prognostic nomograms. Int J Radiat Oncol Biol Phys. (2020) 106:90–9. doi: 10.1016/j.ijrobp.2019.09.037
61. Yang Y, Zhang T, Zhou Z, Liang J, Chen D, Feng Q, et al. Development and validation of a prediction model using molecular marker for long-term survival in unresectable stage III non-small cell lung cancer treated with chemoradiotherapy. Thorac Cancer. (2022) 13:296–307. doi: 10.1111/1759-7714.14218
62. Pong K-H, Lam K-M. Multi-resolution feature fusion for face recognition. Pattern Recognition. (2014) 47:556–67. doi: 10.1016/j.patcog.2013.08.023
63. Shi B, Chen Y, Zhang P, Smith CD, Liu J, Alzheimer’s Disease Neuroimaging Initiative. Nonlinear feature transformation and deep fusion for Alzheimer’s Disease staging analysis. Pattern recognition. (2017) 63:487–98. doi: 10.1016/j.patcog.2016.09.032
64. Apté C, Weiss S. Data mining with decision trees and decision rules. Future generation Comput Syst. (1997) 13:197–210. doi: 10.1016/S0167-739X(97)00021-6
65. Disha RA, Waheed S. Performance analysis of machine learning models for intrusion detection system using Gini Impurity-based Weighted Random Forest (GIWRF) feature selection technique. Cybersecurity. (2022) 5:1. doi: 10.1186/s42400-021-00103-8
66. Setio AAA, Traverso A, De Bel T, Berens MS, Van Den Bogaard C, Cerello P, et al. Validation, comparison, and combination of algorithms for automatic detection of pulmonary nodules in computed tomography images: the LUNA16 challenge. Med image Anal. (2017) 42:1–13. doi: 10.1016/j.media.2017.06.015
67. Wang T, Nelson RA, Bogardus A, Grannis FW Jr. Five-year lung cancer survival: which advanced stage nonsmall cell lung cancer patients attain long-term survival? Cancer: Interdiscip Int J Am Cancer Soc. (2010) 116:1518–25. doi: 10.1002/cncr.24871
68. Andréjak C, Terzi N, Thielen S, Bergot E, Zalcman G, Charbonneau P, et al. Admission of advanced lung cancer patients to intensive care unit: a retrospective study of 76 patients. BMC Cancer. (2011) 11:1–9. doi: 10.1186/1471-2407-11-159
69. Sakin A, Sahin S, Yasar N, Geredeli C, Aksaray F, Cihan S. The effect of different treatment modalities on survival in elderly patients with locally advanced non-small cell lung cancer. Pulmonology. (2021) 27:26–34. doi: 10.1016/j.pulmoe.2019.11.007
70. Thunnissen E, Kerr KM, Herth FJ, Lantuejoul S, Papotti M, Rintoul RC, et al. The challenge of NSCLC diagnosis and predictive analysis on small samples. Practical approach of a working group. Lung Cancer. (2012) 76:1–18. doi: 10.1016/j.lungcan.2011.10.017
71. Dou TH, Coroller TP, van Griethuysen JJ, Mak RH, Aerts HJ. Peritumoral radiomics features predict distant metastasis in locally advanced NSCLC. PloS One. (2018) 13:e0206108. doi: 10.1371/journal.pone.0206108
72. Oberije C, De Ruysscher D, Houben R, van de Heuvel M, Uyterlinde W, Deasy JO, et al. A validated prediction model for overall survival from stage III non-small cell lung cancer: toward survival prediction for individual patients. Int J Radiat Oncol Biol Phys. (2015) 92:935–44. doi: 10.1016/j.ijrobp.2015.02.048
73. Chetan MR, Gleeson FV. Radiomics in predicting treatment response in non-small-cell lung cancer: current status, challenges and future perspectives. Eur Radiol. (2021) 31:1049–58. doi: 10.1007/s00330-020-07141-9
74. Lemjabbar-Alaoui H, Hassan OU, Yang Y-W, Buchanan P. Lung cancer: Biology and treatment options. Biochim Biophys Acta (BBA)-Reviews Cancer. (2015) 1856:189–210. doi: 10.1016/j.bbcan.2015.08.002
75. Pignon J-P, Tribodet H, Scagliotti GV, Douillard J-Y, Shepherd FA, Stephens RJ, et al. Lung adjuvant cisplatin evaluation: a pooled analysis by the LACE Collaborative Group, in Database of Abstracts of Reviews of Effects (DARE): Quality-Assessed Reviews. Centre for Reviews and Dissemination (UK), Alexandria, USA (2008). doi: 10.1200/JCO.2007.13.9030
76. Lee W, Lockhart AC, Kim RB, Rothenberg ML. Cancer pharmacogenomics: powerful tools in cancer chemotherapy and drug development. Oncologist. (2005) 10:104–11. doi: 10.1634/theoncologist.10-2-104
77. Schmetzer O, Flörcken A. Sex differences in the drug therapy for oncologic diseases. Sex gender Dif Pharmacol. (2012) p:411–42. doi: 10.1007/978-3-642-30726-3_19
78. Le Chevalier T, Arriagada R, Quoix E, Ruffle P, Martin M, Tarayre M, et al. Radiotherapy alone versus combined chemotherapy and radiotherapy in nonresectable non-small-cell lung cancer: first analysis of a randomized trial in 353 patients. JNCI: J Natl Cancer Institute. (1991) 83:417–23. doi: 10.1093/jnci/83.6.417
79. Lalami Y, Klastersky J. Impact of chemotherapy-induced neutropenia (CIN) and febrile neutropenia (FN) on cancer treatment outcomes: an overview about well-established and recently emerging clinical data. Crit Rev oncology/hematology. (2017) 120:163–79. doi: 10.1016/j.critrevonc.2017.11.005
Keywords: early-stage non-small cell lung cancer, overall survival, explainable AI, radiomics, deep learning, radiation therapy
Citation: Zhang R, Zhu H, Chen M, Sang W, Lu K, Li Z, Wang C, Zhang L, Yin F-F and Yang Z (2024) A dual-radiomics model for overall survival prediction in early-stage NSCLC patient using pre-treatment CT images. Front. Oncol. 14:1419621. doi: 10.3389/fonc.2024.1419621
Received: 18 April 2024; Accepted: 26 July 2024;
Published: 14 August 2024.
Edited by:
Wei Zhao, Beihang University, ChinaReviewed by:
Ge Ren, Hong Kong Polytechnic University, Hong Kong SAR, ChinaGaolong Zhang, Beihang University, China
Luyao Yang, Beihang University, China in collaboration with reviewer GZ
Copyright © 2024 Zhang, Zhu, Chen, Sang, Lu, Li, Wang, Zhang, Yin and Yang. This is an open-access article distributed under the terms of the Creative Commons Attribution License (CC BY). The use, distribution or reproduction in other forums is permitted, provided the original author(s) and the copyright owner(s) are credited and that the original publication in this journal is cited, in accordance with accepted academic practice. No use, distribution or reproduction is permitted which does not comply with these terms.
*Correspondence: Zhenyu Yang, emhlbnl1Lnlhbmc4OTNAZHVrZWt1bnNoYW4uZWR1LmNu