 Xiuxiu Qiu
 Qidong Wu2
 Ming Yang
- 1Department of Oncology, Longhua Hospital, Shanghai University of Traditional Chinese Medicine, Shanghai, China
- 2Department of Intensive Care Unit, Longhua Hospital, Shanghai University of Traditional Chinese Medicine, Shanghai, China
- 3Department of Good Clinical Practice (GCP), Longhua Hospital, Shanghai University of Traditional Chinese Medicine, Shanghai, China
Background: Malnutrition is strongly correlated with worsened treatment outcomes, reduced standard of living, and heightened mortality rates among individuals with cancer. Our research explores how the Geriatric Nutritional Risk Index (GNRI), a measure of nutritional status, relates to all-cause mortality, cancer-specific, and non-cancer mortality among middle-aged and older adult cancer patients.
Methods: We enrolled 3,253 participants aged 40 and above who were diagnosed with cancer. The data was obtained from the National Health and Nutrition Examination Survey (NHANES) dataset covering the period from 2001 to 2018, with a median follow-up duration of 83 months. According to the GNRI levels, patients in the study were classified into two distinct groups: the group with a low GNRI (<98) and the group with a high GNRI (≥ 98). We conducted a Kaplan-Meier survival analysis to assess how survival rates vary with different nutritional conditions. Multivariable Cox regression analyses were performed to estimate hazard ratios (HRs) and 95% confidence intervals (CIs) for all-cause mortality, as well as cancer-specific and non-cancer-related mortality. Restricted cubic spline (RCS) analyses and subgroup evaluations were performed to augment the robustness and validity of our findings.
Results: A total of 1,171 deaths were documented, with 383 attributed to cancer, and 788 from other causes. After adjusting for potential confounders, the analysis demonstrated that, within a specified range, an elevation in the GNRI is inversely associated with mortality from all causes, cancer-specific, and non-cancer causes. Moreover, Kaplan-Meier survival curves for all-cause, cancer-specific, and non-cancer mortality distinctly showed a more pronounced decrease in survival rates among individuals in the low GNRI group (<98). Notably, the restricted cubic spline regression model (RCS) revealed statistically significant non-linear associations between GNRI scores and mortality rates. The P-values were ≤0.001 for both all-cause and non-cancer mortality, and 0.024 for cancer-specific mortality.
Conclusion: Our study conclusively demonstrated a robust correlation between GNRI scores and mortality rates among cancer patients, encompassing all-cause mortality as well as specific mortality related to both cancerous and non-cancerous causes. The GNRI may be a valuable prognostic tool for predicting cancer mortality outcomes, offering insights that may inform nutritional management and influence the clinical treatment strategies for cancer survivors.
Introduction
Cancer continues to be among the most daunting global health challenges, as recent years have shown an alarming increase in mortality rates. According to the World Health Organization (WHO) projections, the number of new cancer cases reported yearly is expected to rise to 28.4 million by 2040 (1). It is estimated that by 2024, 611,720 people will die from cancer in the United States, which equates to about 1,680 deaths per day (2). This increasing trend in cancer mortality not only underscores the critical importance of ongoing research into cancer causes, prevention, and treatment but also highlights the necessity for public health initiatives aimed at reducing risk factors among populations.
Cancer survivors often encounter various challenges after treatment, including physical, psychological, and social obstacles. Maintaining optimal nutritional status is a crucial aspect of survivorship care. Malnutrition becomes increasingly prevalent among both older individuals and cancer patients as cancer progresses. Previous studies have shown that malnutrition in cancer patients can lead to increased postoperative complications, prolonged hospitalization, poor treatment outcomes, and higher mortality rates (3). Research suggests that the occurrence of malnutrition among individuals with cancer shows significant variation, with rates ranging from 20% to 70% (4). A study spanning all regions of Brazil revealed that 45.3% of patients with cancer who are admitted to the hospital, when evaluated utilizing the Patient-Generated Subjective Global Assessment (PG-SGA), exhibited varying levels of malnutrition, including moderate and severe categories (5). Recently, Geriatric nutritional risk index(GNRI) has gained widespread recognition for its significant correlation with mortality rates in older cancer patients across multiple cancer types (6).
First introduced in 2005, the Geriatric Nutritional Risk Index (GNRI) is a scientifically proven tool created to evaluate the nutritional condition of older adult populations (7). The GNRI utilizes two critical parameters for assessment: serum albumin levels and body weight. The instrument has been essential in predicting patient outcomes for various types of cancers, such as gastric cancer (6), hepatocellular carcinoma (8), and head and neck cancer (9), underscoring its importance. Additionally, it has been associated with medical outcomes that occur after surgical procedures, chemotherapy treatments, or a combination of chemotherapy and radiation therapy for many types of malignancies (10).
Given these considerations, this study assessed the relationship between GNRI and mortality attributable to all causes, cancer-related and non-cancer causes, within a sample of middle-aged and older adult cancer patients in the United States that accurately represents the entire population. The objective is to offer innovative perspectives on nutritional and supportive care strategies for individuals with cancer.
Materials and methods
Data sources
The National Health and Nutrition Examination Survey (NHANES) database, accessible at (https://www.cdc.gov/nchs/nhanes/index.htm), provides extensive coverage through various indicators. It enables the retrieval of detailed demographic statistics, comprehensive socioeconomic information, dietary and health data, physiological metrics, laboratory test results, and other related data, encompassing a broad cross-section of the United States. Administered by the Centers for Disease Control and Prevention (CDC) and the National Center for Health Statistics (NCHS), NHANES aims to provide comprehensive, nationally representative data on the health and nutritional status of the civilian population in the United States. Before participating, all subjects provided informed consent, and the NCHS Ethics Review Board approved the data collection methodologies used in NHANES.
Study design and population
This investigation included 45,566 individuals who participated in nine consecutive NHANES survey cycles from 2001 to 2018. Individuals under 40 (n=15,766) and those without a cancer diagnosis or known survival status (n=25,056) were excluded from the study. Additionally, we excluded participants lacking GNRI-related data or those with incomplete covariates (n=1,491). After applying the above criteria, 3,253 cancer survivors were available for analysis. Figure 1 depicts a flowchart illustrating the criteria employed for patient selection.
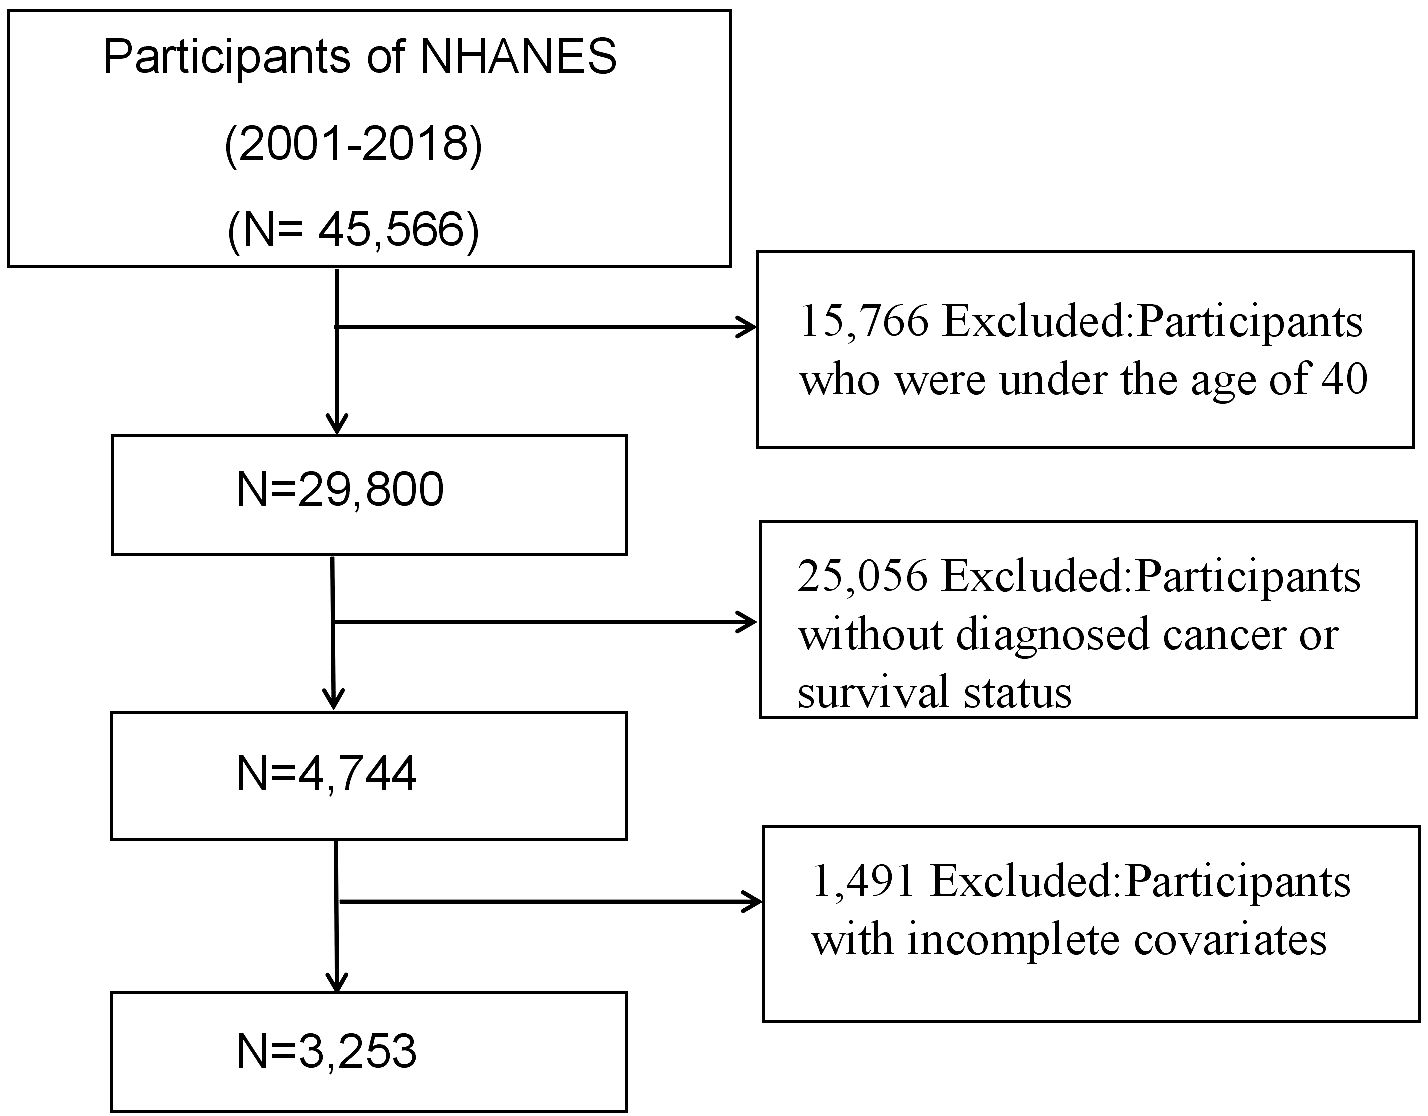
Figure 1 Flowchart of the participant’s selection from NHANES 2001-2018.
Definition of geriatric nutritional risk index
The GNRI (Geriatric Nutritional Risk Index) is a validated, straightforward scoring system developed specifically to assess the nutritional status of patients across various medical settings, notably among those undergoing surgical procedures. This index is highly precise, relying solely on objective parameters such as serum albumin levels, height, and weight, which are readily available from standard laboratory tests. The formula used to calculate the GNRI is: GNRI = (1.489 × serum albumin level in g/L) + (41.7 × actual body weight/ideal body weight in kg), where a ratio of actual to ideal weight set at 1 is assumed. This method has been recognized as a significant predictor of outcomes in diverse cancer populations, illustrating its broad applicability and reliability (11). For practical application, GNRI scores lead to the classification of patients into two primary groups: those with a GNRI < 98 form the Low-GNRI group indicating higher nutritional risk, and those with a GNRI ≥ 98 compose the High-GNRI group suggesting lower nutritional risk (12–14). To refine the understanding of nutritional risk gradients, GNRI scores were further segmented into three tertiles. This categorization helps clinicians identify patients at varying degrees of malnutrition risk more distinctly, with Tertile 1 representing the highest risk and Tertile 3 the lowest, thus enabling more targeted nutritional interventions based on the severity of risk (14).
Ascertainment of death
The mortality data for this analysis were obtained from the NHANES Public Use Linked Mortality File and integrated with standard NHANES datasets using the unique respondent sequence number assigned to each participant. The analysis encompassed mortality status and follow-up duration, classifying outcomes into two categories: survival and death. Cancer mortality is defined as the likelihood of dying from various malignant tumors, whereas non-cancer mortality refers to the likelihood of death from causes other than cancer. The National Death Index (NDI) records were used to determine the mortality status and causes of death until 31 December 2019. In the 10th edition of the International Classification of Diseases (ICD-10), it is outlined that deaths attributed to malignant neoplasms are categorized as cancer mortality (with the specific codes of ICD-10 C00-C97) (15).
Cancer patients
Patients with a previous diagnosis of cancer were identified through the inquiry: “Have you ever been told by a doctor that you had cancer or a malignancy of any kind?” Individuals responding “YES” were selected for inclusion. Following this selection, cancer patients were further queried regarding the specific type of cancer diagnosed.
Covariates
Data regarding the demographic characteristics of the patients, including age, gender, race, education level, and marital status, was collected. Additional covariates were derived from physical examinations conducted at a mobile examination center and from laboratory test results. Ethnicity was divided into four distinct groups: Mexican American, Non-Hispanic White, Non-Hispanic Black, and Other. Education levels were dichotomized as “Below High School” and “High School or Above.” Marital status was categorized into four groups: Married/Cohabitant, Widowed, Separated/Divorced, and Never Married. Body Mass Index (BMI) was determined by dividing weight in kilograms (kg) by the square of height in meters (m²). Based on these calculations, BMI values were categorized into three groups: Underweight or Normal (<25.0 kg/m²), Overweight (25.0 to 30.0 kg/m2), and Obesity (≥30.0kg/m²) (16). Physical activity was classified as either moderate/vigorous recreational activities (yes) or none. Additionally, the energy intake was assessed using dietary data obtained from 24-hour dietary recalls. Smoking status was classified into three categories: Never Smoker, Former Smoker, and Current Smoker. A “Never Smoker” is defined as an individual who has smoked fewer than 100 cigarettes in their lifetime. A “Former Smoker” refers to someone who has smoked more than 100 cigarettes in their lifetime but has quit smoking. A “Current Smoker” is defined as someone who has smoked more than 100 cigarettes in their lifetime and continues to smoke occasionally or daily. Alcohol consumption was categorized based on the past year’s responses into five groups: Never (fewer than 12 drinks in a lifetime), Mild (≤ 2 drinks every day for males, ≤ 1 drink every day for females), Moderate (≤ 3 and > 2 drinks every day for males, ≤ 2 and > 1 drink every day for females, or ≥ 2 to < 5 days per month of binge drinking), Heavy (≥ 4 drinks every day for males, ≥ 3 drinks every day for females, or ≥ 5 days per month of binge drinking), and Former (no drinking in the past year but over 12 drinks in any previous year). The study identified chronic diseases, including diabetes, hypertension, coronary heart disease (CHD), and stroke. Diabetes was further classified into diabetes mellitus (DM), compromised fasting glycemia, and impaired glucose tolerance. Diagnosis of these conditions relied on patient self-reporting.
Statistical analysis
In this study, we rigorously adhered to the NHANES complex survey design principles, taking into account weights, clustering, and stratification to ensure representative and accurate analyses. We initiated our analysis by categorizing cancer survivors based on their Geriatric Nutritional Risk Index (GNRI) scores into two groups: Low GNRI (< 98) and High GNRI (≥98). For the descriptive analysis, we employed the weighted mean ± standard deviation to summarize continuous variables, ensuring that the complex survey design was accounted for in these estimations. Categorical variables were reported as frequencies and percentages, with survey design adjustments applied to accurately reflect the NHANES sample population. This method enabled a comprehensive comparison of baseline characteristics between the Low GNRI and High GNRI groups, utilizing χ2 tests for categorical variables and ANOVA for continuous variables.
Next, in the analysis of the relationship between GNRI and mortality risk among cancer patients, Cox proportional hazards regression models were employed. The Cox regression model was used to estimate hazard ratios (HRs) and 95% confidence intervals (CIs). The proportional hazards assumption was tested using the Schoenfeld residuals method. These models facilitated the examination of GNRI both as a continuous variable, to assess the impact of each unit change in GNRI on mortality risk, and as a categorical variable, to discern potential nonlinear relationships and risk distribution. Model 1 incorporated age, ethnicity, and gender as variables and accounted for them through modifications. Model 2 expanded upon the changes made in Model 1 by including additional factors such as BMI, marital status, education level, drinking status, smoking behaviors, and the Poverty Income Ratio (PIR). Model 3 extended the range of adjustments to encompass energy intake, physical activity, hypertension, coronary heart disease (CHD), diabetes, stroke, and tumor types, in addition to those already considered in Model 2. This approach allowed us to reveal subtle trends and potential risk thresholds, while thoroughly accounting for a wide spectrum of potential confounders that could influence this relationship.
Kaplan-Meier curves were generated to illustrate the survival probabilities for the three groups based on GNRI status, depicting all-cause mortality, cancer-specific mortality, and non-cancer mortality. Survival distributions across these categories were compared using the log-rank test. Additionally, a restricted cubic spline (RCS) regression with four knots was conducted to assess the non-linear relationships between GNRI and mortality risk. Upon detecting nonlinearity, two-piecewise Cox proportional hazards regression models were constructed, centered around the inflection point. In the subgroup analysis, we further explored the relationship between GNRI scores and mortality risk across various demographic and clinical subgroups. This process entailed stratifying the sample based on factors such as age, gender, ethnicity, and comorbid conditions, and evaluating the association between GNRI scores and mortality within each stratum. We utilized interaction tests to determine if the effect of GNRI on mortality varied significantly across these subgroups, as presented in forest plots. The P-interaction values were derived from Cox proportional hazards regression models, which were adjusted for the complex survey design to ensure that our findings accurately reflected the diversity of the NHANES population. Statistical analyses were performed with version 4.3.2 of R software (R Foundation for Statistical Computing). Weighted regression analysis utilized the “survey” package; construction of the RCS regression harnessed the “rms” package. In this investigation, a two-sided P-value of <0.05 was considered to be statistically significant.
Results
Baseline characteristics of study participants
A total of 3,253 cancer survivors were included in this study, representing a weighted population of 15,723,705 individuals. The weighted mean (standard error) age was 64.78 (0.30) years, with 44.1% male and 55.9% female. Table 1 presents a comparison of the characteristics between the High-GNRI group (GNRI ≥ 98, n = 2963) and the Low-GNRI group (GNRI < 98, n = 290). The majority of patients were non-Hispanic White (88.38%). The p-values indicated significant differences in ethnicity, education level, PIR, BMI, smoking status, diabetes, and tumor types among the groups (P < 0.05). However, age, gender, marital status, drinking status, energy intake, physical activity, hypertension, stroke, and CHD did not exhibit significant differences between the two groups concerning the nutritional risk indicated by the GNRI score (P > 0.05). Significantly, the high GNRI group (GNRI ≥ 98) primarily comprised non-Hispanic White individuals who possessed at least a high school education and consumed more energy. These individuals were either former or never smokers, were identified as mild drinkers, had a higher BMI, and did not have diabetes. Additionally, a higher proportion of participants with gastrointestinal (5.94%) skin (38.48%) and gynecologic (37.05%) cancers were included.
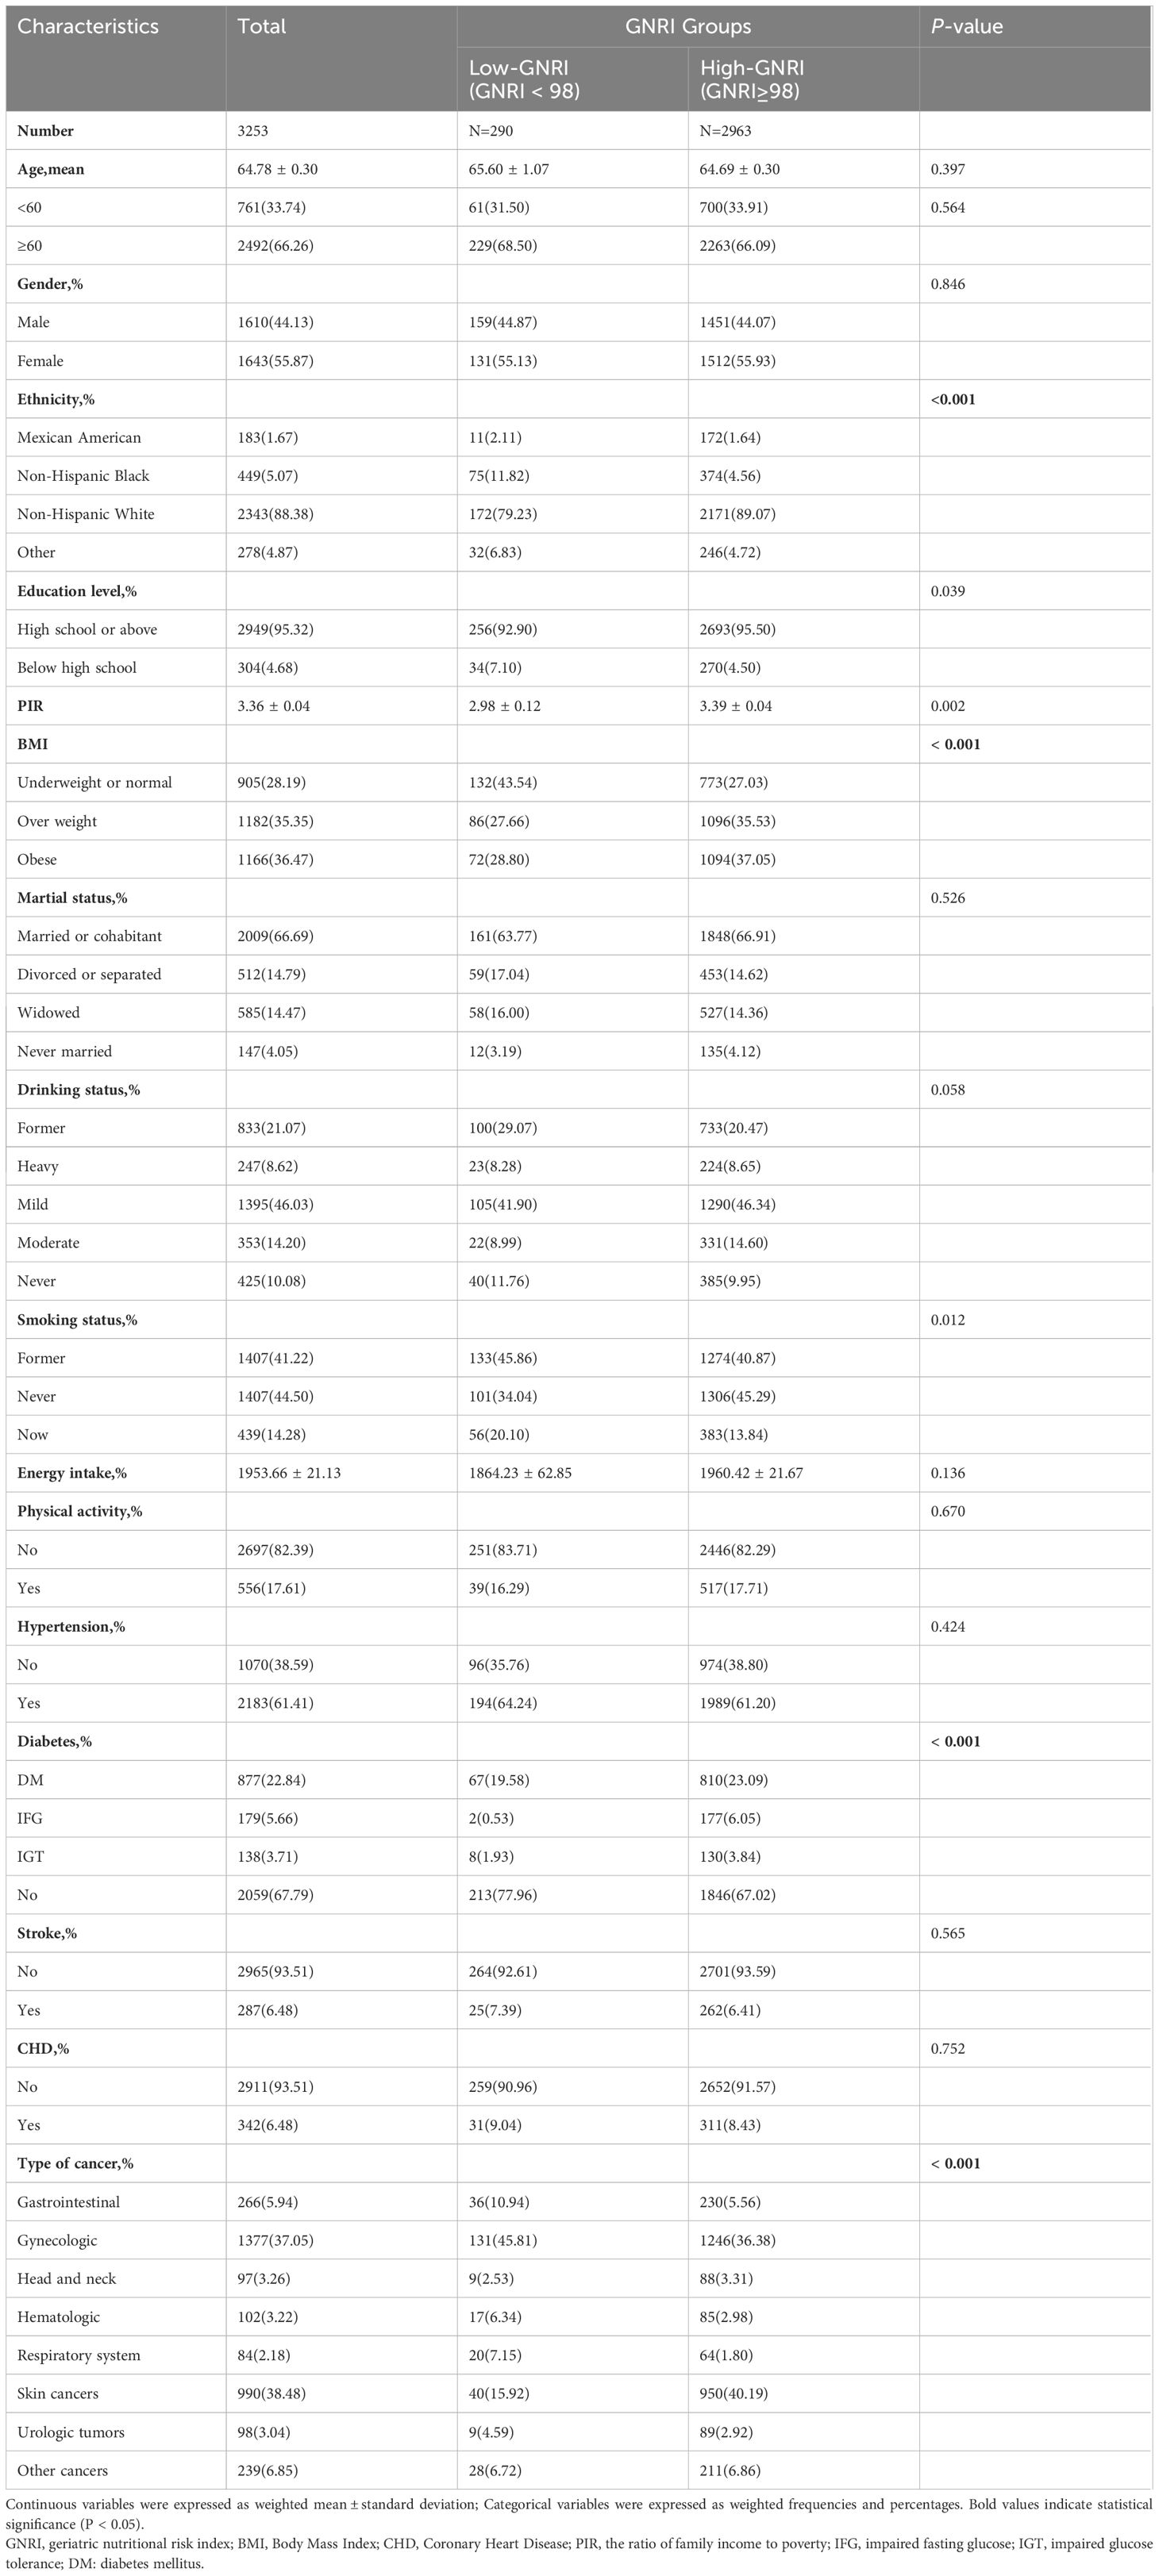
Table 1 Baseline characteristics of cancer patients ≥40 y by GNRI groups in NHANES 2001–2018.
Survival analysis of the GNRI in assessing mortality risk
Figure 2 depicts Kaplan-Meier survival curves for all-cause, cancer, and non-cancer mortality of survival among American adult cancer patients stratified by the GNRI group (Figures 2A–C). The survival analysis elucidated significant differences in survival probabilities between these cohorts. Notably, the cohort with GNRI scores < 98 exhibited substantially reduced survival rates across all evaluated mortality domains, compared to their counterparts in the ≥98 GNRI cohort. This discrepancy in survival outcomes was statistically significant, as evidenced by the log-rank test results, which yielded p-values of <0.001 for all-cause, cancer, and non-cancer mortality.
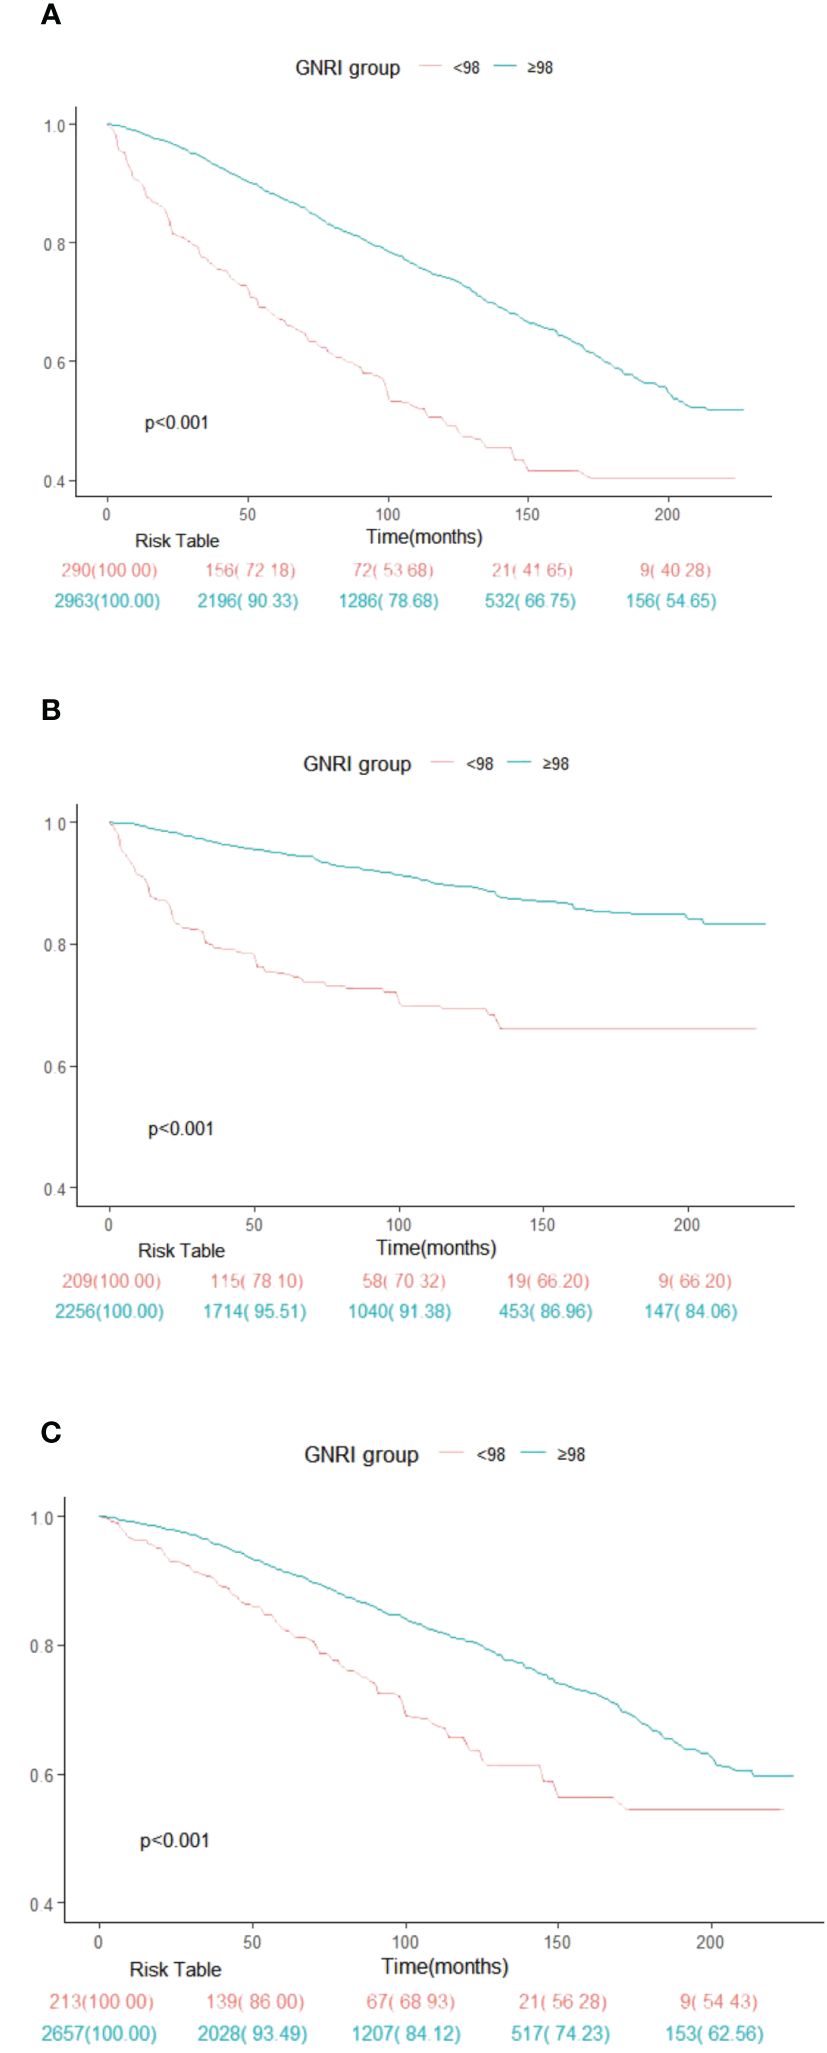
Figure 2 Kaplan-Meier survival rates illustrating mortality among US cancer patients categorized by different Geriatric nutritional risk index (GNRI) groups: (A) all cause mortality; (B) cancer mortality; (C) non-cancer mortality. In the Kaplan-Meier curves, the population is stratified into twor groups (GNRI <98, and GNRI ≥98), and statistical analysis is conducted using the long-rank test.
Association between GNRI and mortality
After adjusting for multiple covariates, a multivariate analysis was conducted using three distinct regression models to investigate the predictive value of GNRI on overall mortality, cancer-related mortality, and non-cancer-related mortality. The GNRI is assessed both as a continuous variable and in categorized forms. The findings are displayed as hazard ratios (HRs) alongside their corresponding 95% confidence intervals (CIs) (Table 2).
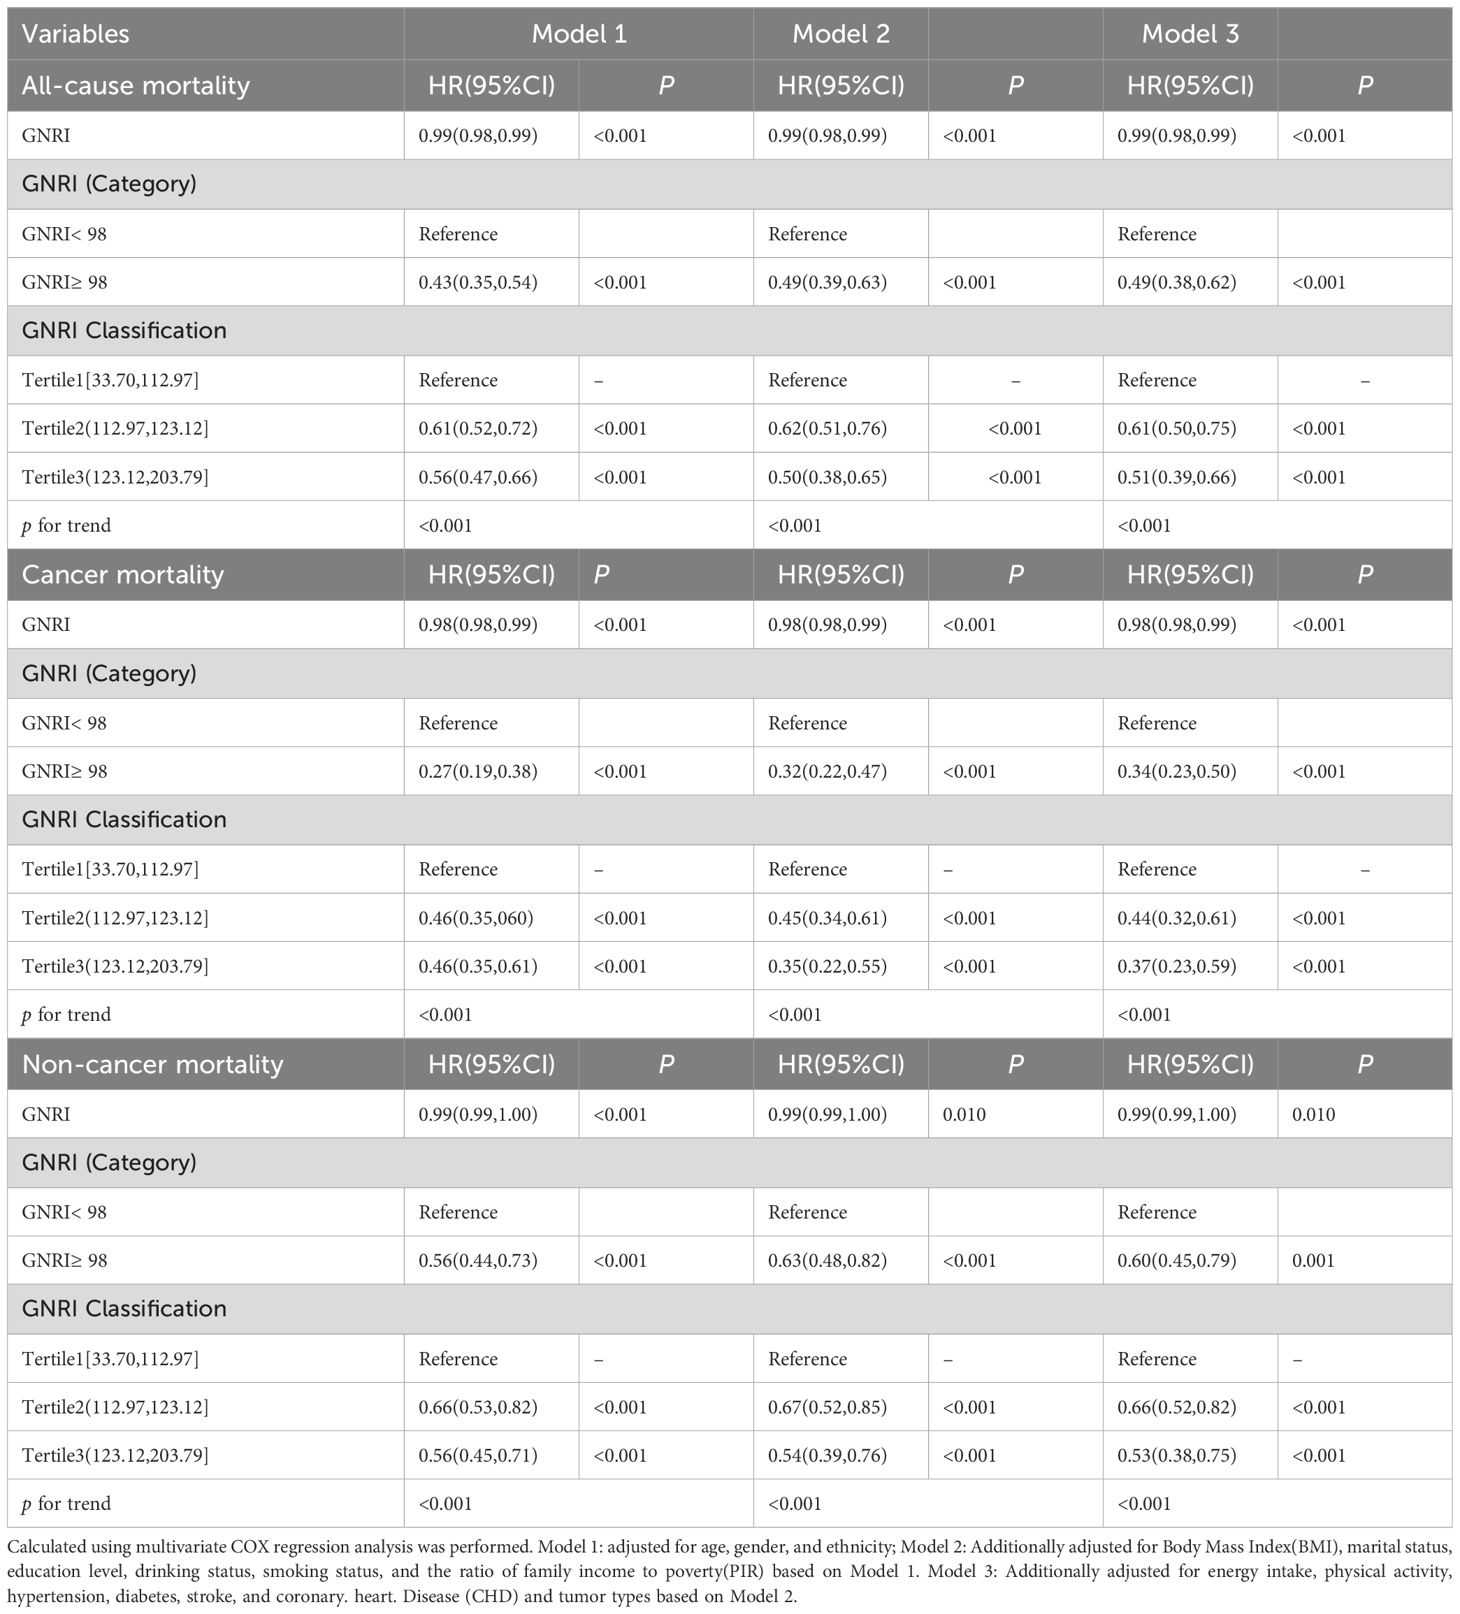
Table 2 COX proportional hazard regression analysis of GNRI and all-cause mortality, cancer and non-cancer mortality in patients with cancer.
Across all models, a higher GNRI, treated as a continuous variable, was associated with a statistically significant reduction in the risk of all-cause mortality (HR < 1, P < 0.001), cancer mortality (HR < 1, P < 0.001), and non-cancer mortality (HR < 1, P < 0.001). This indicates that higher GNRI scores are protective against mortality. In categorical analyses, individuals with a GNRI ≥98 had significantly lower hazard ratios (HRs) for all-cause, cancer-specific, and non-cancer mortality compared to the reference group (GNRI < 98), with HRs of 0.49(95% CI: 0.38,0.62),0.34(95% CI: 0.23,0.50), and 0.60(95% CI: 0.45,0.79) in Model 3, respectively.
The stratification of GNRI resulted in the identification of three distinct categories: Tertile 1 (33.70, 112.97], Tertile 2 (112.97, 123.12], and Tertile 3 (123.12, 203.79]. Tertile 1 served as the referential baseline. After adjusting for potential confounding variables, observations across the three models unveiled a consistent trend. Specifically, in the most adjusted Model 3, the HRs for all-cause, cancer-specific, and non-cancer mortality among individuals in Tertile 3, compared with Tertile 1, were 0.51 (95% CI: 0.39–0.66), 0.37 (95% CI: 0.23–0.59), and 0.53 (95% CI: 0.38–0.75), respectively. The significance of this trend was supported by P-values for the trend, which were <0.001 for all mortality outcomes in every model, thereby strengthening the correlation between GNRI scores and risk of mortality.
Nonlinear relationship between GNRI and mortality risk
In a fully adjusted restricted cubic spline regression model (RCS), we detected a significant nonlinear relationship between GNRI and all-cause, cancer-specific, and non-cancer mortality among cancer patients. This was evidenced by the P-Nonlinear values of <0.001 for all-cause mortality, 0.024 for cancer-specific mortality, and <0.001 for non-cancer mortality (Figure 3). The RCS analysis indicates that patients with extremely low or high GNRI scores are significantly associated with an increased risk of mortality for all-cause, cancer-specific, and non-cancer mortality. It also shows that as the GNRI increases to a certain point, mortality risk decreases before slightly increasing again. This suggests that maintaining a GNRI score around this optimal value may benefit patients, scores outside this range are associated with a higher mortality risk.
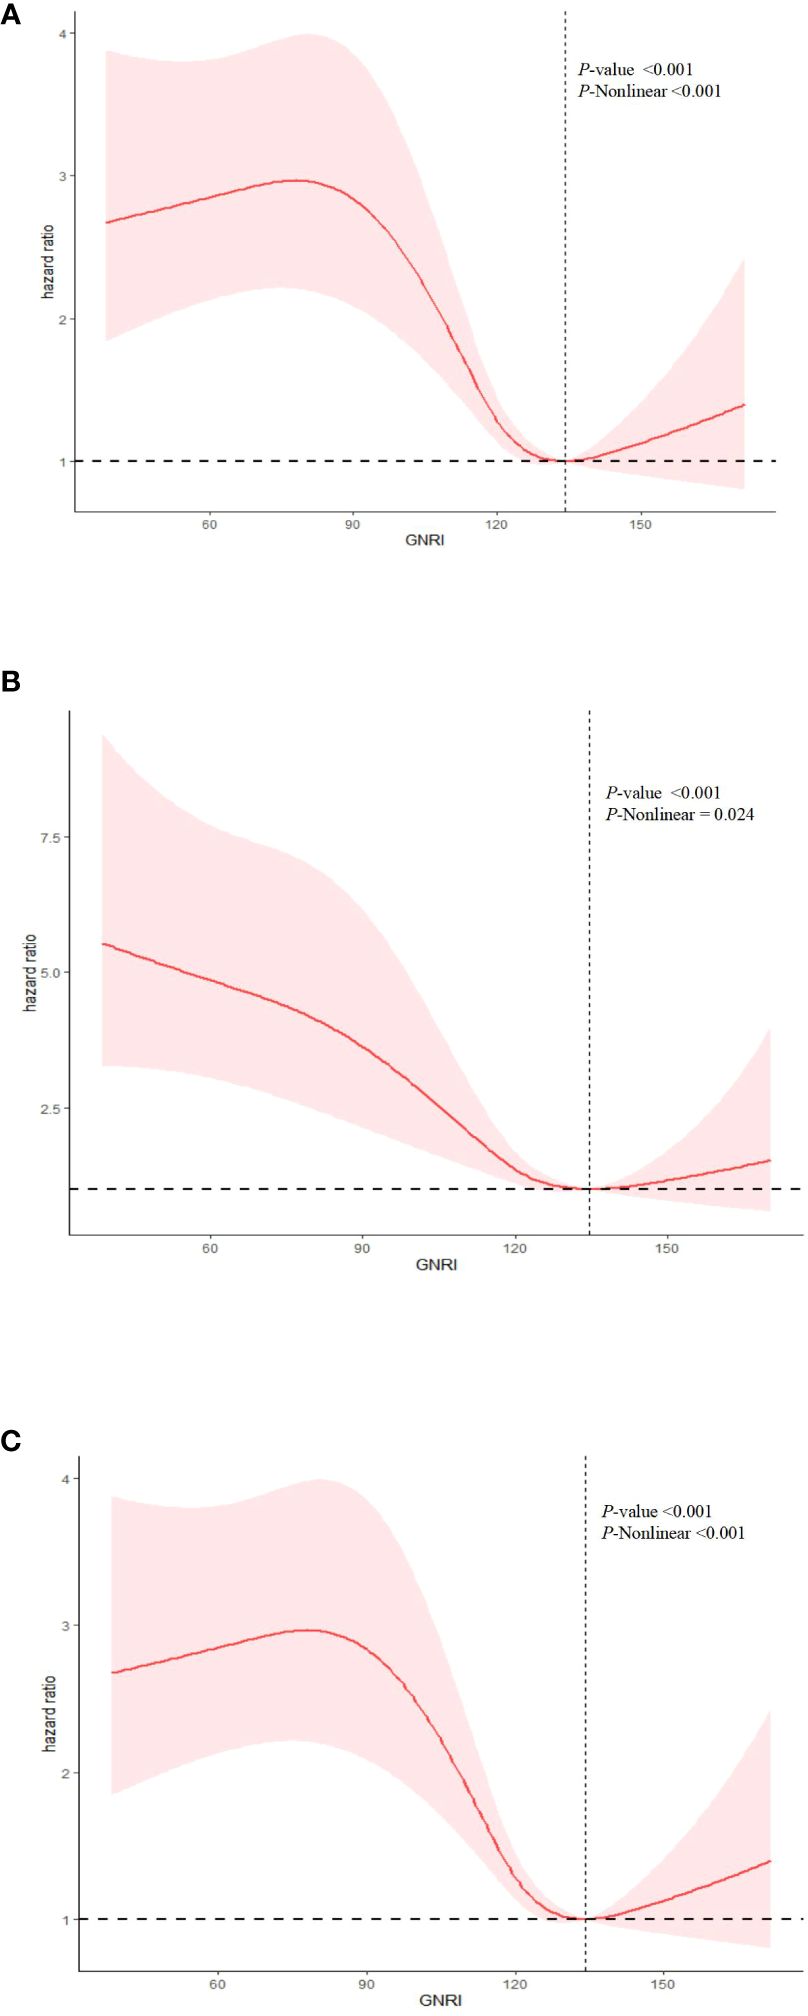
Figure 3 Nonlinear relationship between GNRI and mortality in cancer patients. (A) all cause mortality; (B) cancer mortality; (C) non-cancer mortality. Statistical adjustments were made for age, gender, marital status, ethnicity, education level, Body Mass Index (BMI), smoking status, drinking status, energy intake, physical activity, the ratio of family income to poverty (PIR), diabetes, hypertension, coronary heart disease (CHD), stroke, and tumor types.
After identifying a non-linear relationship, we utilized two segmented linear regression models to delineate the changes in the relationship between GNRI and mortality risk at specific threshold points (Table 3). Thresholds were determined by evaluating all possible values and selecting the points with the highest log-likelihood values. The established thresholds were 134.16 for all-cause mortality, 134.65 for cancer mortality, and 134.15 for non-cancer mortality, indicating significant changes in the linear relationship between GNRI and mortality risk. For all-cause mortality, when GNRI was below the threshold of 134.16, each unit increase resulted in a slight but statistically significant reduction in mortality risk, with a hazard ratio (HR) of 0.99 (95% CI: 0.98, 0.99). Above this threshold, the HR was 1.00 (95% CI: 0.98, 1.02), suggesting that further increases in GNRI did not significantly alter mortality risk. In the models for cancer mortality and non-cancer mortality, the HR below the thresholds also indicated a statistically significant risk reduction.
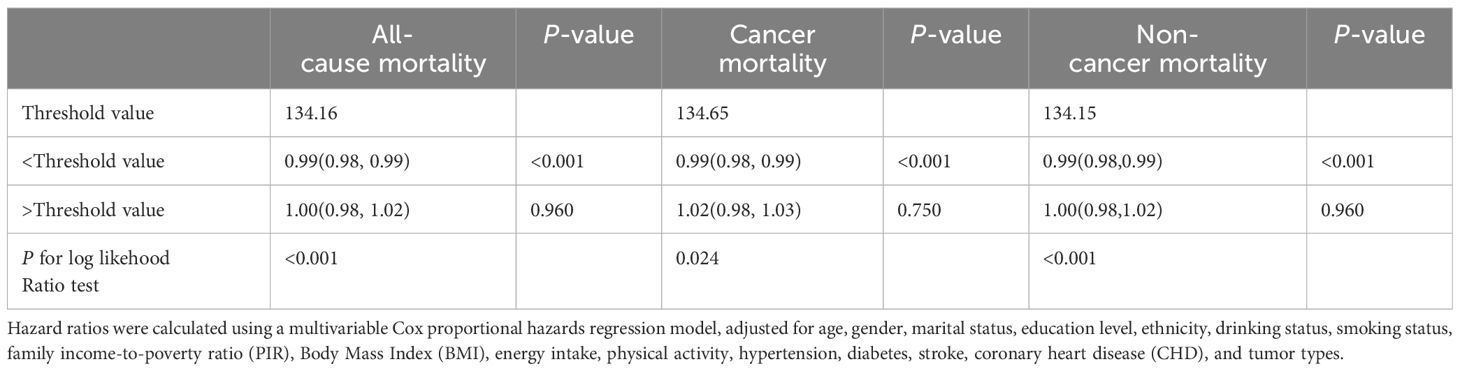
Table 3 Nonlinearity addressed through a two-piecewise linear model.
The P-values for the log-likelihood ratio tests were statistically significant across all outcomes (all-cause and non-cancer mortality <0.001, cancer mortality 0.024), confirming that the segmented linear models were more suitable for these data than the basic linear models and that there is indeed a non-linear association between GNRI and various forms of mortality.
Subgroup analysis
Stratified analysis of the association between GNRI and mortality outcomes
Figure 4 elucidates the results from subgroup analyses investigating the association between GNRI and three categories of mortality: Figure 4A. all-cause, Figure 4B. cancer-related, and Figure 4C. non-cancer-related mortality. These analyses were stratified by several key variables, including age, gender, marital status, educational level, BMI, smoking status, drinking status, and medical history (stroke, hypertension, diabetes, coronary heart disease). Additionally, the analysis considered tumor type in the context of cancer mortality. The figures display hazard ratios (HRs) along with 95% confidence intervals (CIs) to quantify the strength and direction of associations within each subgroup. P-values for interaction are used to assess the statistical significance of differences in the GNRI-mortality association across subgroups.

Figure 4 The figure show the association between GNRI and risk of mortality in different participants for (A) all cause mortality; (B) cancer-specific mortality; and (C) non-cancer mortality. The analysis was adjusted for age, gender, marital status, education level, ethnicity, drinking status, smoking status, Body Mass Index (BMI), and physical activity, hypertension, diabetes, stroke, coronary heart disease (CHD), and tumor types.
Significant interactions were observed between GNRI and specific factors. Notably, the association between GNRI and all-cause mortality varied significantly across different tumor types (P for interaction < 0.05), underscoring the impact of cancer pathology on nutritional risk and survival outcomes. Similarly, a significant interaction was identified between cancer mortality and coronary heart disease (CHD) (P for interaction < 0.05), suggesting that cardiovascular comorbidities may modulate the impact of nutritional status on cancer survival. Conversely, no significant interactions were detected between GNRI and other examined factors—age, gender, marital status, education level, BMI, smoking status, drinking status, physical activity, and medical history (stroke, hypertension and diabetes)—for all-cause, cancer-specific, and non-cancer mortality (P for interaction > 0.05). This indicates that the effect of GNRI is generally consistent across these demographic and clinical characteristics, underscoring its broad applicability as a prognostic tool in diverse patient populations. The findings from these subgroup analyses are crucial for identifying populations at heightened risk and for tailoring interventions that enhance nutritional status and, consequently, improve patient outcomes.
Discussion
In this comprehensive retrospective cohort study, we elucidated the non-linear relationship between GNRI and mortality risk among cancer survivors. This included all-cause, cancer-specific, and non-cancer mortality, identifying an optimal GNRI range associated with the lowest risk of death for patients. In the analysis of continuous variables, we observed that each additional unit of GNRI is associated with a reduction in mortality risk. However, this relationship reverses when GNRI values are extremely low or high, as demonstrated through the analysis of categorical variables. Analyzing GNRI as a continuous variable provides a comprehensive perspective, helping to reveal the overall risk curve, while categorical analysis highlights specific risk intervals. Using both models together offers the greatest insights and guidance for clinical practice. Additionally, it is worth noting that subgroup analyses have confirmed GNRI’s predictive consistency across different patient demographics. These findings indicate that GNRI serves as an independent predictor of mortality in cancer survivors. Therefore, a heightened focus should be placed on assessing the nutritional status using GNRI to mitigate mortality within the cancer population (17).
The global cancer burden continues to rise, with significant variability in cancer incidence and mortality rates between regions and countries. Malnutrition is notably prevalent among tumor patients, and nutritional status is acknowledged as an essential factor that determines the level of well-being and life satisfaction in these individuals (18). Comprehensive nutritional assessments and interventions are necessary.
The Geriatric Nutritional Risk Index (GNRI) is distinguished from other inflammatory indices and nutritional indicators by its several significant advantages. Firstly, the GNRI is a simple and accurate tool that requires only routine measurements of albumin and Body Mass Index (BMI) (19). In contrast, other indices such as C-reactive protein (CRP) or the Nutritional Risk Index (NRI), often necessitate more complex or less accessible data. Secondly, recent studies have highlighted the value of GNRI in assessing the prognosis of cancer patients (20). It includes not only an assessment of nutritional status but also takes into account age factors, making it more targeted in prognostic predictions for elderly cancer patients. Ruan et al. found that the GNRI is a key prognostic indicator for survival in elderly cancer patients with cachexia (17). Nakayama et al. found that a low GNRI is significantly associated with a higher mortality risk in patients with advanced head and neck cancer (9). Additionally, GNRI has been identified as a significant predictor of postoperative respiratory complications in esophageal cancer patients and overall survival in lung cancer patients (21, 22). This is in contrast to other commonly used nutritional indices, such as the Prognostic Nutritional Index (PNI) and the Controlling Nutritional Status (CONUT) score. Wang et al. (23) determined that, according to the ESPEN 2015 guidelines, the GNRI is the most accurate tool for predicting malnutrition in esophageal cancer patients. The GNRI combines nutritional and inflammatory indicators by including serum albumin, which reflects both nutrition and inflammation. This broader approach renders the GNRI more comprehensive than indices such as the Neutrophil-to-Lymphocyte Ratio (NLR) or C-reactive protein (CRP), which mainly assess inflammation and neglect nutritional status.
Therefore, nutritional status may serve as a predictor of the efficacy of cancer therapy (24). The GNRI may be an effective marker for evaluating nutritional risk in cancer patients, with lower scores being correlated with higher rates of treatment complications, poorer responses to therapy, and decreased survival rates. Moreover, numerous studies have aimed at improving outcomes for malnourished patients, and comprehensive nutritional support guidelines have been published. Tumor-related inflammation and malnutrition are strongly linked to tumor recurrence and progression in cancer patients (25). Further analysis of how GNRI predicts cancer prognosis suggests that malnutrition is linked to a lower quality of life, less successful treatment outcomes, and an increased likelihood of mortality (26). We argue that GNRI can serve as a critical tool in assessing the prognosis of individual cancer patients. It is critically important to emphasize the nutritional status of middle-aged and older adult cancer patients.
This study establishes a link connection between GNRI levels and mortality among individuals with cancer. By utilizing nationally representative sample data from the NHANES database, our findings have the potential to impact the entire cancer survivor population in the country. This provides nutrition recommendations with significant reference value, underscoring the importance of work involving cancer survivors. For example, patients with extremely low GNRI should be given priority for nutritional support to raise their GNRI to an optimal range. Conversely, for patients with extremely high GNRI, it may be necessary to evaluate for overnutrition or other risk factors. Our analysis emphasizes that moderately adjusting GNRI to a relatively safe range could be a crucial strategy for improving the survival quality and prognosis of older adult patients.
However, it is important to acknowledge certain limitations. Tumors exhibit varied degrees of malignancy, and patients undergo a range of treatments. Additionally, the GNRI assessment was conducted only once, without monitoring changes over time during the follow-up period. GNRI relies solely on serum albumin levels and BMI, making it impossible to account for total body composition, including muscle mass, fat, and total body water. Despite adjustments for many well-known confounders, certain unknown factors could not be accounted for. Furthermore, using GNRI as the sole measure of nutritional status fails to capture comprehensive aspects of nutritional health, such as micronutrient status and dietary intake patterns. Therefore, conducting further prospective randomized controlled studies to validate our findings is crucial, emphasizing the urgency and importance of future research in this area.
Conclusion
Based on existing evidence, our findings revealed a strong association between GNRI levels and the risks of all-cause, cancer-specific, and non-cancer mortality among cancer survivors. However, it is crucial to note that this association appears to exhibit a nonlinear characteristic at very low (GNRI < 90) or very high (GNRI > 130) values, where individuals with GNRI values in these extreme ranges may face an increased risk of mortality. The clinical significance of this finding is that it advises physicians and nutrition experts to strive to maintain patients’ GNRI within an optimal range, rather than merely seeking to increase or decrease the GNRI unidirectionally. Understanding the association between GNRI and mortality among cancer survivors could aid in stratifying patients based on their risk, leading to more personalized survivorship care plans. Our findings offer new perspectives on dietary and nutritional approaches for those who have survived cancer, potentially informing personalized interventions that could improve outcomes and quality of life for this population.
Data availability statement
The original contributions presented in the study are included in the article/supplementary material. Further inquiries can be directed to the corresponding author/s.
Ethics statement
The National Center for Health Statistics Research Ethics Review Board reviewed and approved the studies involving human participants. All participants provided their written informed consent to participate in this study.
Author contributions
XQ: Writing – original draft, Methodology, Writing – review & editing, Resources. QW: Data curation, Writing – original draft. YYZ: Data curation, Writing – original draft. YJZ: Formal analysis, Writing – original draft. MY: Formal analysis, Writing – original draft. LT: Writing – review & editing.
Funding
The author(s) declare financial support was received for the research, authorship, and/or publication of this article. This work was supported by funds from the National Natural Science Foundation of China (NO.82174450) and a grant from Shanghai Clinical Medical Research Center of Traditional Chinese Medicine Oncology/the Science and Technology Commission of Shanghai Municipality (STCSM) (NO.21MC1930500).
Acknowledgments
We thank the researchers, staff, and participants of the National Health and Nutrition Examination Survey for their valuable contributions, which enabled our analysis.
Conflict of interest
The authors declare that the research was conducted in the absence of any commercial or financial relationships that could be construed as a potential conflict of interest.
Publisher’s note
All claims expressed in this article are solely those of the authors and do not necessarily represent those of their affiliated organizations, or those of the publisher, the editors and the reviewers. Any product that may be evaluated in this article, or claim that may be made by its manufacturer, is not guaranteed or endorsed by the publisher.
References
1. Sung H, Ferlay J, Siegel RL, Laversanne M, Soerjomataram I, Jemal A, et al. Global cancer statistics 2020: GLOBOCAN estimates of incidence and mortality worldwide for 36 cancers in 185 countries. CA Cancer J Clin. (2021) 71:209–49. doi: 10.3322/caac.21660
2. Siegel RL, Giaquinto AN, Jemal A. Cancer statistics, 2024. CA Cancer J Clin. (2024) 74:12–49. doi: 10.3322/caac.21820
3. Draznin B, Aroda VR, Bakris G, Benson G, Brown FM, Freeman R, et al. American Diabetes Association Professional Practice Committee. Classification and diagnosis of diabetes: standards of medical care in diabetes-2022. Diabetes Care. (2022) 45:S17–38. doi: 10.2337/dc22-S002
4. Barker LA, Gout BS, Crowe TC. Hospital malnutrition: prevalence, identification and impact on patients and the healthcare system. Int J Environ Res Public Health. (2011) 8:514–27. doi: 10.3390/ijerph8020514
5. Sacks D, Baxter B, Campbell BCV, Carpenter JS, Cognard C, Dippel D, et al. Multisociety consensus quality improvement revised consensus statement for endovascular therapy of acute ischemic stroke. Int J Stroke. (2018) 13:612–32. doi: 10.1177/1747493018778713
6. Hirahara N, Matsubara T, Fujii Y, Kaji S, Hyakudomi R, Yamamoto T, et al. Geriatric nutritional risk index as a prognostic marker of pTNM-stage I and II esophageal squamous cell carcinoma after curative resection. Oncotarget. (2020) 11:2834–46. doi: 10.18632/oncotarget.27670
7. Kanno H, Goto Y, Sasaki S, Fukutomi S, Hisaka T, Fujita F, et al. Geriatric nutritional risk index predicts prognosis in hepatocellular carcinoma after hepatectomy: a propensity score matching analysis. Sci Rep. (2021) 11:9038. doi: 10.1038/s41598–021-88254-z
8. Li L, Wang H, Yang J, Jiang L, Yang J, Wu H, et al. Geriatric nutritional risk index predicts prognosis after hepatectomy in elderly patients with hepatitis B virus-related hepatocellular carcinoma. Sci Rep. (2018) 8:12561. doi: 10.1038/s41598–018-30906–8
9. Nakayama M, Gosho M, Adachi M, Ii R, Matsumoto S, Miyamoto H, et al. The geriatric nutritional risk index as a prognostic factor in patients with advanced head and neck cancer. Laryngoscope. (2021) 131:E151–6. doi: 10.1002/lary.28587
10. Hayama T, Hashiguchi Y, Ozawa T, Watanabe M, Fukushima Y, Shimada R, et al. The preoperative geriatric nutritional risk index (GNRI) is an independent prognostic factor in elderly patients underwent curative resection for colorectal cancer. Sci Rep. (2022) 12:3682. doi: 10.1038/s41598–022-07540–6
11. Bouillanne O, Morineau G, Dupont C, Coulombel I, Vincent J-P, Nicolis I, et al. Geriatric Nutritional Risk Index: a new index for evaluating at-risk elderly medical patients. Am J Clin Nutr. (2005) 82:777–83. doi: 10.1093/ajcn/82.4.777
12. Tsukagoshi M, Araki K, Igarashi T, Ishii N, Kawai S, Hagiwara K, et al. Lower geriatric nutritional risk index and prognostic nutritional index predict postoperative prognosis in patients with hepatocellular carcinoma. Nutrients. (2024) 16:940. doi: 10.3390/nu16070940
13. Huang W, Xiao Y, Wang H, Li K. Association of geriatric nutritional risk index with the risk of osteoporosis in the elderly population in the NHANES. Front Endocrinol (Lausanne). (2022) 13:965487. doi: 10.3389/fendo.2022.965487
14. Li L, Wu M, Yu Z, Niu T. Nutritional status indices and monoclonal gammopathy of undetermined significance risk in the elderly population: findings from the national health and nutrition examination survey. Nutrients. (2023) 15:4210. doi: 10.3390/nu15194210
15. World Health Organization. (2016). Available online at: https://icd.who.int/browse10/2016/en.
16. Zhang X, Wang X, Wang M, Qu H, Hu B, Li Q. Prevalence, awareness, and treatment of isolated diastolic hypertension in the United States. Eur J Intern Med. (2023) 112:93–9. doi: 10.1016/j.ejim.2023.03.026
17. Ruan G-T, Zhang Q, Zhang X, Tang M, Song M-M, Zhang X-W, et al. Geriatric Nutrition Risk Index: Prognostic factor related to inflammation in elderly patients with cancer cachexia. J Cachexia Sarcopenia Muscle. (2021) 12:1969–82. doi: 10.1002/jcsm.12800
18. Cong M, Zhu W, Wang C, Fu Z, Song C, Dai Z, et al. Nutritional status and survival of 8247 cancer patients with or without diabetes mellitus-results from a prospective cohort study. Cancer Med. (2020) 9:7428–39. doi: 10.1002/cam4.3397
19. Nakagawa N, Maruyama K, Hasebe N. Utility of geriatric nutritional risk index in patients with chronic kidney disease: A mini-review. Nutrients. (2021) 13:3688. doi: 10.3390/nu13113688
20. Tang Q-N, Qiu H-Z, Sun X-Q, Guo S-S, Liu L-T, Wen Y-F, et al. Geriatric nutritional risk index as an independent prognostic factor in locally advanced nasopharyngeal carcinoma treated using radical concurrent chemoradiotherapy: a retrospective cohort study. Ann Transl Med. (2021) 9:532. doi: 10.21037/atm-20–6493
21. Yamana I, Takeno S, Shibata R, Shiwaku H, Maki K, Hashimoto T, et al. Is the geriatric nutritional risk index a significant predictor of postoperative complications in patients with esophageal cancer undergoing esophagectomy? Eur Surg Res. (2015) 55:35–42. doi: 10.1159/000376610
22. Shoji F, Miura N, Matsubara T, Akamine T, Kozuma Y, Haratake N, et al. Prognostic significance of immune-nutritional parameters for surgically resected elderly lung cancer patients: a multicentre retrospective study. Interact Cardiovasc Thorac Surg. (2018) 26:389–94. doi: 10.1093/icvts/ivx337
23. Qiu J, Yang J, Yu Y, Wang Z, Lin H, Ke D, et al. Prognostic value of pre-therapeutic nutritional risk factors in elderly patients with locally advanced esophageal squamous cell carcinoma receiving definitive chemoradiotherapy or radiotherapy. BMC Cancer. (2023) 23:597. doi: 10.1186/s12885–023-11044–5
24. Karayama M, Inoue Y, Yasui H, Hozumi H, Suzuki Y, Furuhashi K, et al. Association of the Geriatric Nutritional Risk Index with the survival of patients with non-small-cell lung cancer after platinum-based chemotherapy. BMC Pulm Med. (2021) 21:409. doi: 10.1186/s12890–021-01782–2
25. Zitvogel L, Pietrocola F, Kroemer G. Nutrition, inflammation and cancer. Nat Immunol. (2017) 18:843–50. doi: 10.1038/ni.3754
Keywords: geriatric nutritional risk index, NHANES, cancer survivors, mortality, older adults
Citation: Qiu X, Wu Q, Zhang Y, Zhu Y, Yang M and Tao L (2024) Geriatric nutritional risk index and mortality from all-cause, cancer, and non-cancer in US cancer survivors: NHANES 2001–2018. Front. Oncol. 14:1399957. doi: 10.3389/fonc.2024.1399957
Received: 12 March 2024; Accepted: 27 May 2024;
Published: 11 June 2024.
Edited by:
Peng Liu, Sun Yat-sen University, ChinaReviewed by:
Ziling Mao, University of Pittsburgh, United StatesXiangliang Liu, The First Hospital of Jilin University, China
Copyright © 2024 Qiu, Wu, Zhang, Zhu, Yang and Tao. This is an open-access article distributed under the terms of the Creative Commons Attribution License (CC BY). The use, distribution or reproduction in other forums is permitted, provided the original author(s) and the copyright owner(s) are credited and that the original publication in this journal is cited, in accordance with accepted academic practice. No use, distribution or reproduction is permitted which does not comply with these terms.
*Correspondence: Li Tao, dGFvbGkyMDEyMTIyOEAxNjMuY29t