 Xue Ren1†Ying Zhao1†Nan Wang1Jiahui Liu2Shuo Zhang1Mingrui Zhuang3
 Hongkai Wang3Jixiang Wang2Yindi Zhang2
 Qingwei Song1
 Ailian Liu1*
- 1Department of Radiology, The First Affiliated Hospital of Dalian Medical University, Dalian, China
- 2College of Medical Imaging, Dalian Medical University, Dalian, China
- 3College of Biomedical Engineering, Dalian University of Technology, Dalian, China
Objective: To investigate the value of the combined application of intravoxel incoherent motion (IVIM) and enhanced T2*-weighted angiography (ESWAN) for preoperative prediction of microvascular invasion (MVI) in hepatocellular carcinoma (HCC).
Materials and methods: 76 patients with pathologically confirmed HCC were retrospectively enrolled and divided into the MVI-positive group (n=26) and MVI-negative group (n=50). Conventional MRI, IVIM, and ESWAN sequences were performed. Three region of interests (ROIs) were placed on the maximum axial slice of the lesion on D, D*, and f maps derived from IVIM sequence, and R2* map derived from ESWAN sequence, and intratumoral susceptibility signal (ITSS) from the phase map derived from ESWAN sequence was also automatically measured. Receiver operating characteristic (ROC) curves were drawn to evaluate the ability for predicting MVI. Univariate and multivariate logistic regression were used to screen independent risk predictors in clinical and imaging information. The Delong’s test was used to compare the differences between the area under curves (AUCs).
Results: The D and D* values of MVI-negative group were significantly higher than those of MVI-positive group (P=0.038, and P=0.023), which in MVI-negative group were 0.892×10⁻³ (0.760×10⁻³, 1.303×10⁻³) mm2/s and 0.055 (0.025, 0.100) mm2/s, and in MVI-positive group were 0.591×10⁻³ (0.372×10⁻³, 0.824×10⁻³) mm2/s and 0.028 (0.006, 0.050)mm2/s, respectively. The R2* and ITSS values of MVI-negative group were significantly lower than those of MVI-positive group (P=0.034, and P=0.005), which in MVI-negative group were 29.290 (23.117, 35.228) Hz and 0.146 (0.086, 0.236), and in MVI-positive group were 43.696 (34.914, 58.083) Hz and 0.199 (0.155, 0.245), respectively. After univariate and multivariate analyses, only AFP (odds ratio, 0.183; 95% CI, 0.041–0.823; P = 0.027) was the independent risk factor for predicting the status of MVI. The AUCs of AFP, D, D*, R2*, and ITSS for prediction of MVI were 0.652, 0.739, 0.707, 0.798, and 0.657, respectively. The AUCs of IVIM (D+D*), ESWAN (R2*+ITSS), and combination (D+D*+R2*+ITSS) for predicting MVI were 0.772, 0.800, and, 0.855, respectively. When IVIM combined with ESWAN, the performance was improved with a sensitivity of 73.1% and a specificity of 92.0% (cut-off value: 0.502) and the AUC was significantly higher than AFP (P=0.001), D (P=0.038), D* (P=0.023), R2* (P=0.034), and ITSS (P=0.005).
Conclusion: The IVIM and ESWAN parameters showed good efficacy in prediction of MVI in patients with HCC. The combination of IVIM and ESWAN may be useful for noninvasive prediction of MVI before clinical operation.
1 Introduction
Hepatocellular carcinoma (HCC) is the sixth most common cancer and the fourth leading cause of cancer-related deaths in the world (1). Liver resection, transplantation, and ablation are recommended as the most effective treatments of early stage HCC, and surgical resection is considered to be the best method for patients with well-preserved liver function (2). However, numerous clinical studies have indicated that the 5-year recurrence rate of HCC after surgery is as high as 70% (3).
Scholars have found that microvascular invasion (MVI) is the independent risk factor of early recurrence in HCC (4). In the presence of MVI, tumor cells can spread and metastasize in the liver, leading a portal vein tumor thrombus or distant metastasis (5). A previous study (6) reported that the 1-year recurrence rates for patients with and without MVI after curative resection for HCC were 23.3% and 7.5%, respectively. For HCC with MVI, anatomical resection is more recommended than non-anatomical resection (7), and resection with wide margin (margin ≥ 1 cm) is more recommended than narrow margin (8). Therefore, preoperative prediction of MVI is crucial for decision-making of surgical resection for patients with HCC (9).
MVI is diagnosed only by histopathological examination after operation or biopsy. However, the heterogeneity of HCC may lead to false-negative results (10). In addition, invasiveness of operation and time consumption also limit its usefulness on clinical-decision making. Magnetic resonance imaging (MRI) can effectively diagnose liver tumors, and the information reflecting the fine structure of organs in MRI can be mined. MRI-based radiological features can be used to detect MVI (11). Scholars found that larger tumor size (12), rim arterial enhancement (13), arterial peritumoral enhancement (14), and nonsmooth tumor margin (15) were significantly associated with MVI. However, the review of medical images rely on subjective experience, which lead to the inconsistency of the results (16).
Oxygen deficiency will occur if the blood oxygen level cannot meet the vigorous metabolic demand of tumor cells (16). Hypoxia has been proved to enhance the proliferation and angiogenesis of HCC, leading to an overall increase in tumor invasion (17). It is confirmed that the change of transverse relaxation rate of tissue R2* is linear with the concentration of deoxyhemoglobin, which can be used to detect the blood oxygen level of tumor (18). Enhanced T2*-weighted angiography (ESWAN) combines a unique 3D T2* based on multi-echo acquisition with a special reconstruction algorithm to obtain phase, magnitude, T2*, and R2* maps. ESWAN not only visualizes and delineates small vessels and microbleeds, but also helps to observe the physiological and pathological conditions (19). Automatically quantitative intratumoral susceptibility signal (ITSS) which is generated from phase image of ESWAN can reflect the neovascularization and hemorrhage in tumor (20) and the tumor angiogenesis can also directly lead to the occurrence of MVI (21). Studies have showed the effectiveness of ITSS in the assessment of intratumoral vascularity in HCC using subjective and objective semi-quantitative methods (22). Intravoxel incoherent motion (IVIM) applies multiple b values and biexponential models for the acquisition and analysis of images, which can distinguish information regarding the pure tissue diffusion of water molecules and microcirculation perfusion without the use of contrast agent (23), reflecting the tissue density and blood supply status. The changes of microcirculation and microstructure in tumor tissue may be related to the status of MVI (24).
The purpose of this study was to investigate the value of the combined application of ESWAN (R2*+ITSS) and IVIM (D+D*+f) for prediction of MVI in patients with HCC, which may help clinicans choose appropriate surgical procedures based on risk-benefit assessment.
2 Materials and methods
2.1 Patients
This retrospective study was approved by the Institutional Review Board of our hospital and the requirement for informed consent was waived because of the retrospective nature of the study. From January 2018 to August 2021, a total of 101 consecutive patients with HCC who underwent upper abdominal MR examination were retrospectively collected. Patients meeting the following criteria were included: ①patients with pathologically confirmed HCC after surgical resection; ②patients underwent abdominal MR examination on 3.0 Tesla MR scanner within 2 weeks before resection. The exclusion criteria were as follows: ①patients had received other treatments prior to preoperative MR examination such as transarterial chemoembolization (TACE), radiofrequency ablation (RFA) or chemotherapy (n=2); ②patients with incomplete clinical information (n=1); ③patients with incomplete IVIM or ESWAN scan (n=5); ④poor image quality (n=8); ⑤unavailable of the pathological indicator of MVI (n=9). Finally, a total of 76 patients were included in the study. Flowchart of the study population is shown in Figure 1.
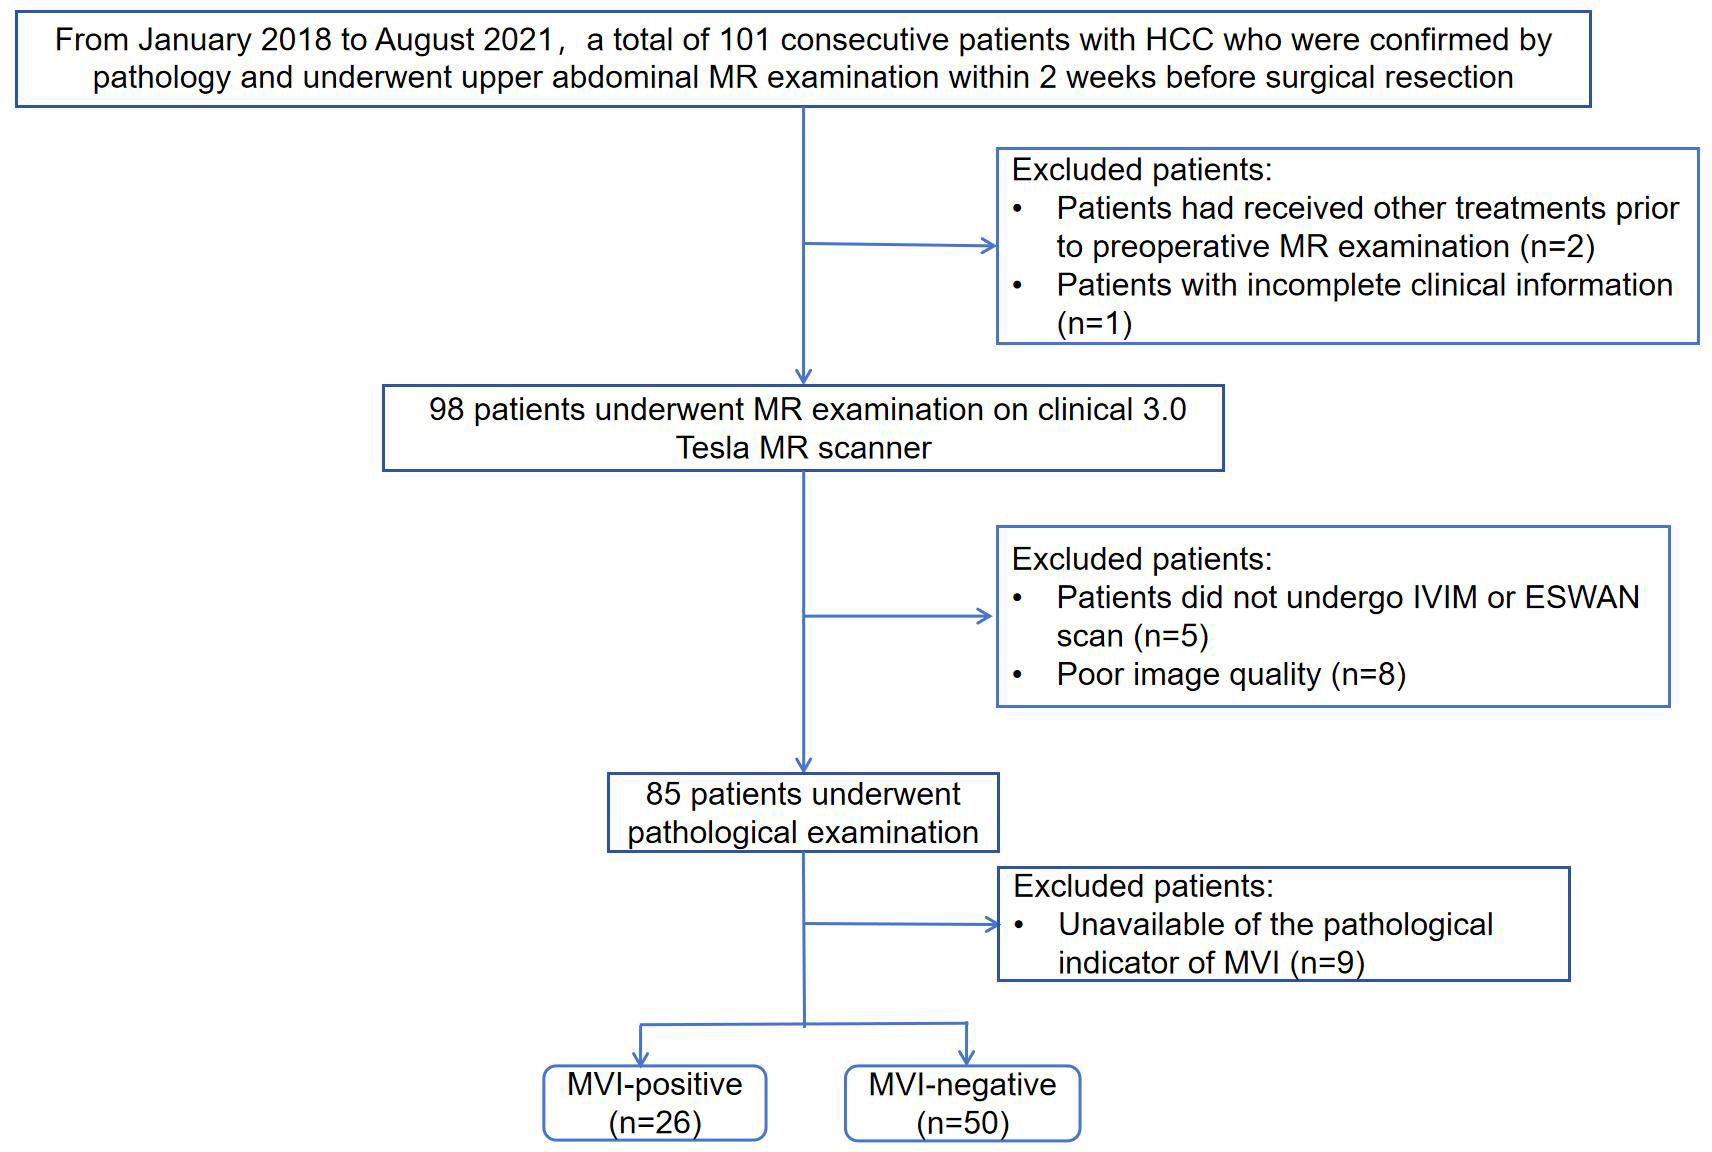
Figure 1. Flowchart of the study population.
Baseline clinical information, including age, gender, history of hepatitis, alanine aminotransferase level (ALT), aspartate aminotransferase (AST), γ-Glutamyltransferase (GGT), total bilirubin (TBIL), alpha fetoprotein (AFP), carcinoembryonic antigen (CEA), and Child-Pugh class, within one week before surgery were collected.
2.2 Histopathological examination
Hepatic specimens resected by surgery were used for the hispathological evaluation. All hispathological examinations were performed by a team of pathologists, each individual with more than 10 years of experience in evaluating histopathological slices. The pathologists who were blinded to all clinical and imaging results reviewed the H and E-stained slides and confirmed the hispathological diagnosis. MVI was defined as the tumor within a vascular space lined by endotheliumon miscroscopy. The MVI grades were recorded by the following criteria: ①M0: no MVI; ②M1 or low risk: MVI < 5 vessels and ≤ 1 cm away from the adjacent peritumoral liver tissue; and ③M2 or high risk: MVI > 5 vessels or > 1 cm away from the adjacent peritumoral liver tissue (5). M1 and M2 were classified as MVI-positive group and M0 as MVI-negative group.
2.3 MR imaging
All patients performed MR examnination using a 3.0T MR scanner (Signa Excite HDxt, General Electric Healthcare, Milwaukee, WI, USA) with an 8-channel phased-array body coil. The patients were fasted for 4–6 hours and trained to exhale and hold their breath for more than 20 seconds before scanning. The patients were examined in the supine position. Conventional MR scanning sequences included fast spoiled dual-echo T1-weighted gradient-recalled-echo imaging (in phase and opposed-phase), fat-suppressed fast spin-echo T2-weighted imaging (T2WI), and liver acceleration volume acquisition (LAVA) acquired with gradient recalled echo sequence at arterial phase (40 s), portal venous phase (70 s), and delayed phase (90 s). The IVIM sequence was collected under free breathing, and a total of 12 b-values were selected (0, 20, 50, 100, 150, 200, 400, 800, 1200, 2000, 3000, and 4000 s/mm2). The ESWAN sequence was acquired using a 3D-enhanced T2* susceptibility-weighted angiography with contrast flow compensated multi-echo gradient echo sequence. The detailed parameters of each acquisition sequence are shown in Table 1.
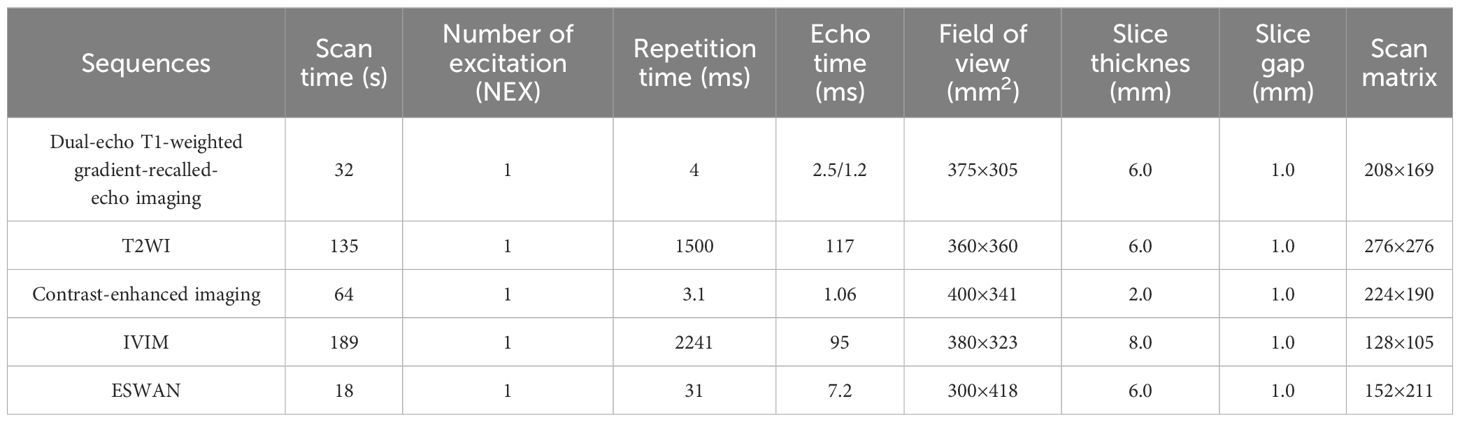
Table 1. The detailed parameters of each acquisition sequence.
2.4 Radiological features evaluation
The imaging features were analyzed independently by two experienced radiologists (reviewers 1 and 2, X.R. and Y.Z., with 3 and 8 years of experience in abdominal MRI diagnosis, respectively) who were blinded to the clinical data, imaging reports, and pathological findings. The consensus was achieved by discussion when there was a disagreement between two radiologists.
The two experienced radiologists recorded the following features: ①tumor number: single or multinodular; ②tumor size, defined as the largest diameter of the tumor; ③tumor margin: defined as smooth or irregular margin; ④tumor capsule: defined as a rim of increasing enhancement surrounding the tumor in the delayed phase; ⑤enhancement pattern: typical (arterial phase washin and portal venous or delayed phase washout) or atypical enhancement pattern (hypovascular lesions which only showed washin or washout); ⑥peritumoral enhancement: the tumor border with detectable enhancement in the arterial phase and becoming isointensity in the portal venous or delayed phase compared with the background liver parenchyma (25).
2.5 Imaging analysis
The IVIM and ESWAN raw data were transferred to the AW 4.6 workstation (GE Healthcare). The Functool software was used to generate IVIM and ESWAN parametric maps and quantify corresponding parameters. The parameters were measured independently by two radiologists (reviewers 1 and 2, X.R.and Y.Z.) who were blinded to clinical and pathological information of the patients. Referring to the lesion location information obtained on T2W images, the radiologists manually placed three region of interests (ROIs) (100 - 200 mm2) on the largest slice of the lesion (26) on D, D*, and f maps derived from IVIM sequence, and R2* map derived from ESWAN sequence (Figures 2, 3). The ROIs were required to avoid the hemorrhage, calcify, and necrotic areas. For HCC patients with multiple lesions, the largest lesion was selected for analysis (27). The average value of each parameter was used for statistical analysis.
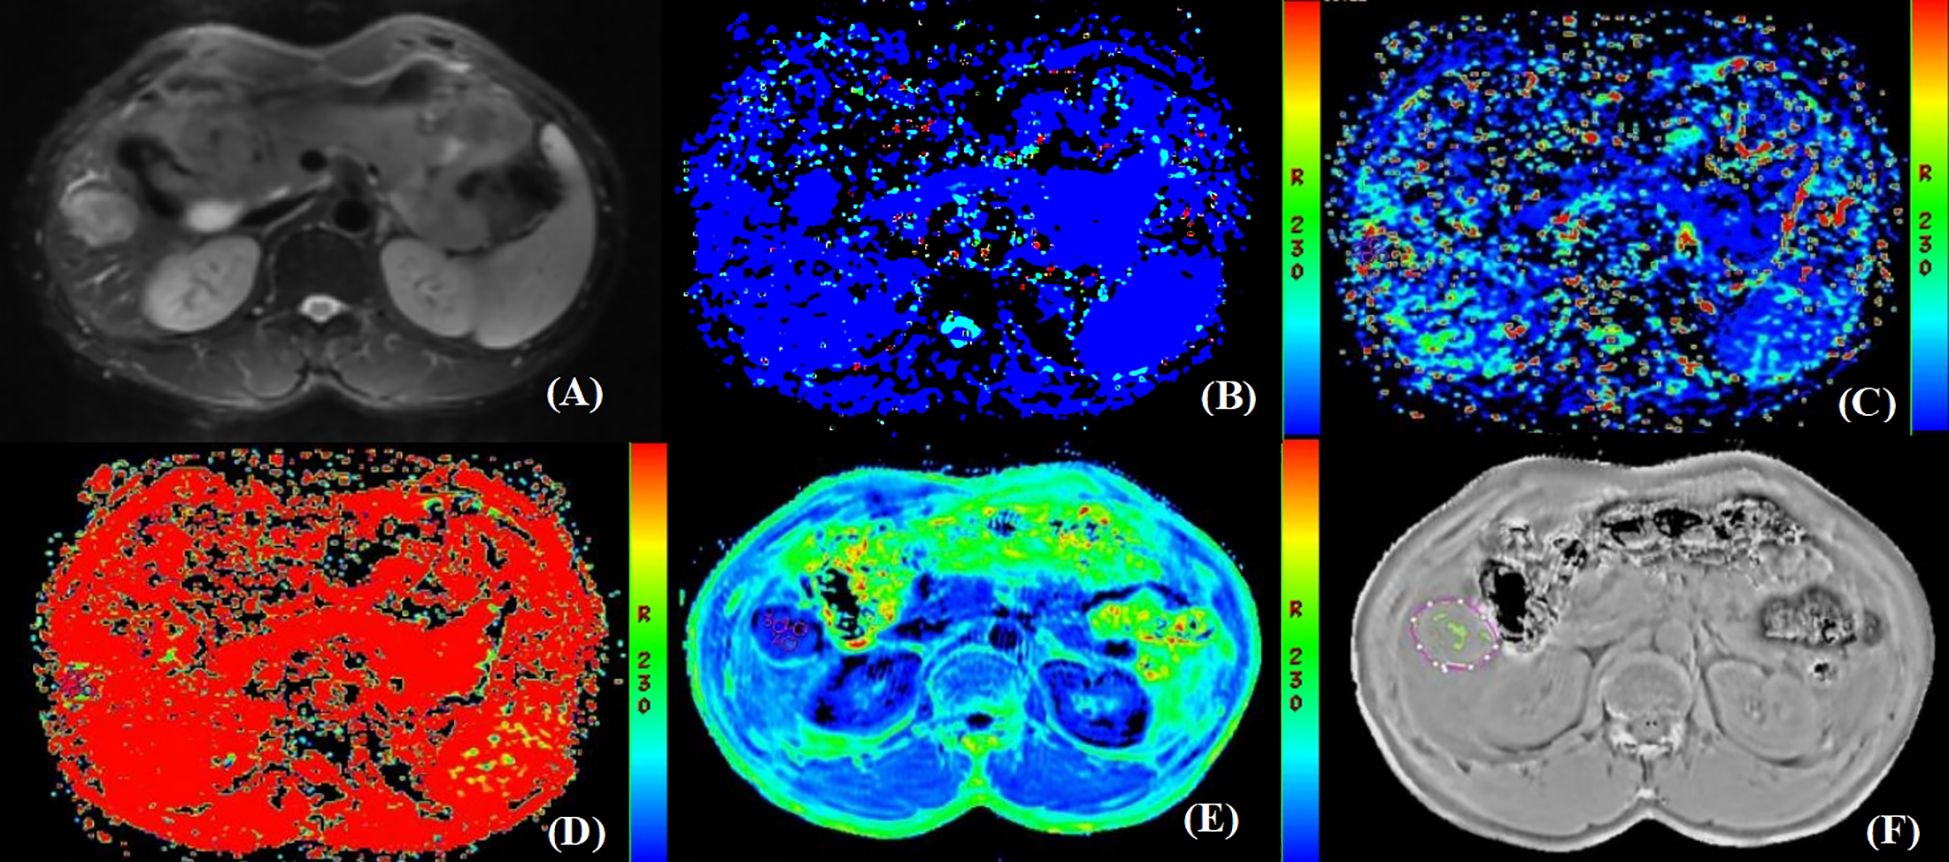
Figure 2. Pathologically confirmed HCC with MVI in a 66-year-old male. (A) T2W image. The circular lesion in the hepatic right lobe presented with a slightly high signal intensity and a clear boundary. (B–E) Parametric maps (D, D*, f, and R2*, respectively). The calculated average values of D, D*, f, and R2* for the drawn ROIs were 0.402×103mm2/s, 0.032mm2/s, 0.435×100%, and 45.482Hz, respectively. (F) The ROIs were delineated along the tumor edge and the ITSS-ratio was automatically calculated which showed as the green area within the tumor. The ITSS-ratio was 0.200.
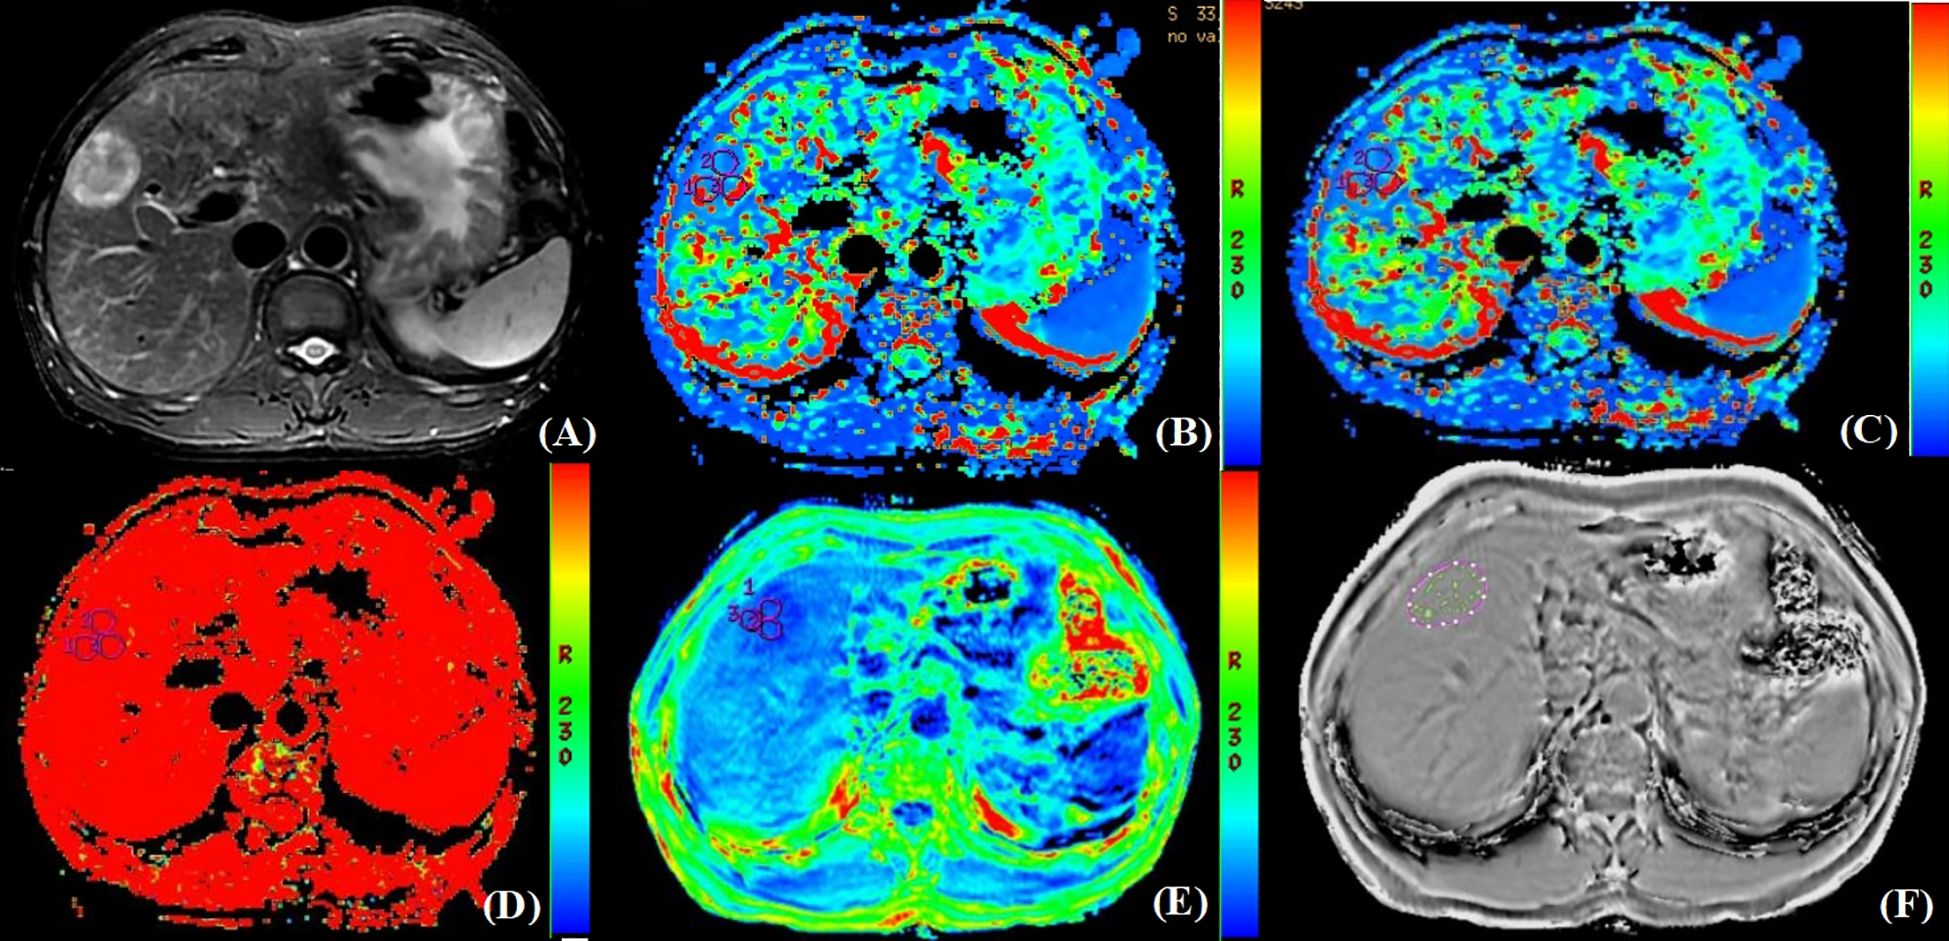
Figure 3. Pathologically confirmed HCC without MVI in a 62-year-old male. (A) T2W image. The circular lesion in the hepatic right lobe presented with a high signal intensity and a clear boundary. (B–E) Parametric maps (D, D*, f, and R2*, respectively). The calculated average values of D, D*, f, and R2* for the drawn ROIs were 1.480×103mm2/s, 0.130 mm2/s, 0.471×100%, and 25.625Hz, respectively. (F) The ROIs were delineated along the tumor edge and the ITSS-ratio was automatically calculated which showed as the green area within the tumor. The ITSS-ratio was 0.031.
Furthermore, the ITSS was automatically calculated using the Anatomy Sketch (A.S.) software (Dalian University of Technology). Firstly, we removed the artifacts of the phase map obtained by processing ESWAN sequence. Secondly, the phase map in NII format after artifact removal was imported into A.S. software, the lesion was identified by two radiologists according to the axial T2W image by double-blind method, and then three ROIs were delineated along the tumor edge in the first layer, the last layer and any layer between them on the phase map. Finally, the A.S. software was used to automatically calculate the ITSS ratio of the largest layer of the tumor (Figures 2, 3).
2.6 Statistical analysis
The SPSS 27.0 software (SPSS Inc., Chicago, IL, USA) was used for statistical analyses. For categorical variables, the interobserver agreement was assessed by using the kappa test. The agreement was interpreted as a slight, fair, moderate, substantial, and almost perfect agreement when the estimated kappa values were 0–0.20, 0.21–0.40, 0.41–0.60, 0.61–0.80, and over 0.80, respectively. Categorical variables were recorded as the number of cases and percentages, and χ2 or Fisher’s exact test was used to compare the difference between MVI-positive and MVI-negative groups.
For continuous variables, the intraclass correlation coefficient (ICC) was used to evaluate the consistency between the two observers (ICC value < 0.4 indicated poor consistency, ICC value > 0.75 indicated good consistency). The normality of the variables was tested by the Shapiro-Wilk test. Normally distributed data were expressed as means ± standard deviations, and non-normally distributed data were expressed as medians and ranges (25th, 75th percentiles). The significance of the inter-group difference was determined using the independent sample t-test or Mann-Whitney U-test for normally or non-normally distributed data. Univariate and multivariate logistic regression analyses were used to screen the independent risk factors of MVI. Logistic regression analysis was used to generate the predicted probability of MVI for the IVIM, ESWAN, and the combination of IVIM and ESWAN parameters. Receiver operating characteristic (ROC) curves were drawn to evaluate the ability for predicting MVI. The cutoff point was selected by using the maximized value of Youden index, and sensitivity and specificity at the threshold value were determined. The Delong’s test was used to compare the differences between the AUCs. A P value less than 0.05 was considered to indicate a statistical significance.
3 Results
3.1 Clinical and imaging characteristics
This study included 76 HCC lesions from 76 patients (57 males; mean age, 60.16 ± 9.05 years; range, 31–80 years). According to the histopathological reports, 26 patients were MVI-positive (17 cases were classified as M1 and 9 cases were classified as M2) and 50 patients were MVI-negative (50 cases were classified as M0). Among 76 patients, 9 cases were multiple HCC. Clinical and imaging characteristics of all patients are summarized in Table 2. The ALT (P=0.009), AST (P=0.039), AFP (P=0.003), tumor size (P=0.008), and peritumoral enhancement (P=0.022) showed statistically significant differences between the MVI-positive and MVI-negative groups. After univariate and multivariate analyses, only AFP (odds ratio, 0.183; 95% CI, 0.041–0.823; P = 0.027) was the independent risk factor for predicting the status of MVI (Table 3). The AUC of AFP for prediction of MVI were 0.652, with a sensitivity of 92.0% and a specificity of 38.5% (cut-off value: 1.500).
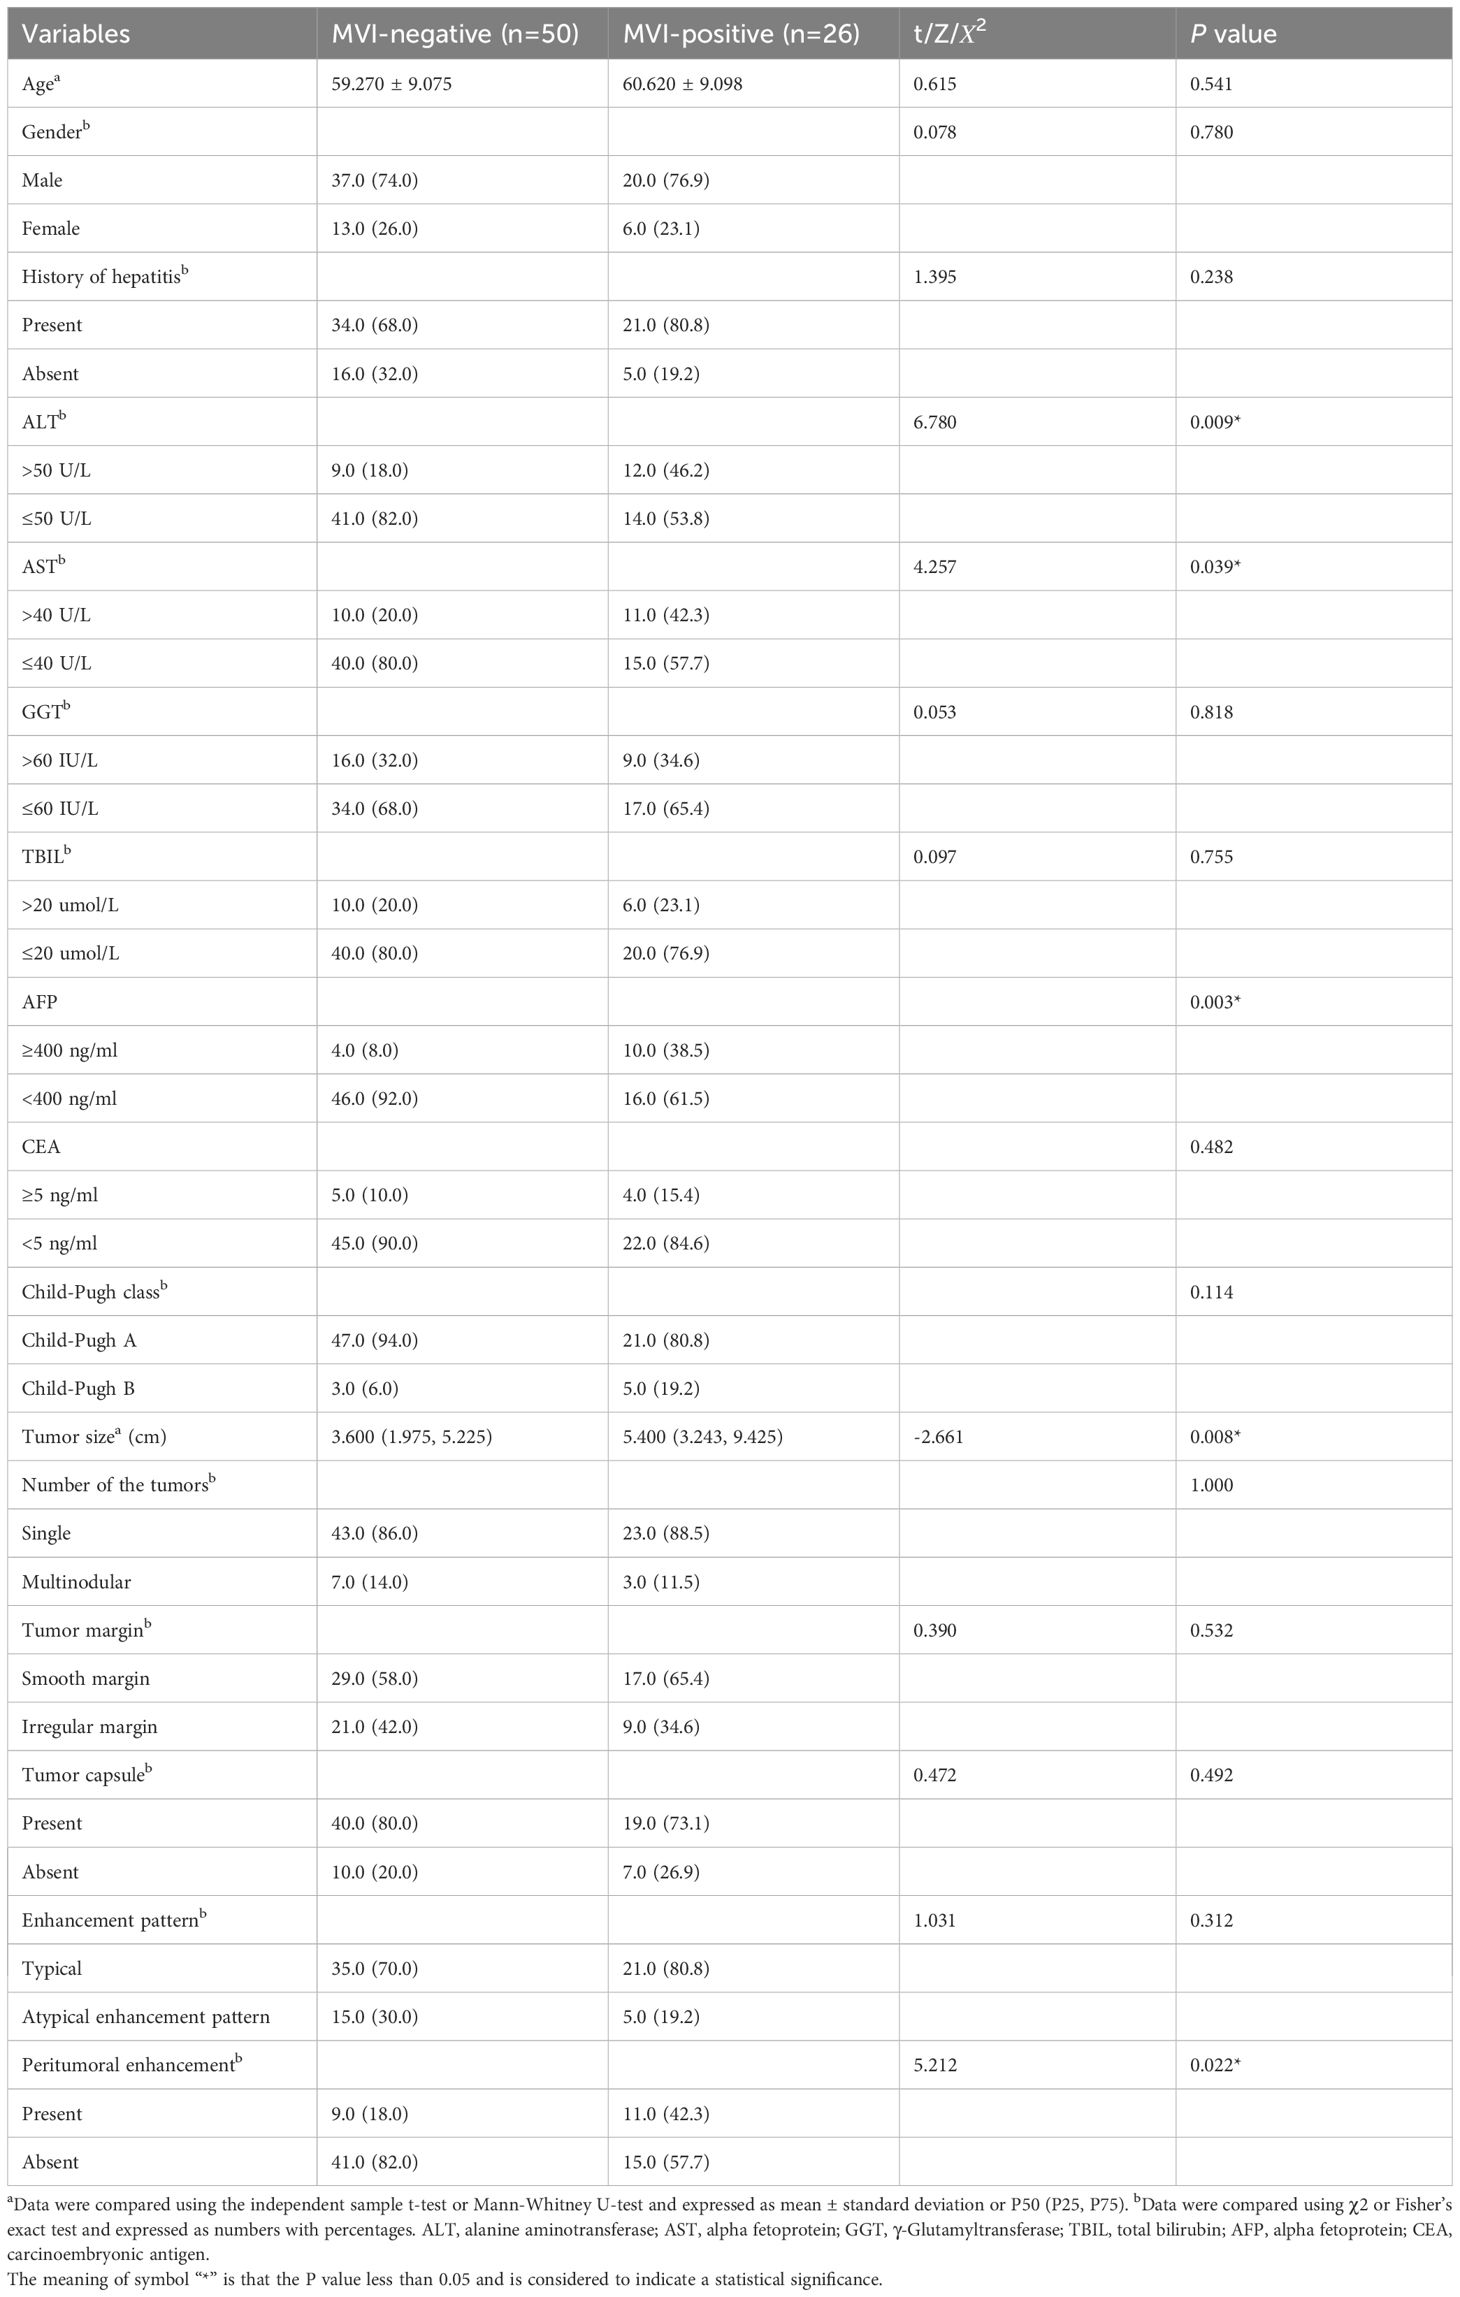
Table 2. Clinical and imaging characteristics of patients.
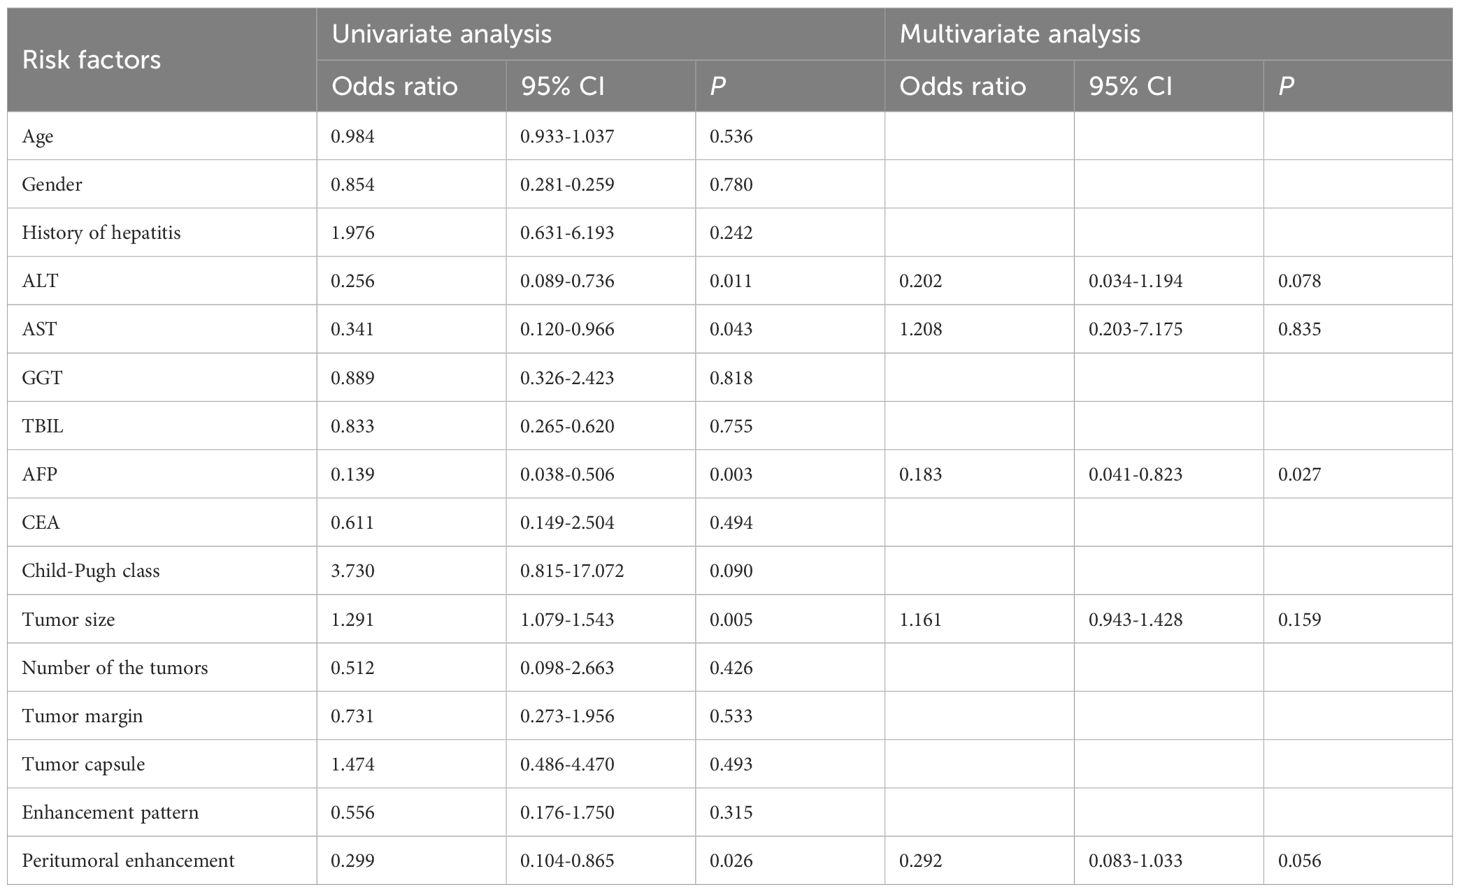
Table 3. Univariate and multivariate analyses of clinical and imaging characteristics for predicting MVI status.
3.2 Interobserver agreement analysis of continuous and categorical variables
As shown in Table 4, the agreements of categorical variables evaluated by the two observers were all excellent (kappa>0.80) and the agreements of continuous variables between the two observers were all in good (ICC>0.75).
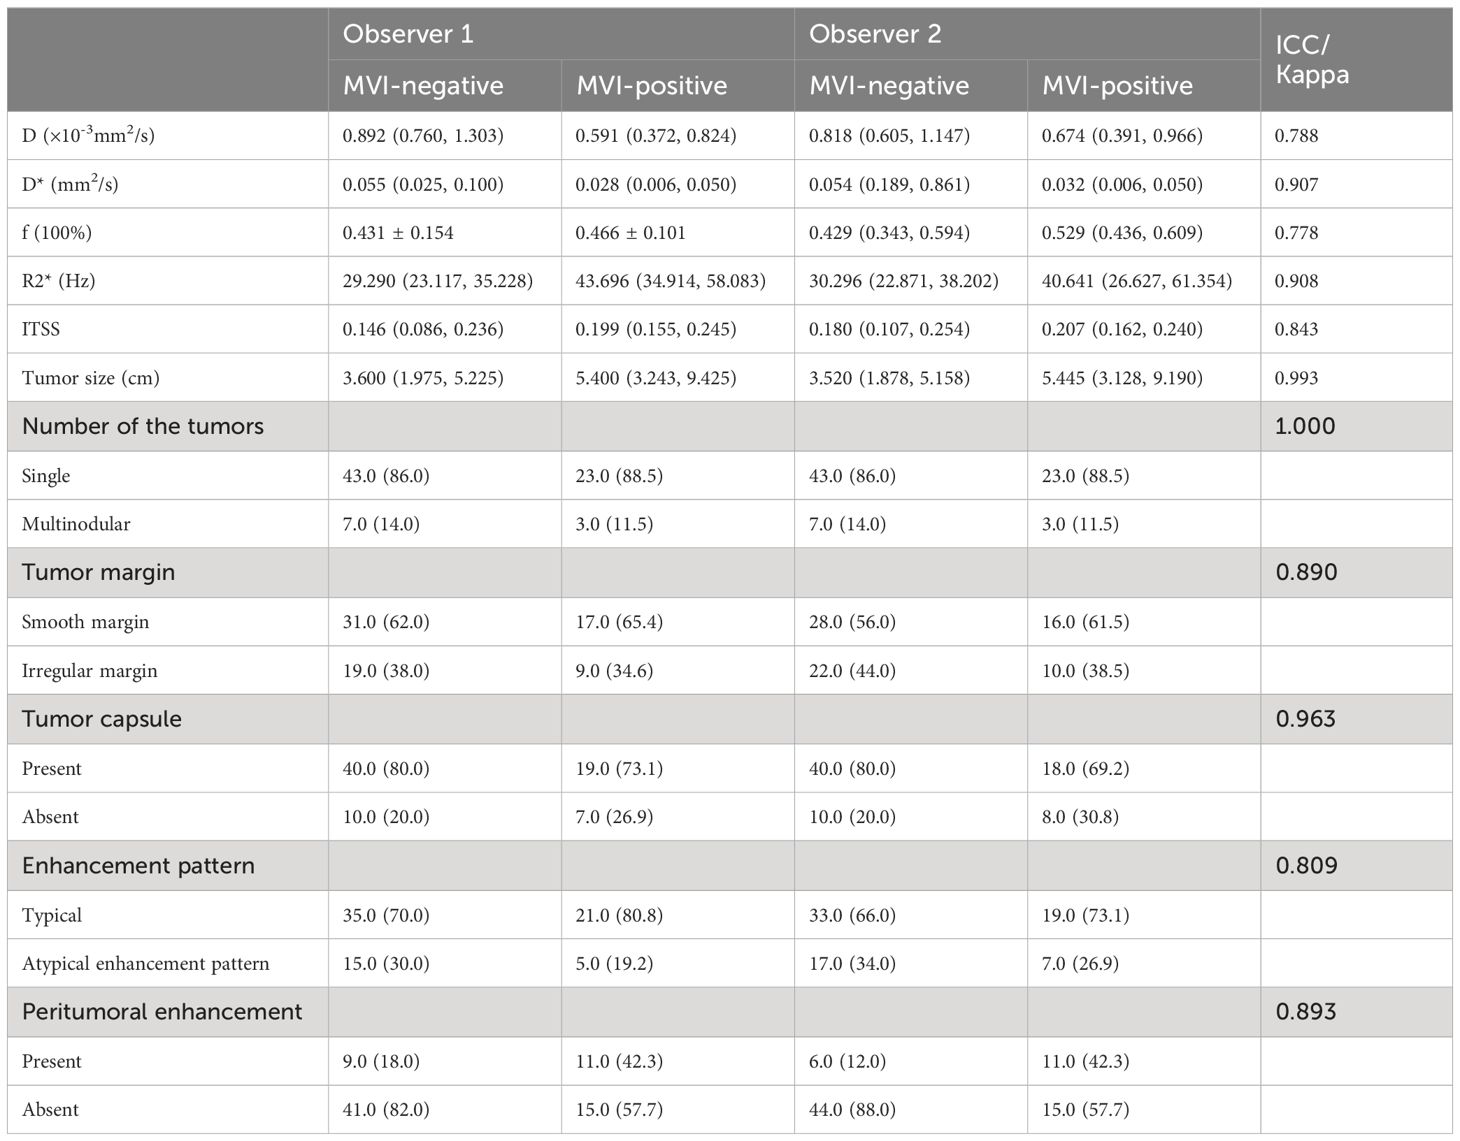
Table 4. The agreement analysis of continuous and categorical variables between the two observers.
3.3 Comparisons of IVIM and ESWAN parameters between the two groups
As shown in Table 5, there were statistically significant differences in D (P<0.001), D* (P=0.003), R2* (P<0.001), and ITSS (P=0.025) between MVI-positive and MVI-negative groups. The D and D* values of MVI-negative group were significantly higher than those of MVI-positive group, which in MVI-negative group were 0.892×10⁻³ (0.760×10⁻³, 1.303×10⁻³) mm2/s and 0.055 (0.025, 0.100) mm2/s, and in MVI-positive group were 0.591×10⁻³ (0.372×10⁻³, 0.824×10⁻³) mm2/s and 0.028 (0.006, 0.050) mm2/s, respectively. The R2* and ITSS values of MVI-negative group were significantly lower than those of MVI-positive group, which in MVI-negative group were 29.290 (23.117, 35.228) Hz and 0.146 (0.086, 0.236), and in MVI-positive group were 43.696 (34.914, 58.083) Hz and 0.199 (0.155, 0.245), respectively. No statistical significance was observed for f (P=0.239) value in those patients with MVI-positive group compared with MVI-negative group (Figures 2, 3).
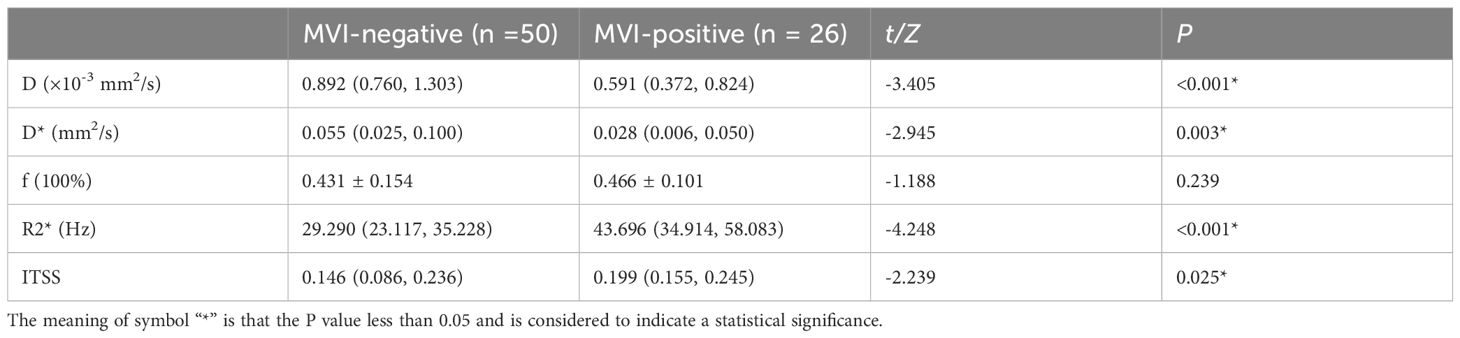
Table 5. Comparisons of IVIM and ESWAN parameters between MVI-positive and MVI-negative groups.
The AUCs of D, D*, R2*, and ITSS for prediction of MVI were 0.739, 0.707, 0.798, and 0.657, respectively (Table 6, Figure 4). The AUCs of IVIM (D+D*), ESWAN (R2*+ITSS), and combination (D+D*+R2*+ITSS) were 0.772, 0.800, and 0.855, respectively (Table 5, Figure 4). When IVIM combined with ESWAN, the performance was improved with a sensitivity of 73.1% and a specificity of 92.0% (cut-off value: 0.502) and was significantly higher than AFP (P=0.001), D (P=0.038), D* (P=0.023), R2* (P=0.034), and ITSS (P=0.005), respectively.
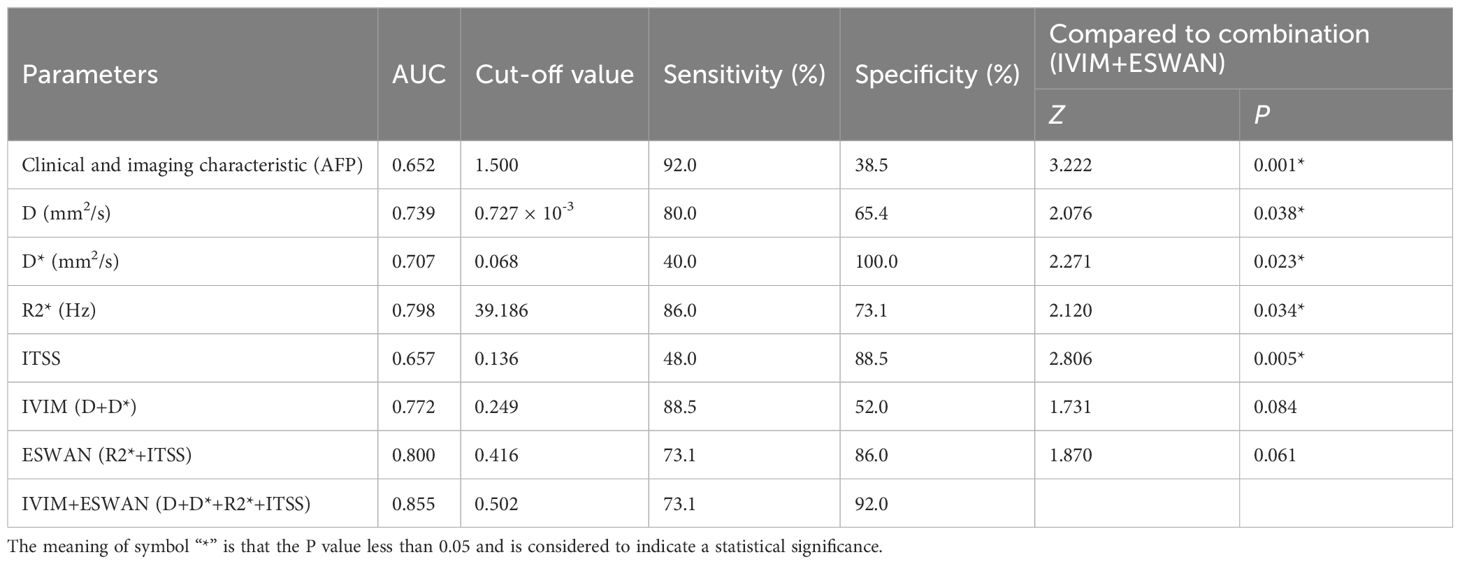
Table 6. Predictive performance of clinical and imaging characteristic, IVIM and ESWAN parameters between MVI-positive and MVI-negative groups.
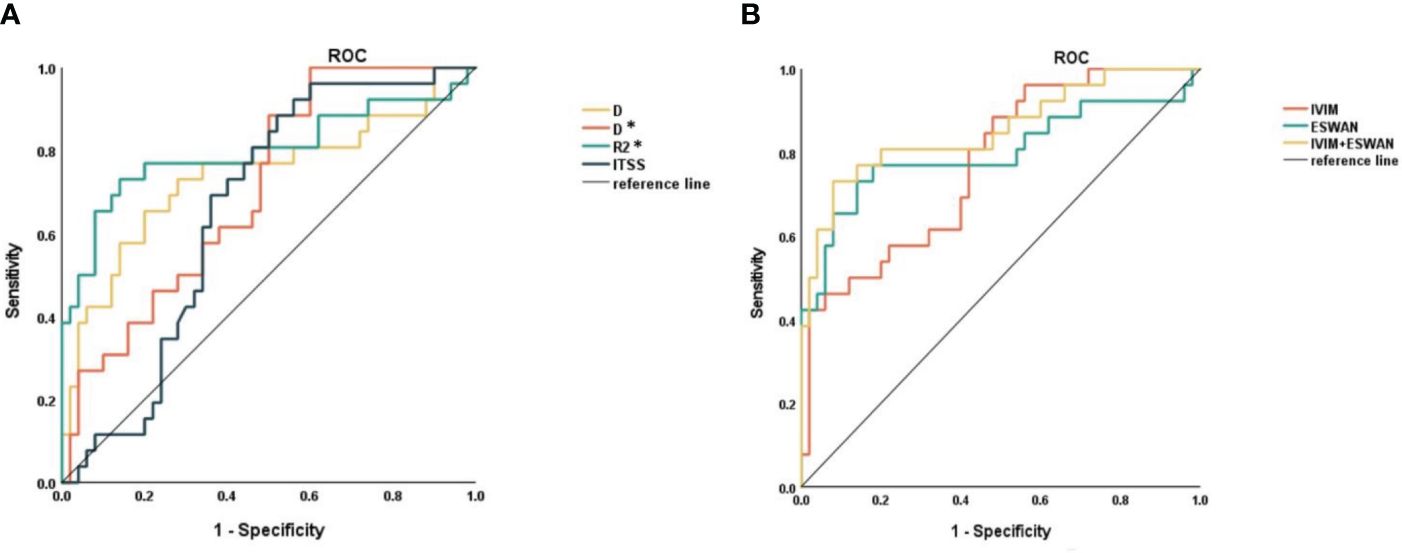
Figure 4. (A) ROC curves of D, D*, R2*, and ITSS for distinguishing MVI-positive and MVI-negative in HCC. (B) ROC curves of IVIM, ESWAN, and combination for distinguishing MVI-positive and MVI-negative in HCC.
4 Discussion
The major finding of this work was that both IVIM and ESWAN quantitative parameters could be used to preoperatively predict MVI status of HCC. We found that D and D* values were significantly decreased, while R2* and ITSS values were significantly increased with the presence of MVI in HCC. And the combination of IVIM and ESWAN parameters showed better discriminative efficacy in comparison with clinical and imaging characteristics, individual IVIM/ESWAN parameter or sequence separately for prediction of MVI in patients with HCC. Our finding may be useful to provide optimized treatment and achieve long-term survival for patients with HCC.
Some researchers reported that D value derived from IVIM was an independent risk factor for predicting MVI in HCC (24, 25), but there is a certain limitation in the number of patients and the predictive performances need to be improved. In our study, both D and D* in HCC with the presence of MVI were significantly lower than those in HCC patients without MVI. This maybe because that the presence of MVI increases the infiltration of tumor cells, provides more nutrients for tumor cell proliferation, and makes the tumor cell structure more dense, thus limiting the diffusion of water molecules (24), resulting in decreased D value. MVI may cause decreased perfusion through occlusion of microvessels, thus resulting in decreased D* value.
R2* value, the transverse relaxation rate, is quantitative index to evaluate the change of oxygen contents in local tissues, and is related to hypoxia, bleeding, abnormal blood vessels and other factors. Deoxyhemoglobin, metallohemoglobin, hemoglobin, ferritin, and calcification, as magnetically sensitive materials, can produce small magnetic fields. These materials result in an inhomogeneity of the local field, change the phase of the proton’s spin, and accelerate the decay of the signal intensity; thus, the R2* value increases (28). ESWAN is extremely sensitive to paramagnetic deoxyhemoglobin and hemosiderin, so oxygenation levels in the tissues can be detected by measuring the R2* value (29). Chen et al. (30) found that ESWAN was better at identifying certain morphologic features such as pseudocapsule and hemorrhage than conventional MRI without using a contrast agent in HCC patients. Studies have showed that the sensitivity and specificity of R2* in distinguishing HCC from hepatic cavernous hemangioma were 96.20% and 97.80% and the AUC for the diagnosis of HCC is 0.994, respectively (31). By quantitative analysis of R2* value obtained by post-processing post oxygen (O2) breathing BOLD MRI, Kartiketal et al. (32) found that the R2* value between the groups with and without MVI was not significantly different statistically. Since then, no relevant studies using R2* value to predict MVI status of HCC have been reported. Our study showed that R2* was significantly higher in the MVI-positive group than that in the MVI -negative group. This may be due to more malformed neovascularization and higher metabolism in the MVI-positive group, leading to tumor being in a state of relative oxygen deficiency. The reasons for the difference from the previous results are as follows: BOLD MRI analysis is more susceptible to the stimulation intensity and stimulation time due to its imaging method, which lead to the lack of stability and reliability of the quantitative analysis results of BOLD imaging. Secondly, the higher field intensity (3.0T) used in our study will enlarge the R2* quantitative spectrum and may be more sensitive to the difference of oxygen content.
ITSS are low signal areas in the tumor that presents as continuous dots or thin lines on the phase map. Probably due to angiogenesis and increased blood supply, the tumor contains a relatively large amount of deoxyhemoglobin, which generates susceptibility effects and causes signal-intensity loss (33). Yang et al. (22) demonstrated that ITSS could provide a new biomarker for evaluating the antiangiogenic effect of sorafenib in HCC. At present, the evaluation of ITSS is mainly based on its size and frequency, but manual evaluation is time-consuming, laborious and subjective. Bhattacharjee et al. (34) used MATLAB software to quantify ITSS for predicting MVI in hepatitis B virus-related combined HCC and cholangiocarcinoma, which can quantify the volume of ITSS in the whole tumor, but it is only suitable for tumors with ITSS visible to the naked eye, and the image has not been artifact-removed, which may lead to inaccurate results. In our study, automatic extraction and quantitative ITSS are used for the first time to predict MVI of HCC, which is simple and easy to operate, and there is no need to pre-screen the images of ITSS visible to the naked eye. In addition, phase map is used to remove artifacts, which is more suitable for abdominal organs prone to motion artifacts. The result of our study showed that the ITSS of MVI-positive group was significantly higher than that of the MVI-negative group, suggesting a higher microvascular density with the presence of MVI. This is consistent with the pathological process of MVI. The irregular course of tumor blood vessels increases blood flow resistance, prolongs blood retention time, overuses blood oxygen, and leads the increase of deoxyhemoglobin and its oxidized products. Ultimately, the ITSS increases.
In our study, only AFP was the independent risk factor in clinical characteristics for predicting the status of MVI, which was consistent with the previous study (35), suggesting that high levels of AFP can respond to tumor cell invasion (36). The AUC of AFP for prediction of MVI was 0.652, and was significantly lower than the combination of IVIM and ESWAN (P=0.001).
Our study has several limitations. Firstly, this was a retrospective study and the sample size was relatively small. We will collect more cases prospectively from our center or other centers to validate the reliability of our results in the following research. Secondly, we did not evaluate MVI on a per-lesion basis but on a per-patient basis. We are unable to correlate the ROI we plotted on MR images with site-by-site pathological vascular invasion. Thirdly, measurements were not obtained from the entire volume of tumors, but in its largest dimension, so part of information about the tumor’s heterogeneity may have been missed. The whole tumor will be measured in the future research. Fourthly, previous studies (37, 38) have shown that the imaging features around the tumor are good predictors for MVI status, we will perform EAWAN and IVIM quantitative analysis of peritumoral areas in the follow-up study.
In our study, we combined the quantitative parameters of IVIM and ESWAN sequences and automatic extraction and quantification of ITSS to analyze the perfusion and oxygenation levels in HCC with or without MVI. The IVIM and ESWAN parameters showed good efficacy in prediction of MVI in patients with HCC. The combination of IVIM and ESWAN may be useful for noninvasive prediction of MVI before clinical operation, which may potentially aid in improving the prediction of HCC patients’ survival and preventing recurrence and metastasis.
Data availability statement
The raw data supporting the conclusions of this article will be made available by the authors, without undue reservation.
Ethics statement
The studies involving humans were approved by Ethics Committee of The First Affiliated Hospital of Dalian Medical University. The studies were conducted in accordance with the local legislation and institutional requirements. This retrospective study was approved by the Institutional Review Board of our hospital and the requirement for informed consent was waived because of the retrospective nature of the study.
Author contributions
XR: Conceptualization, Formal analysis, Investigation, Methodology, Validation, Writing – original draft. YiZ: Conceptualization, Formal analysis, Investigation, Writing – review & editing, Visualization. NW: Formal analysis, Investigation, Writing – review & editing, Funding acquisition, Validation. JL: Formal analysis, Investigation, Writing – original draft. SZ: Formal analysis, Investigation, Writing – original draft. MZ: Formal analysis, Investigation, Writing – original draft, Data curation, Software. HW: Data curation, Formal analysis, Investigation, Software, Writing – review & editing. JW: Formal analysis, Investigation, Writing – original draft. YZ: Formal analysis, Investigation, Writing – original draft. QS: Formal analysis, Investigation, Writing – review & editing. AL: Formal analysis, Investigation, Writing – review & editing, Conceptualization, Methodology, Supervision.
Funding
The author(s) declare financial support was received for the research, authorship, and/or publication of this article. Dalian Youth Science and Technology Star Project Support Plan (2022RQ074); Dalian Medical Science Research Project (2212011).
Conflict of interest
The authors declare that the research was conducted in the absence of any commercial or financial relationships that could be construed as a potential conflict of interest.
Publisher’s note
All claims expressed in this article are solely those of the authors and do not necessarily represent those of their affiliated organizations, or those of the publisher, the editors and the reviewers. Any product that may be evaluated in this article, or claim that may be made by its manufacturer, is not guaranteed or endorsed by the publisher.
References
1. Brown ZJ, Tsilimigras DI, Ruff SM, Mohseni A, Kamel IR, Cloyd JM, et al. Management of hepatocellular carcinoma: A review. JAMA Surg. (2023) 158:410–20. doi: 10.1001/jamasurg.2022.7989
2. Kudo M, Trevisani F, Abou-Alfa GK, Rimassa L. Hepatocellular carcinoma: therapeutic guidelines and medical treatment. Liver Cancer. (2016) 6:16–26. doi: 10.1159/000449343
3. Niu ZS, Wang WH, Niu XJ. Recent progress in molecular mechanisms of postoperative recurrence and metastasis of hepatocellular carcinoma. World J Gastroenterol. (2022) 28:6433–77. doi: 10.3748/wjg.v28.i46.6433
4. Fang T, Long G, Mi X, Su W, Mo L, Zhou L. Splenic volume, an easy-to-use predictor of HCC late recurrence for HCC patients after hepatectomy. Front Oncol. (2022) 12:876668. doi: 10.3389/fonc.2022.876668
5. Zheng Z, Guan R, Jianxi W, Zhao Z, Peng T, Liu C, et al. Microvascular invasion in hepatocellular carcinoma: A review of its definition, clinical significance, and comprehensive management. J Oncol. (2022) 2022:9567041. doi: 10.1155/2022/9567041
6. Yamashita Y, Tsuijita E, Takeishi K, Fujiwara M, Kira S, Mori M, et al. Predictors for microinvasion of small hepatocellular carcinoma ≤ 2 cm. Ann SurgOncol. (2012) 19:2027–34. doi: 10.1245/s10434-011-2195-0
7. Hidaka M, Eguchi S, Okuda K, Beppu T, Shirabe K, Kondo K, et al. Impact of anatomical resection for hepatocellular carcinoma with microportal invasion (vp1): A multi-institutional study by the kyushu study group of liver surgery. Ann Surg. (2020) 271:339–46. doi: 10.1097/SLA.0000000000002981
8. Yang P, Si A, Yang J, Cheng Z, Wang K, Li J, et al. A wide-margin liver resection improves long-term outcomes for patients with HBV-related hepatocellular carcinoma with microvascular invasion. Surgery. (2019) 165:721–30. doi: 10.1016/j.surg.2018.09.016
9. Li L, Wu C, Huang Y, Chen J, Ye D, Su Z. Radiomics for the preoperative evaluation of microvascular invasion in hepatocellular carcinoma: A meta-analysis. Front Oncol. (2022) 12:831996. doi: 10.3389/fonc.2022.831996
10. Lv K, Cao X, Du P, Fu JY, Geng DY, Zhang J. Radiomics for the detection of microvascular invasion in hepatocellular carcinoma. World J Gastroenterol. (2022) 28:2176–83. doi: 10.3748/wjg.v28.i20.2176
11. Hu H, Qi S, Zeng S, Zhang P, He L, Wen S, et al. Importance of microvascular invasion risk and tumor size on recurrence and survival of hepatocellular carcinoma after anatomical resection and non-anatomical resection. Front Oncol. (2021) 11:621622. doi: 10.3389/fonc.2021.621622
12. Lei Z, Li J, Wu D, Xia Y, Wang Q, Si A, et al. Nomogram for preoperative estimation of microvascular invasion risk in hepatitis B virus-related hepatocellular carcinoma within the milan criteria. JAMA Surg. (2016) 151:356–63. doi: 10.1001/jamasurg.2015.4257
13. Rhee H, An C, Kim HY, Yoo JE, Park YN, Kim MJ. Hepatocellular carcinoma with irregular rim-like arterial phase hyperenhancement: more aggressive pathologic features. Liver Cancer. (2019) 8:24–40. doi: 10.1159/000488540
14. Zhang R, Xu L, Wen X, Zhang J, Yang P, Zhang L, et al. A nomogram based on bi-regional radiomics features from multimodal magnetic resonance imaging for preoperative prediction of microvascular invasion in hepatocellular carcinoma. Quant Imaging Med Surg. (2019) 9:1503–15. doi: 10.21037/qims.2019.09.07
15. Ariizumi S, Kitagawa K, Kotera Y, Takahashi Y, Katagiri S, Kuwatsuru R, et al. A non-smooth tumor margin in the hepatobiliary phase of gadoxetic acid disodium (Gd-EOB-DTPA)-enhanced magnetic resonance imaging predicts microscopic portal vein invasion, intrahepatic metastasis, and early recurrence after hepatectomy in patients with hepatocellular carcinoma. J Hepatobiliary Pancreat Sci. (2011) 18:575–85. doi: 10.1007/s00534-010-0369-y
16. Rudolfsson SH, Bergh A. Hypoxia drives prostate tumour progression and impairs the effectiveness of therapy, but can also promote cell death and serve as a therapeutic target. Expert Opin Ther Targets. (2009) 13:219–25. doi: 10.1517/14728220802626249
17. Wu XZ, Xie GR, Chen D. Hypoxia and hepatocellular carcinoma: The therapeutic target for hepatocellular carcinoma. J Gastroenterol Hepatol. (2007) 22:1178–82. doi: 10.1111/j.1440-1746.2007.04997.x
18. Howe FA, Robinson SP, Rodrigues LM, Stubbs M, Griffiths JR. Issues in GRE & SE magnetic resonance imaging to probe tumor oxygenation. Adv Exp Med Biol. (2003) 530:441–8. doi: 10.1007/978-1-4615-0075-9_41
19. Ling X, Tang W, Liu G, Huang L, Li B, Li X, et al. Assessment of brain maturation in the preterm infants using diffusion tensor imaging (DTI) and enhanced T2 star weighted angiography (ESWAN). Eur J Radiol. (2013) 82:e476–83. doi: 10.1016/j.ejrad.2013.04.003
20. Gaudino S, Marziali G, Pezzullo G, Guadalupi P, Giordano C, Infante A, et al. Role of susceptibility-weighted imaging and intratumoral susceptibility signals in grading and differentiating pediatric brain tumors at 1.5 T: a preliminary study. Neuroradiology. (2020) 62:705–13. doi: 10.1007/s00234-020-02386-z
21. Yuan SX, Yang F, Yang Y, Tao QF, Zhang J, Huang G, et al. Long noncoding RNA associated with microvascular invasion in hepatocellular carcinoma promotes angiogenesis and serves as a predictor for hepatocellular carcinoma patients' poor recurrence-free survival after hepatectomy. Hepatology. (2012) 56:2231–41. doi: 10.1002/hep.25895
22. Yang S, Lin J, Lu F, Han Z, Fu C, Gu H. Use of ultrasmallSuperparamagnetic iron oxide enhanced susceptibility weighted imaging and mean vessel density imaging to monitor antiangiogenic effects of sorafenib on experimental hepatocellular carcinoma. Contrast Media Mol Imaging. (2017) 2017:9265098. doi: 10.1155/2017/9265098
23. Zhou Y, Zheng J, Yang C, Peng J, Liu N, Yang L, et al. Application of intravoxel incoherent motion diffusion-weighted imaging in hepatocellular carcinoma. World J Gastroenterol. (2022) 28:3334–45. doi: 10.3748/wjg.v28.i27.3334
24. Wei Y, Huang Z, Tang H, Deng L, Yuan Y, Li J, et al. IVIM improves preoperative assessment of microvascular invasion in HCC. EurRadiol. (2019) 29:5403–14. doi: 10.1007/s00330-019-06088-w
25. Zhao W, Liu W, Liu H, Yi X, Hou J, Pei Y, et al. Preoperative prediction of microvascular invasion of hepatocellular carcinoma with IVIM diffusion-weighted MR imaging and Gd-EOB-DTPA-enhanced MR imaging. PloS One. (2018) 13:e0197488. doi: 10.1371/journal.pone.0197488
26. Andersson M, Jalnefjord O, Montelius M, Rizell M, Sternby Eilard M, Ljungberg M. Evaluation of response in patients with hepatocellular carcinoma treated with intratumoral dendritic cell vaccination using intravoxel incoherent motion (IVIM) MRI and histogram analysis. Acta Radiol. (2023) 64:32–41. doi: 10.1177/02841851211065935
27. Fujita N, Nishie A, Asayama Y, Ishigami K, Ushijima Y, Takayama Y, et al. Significance of the signal intensity of gadoxetic acid-enhanced MR imaging for predicting the efficacy of hepatic arterial infusion chemotherapy in hepatocellular carcinoma. MagnReson Med Sci. (2016) 15:111–20. doi: 10.2463/mrms.2015-0012
28. Du J, Li K, Wang W, Jhonatan FY, Zhang W, Yang H, et al. Qualitative and quantitative diagnosis of intramuscular hemangioma subtypes: Diagnostic performance comparison of ESWAN and conventional MRI. ActaRadiol. (2023) 64:208–16. doi: 10.1177/02841851211065145
29. Li Y, Song QW, Sun MY, Wang HQ, Wang S, Wei Q, et al. Use of enhanced T2 star-weighted angiography (ESWAN) and R2* values to distinguish ovarian cysts due to endometriosis from other causes. Abdom Imaging. (2015) 40:1733–41. doi: 10.1007/s00261-014-0314-7
30. Chen W, DelProposto Z, Liu W, Kassir M, Wang Z, Zhao J, et al. Susceptibility-weighted imaging for the noncontrast evaluation of hepatocellular carcinoma: a prospective study with histopathologic correlation. PloS One. (2014) 9:e98303. doi: 10.1371/journal.pone.0098303
31. Sun M, Wang S, Song Q, Wang Z, Wang H, Ning D, et al. Utility of R2* obtained from T2*-weighted imaging in differentiating hepatocellular carcinomas from cavernous hemangiomas of the liver. PloS One. (2014) 9:e91751. doi: 10.1371/journal.pone.0091751
32. Jhaveri KS, Cleary SP, Fischer S, Haider MA, Pargoankar V, Khalidi K, et al. Blood oxygen level-dependent liver MRI: can it predict microvascular invasion in HCC? J Magn Reson Imaging. (2013) 37:692–9. doi: 10.1002/jmri.23858
33. Xu J, Xu H, Zhang W, Zheng J. Contribution of susceptibility- and diffusion-weighted magnetic resonance imaging for grading gliomas. Exp Ther Med. (2018) 15:5113–8. doi: 10.3892/etm.2018.6017
34. Huang SS, Zuo MX, Xie CM. Combining preoperative clinical and imaging characteristics to predict MVI in hepatitis B virus-related combined hepatocellular carcinoma and cholangiocarcinoma. J Pers Med. (2023) 13:246. doi: 10.3390/jpm13020246
35. Sakata J, Shirai Y, Wakai T, Kaneko K, Nagahashi M, Hatakeyama K. Preoperative predictors of vascular invasion in hepatocellular carcinoma. Eur J SurgOncol. (2008) 34:900–5. doi: 10.1016/j.ejso.2008.01.031
36. Ryu T, Takami Y, Wada Y, Tateishi M, Hara T, Yoshitomi M, et al. A clinical scoring system for predicting microvascular invasion in patients with hepatocellular carcinoma within the milan criteria. J Gastrointest Surg. (2019) 23:779–87. doi: 10.1007/s11605-019-04134-y
37. Xia TY, Zhou ZH, Meng XP, Zha JH, Yu Q, Wang WL, et al. Predicting microvascular invasion in hepatocellular carcinoma using CT-based radiomics model. Radiology. (2023) 307:e222729. doi: 10.1148/radiol.222729
Keywords: hepatocellular carcinoma, microvascular invasion, intravoxel incoherent motion, enhanced T2*-weighted angiography, intratumoral susceptibility signal
Citation: Ren X, Zhao Y, Wang N, Liu J, Zhang S, Zhuang M, Wang H, Wang J, Zhang Y, Song Q and Liu A (2024) Intravoxel incoherent motion and enhanced T2*-weighted angiography for preoperative prediction of microvascular invasion in hepatocellular carcinoma. Front. Oncol. 14:1389769. doi: 10.3389/fonc.2024.1389769
Received: 29 February 2024; Accepted: 16 July 2024;
Published: 09 August 2024.
Edited by:
Avinash Kambadakone, Massachusetts General Hospital and Harvard Medical School, United StatesReviewed by:
Yueming Li, The First Affiliated Hospital of Fujian Medical University, ChinaWenjie Liang, Zhejiang University, China
Copyright © 2024 Ren, Zhao, Wang, Liu, Zhang, Zhuang, Wang, Wang, Zhang, Song and Liu. This is an open-access article distributed under the terms of the Creative Commons Attribution License (CC BY). The use, distribution or reproduction in other forums is permitted, provided the original author(s) and the copyright owner(s) are credited and that the original publication in this journal is cited, in accordance with accepted academic practice. No use, distribution or reproduction is permitted which does not comply with these terms.
*Correspondence: Ailian Liu, bGl1YWlsaWFuQGRtdS5lZHUuY24=
†These authors have contributed equally to this work