 Sara Vicente-Muñoz1,2*†‡James C. Davis3†Adam Lane4
 Andrew N. Lane5
 Susan E. Waltz3,6*‡
 Susanne I. Wells2,7*‡
- 1Translational Metabolomics Facility, Division of Pathology and Laboratory Medicine, Cincinnati Children’s Hospital Medical Center, Cincinnati, OH, United States
- 2Department of Pediatrics, University of Cincinnati, Cincinnati, OH, United States
- 3Department of Cancer Biology, College of Medicine, University of Cincinnati, Cincinnati, OH, United States
- 4Division of Bone Marrow Transplantation and Immune Deficiency, Cincinnati Children’s Hospital Medical Center, Cincinnati, OH, United States
- 5Department of Toxicology and Cancer Biology, University of Kentucky, Lexington, KY, United States
- 6Research Service, Cincinnati Veterans Affairs Medical Center, Cincinnati, OH, United States
- 7Division of Oncology, Cincinnati Children’s Hospital Medical Center, Cincinnati, OH, United States
Recurrent and metastatic breast cancer is frequently treatment resistant. A wealth of evidence suggests that reprogrammed lipid metabolism supports cancer recurrence. Overexpression of the RON and DEK oncoproteins in breast cancer is associated with poor outcome. Both proteins promote cancer metastasis in laboratory models, but their influence on lipid metabolite levels remain unknown. To measure RON- and DEK-dependent steady-state lipid metabolite levels, a nuclear magnetic resonance (NMR)-based approach was utilized. The observed differences identified a lipid metabolism-related gene expression signature that is prognostic of overall survival (OS), distant metastasis-free survival (DMFS), post-progression survival (PPS), and recurrence-free survival (RFS) in patients with breast cancer. RON loss led to decreased cholesterol and sphingomyelin levels, whereas DEK loss increased total fatty acid levels and decreased free glycerol levels. Lipid-related genes were then queried to define a signature that predicts poor outcomes for patients with breast cancer patients. Taken together, RON and DEK differentially regulate lipid metabolism in a manner that predicts and may promote breast cancer metastasis and recurrence.
1 Introduction
Advances in treatments have resulted in an overall 90% 5-year survival rate for breast cancer patients (1). However, a large gap remains between survival rates of those with localized versus distant metastatic breast cancer. While localized breast cancer has a 98% survival rate, distant metastatic breast cancer has a 31% survival rate. In addition, the 10-year survival rate for breast cancer decreases from 85% to 46.9% for local recurrence and to less than 5% for distant recurrence (2–4). This highlights an unmet need to identify markers and drivers of metastatic and recurrent breast cancer to improve currently unacceptable outcomes.
Herein, we focus on two genes that have already been associated with poor outcomes in patients with breast cancer. RON is a receptor tyrosine kinase overexpressed in over 50% of breast cancers independent of subtype (5), and stimulates cancer, metastasis, and recurrence (6). DEK is a chromatin-associated oncogene that also promotes breast cancer stemness and metastasis and can be stimulated by RON signaling (7). Together, high DEK and RON expression levels were strongly linked to poor outcomes in human subjects (5, 8). Previous studies have shown that fatty acids can regulate tumor cell growth, invasion, and progression both positively and negatively (9–12). In addition, increases in cholesterol biosynthesis and cholesterol levels have been associated with RON-driven breast cancer stem cell (BCSC) phenotypes (6, 13). Lipid metabolism is the new frontier of cancer biomarkers and targets (14) and might be a potential driver of RON- and DEK-associated metastasis and recurrence. We hypothesized that RON and DEK upregulation in breast cancer is required for lipid metabolism that is linked to poor outcomes.
We have used 1H-NMR (nuclear magnetic resonance) spectroscopy to determine relative abundances of different intact lipids in families defined by (i) headgroup (phosphatidylcholine (PC), phosphatidylethanolamine (PE)) and average degree of fatty acyl chain unsaturation, (ii) sphingomyelin, and (iii) cholesterol, rather than individual lipid species. This provides a broad overview of the complex lipids detectable in cells (15, 16). We found that breast cancer cells with RON and DEK loss of function harbor independent dysregulation of defined lipid metabolites, including cholesterol, unsaturated fatty acids, glycerol, sphingomyelin, and glycerophospholipids. By examining relevant transcriptionally regulated enzymes, we identified a lipid metabolism-related gene signature that predicts breast cancer recurrence, and also poor outcomes for lung, ovarian, and gastric cancer. These data also support a role for RON and DEK in energy metabolism to support breast cancer recurrence and metastasis.
2 Materials and methods
2.1 Cell culture
The well-characterized and widely published R7 (control), R7sgRON (RON targeted), and R7shDEK (DEK targeted) murine breast cancer cell lines were cultured as previously described (7, 17) in complete Dulbecco’s Modified Eagle’s Medium (DMEM) containing 5% FBS, 1% penicillin–streptomycin, and 0.2% fungizone. R7sgRON cells were obtained from serial dilution of px458-sgRON-transfected R7 cells. Px458 was obtained from Addgene (48138), whereas RON sgRNA was obtained from IDT (sgRON sequence: ACCTGCAGCTCACCCTTCTAC). R7shDEK cells were maintained with 1 μg/mL of puromycin for selection. For NMR experiments, cells were seeded in 10-cm plates in complete DMEM containing 5% dialyzed FBS.
2.2 Cell collection and processing
The three isogenic breast cancer cell lines were plated and incubated for 24 h. At the time of collection, cells were 80%–90% confluent; the medium was aspirated, and the cells were washed and quenched as per prior protocols (18). Polar and non-polar metabolites were extracted using the solvent partition method with acetonitrile: water: chloroform (CH3CN: H2O: CHCl3) at ratios 2: 1.5: 1 (V/V) (18, 19). A mixture of chloroform and methanol (1:1) containing 1 mM butylated hydroxytoluene (BHT) was added to the lipid fraction for storage at −80°C. The upper aqueous phases (polar metabolites) were lyophilized (CentriVap Labconco), and the lower organic phases (lipidic non-polar metabolites) were dried in a SpeedVac at room temperature.
2.3 NMR spectroscopy
Dried organic phases (lipids) were reconstituted in 220 µL of 100% methanol-d4 containing 0.05% v/v of tetramethylsilane (TMS) (Cambridge Isotopes Lab, Andover, MA), vortexed, and centrifuged at room temperature. 200 µL of the supernatant was transferred into a 3-mm NMR tube. All NMR spectra were recorded at 288 K on a Bruker Avance III HD 600-MHz spectrometer (Bruker BioSpin) equipped with a 5-mm Broad Band Observed (BBO) Prodigy probe. For each sample, one-dimensional (1D) 1H-NMR experiments were acquired using the noesygppr1d pulse sequence with presaturation of the residual water resonance using a 25-Hz bandwidth, 512 transients, a 15-ppm spectral width, a 4.0-s relaxation delay, and a 2.0-s acquisition time resulting in 44,640 data points. Prior to Fourier transformation, each 1H spectrum was zero-filled to 128 K data points and apodized with a 1-Hz exponential line-broadening function. All spectra were recorded and transformed with the use of TopSpin 3.6.2 software (Bruker BioSpin, USA) and processed (phased and baseline corrected) using MestReNova software (MNova v12.0.3, Spain). Spectra were internally calibrated to the methyl group of the TMS at 0 ppm. Representative lipid families (glycerophospholipids, sterols, sphingolipids, glycerophospholipids, and fatty acids) were identified and assigned by using in-house databases, pure standards, and literature reports (16, 20, 21). Additionally, for selecting samples, 2D 1H-1H TOtal Correlation SpectroscopY (TOCSY) experiments were recorded to facilitate and confirm the identification of analytes. The area of each assigned lipid class was manually integrated using the global spectra deconvolution (GSD) algorithm available in MestReNova software (MNova v12.0.3, Spain), as previously described (18).
2.4 Statistical analysis
To assess the relative abundance of each species of lipids identified compared with the R7 (control) group, each peak area was internally normalized to the area of the (CH3)3-N+ choline resonance at 3.22 ppm in the same spectrum. Principal component analysis (PCA) was carried out on the data scaled to unit variance by dividing each variable by its standard deviation (SD) using the R software. Univariate statistical analysis was used to determine the relevant spectral regions responsible for the discrimination between the groups. One-way ANOVA was used to generate pairwise comparisons between the R7, R7sgRON and R7shDEK groups. The Benjamini–Hochberg procedure (22) was used to control the false discovery rate of the pairwise comparison at q = 0.05. The control group was set to 1 for comparison, and the data were expressed as fold change of the relative amount of the different lipid adducts. Data are displayed as mean ± standard error of the mean (SEM).
2.5 Design and validation of a predictive gene signature
Select genes encoding enzymes involved in lipid metabolism (fatty acids, cholesterol, steroids, sphingolipids, phospholipids, triglycerides, glycolipids, and cardiolipins) were utilized to stratify breast cancer patient outcomes with respect to relapse-free survival (RFS) in the Gene Expression Omnibus-derived KMplot datasets (23). A comprehensive list of genes associated with these lipid-related pathways was obtained (24, 25). This initial list was then refined to generate a gene signature based on the log-rank p-value for RFS, using the KMplot webtool. Stratification into low and high gene expression groups was performed using a sliding cutoff approach from the KMplot webtool which optimizes hazard ratio (HR) values. Genes with worse outcomes from lower expression had their values inverted for the gene signature. Genes whose expression statistically significantly stratified RFS (p value < 0.05) were used to construct the lipid gene signature through the arithmetic mean of each gene. Each signature was subjected to a sliding cutoff. Additionally, the gene signature was used to test breast cancer patient overall survival (OS), distant metastasis-free survival (DMFS), and post-progression survival (PPS) in the Gene Expression Omnibus-derived KMplot datasets (23). The signature was then validated using The Cancer Genome Atlas (TCGA) Pan Cancer dataset (26) Overall Survival (OS) and Progression Free Survival (PFS). Finally, we tested the gene signatures for their capacity to predict response to chemotherapy in node-positive breast cancer patients using receiver-operator characteristic (ROC) analysis from the ROCplot webtool (27) analyzing GEO-derived breast cancer patient data. For the ROC analysis, genes that were upregulated and led to worse outcomes were tested separately from genes that were downregulated. Finally, the gene signature was tested using the KMplot dataset for ovarian and lung cancer (28, 29) and the ROCplot webtool for 6-month survival in ovarian cancer (27).
3 Results
3.1 Lipidomic profile of breast cancer by 1H-NMR spectroscopy
To qualitatively and quantitatively define RON- and DEK-dependent reprogramming of lipid metabolites, NMR spectroscopy was applied to R7 breast cancer cells and the corresponding RON or DEK knockdown cell lines. Specifically, proton (1H) NMR determined lipid composition in the presence and absence of RON and DEK. Despite the inherent width of individual lipid resonances, as well as the wide variety and complexity of the lipid species, good-quality spectra were obtained for all samples. A representative 1D 1H NMR spectrum of the total lipid fraction of R7sgRON is shown in Figure 1A where the most representative lipid families were identified and assigned. As previously described (16, 30, 31), the 1H-NMR resonances of the subunits of the different lipid classes were distributed as follows: the methyl (CH3) and methylene (CH2) resonances from cholesterol and the acyl chains are located from 0.65 ppm to 3.00 ppm (Figures 1B–D). The spectral region between 3.05 and 5.25 ppm (Figures 1D–F) comprises the phospholipid head group and glycerol backbone moieties of the glycerophospholipids. The vinyl proton peaks resound between 5.30 ppm and 6.00 ppm (Figure 1F). Therein, we determined the relative abundance of different subunits of complex lipids, including sterols (e.g., cholesterol), sphingolipids, glycerophospholipids, and fatty acids. We applied principal component analysis (PCA) as an exploratory tool to assess the separation of the three groups based on their lipid profiles (Supplementary Figure S1). Clear separation observed in the PCA plot provides visual evidence of distinct lipid patterns among the groups (Supplementary Figure S1A). The corresponding loading plot identified the most important variables driving the PCA model, correlations between variables, and species contributing to the group separation (Supplementary Figure S1B). Each individual lipid region was then evaluated statistically using one-way ANOVA.
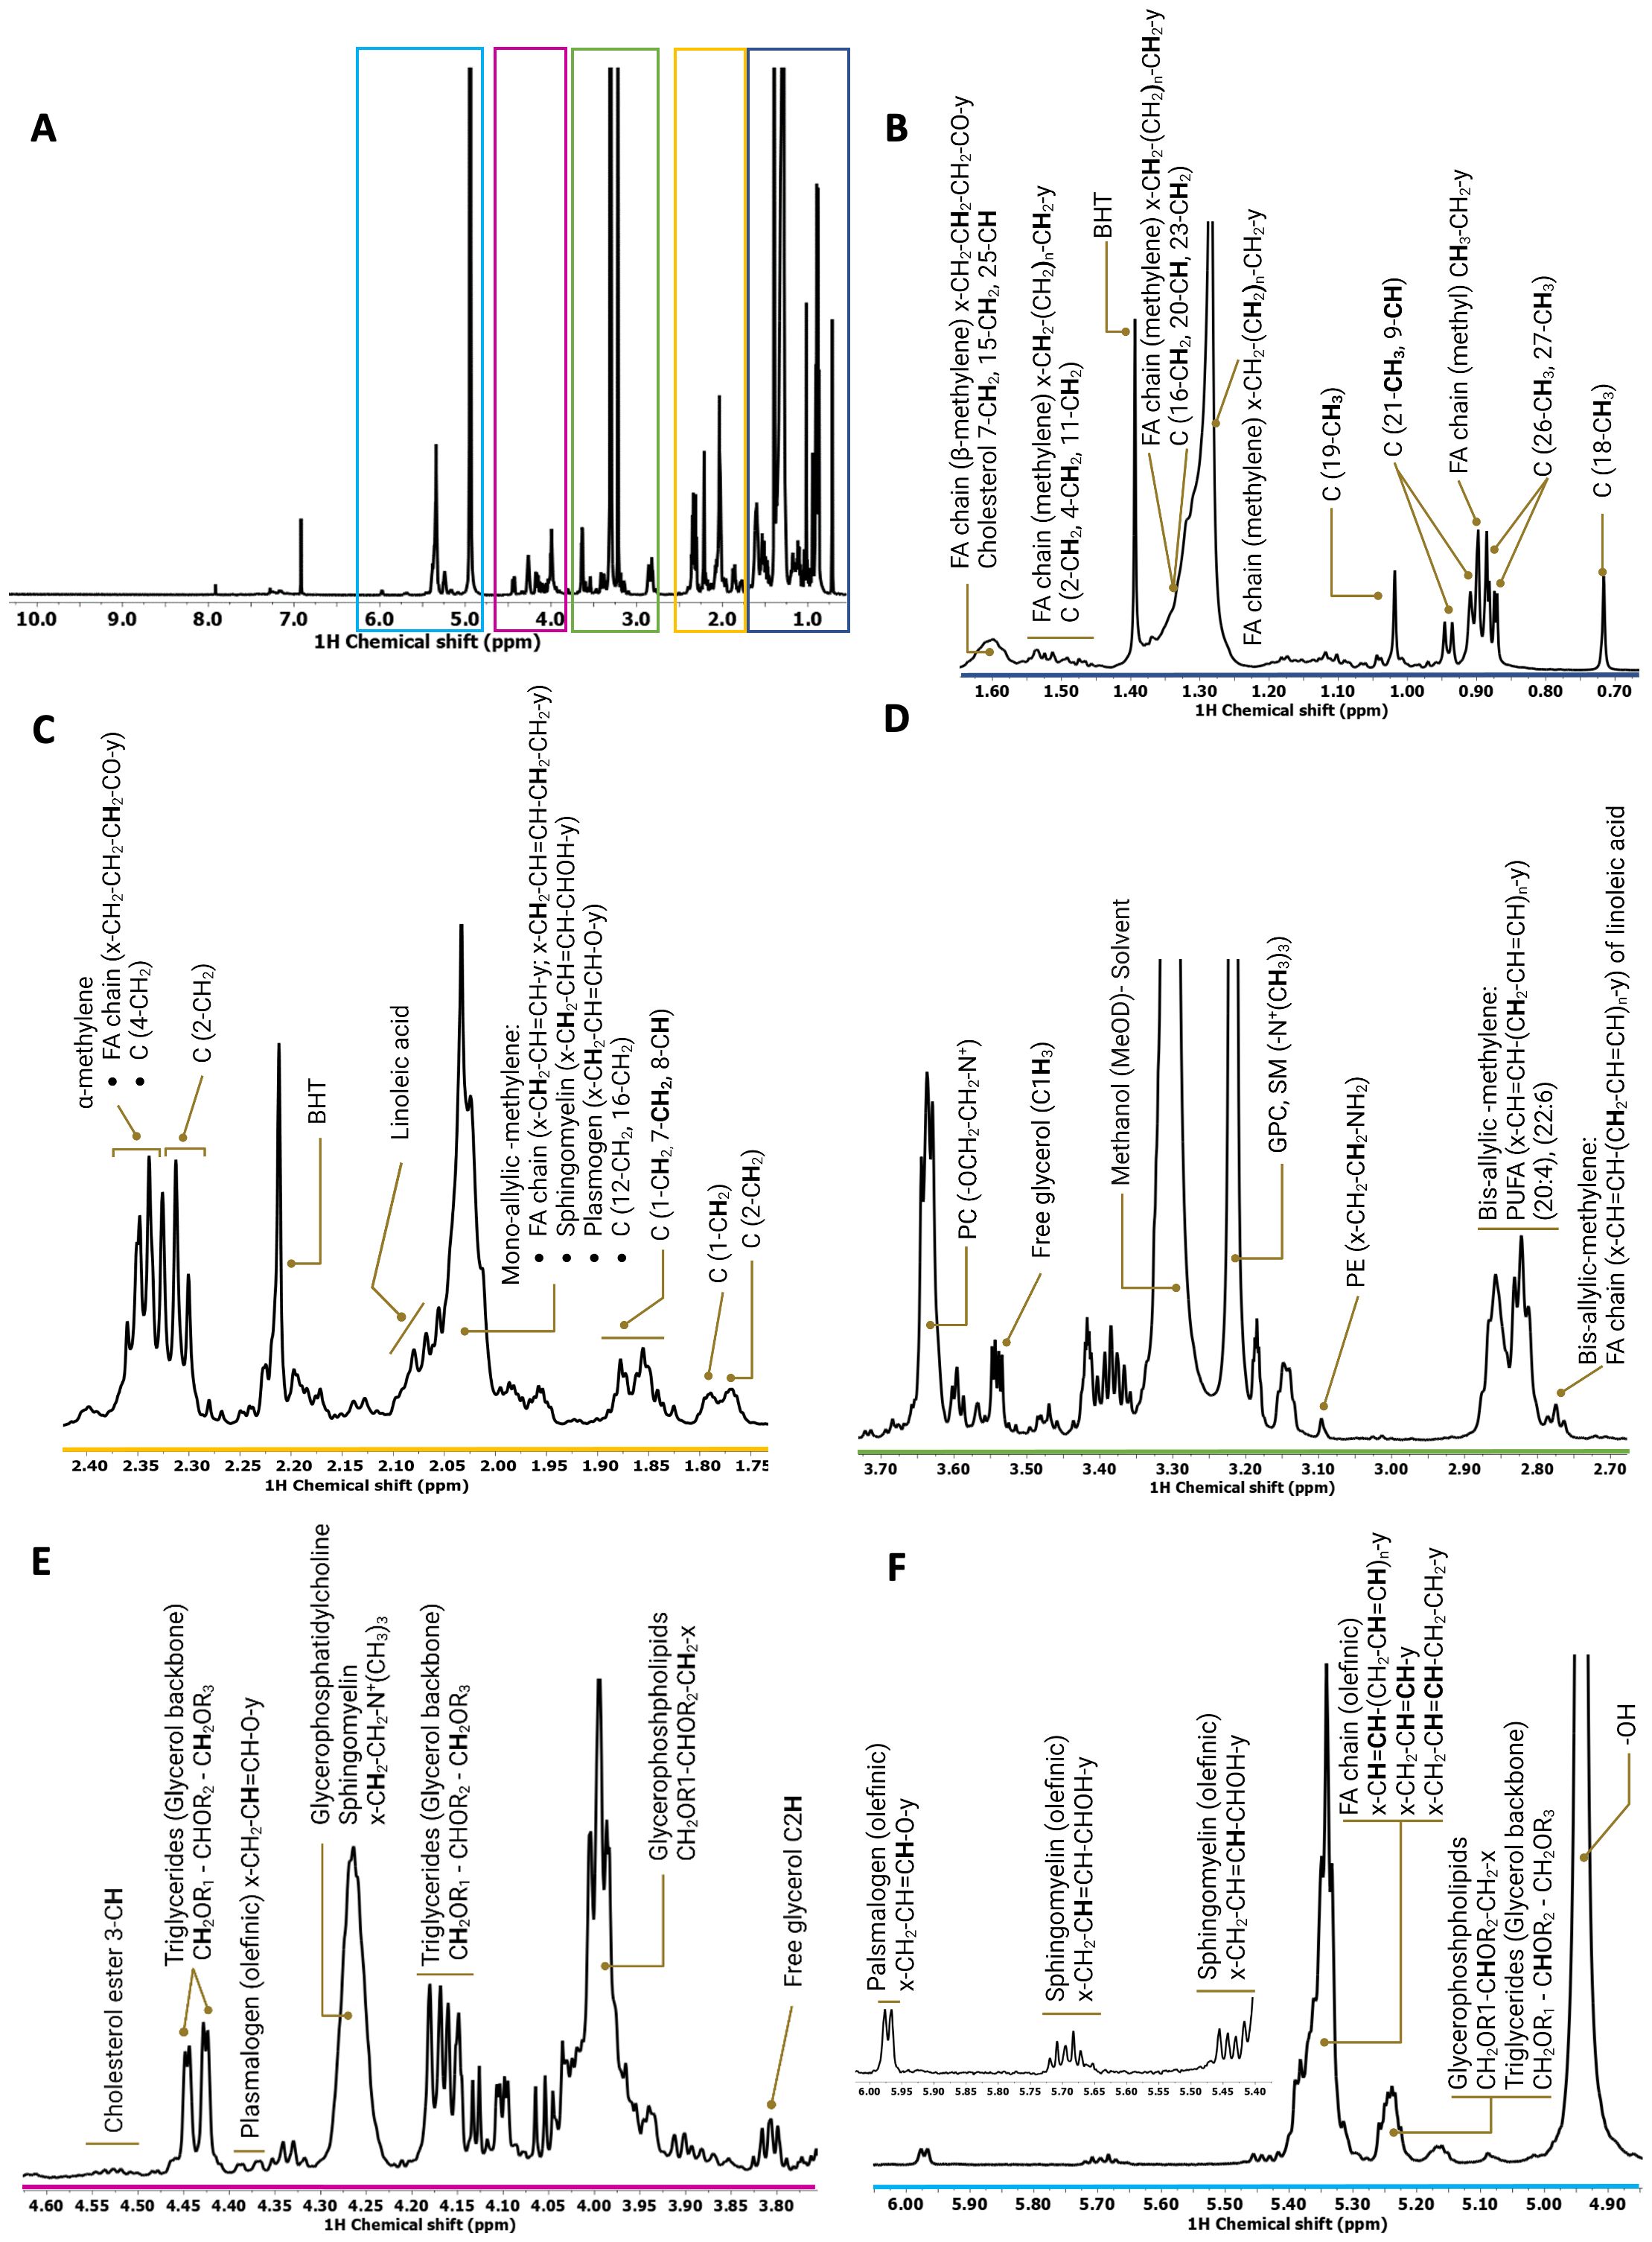
Figure 1. Representative 1H spectrum derived from the whole-cell lipid extract of R7sgRON cell line. (A) Full 1H spectrum acquired in a Bruker Avance spectrometer operating at 600 MHz. There were 512 transients that were acquired at 288 K, apodized using 1-Hz line broadening exponential, Fourier transformed, phased, and baseline corrected. (B–F) Expansion of different regions of the 1H spectrum (0.00 ppm–6.00 ppm) of the total lipid fraction showing the assignments of the lipid classes identified. C, cholesterol; FA, fatty acids; PC, phosphocholine; SM, sphingomyelin; BHT, butylated hydroxytoluene (solvent, antioxidant).
3.2 RON promotes cholesterol biosynthesis
Cholesterol biosynthesis is associated with increased breast cancer stem cell potential and increased recurrence (32) and entails a series of highly complex reactions that occur in the endoplasmic reticulum (ER) (33). The process begins with Acetyl-CoA and eventually results in a four-ring structure with a side chain and a total of 27 carbons (Figures 2A, B). Once formed, cholesterol is transported via non-vesicular and vesicular mechanisms (34). Vesicular transport of cholesterol occurs through organelle membranes, such as in endosomes and the Golgi apparatus, to the cellular membrane with the participation of sterol and oxysterol trafficking proteins (35, 36) (Figure 2A). Cholesterol upregulation is a poor prognostic factor in breast cancer and is associated with shortened relapse-free survival. Cholesterol also acts as an estrogen receptor agonist via its metabolite 27-hydroxycholesterol, supporting recurrence and metastasis progression (13, 37). Cholesterol resonances from 1H spectra were integrated, quantified, and used to determine cholesterol levels in the R7, R7sgRON, and R7shDEK cell lines. The methyl (CH3) cholesterol resonance at positions C18, and C26, C27, showed that RON loss decreased cholesterol levels. In contrast, DEK loss did not impact cholesterol levels and even elevated them compared with the R7 control (Figures 2C, D). In line with our previous study (6) wherein RON promoted key genes and enzymes in the cholesterol biosynthesis pathway as well as the incorporation of glucose-derived carbon into cholesterol, this establishes that RON (but not DEK) overexpression contributed to the promotion of cholesterol biosynthesis.
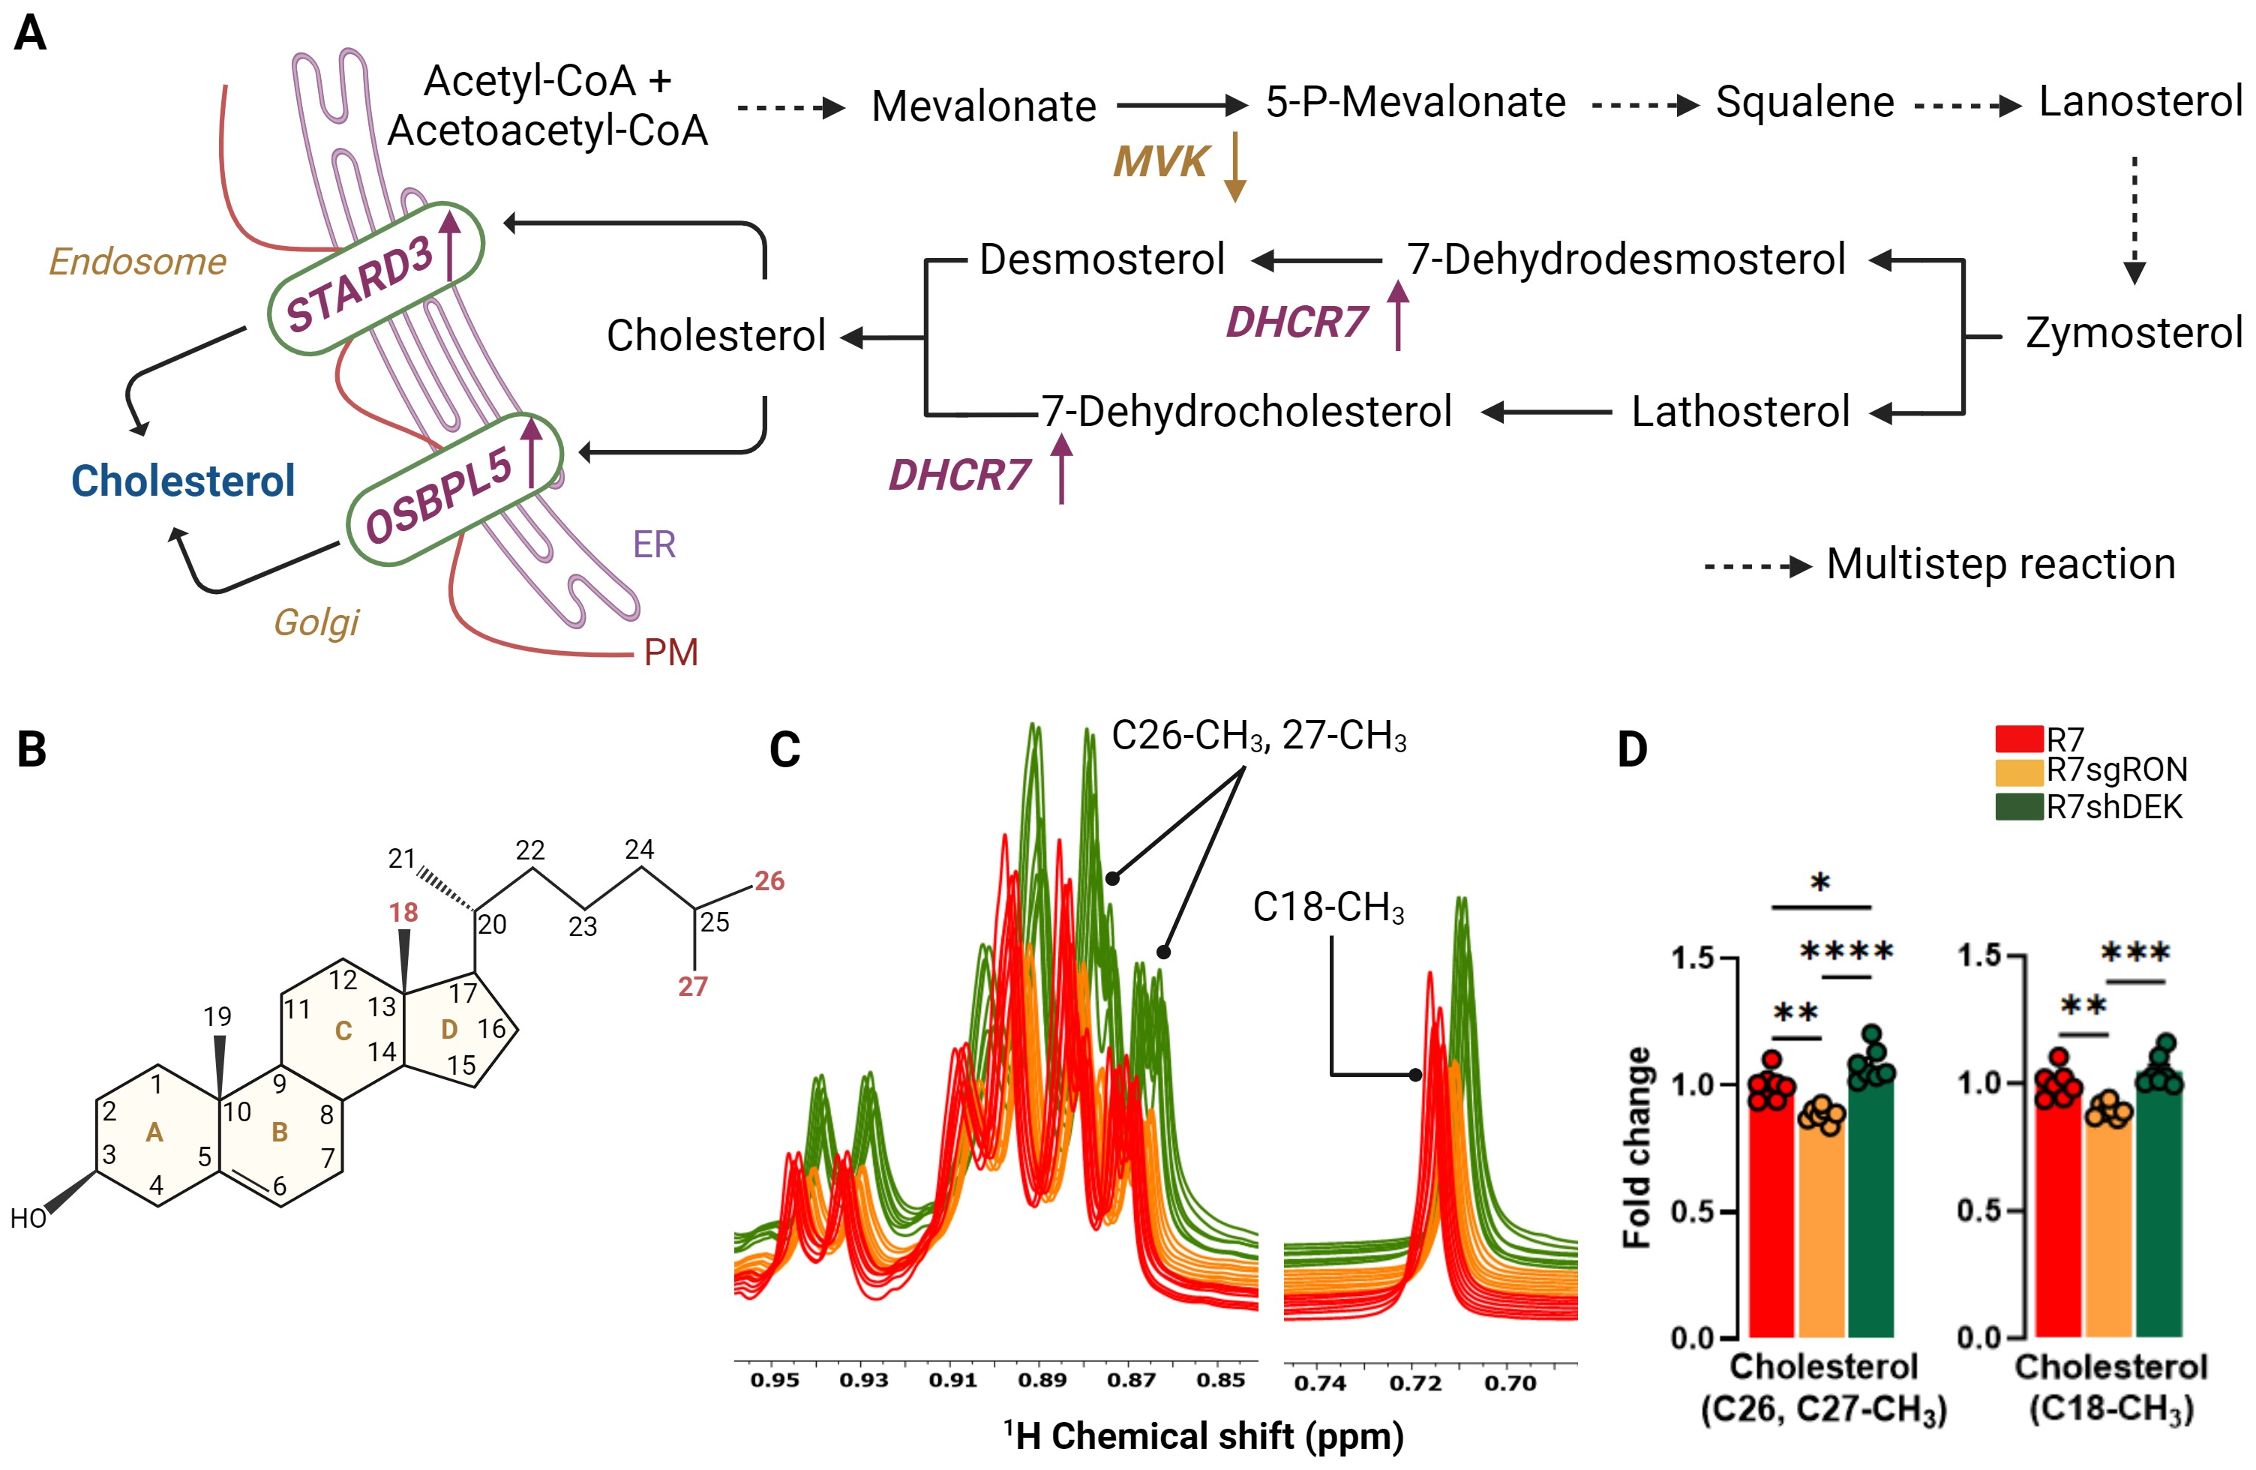
Figure 2. RON stimulates cholesterol metabolism. (A) Cholesterol biosynthesis pathway. Multistep reactions are illustrated with discontinuous arrows. Relevant enzymes from the KMplot.com-derived lipid metabolism gene signature are shown where appropriate, with an upward arrow indicating that gene induction is associated with worse patient outcomes and a downward arrow indicating that gene suppression is associated with worse patient outcomes. (B) Chemical structure of cholesterol. The carbon positions highlighted in red represent the cholesterol atoms quantified by NMR and compared between cell lines. (C) Comparison of 1D 1H-NOESY spectra of the lipid fraction from R7, R7sgRON, and R7shDEK corresponding with the cholesterol peaks analyzed by 1H-NMR. (D) Intracellular fold change of cholesterol measured from C26, C27-CH3, and C18-CH3 carbon positions and quantified by 1H-NMR and expressed as a fold change of the control group (R7). Bar plots indicate mean ± SEM. Replicates of each cell line are shown as individual dots (n = 7). Statistical significance was assessed using one-way ANOVA. *P ≤ 0.05; **P ≤ 0.01; ***P ≤ 0.001; ****P ≤ 0.0001. PM, plasma membrane; MVK, mevalonate kinase; DHCR7, 7-dehydrocholesterol reductase; STARD3, StAR-related lipid transfer domain containing 3; OSBPL5, oxysterol binding protein like 5.
3.3 RON expression in breast cancer increases sphingomyelin levels
Sphingolipids are important structural constituents of cell membranes. Ceramide is a precursor and essential intermediate in the synthesis and metabolism of all sphingolipids (Figure 3A). Sphingomyelin is produced by the transfer of phosphorylcholine from phosphatidylcholine to ceramide and constitutes the most abundant sphingolipid in mammalian cells. Sphingomyelin can also be hydrolyzed to produce ceramide, a pro-apoptotic molecule (Figure 3A). Quantification of the 1H-NMR peaks at 5.70 ppm corresponding to the olefinic CH of the sphingomyelin showed that the R7sgRON cells had decreased sphingomyelin levels compared with both the R7 and R7shDEK cell lines (Figure 3B). This implies that RON, but not DEK, potentially promotes sphingomyelin synthesis and breast cancer progression. Both ceramide and sphingomyelin act as regulatory molecules that inversely control cellular proliferation and tumor progression. Increased production (or reduced degradation) of sphingomyelin indirectly promotes cell proliferation due to decreased ceramide levels. Moreover, aberrant accumulation of sphingomyelin in the plasma membrane impairs membrane fluidity and permeability. As a consequence, sphingomyelin not only decreases cell–cell communication in favor of uncontrolled proliferation and invasion but also impairs anticancer drug influx, contributing to chemotherapeutic resistance (38).
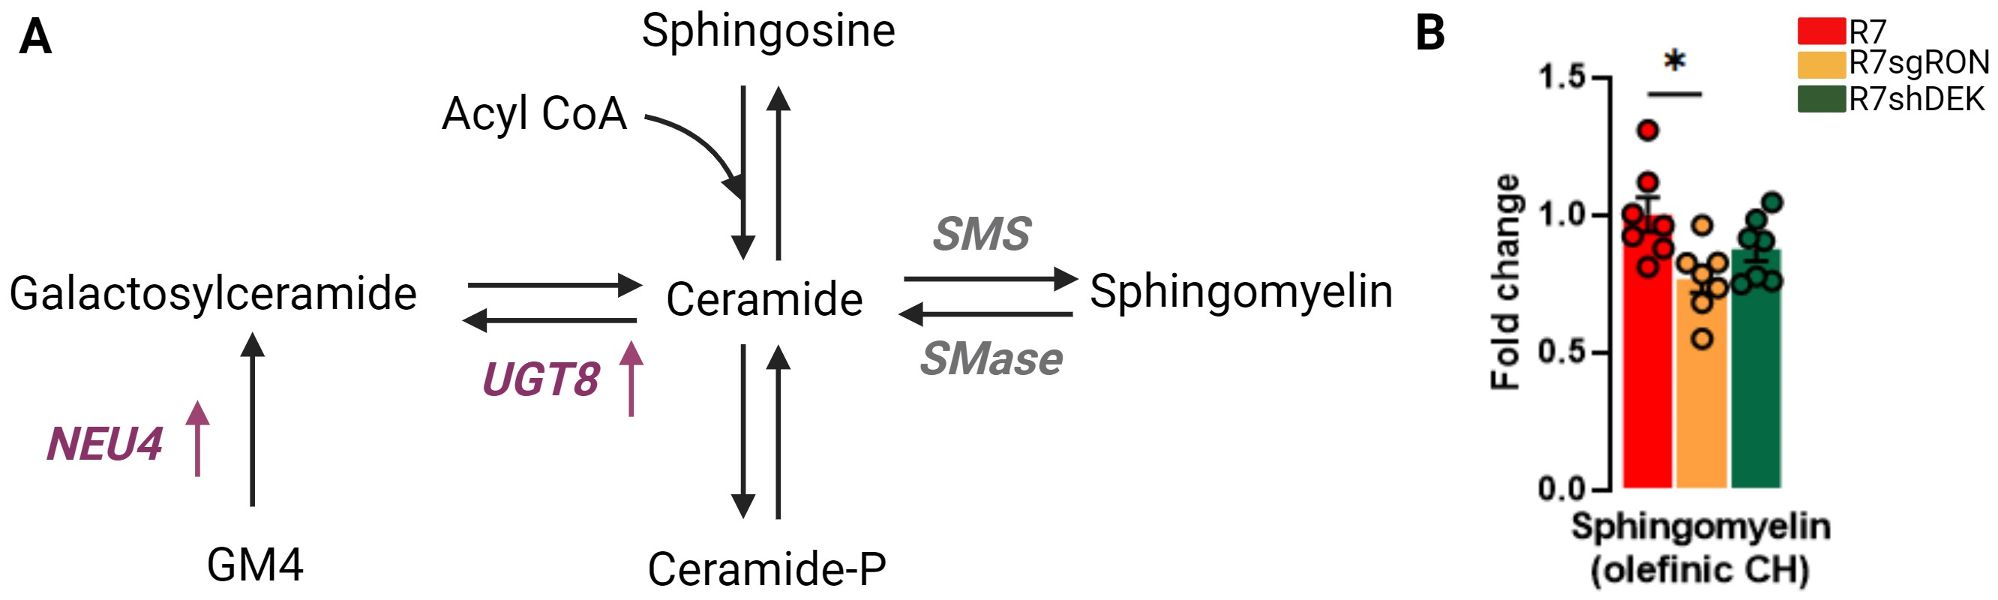
Figure 3. RON knockout decreases sphingomyelin levels. (A) Schematic representation of the synthesis of sphingomyelin and other derivatives of ceramide. Translation products from the KMplot.com-derived lipid metabolism gene signature have been added where appropriate, with an upward arrow indicating that upregulation of this gene is associated with worse patient outcomes. (B) Intracellular fold change of sphingomyelin measured from sphingomyelin olefinic CH 1H-NMR. Bar plots indicate mean ± SEM. Replicates of each cell line are shown as individual dots (n = 7). Statistical significance was assessed using one-way ANOVA. *P ≤ 0.05. GM4, N-acetylneuraminyl-galactosylceramide; NEU4, N-acetyl-alpha-neuraminidase 4; UGT8, UDP glycosyltransferase 8; SMS, sphingomyelin synthase.
In addition, several sphingolipid enzymes play a key role in the ceramide–sphingomyelin homeostasis and cancer progression. UDP glycosyltransferase 8 (UGT8) mediates the synthesis of galactosylceramide from ceramide using UDP-galactose as a donor (Figure 3A). Higher UGT8 mRNA and protein levels were observed in breast cancer metastases to the lung compared with their respective primary tumors (39). The overexpression of UGT8 and accumulation of its product galactosylceramide are associated with increased aggressiveness and worse prognosis in breast cancer (39, 40). Notably, UGT8 has already been identified as part of a six-gene signature that correlates with a higher risk for developing lung metastases and has been validated in three independent cohorts of breast cancer patients (41).
Finally, sphingomyelin synthase (SMS) mediates the formation of sphingomyelin from ceramide. High SMS expression leads to the concomitant accumulation of sphingomyelin and reduction of ceramide. An imbalance in ceramide–sphingomyelin homeostasis stimulates cancer cell proliferation by reducing ceramide-related apoptosis and induces tumor invasiveness and migration by enhancing epithelial-to-mesenchymal transition (EMT) (42, 43).
3.4 DEK regulates glycerophospholipid levels and free glycerol availability
Intracellular glycerol is used as a building block for glycerophospholipids, which are the major lipids in cell membranes and can be incorporated into vesicles for either intracellular or extracellular transport. The glycerol moiety of triacylglycerols (and other acylglycerols) can be generated from three sources: glucose, glycerol, or other metabolites such as pyruvate, alanine, lactate, or TCA cycle intermediates via glyceroneogenesis (44, 45) (Figure 4A). Glycerol was identified, assigned, and quantified in several lipid classes. The 1H NMR peaks of the protons located at positions C1 and C3 of the glycerol backbone (CH2OR1–CHOR2–CH2OR3) of TAG generated two sets of peaks at 4.16 ppm and 4.45 ppm. The double doublet at 4.45 ppm was well resolved and isolated and thus integrated and used for quantification (Figure 4B). In addition, the glyceryl C3H2 group (CH2OR1–CHOR2-CH2–X) of glycerophospholipids was readily observed and used for quantification (Figure 4C). In both cases, R7shDEK cell lines harbored significantly increased levels compared with the R7 and R7sgRON cell lines. In contrast, when comparing the NMR peaks derived from free glycerol, both C1H3 and C3H3 and C2H2 resonances showed that the R7shDEK cells had decreased free glycerol levels compared with both the R7 and R7sgRON cell lines, and there was no difference between glycerol levels in R7 and R7sgRON cell lines (Figure 4D). These results suggest that DEK but not RON expression could lead to decreased levels of TAG and other glycerophospholipids and increased free glycerol levels.
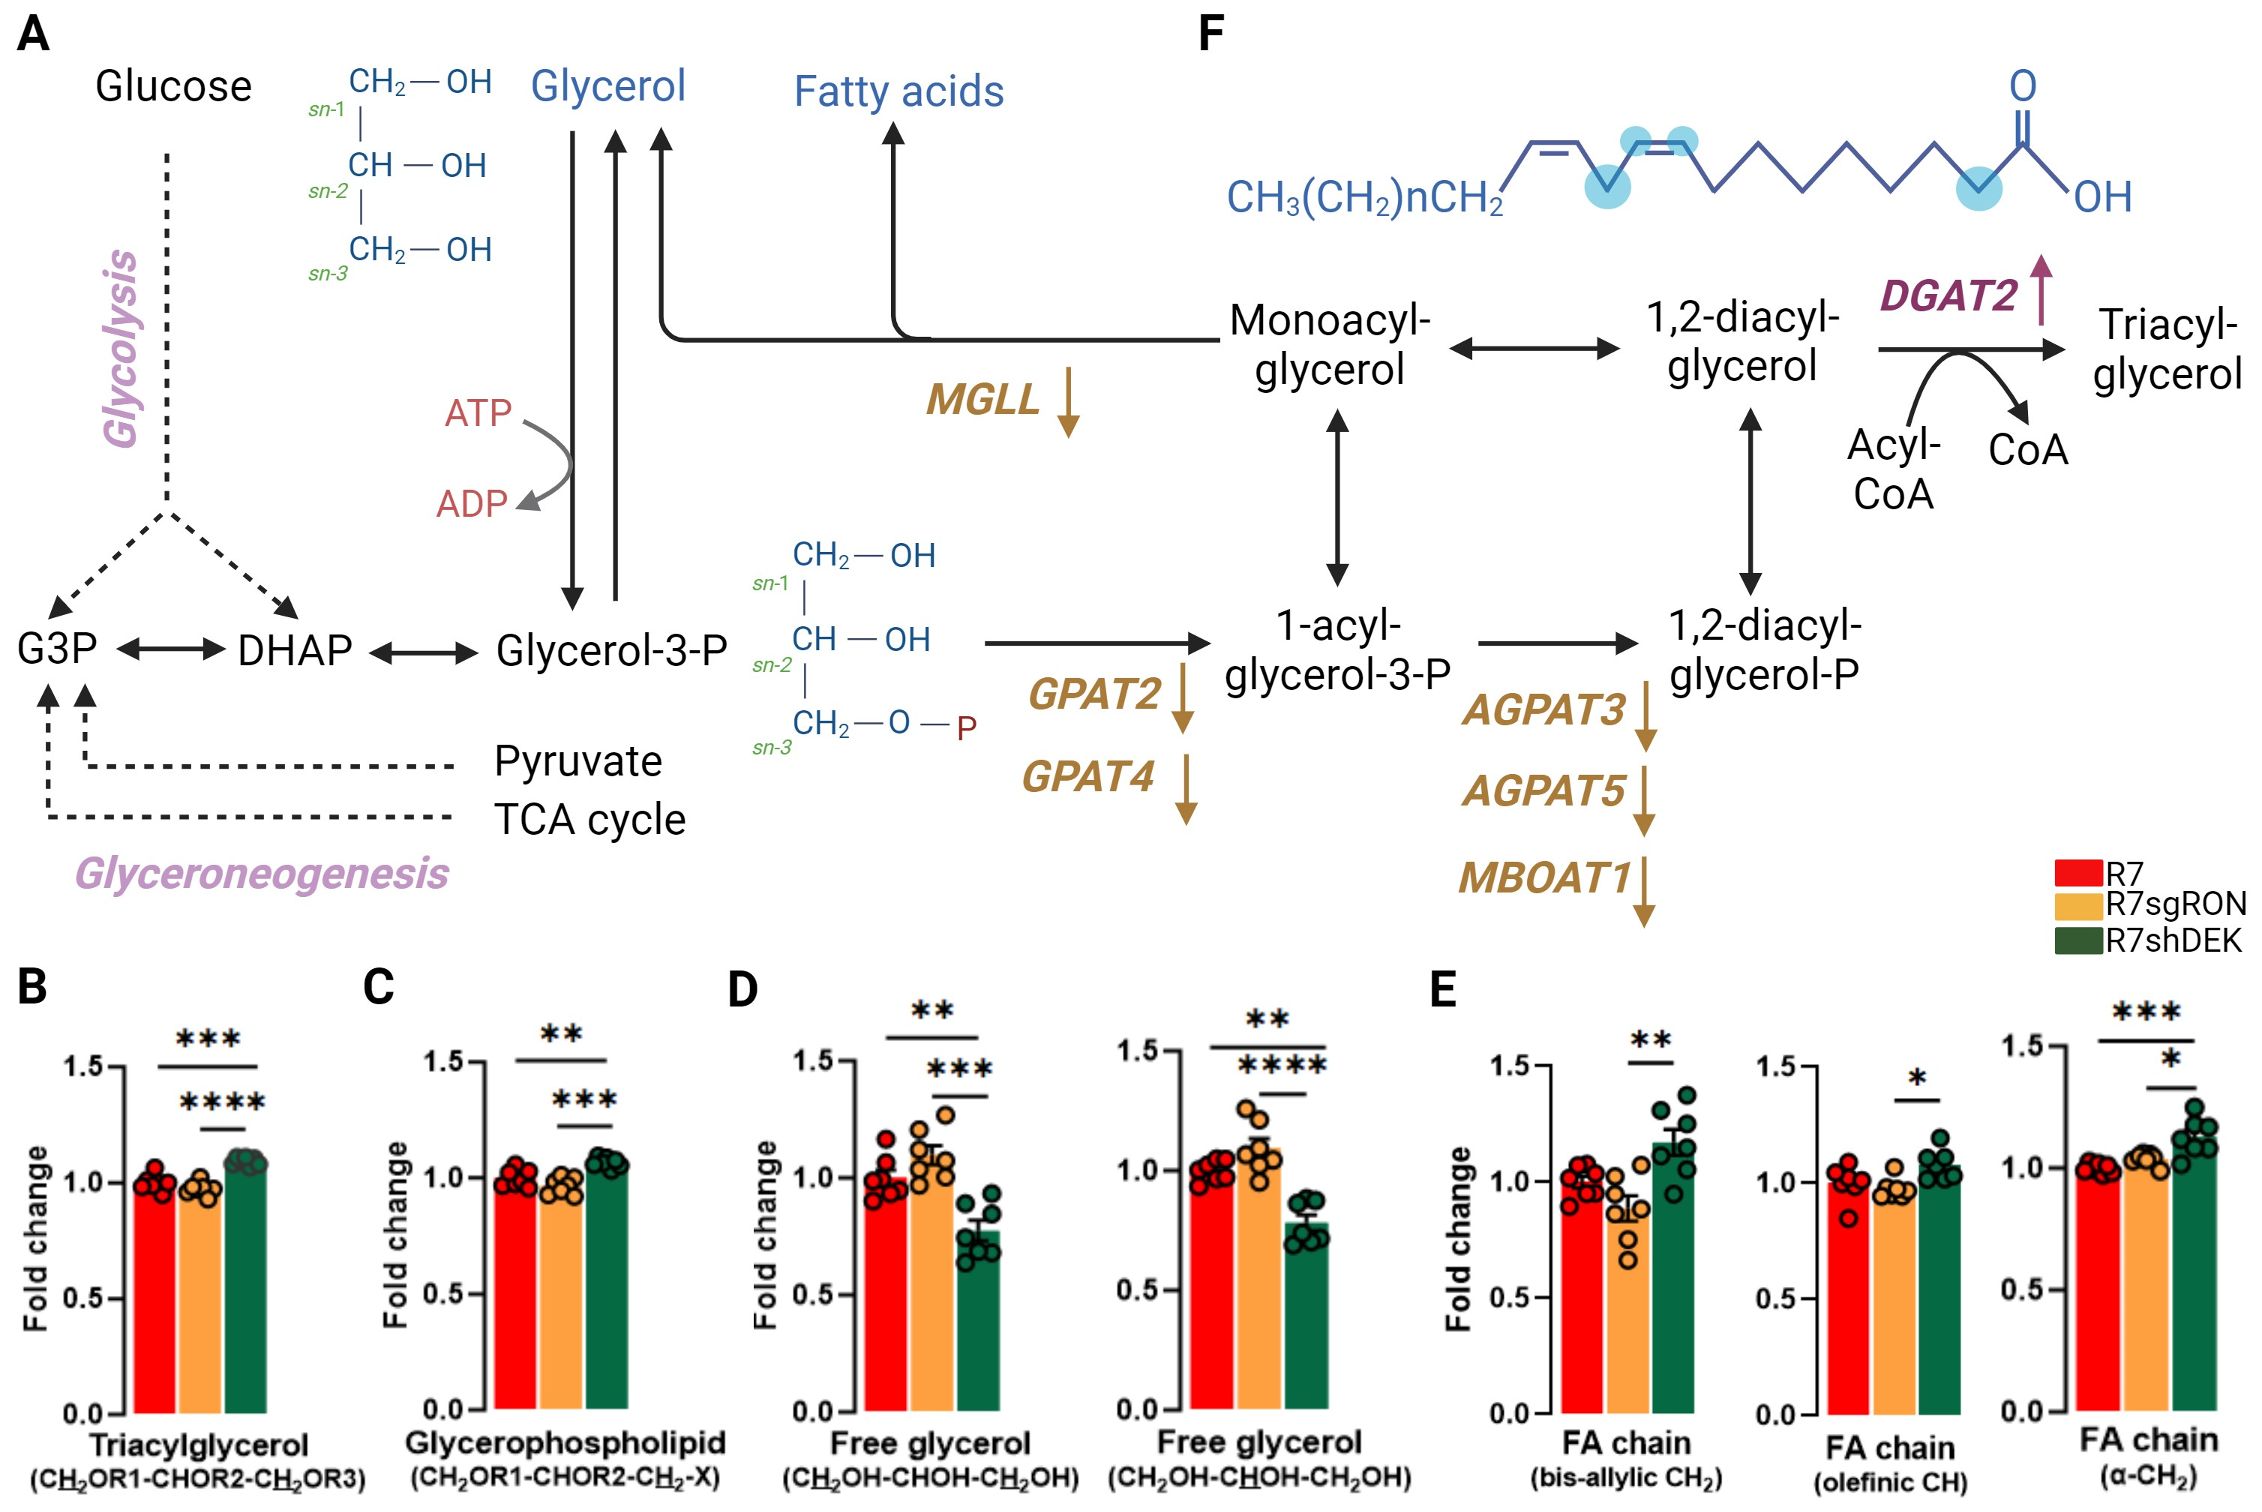
Figure 4. DEK knockdown increases glycerophospholipids and FA while decreasing free glycerol. (A) Schematic representation of metabolic processes involved in the production of glycerol, glycerophospholipids, and fatty acids. Translation products from the KMplot.com-derived lipid metabolism gene signature have been added where appropriate, with an upward arrow indicating that upregulation of this gene is associated with worse patient outcomes and a downward arrow indicating that downregulation of this gene is associated with better patient outcomes. (B) Intracellular fold change of the protons located at positions C1 and C3 of the glycerol backbone (CH2OR1–CHOR2–CH2OR3) of the TAG. (C) The glyceryl C3H2 group (CH2OR1–CHOR2–CH2-X) of glycerophospholipids. (D) The NMR peaks derived from free glycerol, both C1H3 and C3H3 and C2H2 resonances. (E) Analysis of the bis-allylic (–CH2) groups, which is specific for linoleic acid, the olefinic (–CH), and α-methylene fatty acid group of the acyl chain. (F) Chemical structure of a representative fatty acid. The blue dots represent the carbon position analyzed by 1H-NMR. Bar plots indicate mean ± SEM. Replicates of each cell line are shown as individual dots (n = 7). Statistical significance was assessed using one-way ANOVA. *P ≤ 0.05; **P ≤ 0.01; ***P ≤ 0.001; ****P ≤ 0.0001. MGLL, monoglyceride lipase; DGAT2, diacylglycerol O-acyltransferase 2; GPAT2, 1-acylglycerol-3-phosphate O-acyltransferase 2; GPAT4, glycerol-3-phosphate acyltransferase 4; AGPAT3, 1-acylglycerol-3-phosphate O-acyltransferase 3; AGPAT5, 1-acylglycerol-3-phosphate O-acyltransferase 5; MBOAT1, membrane-bound O-acyltransferase domain containing 1.
Triacylglycerols (TAGs) are the major energy reservoir in animals. They contain three esters of glycerol with fatty acids (FA). The main source of free glycerol in cells is lipolysis, which occurs via the breakdown of triacylglycerols into glycerol and free fatty acids (FFAs). Glycerol can also be produced directly from glycerol-3-phosphate via glycolysis (46) (Figure 4A). FAs, specifically the fatty acyl chains as components of complex lipids, are essential for maintaining cell membrane architecture. In fact, de novo FA synthesis (lipogenesis) has been recognized as a hallmark of malignancy. In breast cancer, FA synthesis was reported to be heightened via the upregulation of several lipogenic enzymes, such as FASN and ACLY (47–49).
The main substrate for the biosynthesis of FA is acetyl-CoA, which is first carboxylated by acetyl-CoA carboxylase to form malonyl-CoA. The condensation of seven molecules of malonyl-CoA and one molecule of acetyl-CoA ultimately generates palmitate, a 16-carbon saturated FA. Palmitoyl-CoA is the main product of lipogenesis and can later be elongated and desaturated to produce other FA species. In cancer cells, as a consequence of increased de novo lipogenesis, saturated and monounsaturated FA are the dominant species of FA (12). This provides an advantage for cancer progression and metastasis, since these forms of FA are more stable, less susceptible to peroxidation, and ultimately more resistant to cellular damage (50). Hence, the composition of these FAs is also decisive for the survival of tumor cells. The decreased level of unsaturation in membranes may affect their properties and those of integral membrane proteins.
Quantification of the olefinic (C=CH), as well as the bis-allylic (–CH2) group, which is specific for linoleic acid, revealed that R7shDEK cells harbor significantly increased levels of unsaturated FAs (Figures 4E, F) compared with the R7 and R7sgRON cell lines. This suggests that DEK expression decreases unsaturated FAs, thus decreasing membrane fluidity. In addition, the analysis of the α-methylene FA group showed that total FA levels are increased in R7shDEK compared with R7 and R7sgRON. GPATs (glycerol-3-phosphate acyltransferases) catalyze the first step of the de novo biosynthesis of TAG and glycerophospholipids, whereas the AGPATs (acylglycerolphosphate acyltransferase) and MBOAT1 (membrane-bound O-acyltransferase domain containing 1) catalyze the second step (51). These enzymes have a central role as modulators of lipid homeostasis and storage (52, 53). Specifically, downregulation of GPAT2 has been associated with malignancy, proliferation, and survival in breast cancer cell lines (54). Inhibition of MGLL (monoacylglycerol lipase), which is an enzyme involved in the generation of fatty acids and glycerophospholipids from monoacylglycerol, was associated with decreased infiltration into the blood–brain barrier in triple-negative breast cancer in mouse models (55). This contrasts with our findings below that decreased MGLL mRNA levels are associated with worse prognosis in breast cancer. However, it is important to note that mRNA levels do not necessarily reflect protein levels and/or enzyme activity (56).
3.5 A gene signature of lipid metabolic enzymes predicts breast, ovarian, and lung cancer outcome
We next focused on genes involved in the metabolism of various lipid classes (fatty acids, cholesterol, steroids, sphingolipids, phospholipids, triglycerides, glycolipids, and cardiolipins) and determined where the expression of genes encoding metabolic enzymes in these pathways was associated with worse outcomes in breast cancer outside of the RON/DEK context. We focused on relapse-free survival (RFS) since breast cancer outcomes worsen substantially upon relapse. Using the KMplot webtool, we investigated overall survival (OS, Figure 5A), distant metastasis-free survival (DMFS, Figure 5B), post-progression survival (PPS, Figure 5C), and recurrence-free survival (RFS, Figure 5D) from the Gene Expression Omnibus (GEO)-derived dataset and identified a gene signature of 47 genes associated with significantly decreased patient survival regardless of breast cancer subtype. Table 1 shows the panel of genes, the respective lipid group associated with each gene, and up- or downregulation in patients with worse outcomes. Genes that are predictive of poor patient outcomes when upregulated include the following: enzymes involved in the hydrolyzation of acyl-CoA molecules, such as ACOT7 and ACOT13 (57, 58); DHCR7, an enzyme involved in the final steps of cholesterol biosynthesis (59); and ARSK, an enzyme involved in the modification of steroids, glycolipids, and carbohydrates (60). Genes that are predictive of good patient outcomes when upregulated include ELOVL5, an enzyme involved in the elongation of fatty acids (61); BDH2, an enzyme involved in fatty acid beta oxidation (62); ETNK1, an enzyme required for the first step of phosphatidylethanolamine synthesis (63); and MGLL, an enzyme involved in the production of fatty acids and glycerol from acylglycerides (64).
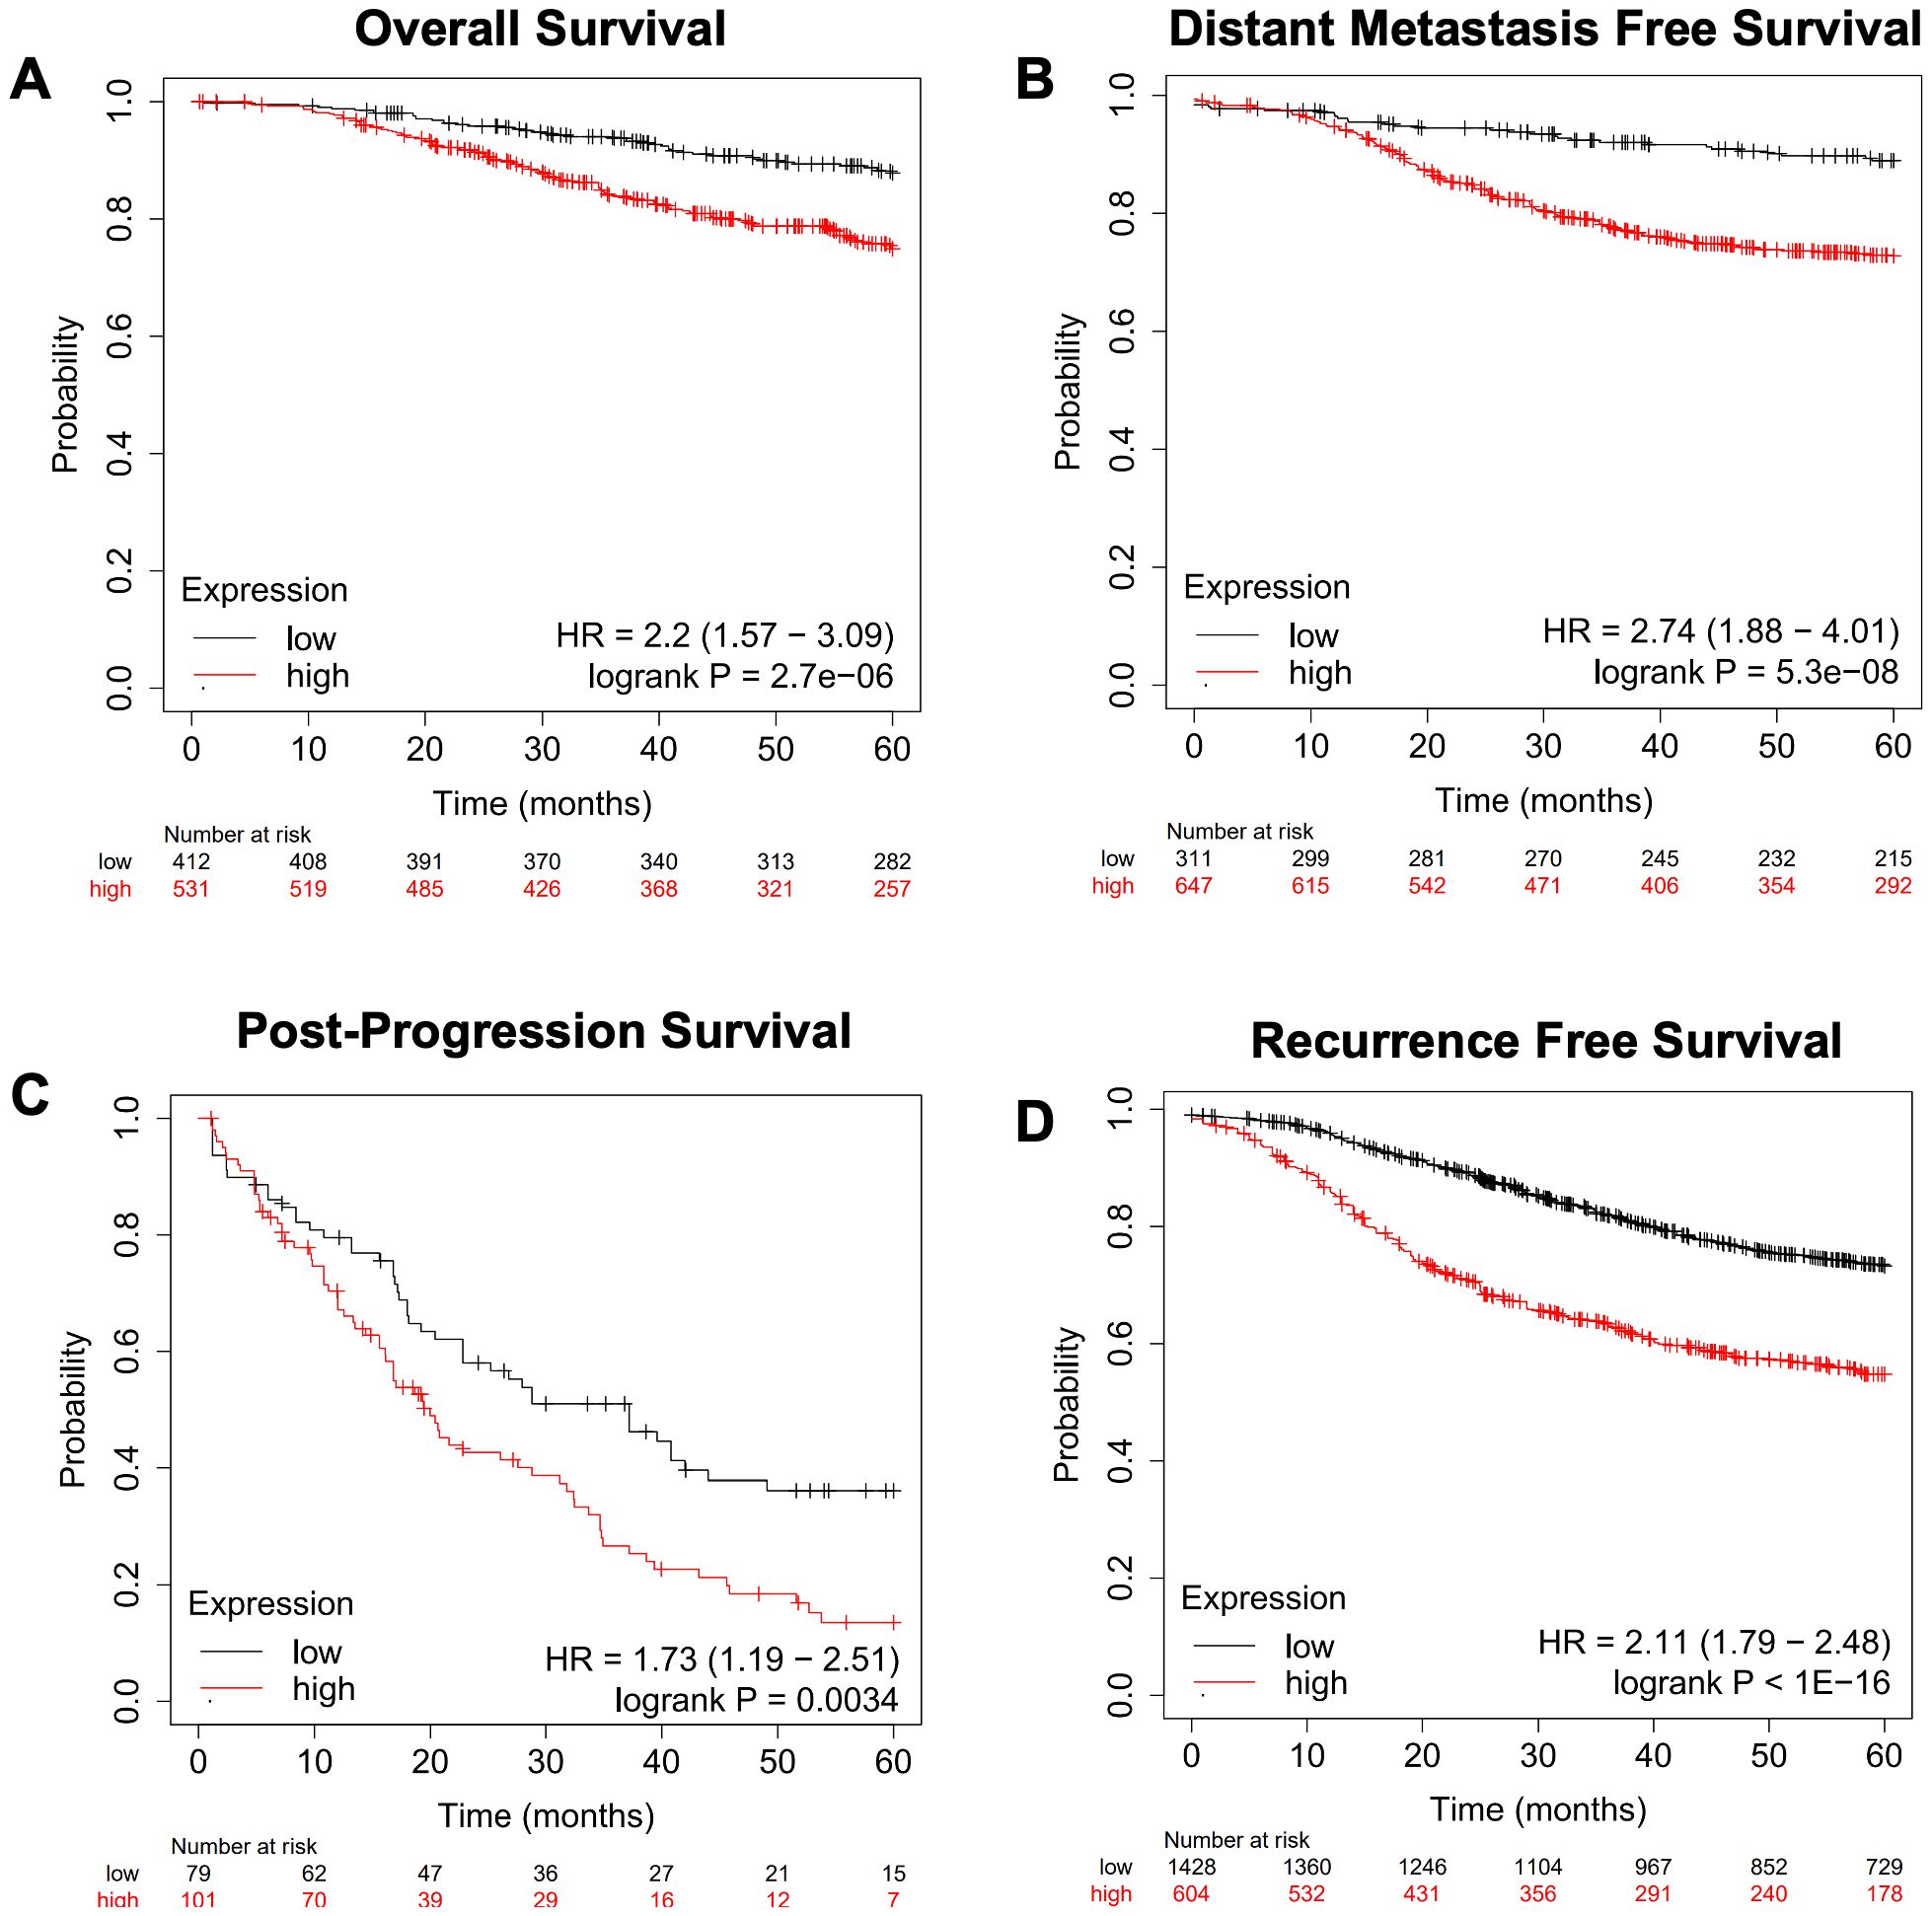
Figure 5. A gene expression signature for lipid metabolism based on KMplot.com GEO-derived breast cancer dataset. Gene Expression Omnibus-derived KMplot breast cancer datasets (23) were used to query. (A) Overall survival (OS), (B) distant metastasis-free survival (DMFS), (C) post-progression survival (PPS), and (D) recurrence-free survival (RFS) of breast cancer patients stratified by expression of the lipid gene signature (Table 1).
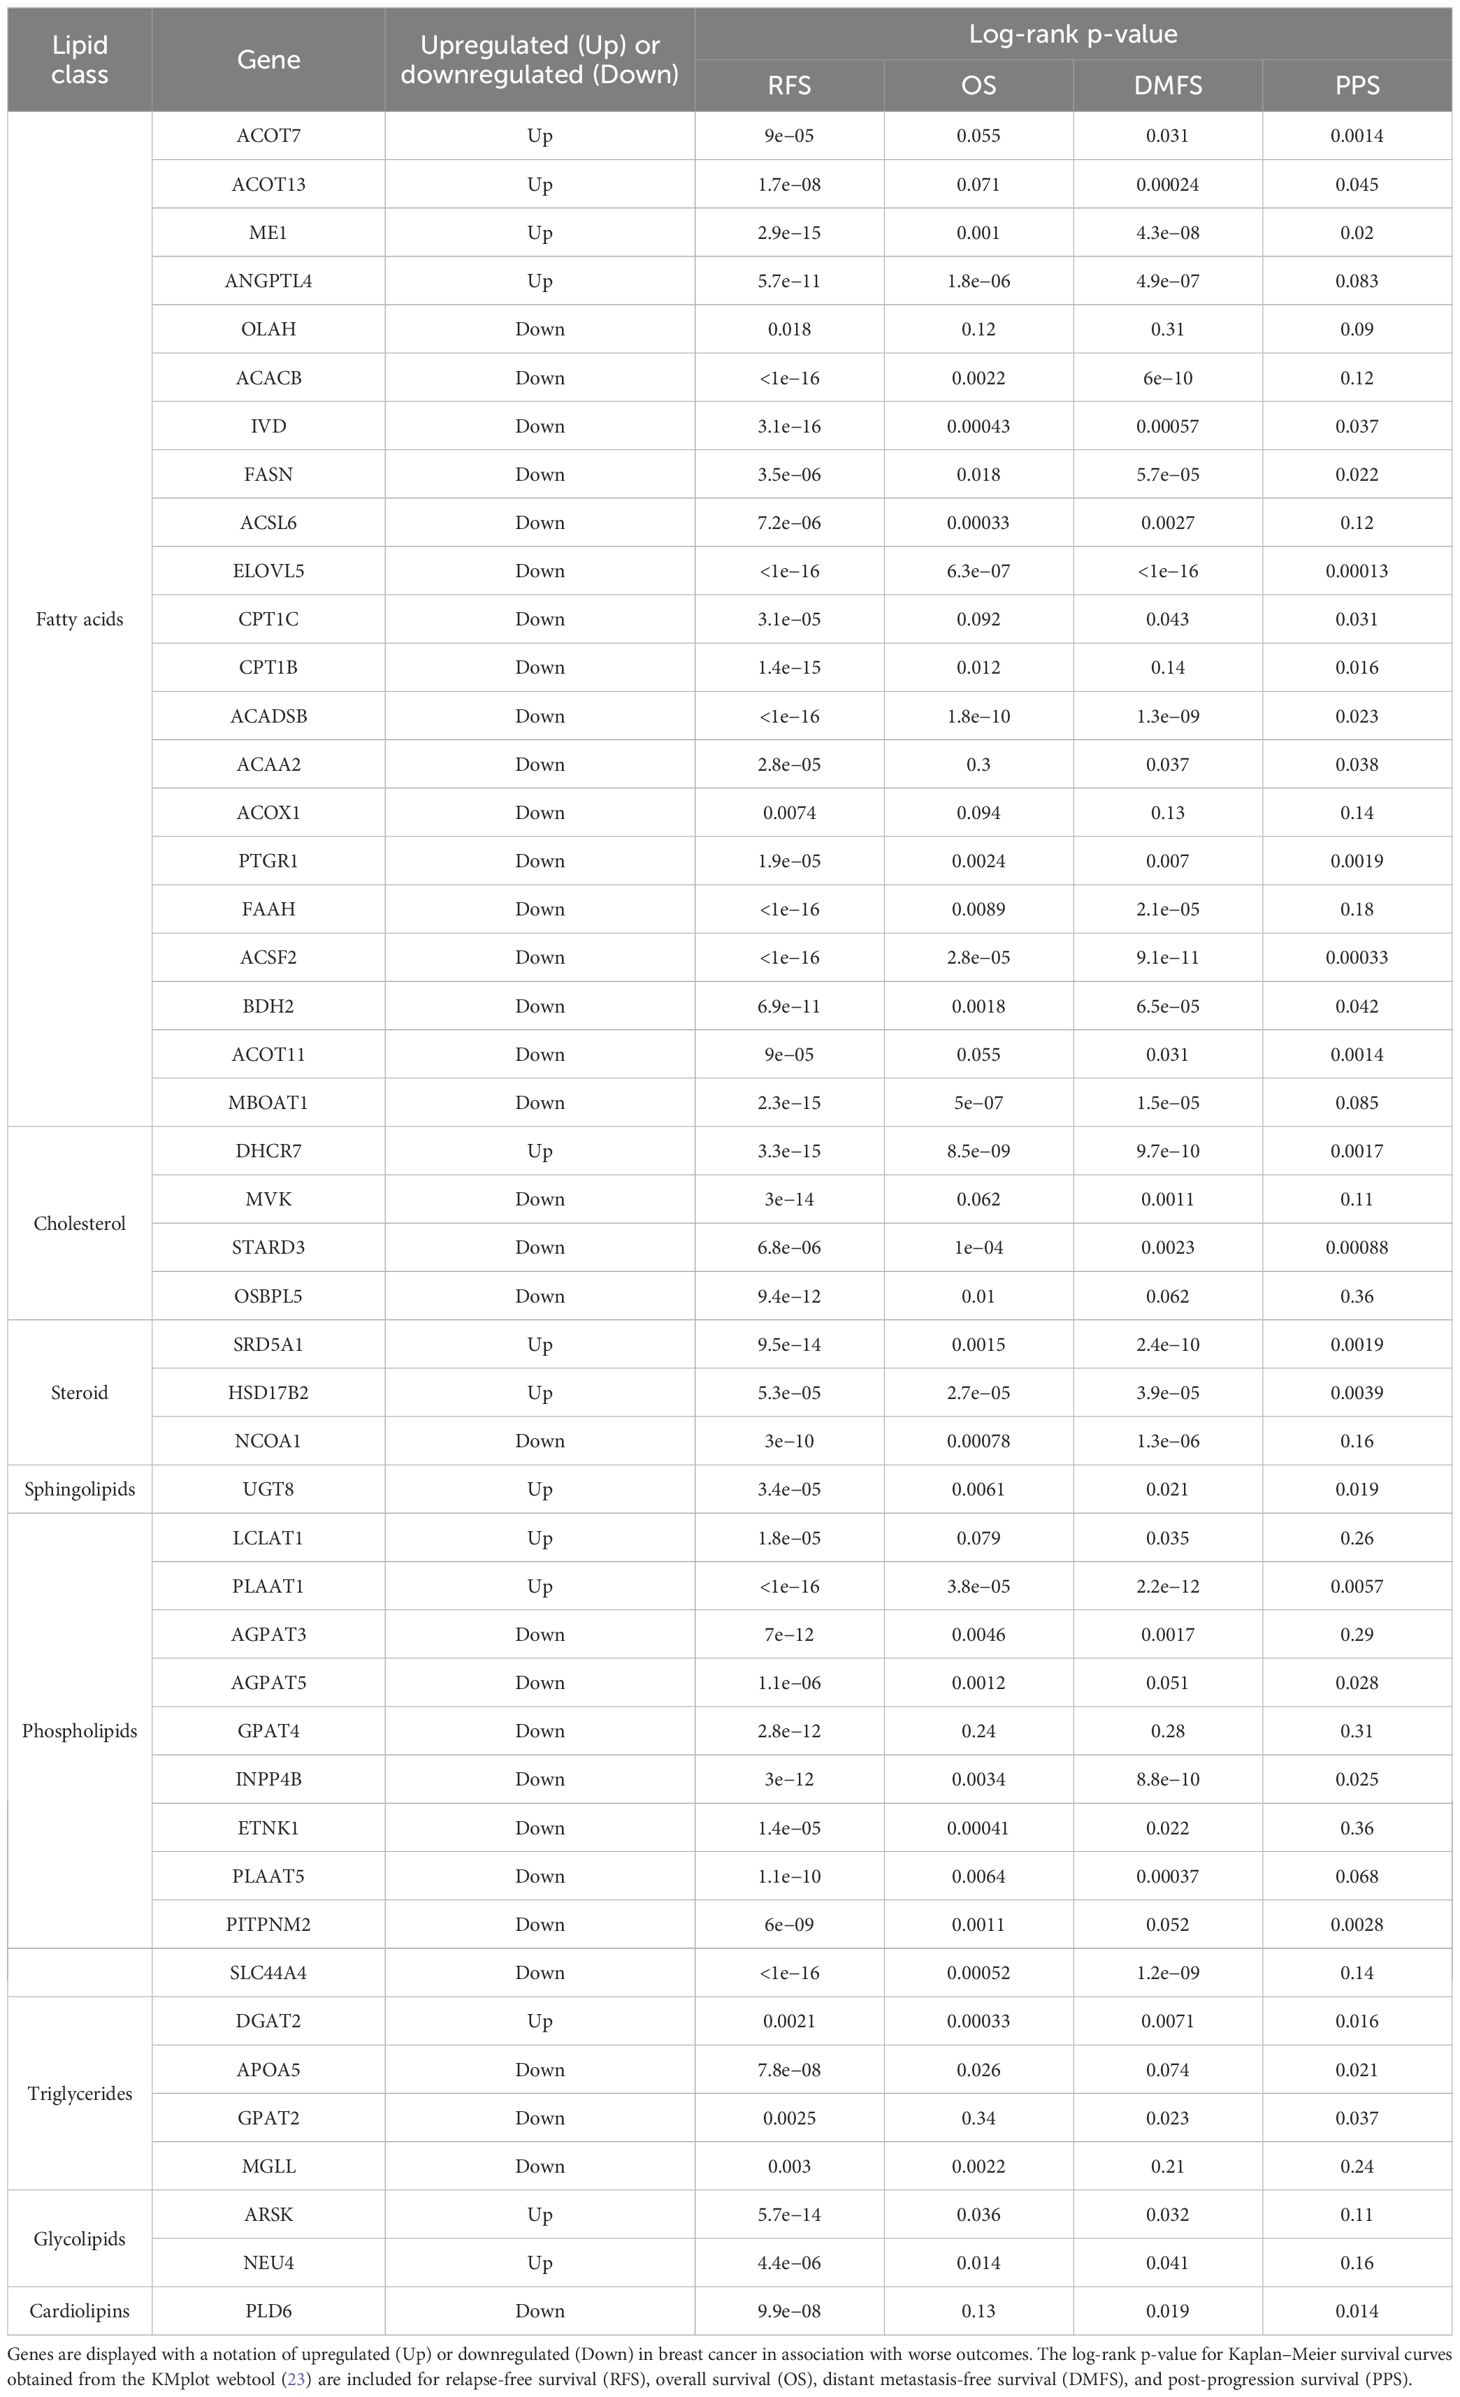
Table 1. Lipid metabolism genes with prognostic capacity.
We next queried the gene signature using an independent Breast Cancer dataset derived from TCGA Pan-Cancer Atlas using overall survival (OS, Figure 6A) and progression-free survival (PFS, Figure 6B), as well as Ovarian Cancer (Figure 6C) and Lung Cancer datasets (Figure 6D) (26). This analysis recapitulated the results obtained from the dataset used in the KMplot webtool.
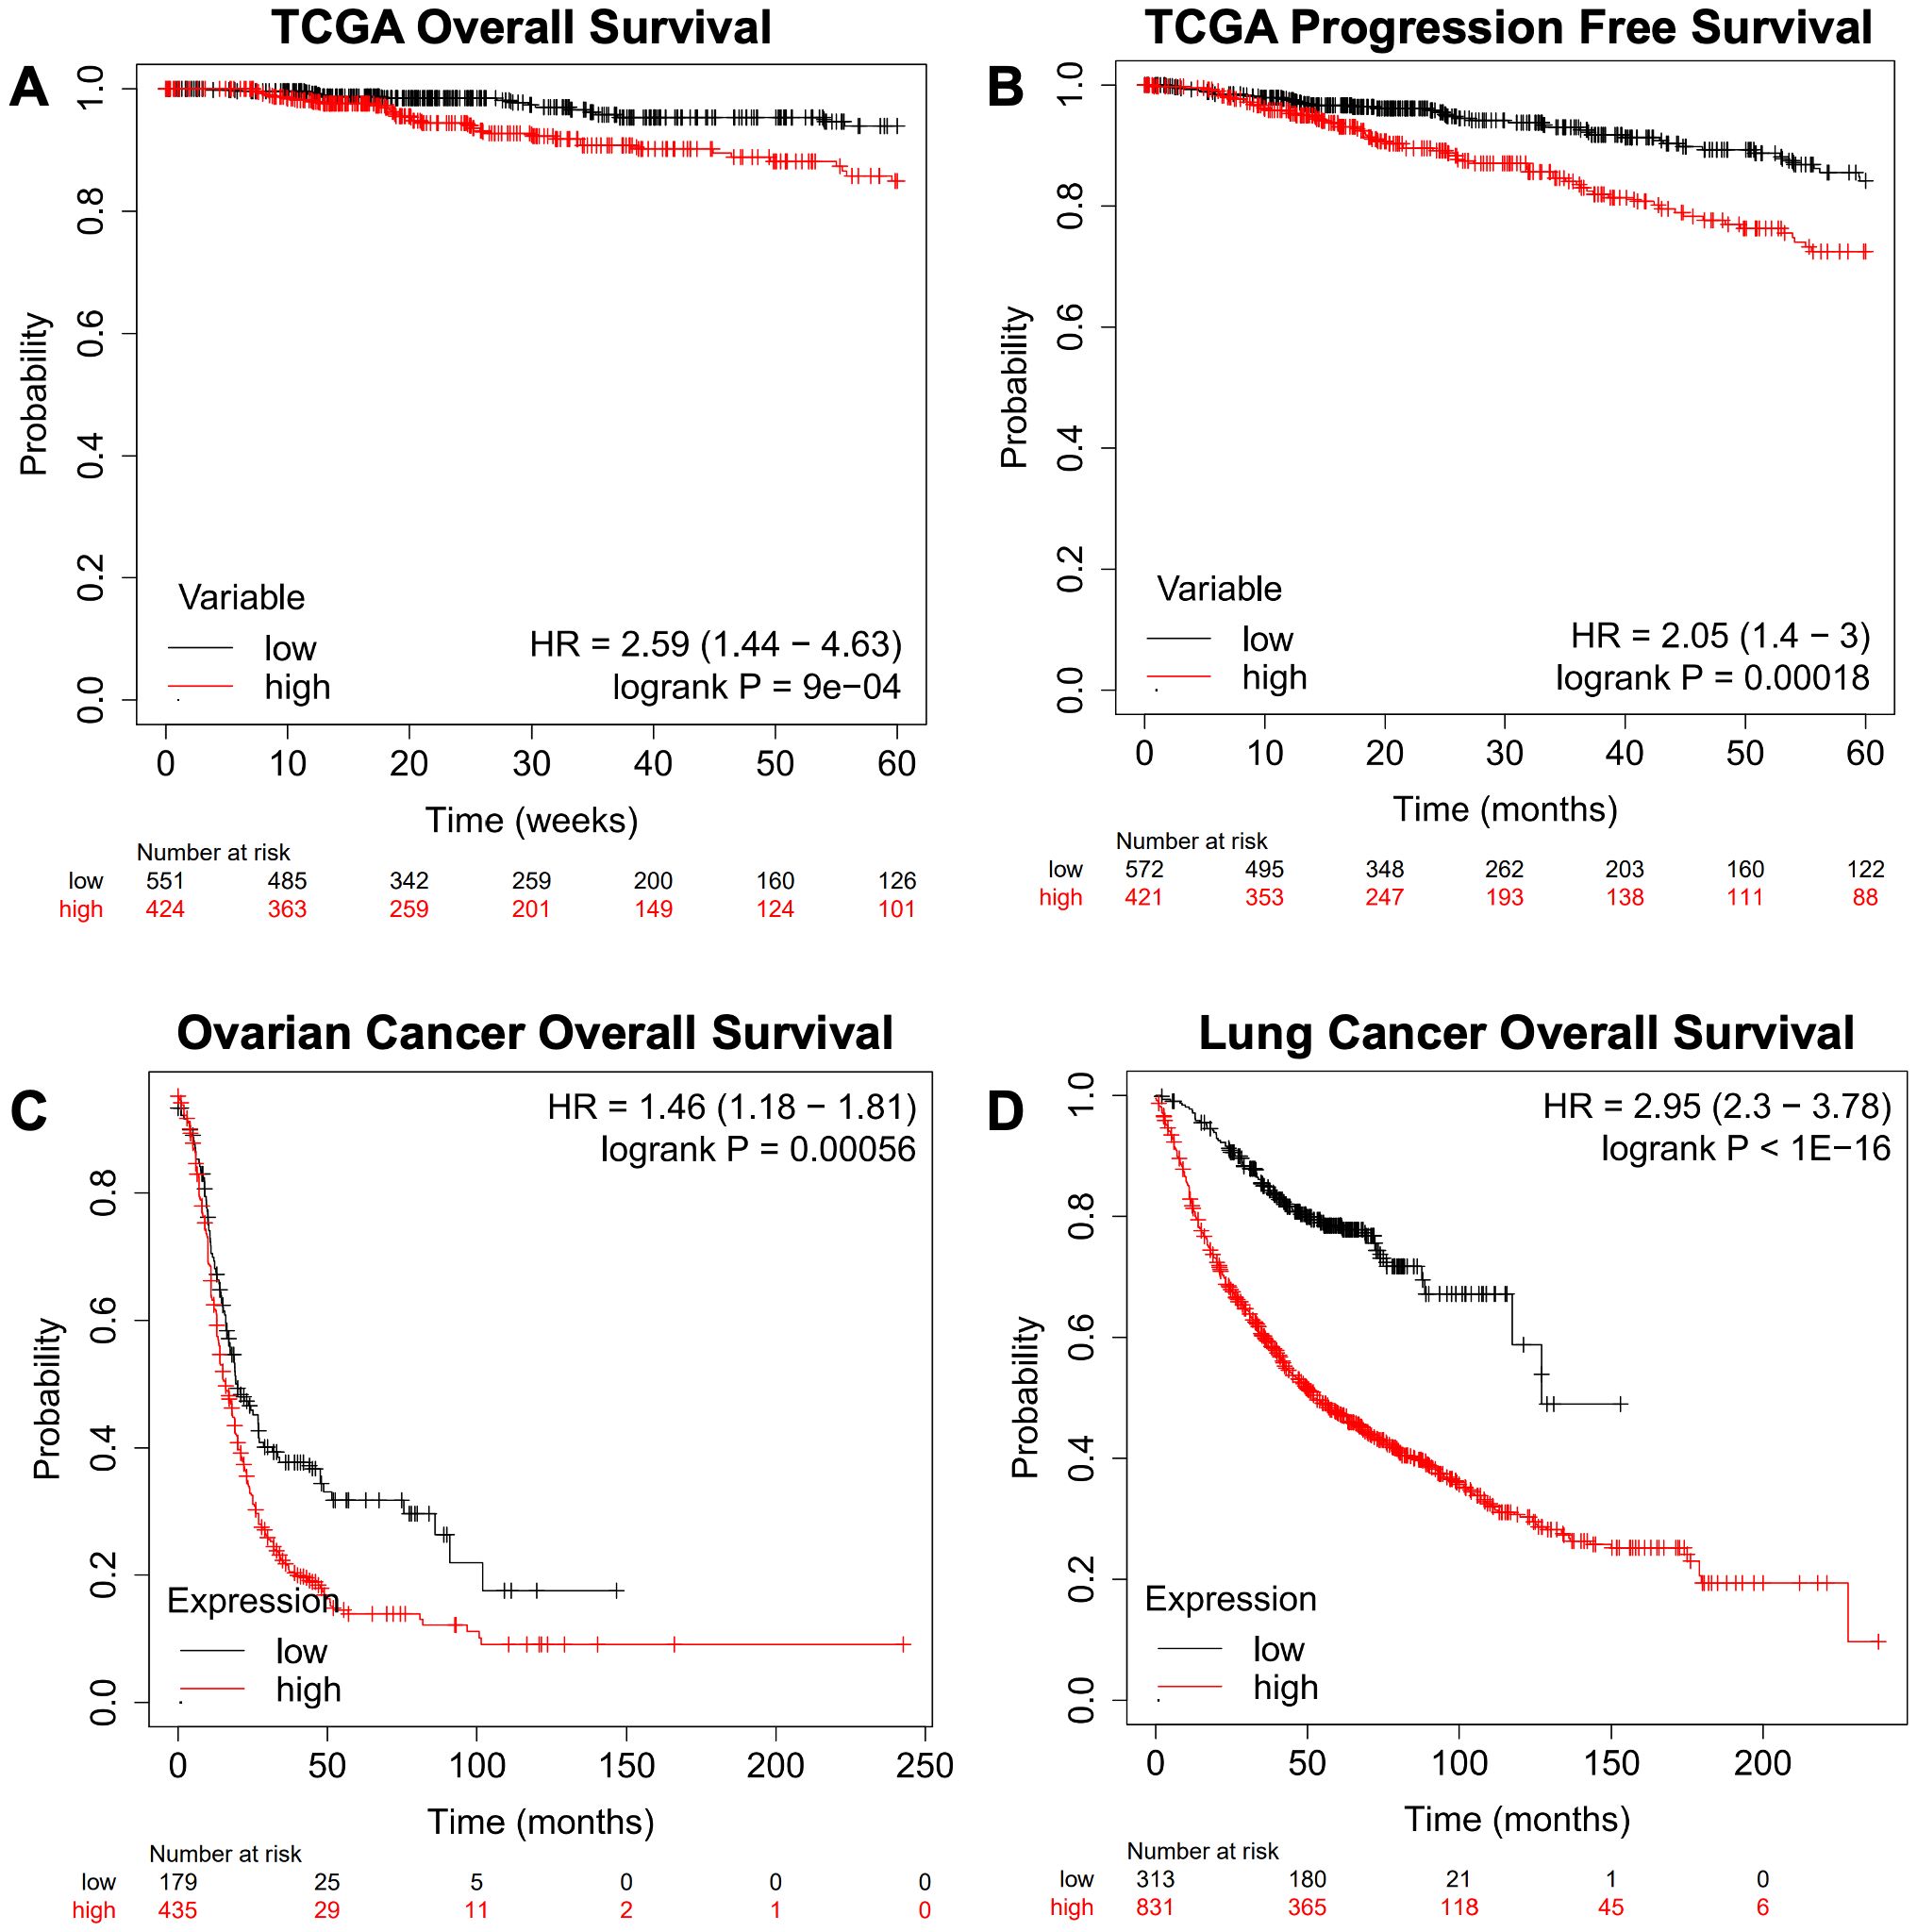
Figure 6. Confirmation of a gene expression signature via a TCGA-based breast cancer dataset and KMplot.com ovarian and lung cancer. The gene signature developed on the KMplot cancer datasets (Table 1) was tested against a breast cancer dataset from The Cancer Genome Atlas (TCGA) Pan-Cancer datasets to examine (A) overall survival (OS) and (B) progression-free survival (PFS). Additionally, Gene Expression Omnibus-derived KMplot ovarian cancer (C) and lung cancer (D) datasets (26, 27) were used to query the effectiveness of the gene signature in cancers other than breast cancer via overall survival (OS).
We further characterized the lipid gene signature in breast cancer by narrowing our focus to either Node+ or Node− patients using data from KMplot.com (Figure 7). The gene signature predicted worse overall survival (Figures 7A, D), recurrence-free survival (Figures 7B, E), and distant metastasis-free survival (Figures 7C, F) regardless of nodal status, with a hazard ratio of 20.49 for distant free metastasis in Node− patients (Figure 7F). Importantly, this implies that in patients with early-stage (Node−) breast cancer, this gene signature is highly predictive of progression to metastatic disease.
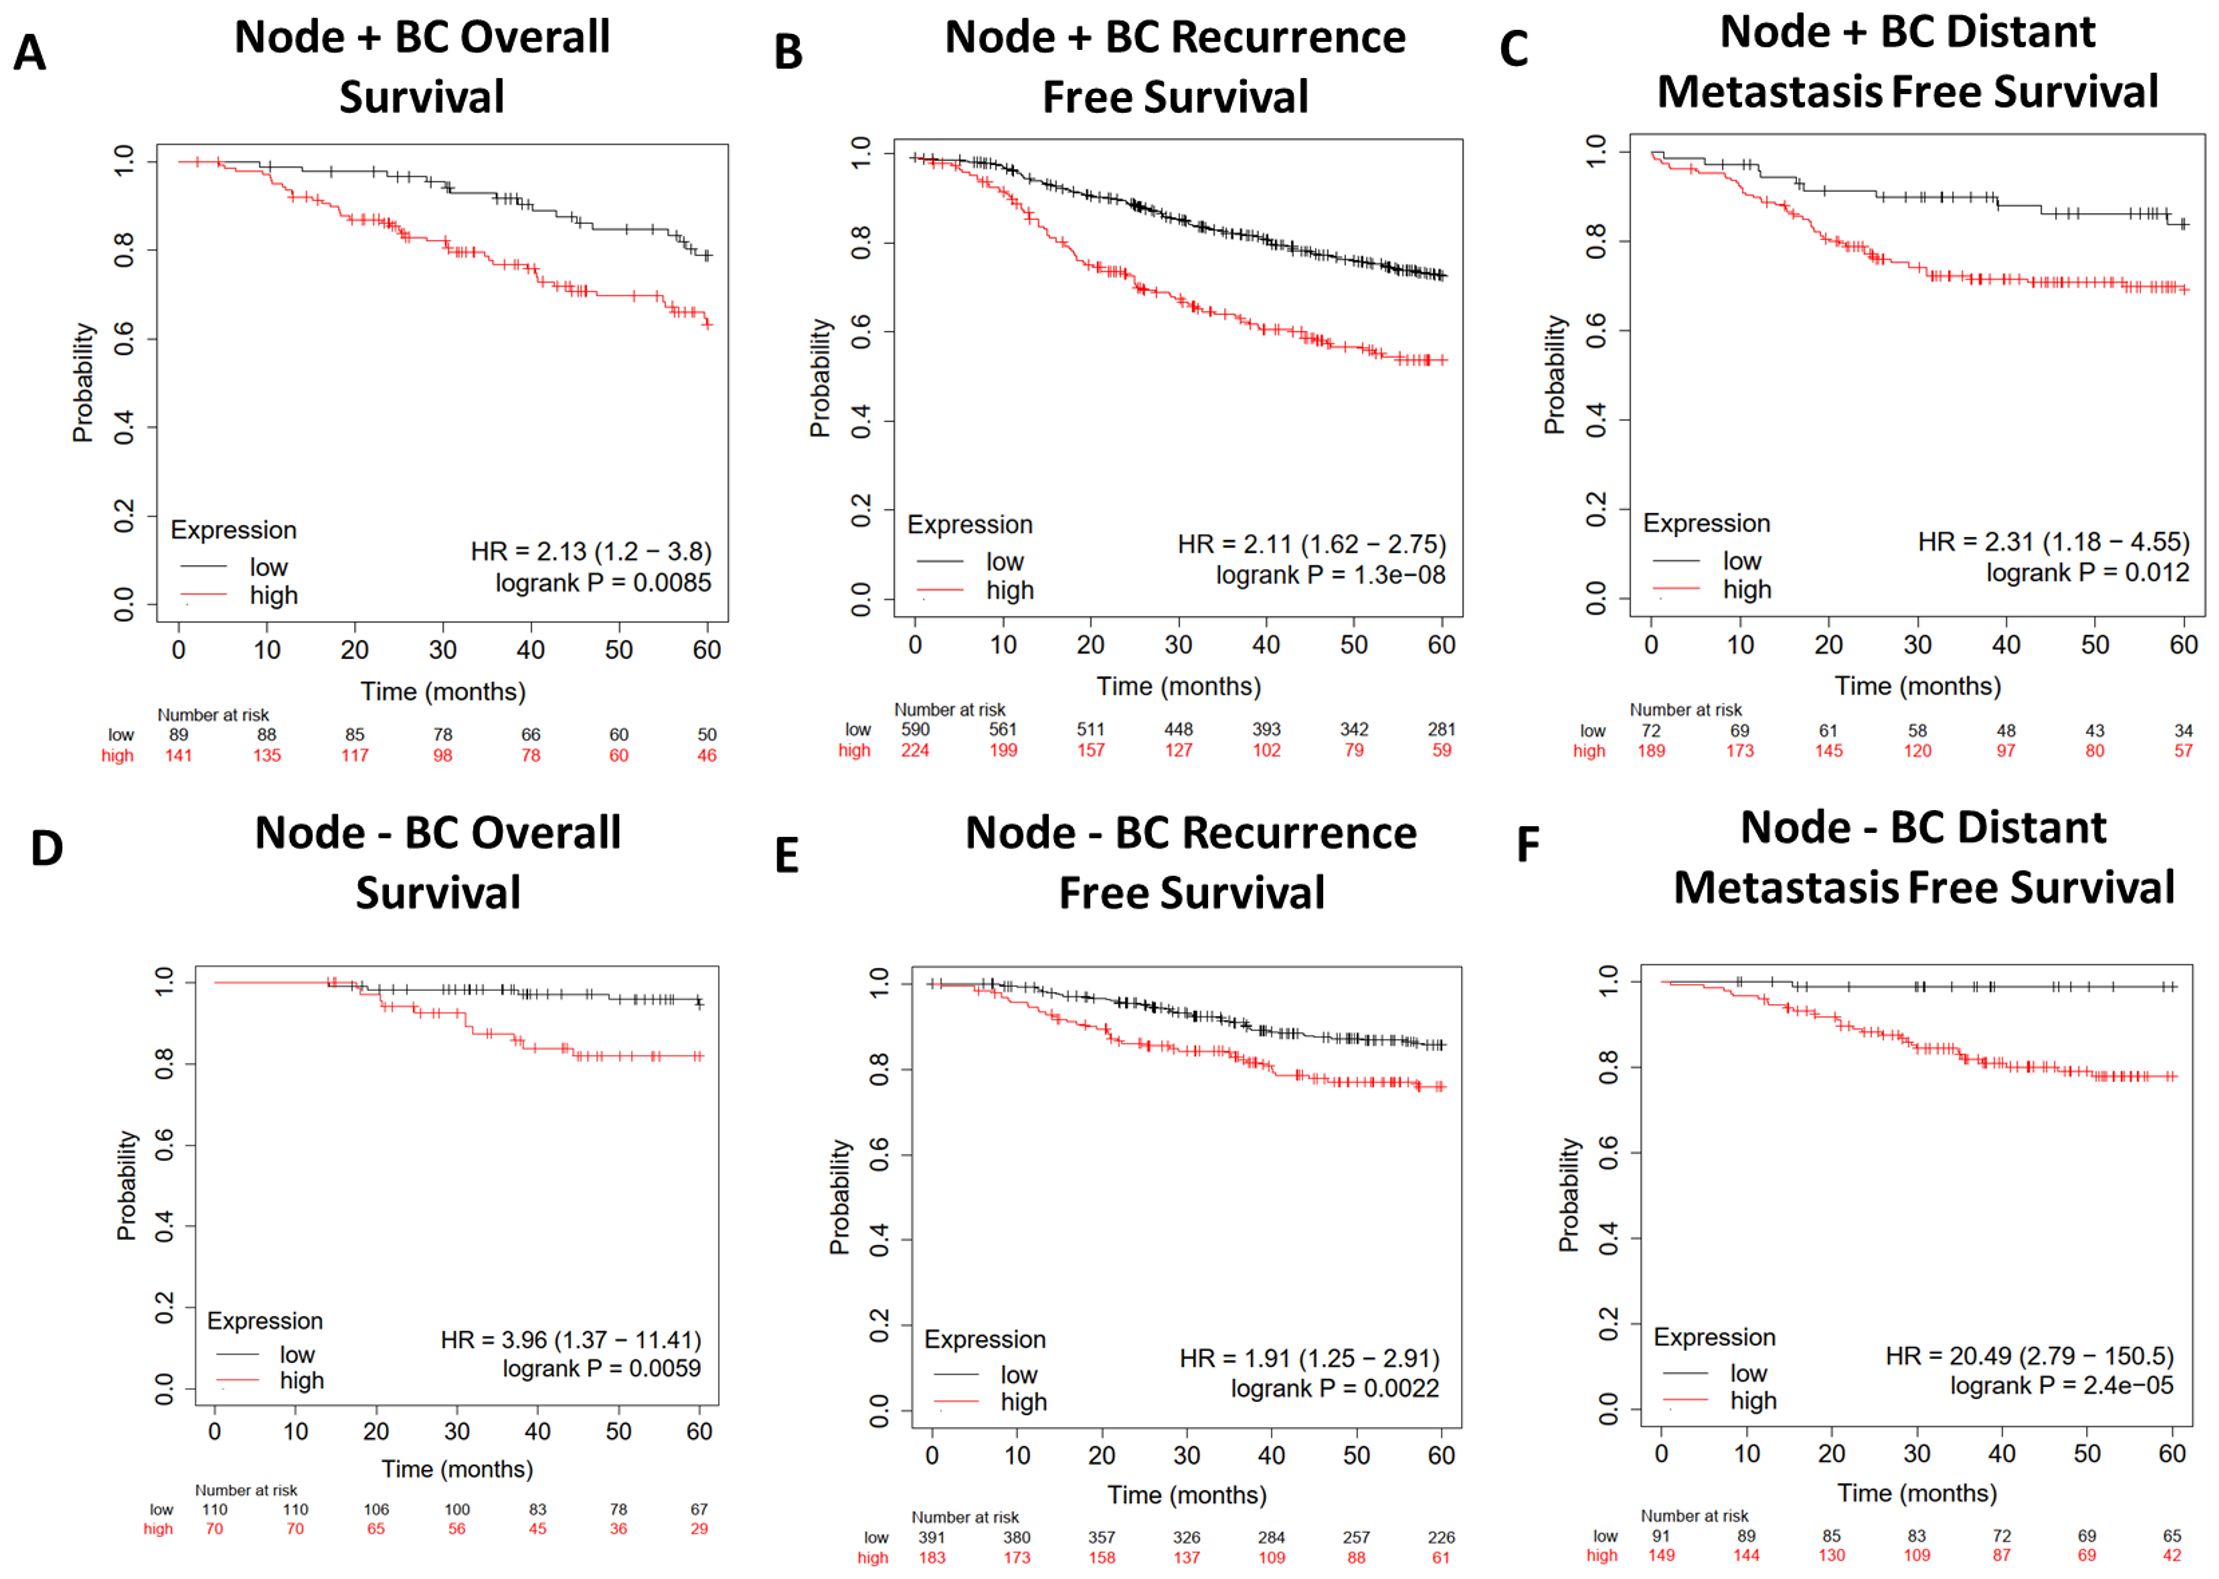
Figure 7. Survival analysis of Node+ and Node− breast cancer patients from GEO-derived datasets on KMplot.com. Gene Expression Omnibus-derived KMplot breast cancer datasets (23) were used to query (A, D) overall survival (OS), (B, E) recurrence-free survival (RFS), and (C, F) distant metastasis-free survival (DMFS) of breast cancer patients stratified by expression of the lipid gene signature (Table 1).
We then tested the predictive potential of the above lipid metabolism signature for breast cancer, ovarian cancer, colorectal cancer, and glioblastoma response to therapy using the ROCplot webtool. The genes were separated into two sets. One set included genes that were overexpressed in cancers that had recurred, whereas the other set included genes that were underexpressed in cancers that had recurred. Genes that were overexpressed were predictive of a complete response to chemotherapy in breast cancer (Figure 8A), whereas genes that were underexpressed were predictive of relapse-free survival in breast cancer (Figure 8B). Both sets of genes were predictive of relapse-free survival in Node+ breast cancer (Figures 8C, D).
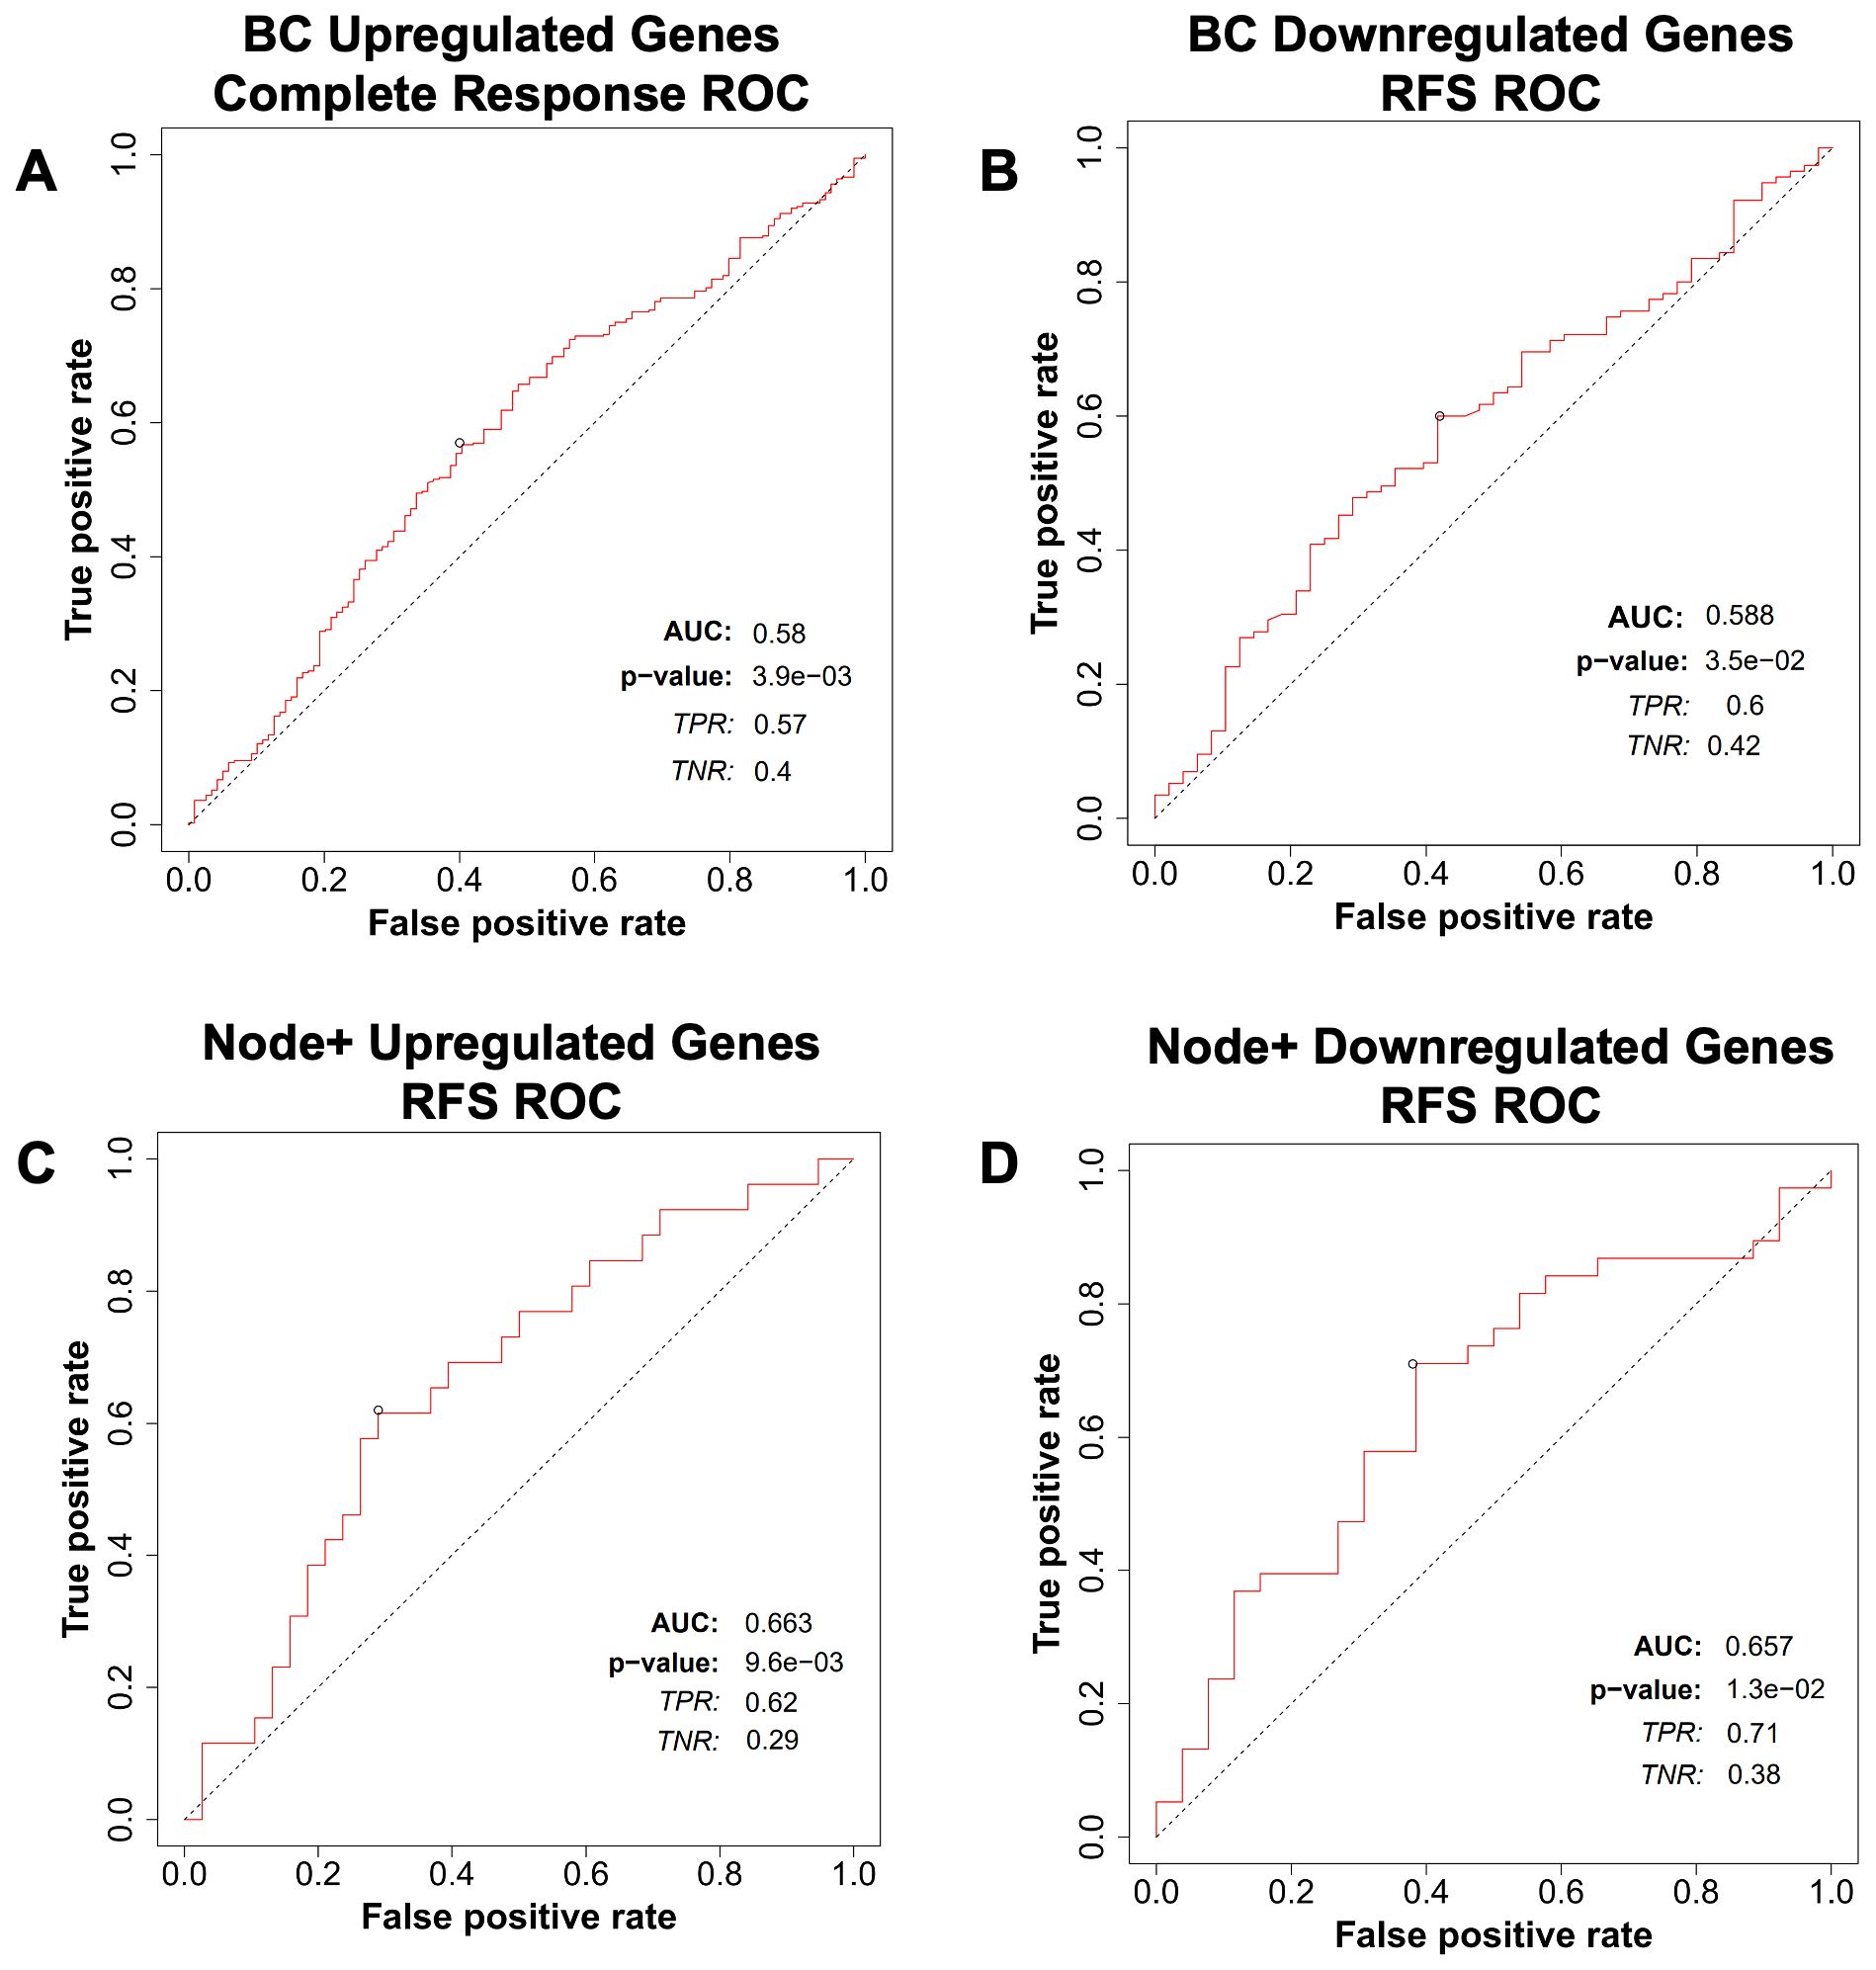
Figure 8. Breast cancer patient response to therapy compared with the gene expression signature from ROCplot.com. (A) Receiver-operator characteristic (ROC) analysis of breast cancer patient complete response to chemotherapy stratified by expression of genes in the lipid gene signature (Table 1) found to be upregulated in recurrent breast cancer. (B) Receiver-operator characteristic (ROC) analysis of breast cancer patient recurrence-free survival (RFS) to chemotherapy stratified by expression of genes in the gene signature found to be downregulated in recurrent breast cancer. Receiver-operator characteristic (ROC) analysis of node-positive breast cancer patient RFS to therapy stratified by expression of genes in the gene signature found to be (C) upregulated and (D) downregulated in recurrent breast cancer.
To further refine the lipid gene signature to its necessary components, we determined the minimal number of lipid metabolism related genes predictive of breast cancer outcomes and arrived at four genes based on their RNA-seq expression in R7 and T47D cell lines compared with their isogenic shRON counterparts (65): DHCR7, BDH2, ELOVL5, and ARSK. Compared with the above signature of 47 genes, these four genes were equally sufficient to predict poor overall survival, distant metastasis-free survival, post-progression survival, and recurrence-free survival at 60 months (Figures 9A–D). In addition, ROC analysis was performed using these four genes on the ROCplot webtool showing a prediction of complete response to chemotherapy similar to that of the 47 gene signature (Supplementary Figure S2).
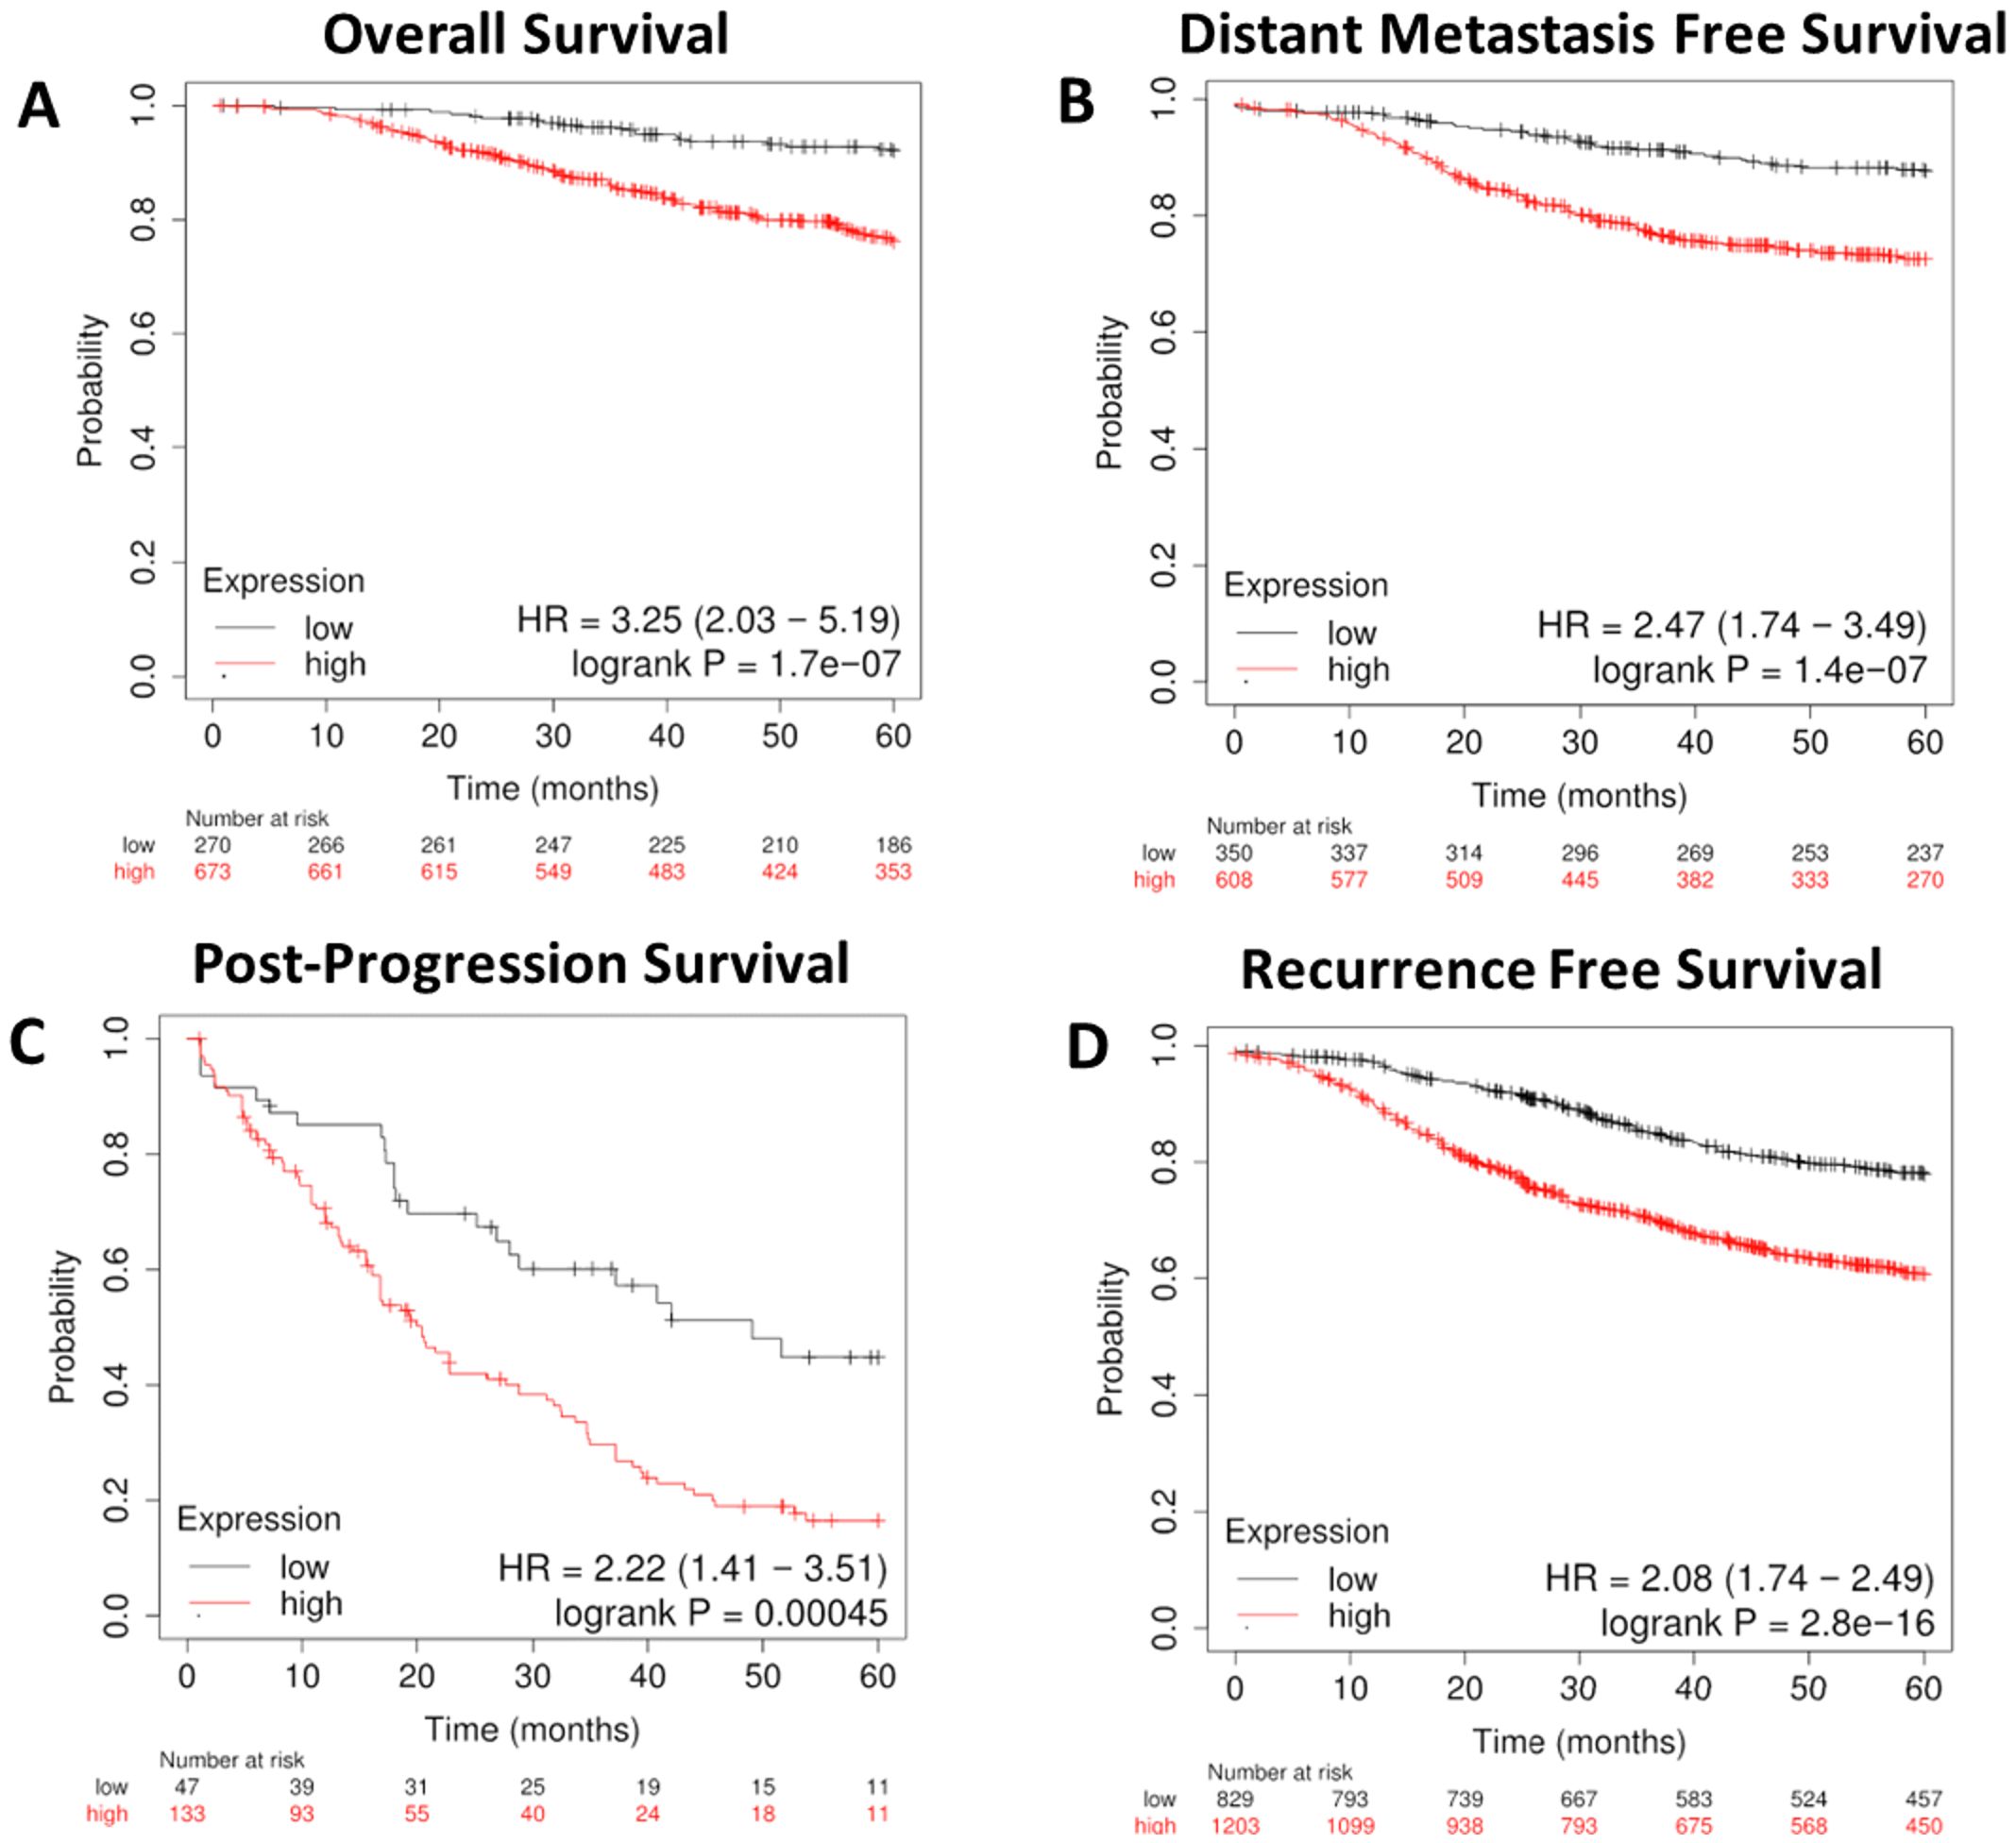
Figure 9. A refined gene expression signature for lipid metabolisms based on KMplot.com GEO-derived breast cancer dataset. Gene Expression Omnibus-derived KMplot breast cancer datasets (23) were used to query (A) overall survival (OS), (B) distant metastasis-free survival (DMFS), (C) post-progression survival (PPS), and (D) recurrence-free survival (RFS) of breast cancer patients stratified by expression of the four gene lipid gene signature (Table 2).
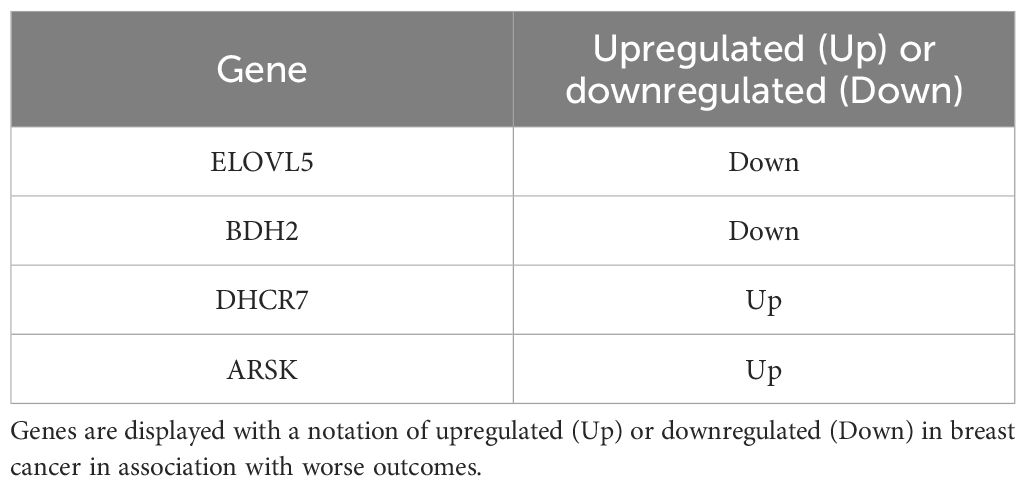
Table 2. Four lipid metabolism genes with prognostic capacity.
4 Discussion
RON and DEK are implicated in breast cancer metastasis and recurrence, and since these same phenotypes have been linked to lipid dysregulation, the gene signature discovered here might have diagnostic and prognostic potential for patients with breast and other cancer types. In the present study, 1H-NMR spectroscopy was employed as an exploratory tool to identify dysregulated lipid families and characterize the lipid metabolic profile of murine breast cancer cells with respect to loss of RON or DEK expression. Specifically, we obtained global information on glycerophospholipid head groups and backbones, acyl chain length, and degree of unsaturation of fatty acids, as well as cholesterol and sphingolipid content. Although NMR-based methods are generally less sensitive than MS and can be limited by overlapping signals, here we describe a simple and efficient NMR-based lipidomic method to provide a non-destructive comprehensive lipid profile in a single experiment with minimal sample processing and without multiple internal standards.
A wealth of evidence has shown that lipid metabolism is important in metastasis and recurrence of breast cancer. For instance, cholesterol biosynthesis inhibition using statins lowered the risk of recurrence (66). We have further shown that RON signaling increases cholesterol levels and that RON-stimulated metastasis and recurrence can be suppressed by statins. In addition, fatty acid synthesis promotes DNA damage and ROS production in residual breast cancer cells (67). Although the exact roles that DNA damage and ROS play in cancer are unclear, the data presented in the gene signature here imply that fatty acid synthesis may suppress cancer progression, perhaps due to modulation of DNA damage and ROS levels. Independent of RON, DEK appears to lower total fatty acid levels, as a possible contributor to the pro-tumor capabilities of DEK in breast cancer. Although clinical data are lacking, trends in the published cellular literature indicate that sphingolipids and phospholipids also play key roles in breast cancer recurrence and metastasis (68–70). RON, independent of DEK, seems to increase sphingomyelin levels. The literature combined with the lipid data presented in this report supports possible roles for RON and DEK in the reprogramming of breast cancer cells toward a cancer stem cell phenotype. Specifically, RON appears to promote cholesterol and sphingomyelin levels whereas DEK suppresses cholesterol and total fatty acid levels. However, further investigations are necessary to establish the functional consequences of the observed lipid profile.
We have previously reported studies of the polar fractions from the above cell lines (18). Integrating the polar and non-polar data increases our understanding of the impact of RON and DEK on pathways that feed into lipid metabolism. For instance, we previously found that pyruvate levels were suppressed by RON but stimulated by DEK. Pyruvate can be metabolized into glycerol, which also shows a similar pattern as pyruvate with suppression by RON, and stimulation by DEK in the absence of glycerol changes. This indicates that RON and DEK may independently regulate the flux of pyruvate into different pathways. In addition, pyruvate can be converted into acetyl-CoA and used for fatty acid and cholesterol synthesis. Other contributors to acetyl-CoA levels that we have previously measured include isoleucine, which was found to be increased by both DEK and RON; glutamate, which was not affected by RON or DEK knockdown; citrate, which was found to be suppressed by both RON and DEK; and acetate, which was found to be increased by both RON and DEK. However, in the absence of tracer experiments, it is difficult to determine the relative contributions of these different pathways to lipid synthesis.
For phospholipids, we found in our previous manuscript that phosphatidylcholine levels were stimulated by RON and DEK, whereas glycerophosphatidylcholine was suppressed by RON and stimulated by DEK. The observed dysregulation of specific phospholipids in the absence of RON occurred without any change in total phospholipid levels, and the lack of a change in the glycerol signature. In addition, we observed alterations in sphingolipid levels, the degree of unsaturation, and cholesterol level, which is importantly involved in membrane lipid raft function. This suggests that RON and DEK may control pathways that influence the physical properties of membranes including fluidity and signaling, important possible contributors to metastasis and recurrence in breast cancer.
There is evidence that implicates ELOVL5 (61), DHCR7 (71), ACOT7 (72), ME1 (73), ACACB (74), FASN (75), ACSL6 (76), CPT1B (77), FAAH (78), ANGPTL4 (79), STARD3 (80), SRD5A1 (81), HSD171B (82), NCOA1 (83), UGT8 (40), INPP4B (84), DGAT2 (85), MBOAT1 (86), PTGR1 (87), and PLD6 (88) in breast cancer prognosis. However, these studies focused on changes in growth, proliferation, and prognosis and did not report on changes in metabolites. Several genes included in the predictive lipid-related gene signature have not yet been studied in the context of breast cancer, which include ACAA2, ACSF2, AGPAT3, AGPAT6, APOA5, ARSK, BDH2, CBR4, ACOT13, ACOT11, MVK, OLAH, ACADSB, ACOX1, IVD, LCLAT1, MGLL, SLC44A4, PLAAT1, PLAAT5, and PITPNM2. This indicates a need for additional studies of the functional roles of these genes as potential drivers of breast cancer metastasis and recurrence. For example, the hazard ratio for the ACADSB RFS curve alone was 0.54, which indicates that patients with high ACADSB levels in their tumors are half as likely to have recurrence compared with patients with low ACADSB, thus supporting a potential high value of this gene as a predictive biomarker and driver or survival.
To define the significance of the gene signature, we focused on node +ve breast cancers, which have already spread to lymph nodes and carry a high likelihood of recurrence. Focusing on the group of 47 genes (Table 1) that were indicative of improved response to treatment in node +ve patients, we also identified patients at a higher risk of recurrence and non-response to treatment. We were able to narrow this gene signature down to a combination of only four genes which fully retain the predictive power of the previous signature. At least some of these genes might be functionally involved in cancer phenotypes that portend poor outcome, and in this case, their therapeutic modulation may result in new avenues to suppress breast cancer recurrence and/or treatment resistance. Lipid profiles identified in sgRON and shDEK murine cell lines are the foundation for future research in animal models of breast cancer recurrence and metastasis. Data validation in human models is now critical to advance lipid related biomarkers and targets toward clinical application.
Data availability statement
The original contributions presented in the study are included in the article/Supplementary Material, while the raw datasets are available in a publicly accessible repository. This data can be found at the NIH Common Fund's National Metabolomics Data Repository. Project ID PR002009.
Ethics statement
The animal study was approved by George Babcock, Chair IACUC committee Holly Bante, Ethics Oversight Jane Strasser and Patrick Limbach Lead the Office of Research in charge of IACUC and Ethics. The study was conducted in accordance with the local legislation and institutional requirements.
Author contributions
SV-M: Data curation, Formal analysis, Investigation, Methodology, Software, Visualization, Writing – original draft, Writing – review & editing. JD: Data curation, Formal analysis, Investigation, Methodology, Software, Visualization, Writing – original draft, Writing – review & editing. AdL: Data curation, Formal analysis, Validation, Writing – review & editing. ANL: Methodology, Supervision, Writing – review & editing. SEW: Conceptualization, Funding acquisition, Investigation, Project administration, Resources, Supervision, Writing – review & editing. SIW: Conceptualization, Funding acquisition, Investigation, Project administration, Resources, Supervision, Writing – review & editing.
Funding
The author(s) declare financial support was received for the research, authorship, and/or publication of this article. This research was funded by the National Cancer Institute grants R01 CA239605 (SIW), R01 CA239697 (SEW and SIW), T32 CA117846 (SEW and JD) and Veterans Affairs grant 2I01BX000803.
Acknowledgments
We thank Dr. Brian Hunt for technical contributions and scientific input.
Conflict of interest
The authors declare that the research was conducted in the absence of any commercial or financial relationships that could be construed as a potential conflict of interest.
Publisher’s note
All claims expressed in this article are solely those of the authors and do not necessarily represent those of their affiliated organizations, or those of the publisher, the editors and the reviewers. Any product that may be evaluated in this article, or claim that may be made by its manufacturer, is not guaranteed or endorsed by the publisher.
Supplementary material
The Supplementary Material for this article can be found online at: https://www.frontiersin.org/articles/10.3389/fonc.2024.1382986/full#supplementary-material
Supplementary Figure 1 | Multivariate statistical analysis by principal component analysis (PCA) distinguishes cell lines based on their lipid profile. (A) PCA scatter plot shows distinct clustering of the three cell lines (R7, R7sgRON and R7shDEK) according to their lipid composition, indicating a clear difference in their lipidomes. (B) Loading plot where each variable is represented as a vector, and the length of the vector indicates the influence of that variable in the model. Variables with longer vectors are more influential, whereas variables with shorter vectors have less impact on the model. (C–E) PCA scatterplot for individual cell lines: (C) R7 (n=7), (D) R7sgRON (n=7), (E) R7shDEK (n=7). Prior to PCA, the data were scaled to unite variance to ensure equal contribution from each variable. This distinct clustering pattern suggests that the cell lines exhibit unique lipid signature.
Supplementary Figure 2 | Breast Cancer Patient Response to therapy compared with the four gene expression signature from ROCplot.com. Receiver-operator characteristic (ROC) analysis of breast cancer patient complete response to chemotherapy stratified by expression of genes in the four gene signature (Table 2).
References
1. Siegel RL, Miller KD, Fuchs HE, Jemal A. Cancer statistics, 2021. CA: A Cancer J Clin. (2021) 71:7–33. doi: 10.3322/caac.21654
2. Giaquinto AN, Sung H, Miller KD, Kramer JL, Newman LA, Minihan A, et al. Breast cancer statistics, 2022. CA: A Cancer J Clin. (2022) 72:524–41. doi: 10.3322/caac.21754
3. Dent R, Valentini A, Hanna W, Rawlinson E, Rakovitch E, Sun P, et al. Factors associated with breast cancer mortality after local recurrence. Curr Oncol. (2014) 21:e418–25. doi: 10.3747/co.21.1563
4. Sopik V, Sun P, Narod SA. Predictors of time to death after distant recurrence in breast cancer patients. Breast Cancer Res Treat. (2019) 173:465–74. doi: 10.1007/s10549-018-5002-9
5. Hunt BG, Wicker CA, Bourn JR, Lower EE, Takiar V, Waltz SE. Mst1r (Ron) expression is a novel prognostic biomarker for metastatic progression in breast cancer patients. Breast Cancer Res Treat. (2020) 181:529–40. doi: 10.1007/s10549-020-05653-y
6. Hunt BG, Davis JC, Fox LH, Vicente-Muñoz S, Lester C, Wells SI, et al. Ron-augmented cholesterol biosynthesis in breast cancer metastatic progression and recurrence. Oncogene. (2023) 42(21):1716–27. doi: 10.1038/s41388-023-02688-5
7. Privette Vinnedge LM, Benight NM, Wagh PK, Pease NA, Nashu MA, Serrano-Lopez J, et al. The dek oncogene promotes cellular proliferation through paracrine wnt signaling in ron receptor-positive breast cancers. Oncogene. (2015) 34:2325–36. doi: 10.1038/onc.2014.173
8. Yang MQ, Bai LL, Wang Z, Lei L, Zheng YW, Li ZH, et al. Dek is highly expressed in breast cancer and is associated with Malignant phenotype and progression. Oncol Lett. (2021) 21:440. doi: 10.3892/ol.2021.12701
9. Evans LM, Cowey SL, Siegal GP, Hardy RW. Stearate preferentially induces apoptosis in human breast cancer cells. Nutr Cancer. (2009) 61:746–53. doi: 10.1080/01635580902825597
10. Soto-Guzman A, Navarro-Tito N, Castro-Sanchez L, Martinez-Orozco R, Salazar EP. Oleic acid promotes mmp-9 secretion and invasion in breast cancer cells. Clin Exp Metastasis. (2010) 27:505–15. doi: 10.1007/s10585-010-9340-1
11. Martinez-Orozco R, Navarro-Tito N, Soto-Guzman A, Castro-Sanchez L, Perez Salazar E. Arachidonic acid promotes epithelial-to-mesenchymal-like transition in mammary epithelial cells mcf10a. Eur J Cell Biol. (2010) 89:476–88. doi: 10.1016/j.ejcb.2009.12.005
12. Koundouros N, Poulogiannis G. Reprogramming of fatty acid metabolism in cancer. Br J Cancer. (2020) 122:4–22. doi: 10.1038/s41416-019-0650-z
13. Ehmsen S, Pedersen MH, Wang G, Terp MG, Arslanagic A, Hood BL, et al. Increased cholesterol biosynthesis is a key characteristic of breast cancer stem cells influencing patient outcome. Cell Rep. (2019) 27:3927–38.e6. doi: 10.1016/j.celrep.2019.05.104
14. Broadfield LA, Pane AA, Talebi A, Swinnen JV, Fendt SM. Lipid metabolism in cancer: new perspectives and emerging mechanisms. Dev Cell. (2021) 56:1363–93. doi: 10.1016/j.devcel.2021.04.013
15. Li J, Vosegaard T, Guo Z. Applications of nuclear magnetic resonance in lipid analyses: an emerging powerful tool for lipidomics studies. Prog Lipid Res. (2017) 68:37–56. doi: 10.1016/j.plipres.2017.09.003
16. Subramanian A, Shankar Joshi B, Roy AD, Roy R, Gupta V, Dang RS. Nmr spectroscopic identification of cholesterol esters, plasmalogen and phenolic glycolipids as fingerprint markers of human intracranial tuberculomas. NMR biomedicine. (2008) 21:272–88. doi: 10.1002/nbm.1191
17. Ruiz-Torres SJ, Benight NM, Karns RA, Lower EE, Guan JL, Waltz SE. Hgfl-mediated ron signaling supports breast cancer stem cell phenotypes via activation of non-canonical B-catenin signaling. Oncotarget. (2017) 8:58918–33. doi: 10.18632/oncotarget.19441
18. Vicente-Muñoz S, Hunt BG, Lange TE, Wells SI, Waltz SE. Nmr-based metabolomic analysis identifies ron-dek-B-catenin dependent metabolic pathways and a gene signature that stratifies breast cancer patient survival. PloS One. (2022) 17:e0274128. doi: 10.1371/journal.pone.0274128
19. Fan TWM, Lorkiewicz PK, Sellers K, Moseley HNB, Higashi RM, Lane AN. Stable isotope-resolved metabolomics and applications for drug development. Pharmacol Ther. (2012) 133:366–91. doi: 10.1016/j.pharmthera.2011.12.007
20. Amiel A, Tremblay-Franco M, Gautier R, Ducheix S, Montagner A, Polizzi A, et al. Proton nmr enables the absolute quantification of aqueous metabolites and lipid classes in unique mouse liver samples. Metabolites. (2019) 10(1). doi: 10.3390/metabo10010009
21. Lin P, Dai L, Crooks DR, Neckers LM, Higashi RM, Fan TW, et al. Nmr methods for determining lipid turnover via stable isotope resolved metabolomics. Metabolites. (2021) 11(4). doi: 10.3390/metabo11040202
22. Benjamini Y, Hochberg Y. Controlling the false discovery rate: A practical and powerful approach to multiple testing. J R Stat Society: Ser B (Methodological). (2018) 57:289–300. doi: 10.1111/j.2517-6161.1995.tb02031.x
23. Györffy B, Lanczky A, Eklund AC, Denkert C, Budczies J, Li Q, et al. An online survival analysis tool to rapidly assess the effect of 22,277 genes on breast cancer prognosis using microarray data of 1,809 patients. Breast Cancer Res Treat. (2010) 123:725–31. doi: 10.1007/s10549-009-0674-9
24. Agrawal A, Balcı H, Hanspers K, Coort SL, Martens M, Slenter DN, et al. Wikipathways 2024: next generation pathway database. Nucleic Acids Res. (2023) 52:D679–D89. doi: 10.1093/nar/gkad960
25. Martin FJ, Amode MR, Aneja A, Austine-Orimoloye O, Azov AG, Barnes I, et al. Ensembl 2023. Nucleic Acids Res. (2023) 51:D933–d41. doi: 10.1093/nar/gkac958
26. Liu J, Lichtenberg T, Hoadley KA, Poisson LM, Lazar AJ, Cherniack AD, et al. An integrated tcga pan-cancer clinical data resource to drive high-quality survival outcome analytics. Cell. (2018) 173:400–16.e11. doi: 10.1016/j.cell.2018.02.052
27. Fekete JT, Győrffy B. Rocplot.Org: validating predictive biomarkers of chemotherapy/hormonal therapy/anti-her2 therapy using transcriptomic data of 3,104 breast cancer patients. Int J Cancer. (2019) 145:3140–51. doi: 10.1002/ijc.32369
28. Lánczky A, Győrffy B. Web-based survival analysis tool tailored for medical research (Kmplot): development and implementation. J Med Internet Res. (2021) 23:e27633. doi: 10.2196/27633
29. Győrffy B, Surowiak P, Budczies J, Lánczky A. Online survival analysis software to assess the prognostic value of biomarkers using transcriptomic data in non-small-cell lung cancer. PloS One. (2013) 8:e82241. doi: 10.1371/journal.pone.0082241
30. Casu M, Anderson GJ, Choi G, Gibbons WA. Nmr lipid profiles of cells, tissues and body fluids. I— 1d and 2d proton nmr of lipids from rat liver. Magnetic Resonance Chem. (1991) 29:594–602. doi: 10.1002/mrc.1260290610
31. Adosraku RK, Choi GT, Constantinou-Kokotos V, Anderson MM, Gibbons WA. Nmr lipid profiles of cells, tissues, and body fluids: proton nmr analysis of human erythrocyte lipids. J Lipid Res. (1994) 35:1925–31. doi: 10.1016/S0022-2275(20)39939-9
32. Tang Q, Liang B, Zhang L, Li X, Li H, Jing W, et al. Enhanced cholesterol biosynthesis promotes breast cancer metastasis via modulating ccdc25 expression and neutrophil extracellular traps formation. Sci Rep. (2022) 12:17350. doi: 10.1038/s41598-022-22410-x
33. Cerqueira NM, Oliveira EF, Gesto DS, Santos-Martins D, Moreira C, Moorthy HN, et al. Cholesterol biosynthesis: A mechanistic overview. Biochemistry. (2016) 55:5483–506. doi: 10.1021/acs.biochem.6b00342
34. Luo J, Yang H, Song B-L. Mechanisms and regulation of cholesterol homeostasis. Nat Rev Mol Cell Biol. (2020) 21:225–45. doi: 10.1038/s41580-019-0190-7
35. Wilhelm LP, Wendling C, Védie B, Kobayashi T, Chenard M-P, Tomasetto C, et al. Stard3 mediates endoplasmic reticulum-to-endosome cholesterol transport at membrane contact sites. EMBO J. (2017) 36:1412–33. doi: 10.15252/embj.201695917
36. Wakana Y, Hayashi K, Nemoto T, Watanabe C, Taoka M, Angulo-Capel J, et al. The er cholesterol sensor scap promotes carts biogenesis at er-golgi membrane contact sites. J Cell Biol. (2021) 220(1). doi: 10.1083/jcb.202002150
37. Nelson ER, Chang CY, McDonnell DP. Cholesterol and breast cancer pathophysiology. Trends Endocrinol Metab. (2014) 25:649–55. doi: 10.1016/j.tem.2014.10.001
38. Tallima H, Azzazy HME, El Ridi R. Cell surface sphingomyelin: key role in cancer initiation, progression, and immune evasion. Lipids Health Dis. (2021) 20:150. doi: 10.1186/s12944-021-01581-y
39. Dzięgiel P, Owczarek T, Plazuk E, Gomułkiewicz A, Majchrzak M, Podhorska-Okołów M, et al. Ceramide galactosyltransferase (Ugt8) is a molecular marker of breast cancer Malignancy and lung metastases. Br J Cancer. (2010) 103:524–31. doi: 10.1038/sj.bjc.6605750
40. Cao Q, Chen X, Wu X, Liao R, Huang P, Tan Y, et al. Inhibition of ugt8 suppresses basal-like breast cancer progression by attenuating sulfatide-Avβ5 axis. J Exp Med. (2018) 215:1679–92. doi: 10.1084/jem.20172048
41. Landemaine T, Jackson A, Bellahcène A, Rucci N, Sin S, Abad BM, et al. A six-gene signature predicting breast cancer lung metastasis. Cancer Res. (2008) 68:6092–9. doi: 10.1158/0008-5472.Can-08-0436
42. Ogretmen B. Sphingolipid metabolism in cancer signalling and therapy. Nat Rev Cancer. (2018) 18:33–50. doi: 10.1038/nrc.2017.96
43. Zheng K, Chen Z, Feng H, Chen Y, Zhang C, Yu J, et al. Sphingomyelin synthase 2 promotes an aggressive breast cancer phenotype by disrupting the homoeostasis of ceramide and sphingomyelin. Cell Death Dis. (2019) 10:157. doi: 10.1038/s41419-019-1303-0
44. Jin ES, Sherry AD, Malloy CR. Metabolism of glycerol, glucose, and lactate in the citric acid cycle prior to incorporation into hepatic acylglycerols. J Biol Chem. (2013) 288:14488–96. doi: 10.1074/jbc.M113.461947
45. Hanson RW, Reshef L. Glyceroneogenesis revisited. Biochimie. (2003) 85:1199–205. doi: 10.1016/j.biochi.2003.10.022
46. Possik E, Al-Mass A, Peyot ML, Ahmad R, Al-Mulla F, Madiraju SRM, et al. New mammalian glycerol-3-phosphate phosphatase: role in B-cell, liver and adipocyte metabolism. Front Endocrinol (Lausanne). (2021) 12:706607. doi: 10.3389/fendo.2021.706607
47. Xu S, Chen T, Dong L, Li T, Xue H, Gao B, et al. Fatty acid synthase promotes breast cancer metastasis by mediating changes in fatty acid metabolism. Oncol Lett. (2021) 21:27. doi: 10.3892/ol.2020.12288
48. Luo H, Chen CY, Li X, Zhang X, Su CW, Liu Y, et al. Increased lipogenesis is critical for self-renewal and growth of breast cancer stem cells: impact of omega-3 fatty acids. Stem Cells. (2021) 39:1660–70. doi: 10.1002/stem.3452
49. Chen Y, Li K, Gong D, Zhang J, Li Q, Zhao G, et al. Acly: A biomarker of recurrence in breast cancer. Pathol - Res Pract. (2020) 216:153076. doi: 10.1016/j.prp.2020.153076
50. Rysman E, Brusselmans K, Scheys K, Timmermans L, Derua R, Munck S, et al. De novo lipogenesis protects cancer cells from free radicals and chemotherapeutics by promoting membrane lipid saturation. Cancer Res. (2010) 70:8117–26. doi: 10.1158/0008-5472.Can-09-3871
51. Takeuchi K, Reue K. Biochemistry, physiology, and genetics of gpat, agpat, and lipin enzymes in triglyceride synthesis. Am J Physiol Endocrinol Metab. (2009) 296:E1195–209. doi: 10.1152/ajpendo.90958.2008
52. Marchan R, Büttner B, Lambert J, Edlund K, Glaeser I, Blaszkewicz M, et al. Glycerol-3-phosphate acyltransferase 1 promotes tumor cell migration and poor survival in ovarian carcinoma. Cancer Res. (2017) 77:4589–601. doi: 10.1158/0008-5472.Can-16-2065
53. Panta P, Manavathi B. Lipid transactions in cancer—the fat addiction and glycerol-3-phosphate acyltransferase action. Trans Cancer Res. (2017) 6:S1219–S24. doi: 10.21037/tcr
54. Pellon-Maison M, Montanaro MA, Lacunza E, Garcia-Fabiani MB, Soler-Gerino MC, Cattaneo ER, et al. Glycerol-3-phosphate acyltranferase-2 behaves as a cancer testis gene and promotes growth and tumorigenicity of the breast cancer mda-mb-231 cell line. PloS One. (2014) 9:e100896. doi: 10.1371/journal.pone.0100896
55. Benchama O, Tyukhtenko S, Malamas MS, Williams MK, Makriyannis A, Avraham HK. Inhibition of triple negative breast cancer-associated inflammation, tumor growth and brain colonization by targeting monoacylglycerol lipase. Sci Rep. (2022) 12:5328. doi: 10.1038/s41598-022-09358-8
56. Liu Y, Beyer A, Aebersold R. On the dependency of cellular protein levels on mrna abundance. Cell. (2016) 165:535–50. doi: 10.1016/j.cell.2016.03.014
57. Zhang G, Ma J, Wu Z, Cao G, Liu C, Song R, et al. Acot7 protects epidermal stem cells against lipid peroxidation. In Vitro Cell Dev Biol Anim. (2022) 58:549–57. doi: 10.1007/s11626-022-00703-9
58. Wei J, Kang HW, Cohen DE. Thioesterase superfamily member 2 (Them2)/acyl-coa thioesterase 13 (Acot13): A homotetrameric hotdog fold thioesterase with selectivity for long-chain fatty acyl-coas. Biochem J. (2009) 421:311–22. doi: 10.1042/bj20090039
59. Prabhu AV, Luu W, Li D, Sharpe LJ, Brown AJ. Dhcr7: A vital enzyme switch between cholesterol and vitamin D production. Prog Lipid Res. (2016) 64:138–51. doi: 10.1016/j.plipres.2016.09.003
60. Wiegmann EM, Westendorf E, Kalus I, Pringle TH, Lübke T, Dierks T. Arylsulfatase K, a novel lysosomal sulfatase. J Biol Chem. (2013) 288:30019–28. doi: 10.1074/jbc.M113.499541
61. Kieu TL, Pierre L, Derangère V, Perrey S, Truntzer C, Jalil A, et al. Downregulation of elovl5 promotes breast cancer metastasis through a lipid-droplet accumulation-mediated induction of tgf-B Receptors. Cell Death Dis. (2022) 13:758. doi: 10.1038/s41419-022-05209-6
62. Liu JZ, Hu YL, Feng Y, Jiang Y, Guo YB, Liu YF, et al. Bdh2 triggers ros-induced cell death and autophagy by promoting nrf2 ubiquitination in gastric cancer. J Exp Clin Cancer research: CR. (2020) 39:123. doi: 10.1186/s13046-020-01620-z
63. Fontana D, Mauri M, Renso R, Docci M, Crespiatico I, Røst LM, et al. Etnk1 mutations induce a mutator phenotype that can be reverted with phosphoethanolamine. Nat Commun. (2020) 11:5938. doi: 10.1038/s41467-020-19721-w
64. Zhang J, Song Y, Shi Q, Fu L. Research progress on fasn and mgll in the regulation of abnormal lipid metabolism and the relationship between tumor invasion and metastasis. Front Med. (2021) 15:649–56. doi: 10.1007/s11684-021-0830-0
65. Bourn JR, Ruiz-Torres SJ, Hunt BG, Benight NM, Waltz SE. Tumor cell intrinsic ron signaling suppresses innate immune responses in breast cancer through inhibition of irak4 signaling. Cancer Lett. (2021) 503:75–90. doi: 10.1016/j.canlet.2021.01.019
66. Li YR, Ro V, Steel L, Carrigan E, Nguyen J, Williams A, et al. Impact of long-term lipid-lowering therapy on clinical outcomes in breast cancer. Breast Cancer Res Treat. (2019) 176:669–77. doi: 10.1007/s10549-019-05267-z
67. Havas KM, Milchevskaya V, Radic K, Alladin A, Kafkia E, Garcia M, et al. Metabolic shifts in residual breast cancer drive tumor recurrence. J Clin Invest. (2017) 127:2091–105. doi: 10.1172/jci89914
68. Wang S, Liang Y, Chang W, Hu B, Zhang Y. Triple negative breast cancer depends on sphingosine kinase 1 (Sphk1)/sphingosine-1-phosphate (S1p)/sphingosine 1-phosphate receptor 3 (S1pr3)/notch signaling for metastasis. Med Sci Monit. (2018) 24:1912–23. doi: 10.12659/msm.905833
69. Hosokawa Y, Masaki N, Takei S, Horikawa M, Matsushita S, Sugiyama E, et al. Recurrent triple-negative breast cancer (Tnbc) tissues contain a higher amount of phosphatidylcholine (32:1) than non-recurrent tnbc tissues. PloS One. (2017) 12:e0183724. doi: 10.1371/journal.pone.0183724
70. Nagahashi M, Yamada A, Katsuta E, Aoyagi T, Huang W-C, Terracina KP, et al. Targeting the sphk1/S1p/S1pr1 axis that links obesity, chronic inflammation, and breast cancer metastasis. Cancer Res. (2018) 78:1713–25. doi: 10.1158/0008-5472.Can-17-1423
71. Wang Y, Fan J, Liu Y, Du J, Liang B, Wang H, et al. Identification and validation of dhcr7 as a diagnostic biomarker involved in the proliferation and mitochondrial function of breast cancer. Aging (Albany NY). (2024) 16:5967–86. doi: 10.18632/aging.205683
72. Jung SH, Lee HC, Hwang HJ, Park HA, Moon Y-A, Kim BC, et al. Acyl-coa thioesterase 7 is involved in cell cycle progression via regulation of pkcζ–P53–P21 signaling pathway. Cell Death Dis. (2017) 8:e2793–e. doi: 10.1038/cddis.2017.202
73. Liao R, Ren G, Liu H, Chen X, Cao Q, Wu X, et al. Me1 promotes basal-like breast cancer progression and associates with poor prognosis. Sci Rep. (2018) 8:16743. doi: 10.1038/s41598-018-35106-y
74. Klintman M, Buus R, Cheang MC, Sheri A, Smith IE, Dowsett M. Changes in expression of genes representing key biologic processes after neoadjuvant chemotherapy in breast cancer, and prognostic implications in residual disease. Clin Cancer research: an Off J Am Assoc Cancer Res. (2016) 22:2405–16. doi: 10.1158/1078-0432.Ccr-15-1488
75. Menendez JA, Lupu R. Fatty acid synthase (Fasn) as a therapeutic target in breast cancer. Expert Opin Ther Targets. (2017) 21:1001–16. doi: 10.1080/14728222.2017.1381087
76. Hua H, Pan S, Diao H, Cao Y, Qian X, Zhang J. Increased acsl6 expression predicts a favorable prognosis in triple-negative breast cancer. Curr Med Chem. (2024). doi: 10.2174/0109298673278846231222103420
77. Wang T, Fahrmann JF, Lee H, Li YJ, Tripathi SC, Yue C, et al. Jak/stat3-regulated fatty acid B-oxidation is critical for breast cancer stem cell self-renewal and chemoresistance. Cell Metab. (2018) 27:136–50.e5. doi: 10.1016/j.cmet.2017.11.001
78. Tripathy M, Bui A, Henderson J, Sun J, Woods CR, Somani S, et al. Faah inhibition ameliorates breast cancer in a murine model. Oncotarget. (2023) 14:910–8. doi: 10.18632/oncotarget.28534
79. Avalle L, Raggi L, Monteleone E, Savino A, Viavattene D, Statello L, et al. Stat3 induces breast cancer growth via angptl4, mmp13 and stc1 secretion by cancer associated fibroblasts. Oncogene. (2022) 41:1456–67. doi: 10.1038/s41388-021-02172-y
80. Lodi M, Voilquin L, Alpy F, Molière S, Reix N, Mathelin C, et al. Stard3: A new biomarker in her2-positive breast cancer. Cancers. (2023) 15(2). doi: 10.3390/cancers15020362
81. Lewis MJ, Wiebe JP, Heathcote JG. Expression of progesterone metabolizing enzyme genes (Akr1c1, akr1c2, akr1c3, srd5a1, srd5a2) is altered in human breast carcinoma. BMC Cancer. (2004) 4:27. doi: 10.1186/1471-2407-4-27
82. Bhavani V, Srinivasulu M, Ahuja YR, Hasan Q. Role of brca1, hsd17b1 and hsd17b2 methylation in breast cancer tissue. Cancer biomarkers: section A Dis Markers. (2009) 5 4:207–13. doi: 10.3233/cbm-2009-0105
83. Qin L, Wu YL, Toneff MJ, Li D, Liao L, Gao X, et al. Ncoa1 directly targets M-csf1 expression to promote breast cancer metastasis. Cancer Res. (2014) 74:3477–88. doi: 10.1158/0008-5472.Can-13-2639
84. Rodgers SJ, Ooms LM, Oorschot VMJ, Schittenhelm RB, Nguyen EV, Hamila SA, et al. Inpp4b promotes pi3kα-dependent late endosome formation and wnt/B-catenin signaling in breast cancer. Nat Commun. (2021) 12:3140. doi: 10.1038/s41467-021-23241-6
85. Nisticò C, Pagliari F, Chiarella E, Fernandes Guerreiro J, Marafioti MG, Aversa I, et al. Lipid droplet biosynthesis impairment through dgat2 inhibition sensitizes mcf7 breast cancer cells to radiation. Int J Mol Sci. (2021) 22(18). doi: 10.3390/ijms221810102
86. Liang D, Feng Y, Zandkarimi F, Wang H, Zhang Z, Kim J, et al. Ferroptosis surveillance independent of gpx4 and differentially regulated by sex hormones. Cell. (2023) 186:2748–64.e22. doi: 10.1016/j.cell.2023.05.003
87. Hatem E, Azzi S, El Banna N, He T, Heneman-Masurel A, Vernis L, et al. Auranofin/vitamin C: A novel drug combination targeting triple-negative breast cancer. J Natl Cancer Inst. (2019) 111:597–608. doi: 10.1093/jnci/djy149
Keywords: breast cancer, recurrence, metastasis, RON, DEK, NMR spectroscopy, lipidomics
Citation: Vicente-Muñoz S, Davis JC, Lane A, Lane AN, Waltz SE and Wells SI (2024) Lipid profiling of RON and DEK-dependent signaling in breast cancer guides discovery of gene networks predictive of poor outcomes. Front. Oncol. 14:1382986. doi: 10.3389/fonc.2024.1382986
Received: 06 February 2024; Accepted: 30 July 2024;
Published: 16 September 2024.
Edited by:
Alessandra Fabi, Agostino Gemelli University Polyclinic (IRCCS), ItalyReviewed by:
Alma Villaseñor, CEU San Pablo University, SpainMaria Antonietta Castiglione Morelli, University of Basilicata, Italy
Copyright © 2024 Vicente-Muñoz, Davis, Lane, Lane, Waltz and Wells. This is an open-access article distributed under the terms of the Creative Commons Attribution License (CC BY). The use, distribution or reproduction in other forums is permitted, provided the original author(s) and the copyright owner(s) are credited and that the original publication in this journal is cited, in accordance with accepted academic practice. No use, distribution or reproduction is permitted which does not comply with these terms.
*Correspondence: Susanne I. Wells, U3VzYW5uZS53ZWxsc0BjY2htYy5vcmc=; Susan E. Waltz, V2FsdHpzZUB1Y21haWwudWMuZWR1; Sara Vicente-Muñoz, U2FyYS5WaWNlbnRlTXVub3pAY2NobWMub3Jn
†These authors have contributed equally to this work and share first authorship.
‡These authors have contributed equally to this work and share senior authorship.