 Jiaxin Xu
 Yu Gao
 Yuting Ding3
95% of researchers rate our articles as excellent or good
Learn more about the work of our research integrity team to safeguard the quality of each article we publish.
Find out more
ORIGINAL RESEARCH article
Front. Oncol. , 22 July 2024
Sec. Gastrointestinal Cancers: Colorectal Cancer
Volume 14 - 2024 | https://doi.org/10.3389/fonc.2024.1373820
This article is part of the Research Topic Targeting the Tumor Microenvironment for Effective Treatment of Gastrointestinal Cancers View all 5 articles
Objective: To explore the mechanism by which Tregs promote the progression of colorectal cancer by inducing tumor-associated macrophages to polarize into M2 type via ICOS.
Methods: Postoperative pathological tissues and clinical pathological data of 268 colorectal cancer patients who underwent initial surgery were collected. Immunohistochemistry (IHC) was used to detect the expression levels of ICOS, CD163 (a marker for M2 macrophages), and Foxp3 (a marker for Tregs) in cancerous, adjacent non-tumorous, and normal tissues. The relationship of ICOS, M2 macrophages, and Tregs in CRC with clinical pathological characteristics and pre-surgical tumor markers (such as CEA and CA199) was explored.
Results: The expression levels of M2 macrophages and Tregs increased with tumor progression, while ICOS expression showed a decreasing trend. Compared to adjacent and normal tissues, the expression levels of ICOS, M2 macrophages, and Tregs were higher in CRC tissues. The expression levels of M2 macrophages and Tregs were significantly positively correlated with tumor markers, while ICOS expression was significantly negatively correlated.
Conclusion: Tumor-associated m2 macrophages induced by Tregs and ICOS participate in the dynamic balance of the colorectal cancer tumor microenvironment, and their interaction affects colorectal carcinogenesis and progression. High levels of ICOS are associated with better long-term survival rates.
According to the International Agency for Research on Cancer (IARC), colorectal cancer (CRC) ranks third in global incidence and has risen to the second leading cause of cancer-related deaths (1). Lifestyle changes have shifted the trend of CRC towards younger age groups and more advanced stages (2). The tumor microenvironment (TME), comprising cancer cells and surrounding non-cancerous cells, including immune cells, stromal cells, and vascular cells, plays a key role in tumor growth and progression (3). M2 macrophages in this environment support tumor growth, angiogenesis, and immune suppression (4). CD163 is identified as a specific marker for M2 macrophages (5). Regulatory T cells (Tregs) maintain tissue homeostasis through immunosuppression but can promote tumor evasion in TME (6). Foxp3, a specific marker for Tregs, plays a critical role in tumor immunity and proliferation (7–9). Inducible T-cell co-stimulator (ICOS), part of the B7-CD28 immunoglobulin superfamily, has a dual role in mediating T cell regulation (10). Initially discovered in human tonsil studies, ICOS acts via its T cell co-stimulator ligand (ICOSL) (11). The decline in co-stimulatory molecules and ligands correlates with lymph node metastasis and tumor invasion in CRC progression (12). ICOS/ICOS-L signaling can lead to the accumulation of Tregs within tumors, influencing the differentiation of CD4 T cells into Tregs (13, 14). Soluble recombinant forms of ICOS (ICOS-CH3) have been found to inhibit M2 macrophage polarization through ICOSL mediation (15). With CRC progression, ICOS expression tends to decrease (16). This study hypothesizes that host anti-tumor immune dysfunction may be due to excessive suppression of the ICOS/ICOSL pathway. Tregs might promote CRC progression by suppressing ICOS expression, inducing polarization of tumor-associated macrophages to the M2 type. The study analyzes ICOS in clinical pathological characteristics through TCGA database and investigates the expression of M2 macrophages, Tregs, and ICOS protein in 268 colorectal tissues using IHC. This research aims to understand the mechanisms of CRC progression and find new breakthroughs in CRC diagnosis and treatment.
This study involved 268 colorectal cancer patients who underwent radical surgery in the Second Ward of Colorectal Surgery at The First Affiliated Hospital of Jinzhou Medical University from January 2021 to June 2023. Patient clinical characteristics are detailed in Table 1.
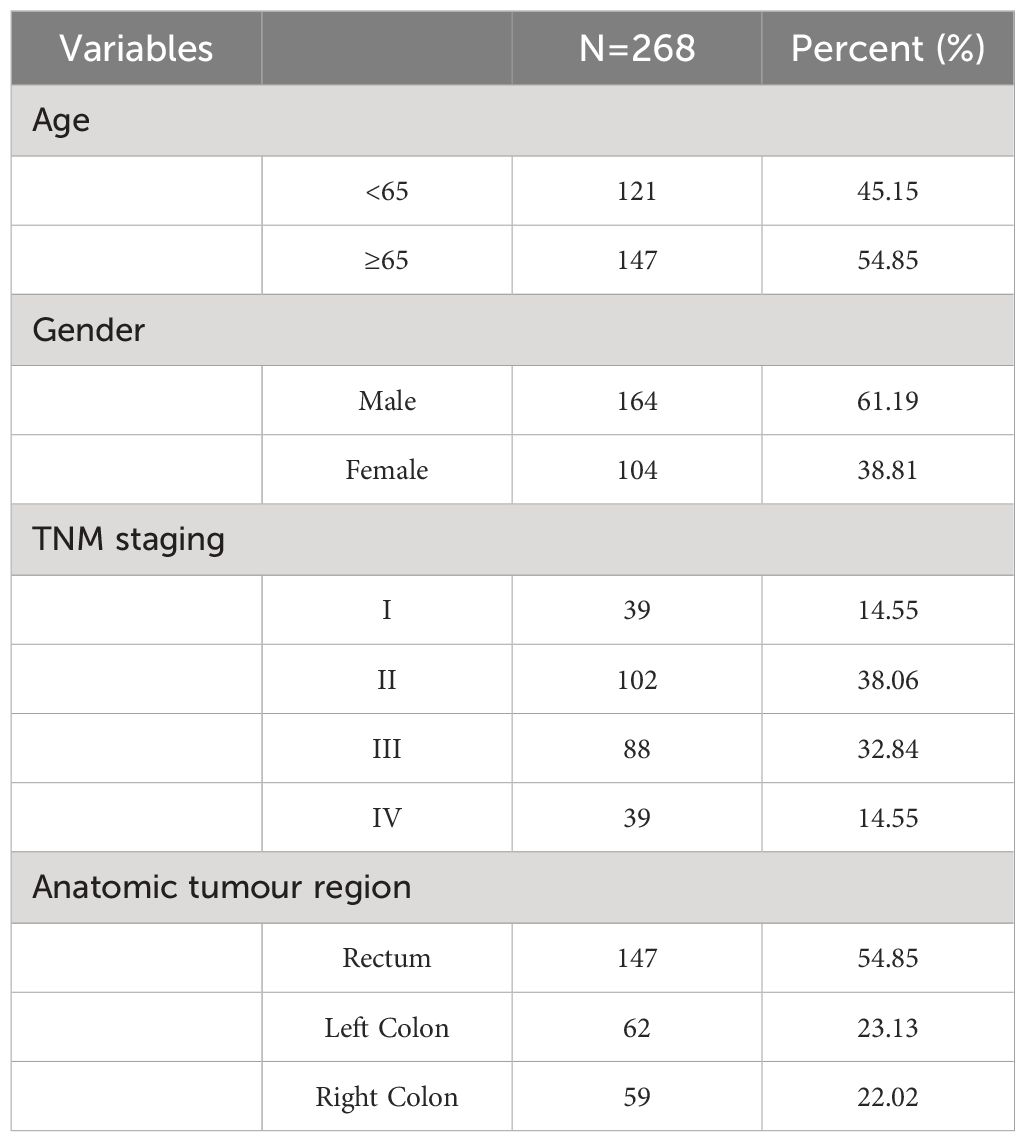
Table 1 Clinical information statistics.
Postoperative pathological tissue samples were categorized into cancerous, adjacent non-tumorous, and normal tissues. These three types of tissues were obtained from cancer tissues, 5cm away from cancer tissues, and 10cm away from cancer tissues of the same patient, respectively. Inclusion criteria were: (1) written informed consent obtained prior to enrollment; (2) primary colorectal cancer; (3) initial diagnosis and surgery at our hospital. Exclusion criteria: (1) chemotherapy or radiotherapy prior to enrollment; (2) synchronous primary tumors or other colorectal cancers; (3) hereditary colorectal cancers. This study was approved by the Ethics Committee of the First Affiliated Hospital of Jinzhou Medical University. All participants signed informed consent before enrollment.
Immunohistochemistry (IHC): Samples were fixed in formalin, embedded in paraffin, and sectioned at 4 μm thickness. After deparaffinization and hydration, antigen retrieval was performed using EDTA solution (pH=9.0). Endogenous peroxidase blocking and nonspecific staining blocking were performed. Tissue sections were incubated with primary antibodies at 4°C overnight and then with peroxidase-labeled secondary antibodies. Diaminobenzidine (DAB) was used for staining, followed by counterstaining with hematoxylin. Antibodies used included anti-CD163 (1:500, ab182422, Abcam, Cambridge, UK), anti-Foxp3 (1:500, ab20034, Abcam, Cambridge, UK), and anti-ICOS (1:500, ab224644, Abcam, Cambridge, UK) monoclonal antibodies.
CD163+ staining indicates M2 macrophages in the cell membrane or cytoplasm. Foxp3+ staining denotes Tregs in cell nuclei. ICOS+ staining appears in colorectal cell membranes or cytoplasm. Positive control for CD163 and Foxp3 staining was set, while ICOS staining in tonsil tissue sections served as a positive control. Negative control was PBS for all three. Image J was used to determine positive cells, evaluated by two pathologists through a double-blind method.For anti-CD163 and anti-Foxp3 staining, 5 random high power fields (400X) were evaluated to calculate an average number of positive cells. The integer of this average was taken as the final score. The median score of all samples was set as the cut-off, with scores greater than or equal to the median classified as high expression, and scores below as low expression. For ICOS staining, the average staining index across 5 high power fields was calculated for each slide as the final score. Staining index = percentage of positive cells × staining intensity (positive cell percentage was defined as 0: 0–10%; 1: 11–25%; 2: 26–50%; 3: 51–75%; 4: 76–100%; staining intensity was 0: no staining; 1: weak staining; 2: moderate staining, but weaker than tonsil; 3: strong staining, equal to or stronger than tonsil). Staining index ≥6 indicates high expression, <6 indicates low expression.
SPSS 26.0 was used for statistical analysis. Categorical variables were presented as number (percentage), and continuous variables were compared using independent sample T-tests or Mann-Whitney tests. Chi-square tests were used for categorical variables. All P-values were two-sided, with P < 0.05 considered statistically significant. GraphPad Prism 9.0 was used for graphing.
669 CRC patients were analyzed by TCGA revealed that ICOS expression gradually decreased with the progression of CRC TNM staging (Figure 1A). However, there was no correlation between ICOS expression and invasion depth (Figure 1B). Lymph node metastasis (Figure 1C) and distant metastasis (Figure 1D) showed significant correlation with ICOS expression. High expression of ICOS was significantly correlated with long-term survival rates (Figure 2).
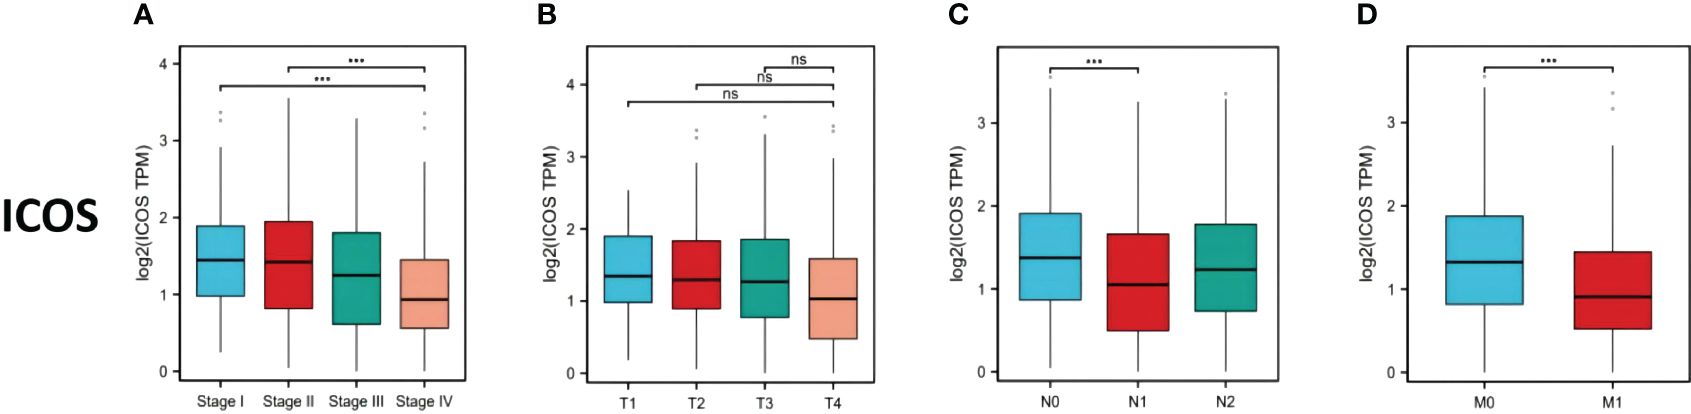
Figure 1 ICOS expression in colorectal cancer patients with different TNM stages. Data were obtained from the TCGA. (A) Changes in ICOS expression with CRC TNM stage. (B) No significant correlation between ICOS expression and depth of tumor invasion. (C) Significant negative correlation between ICOS expression and lymph node metastasis (NO indicates no metastasis, N1 indicates 1-3 regional lymph node metastases, and N2 indicates ≥4 regional lymph node metastases). (D) Significant negative correlation between ICOS expression and distant metastasis. Statistical test method: ANOVA, n=669. "***" means less than equal to 0.001; "ns" means greater than 0.05.
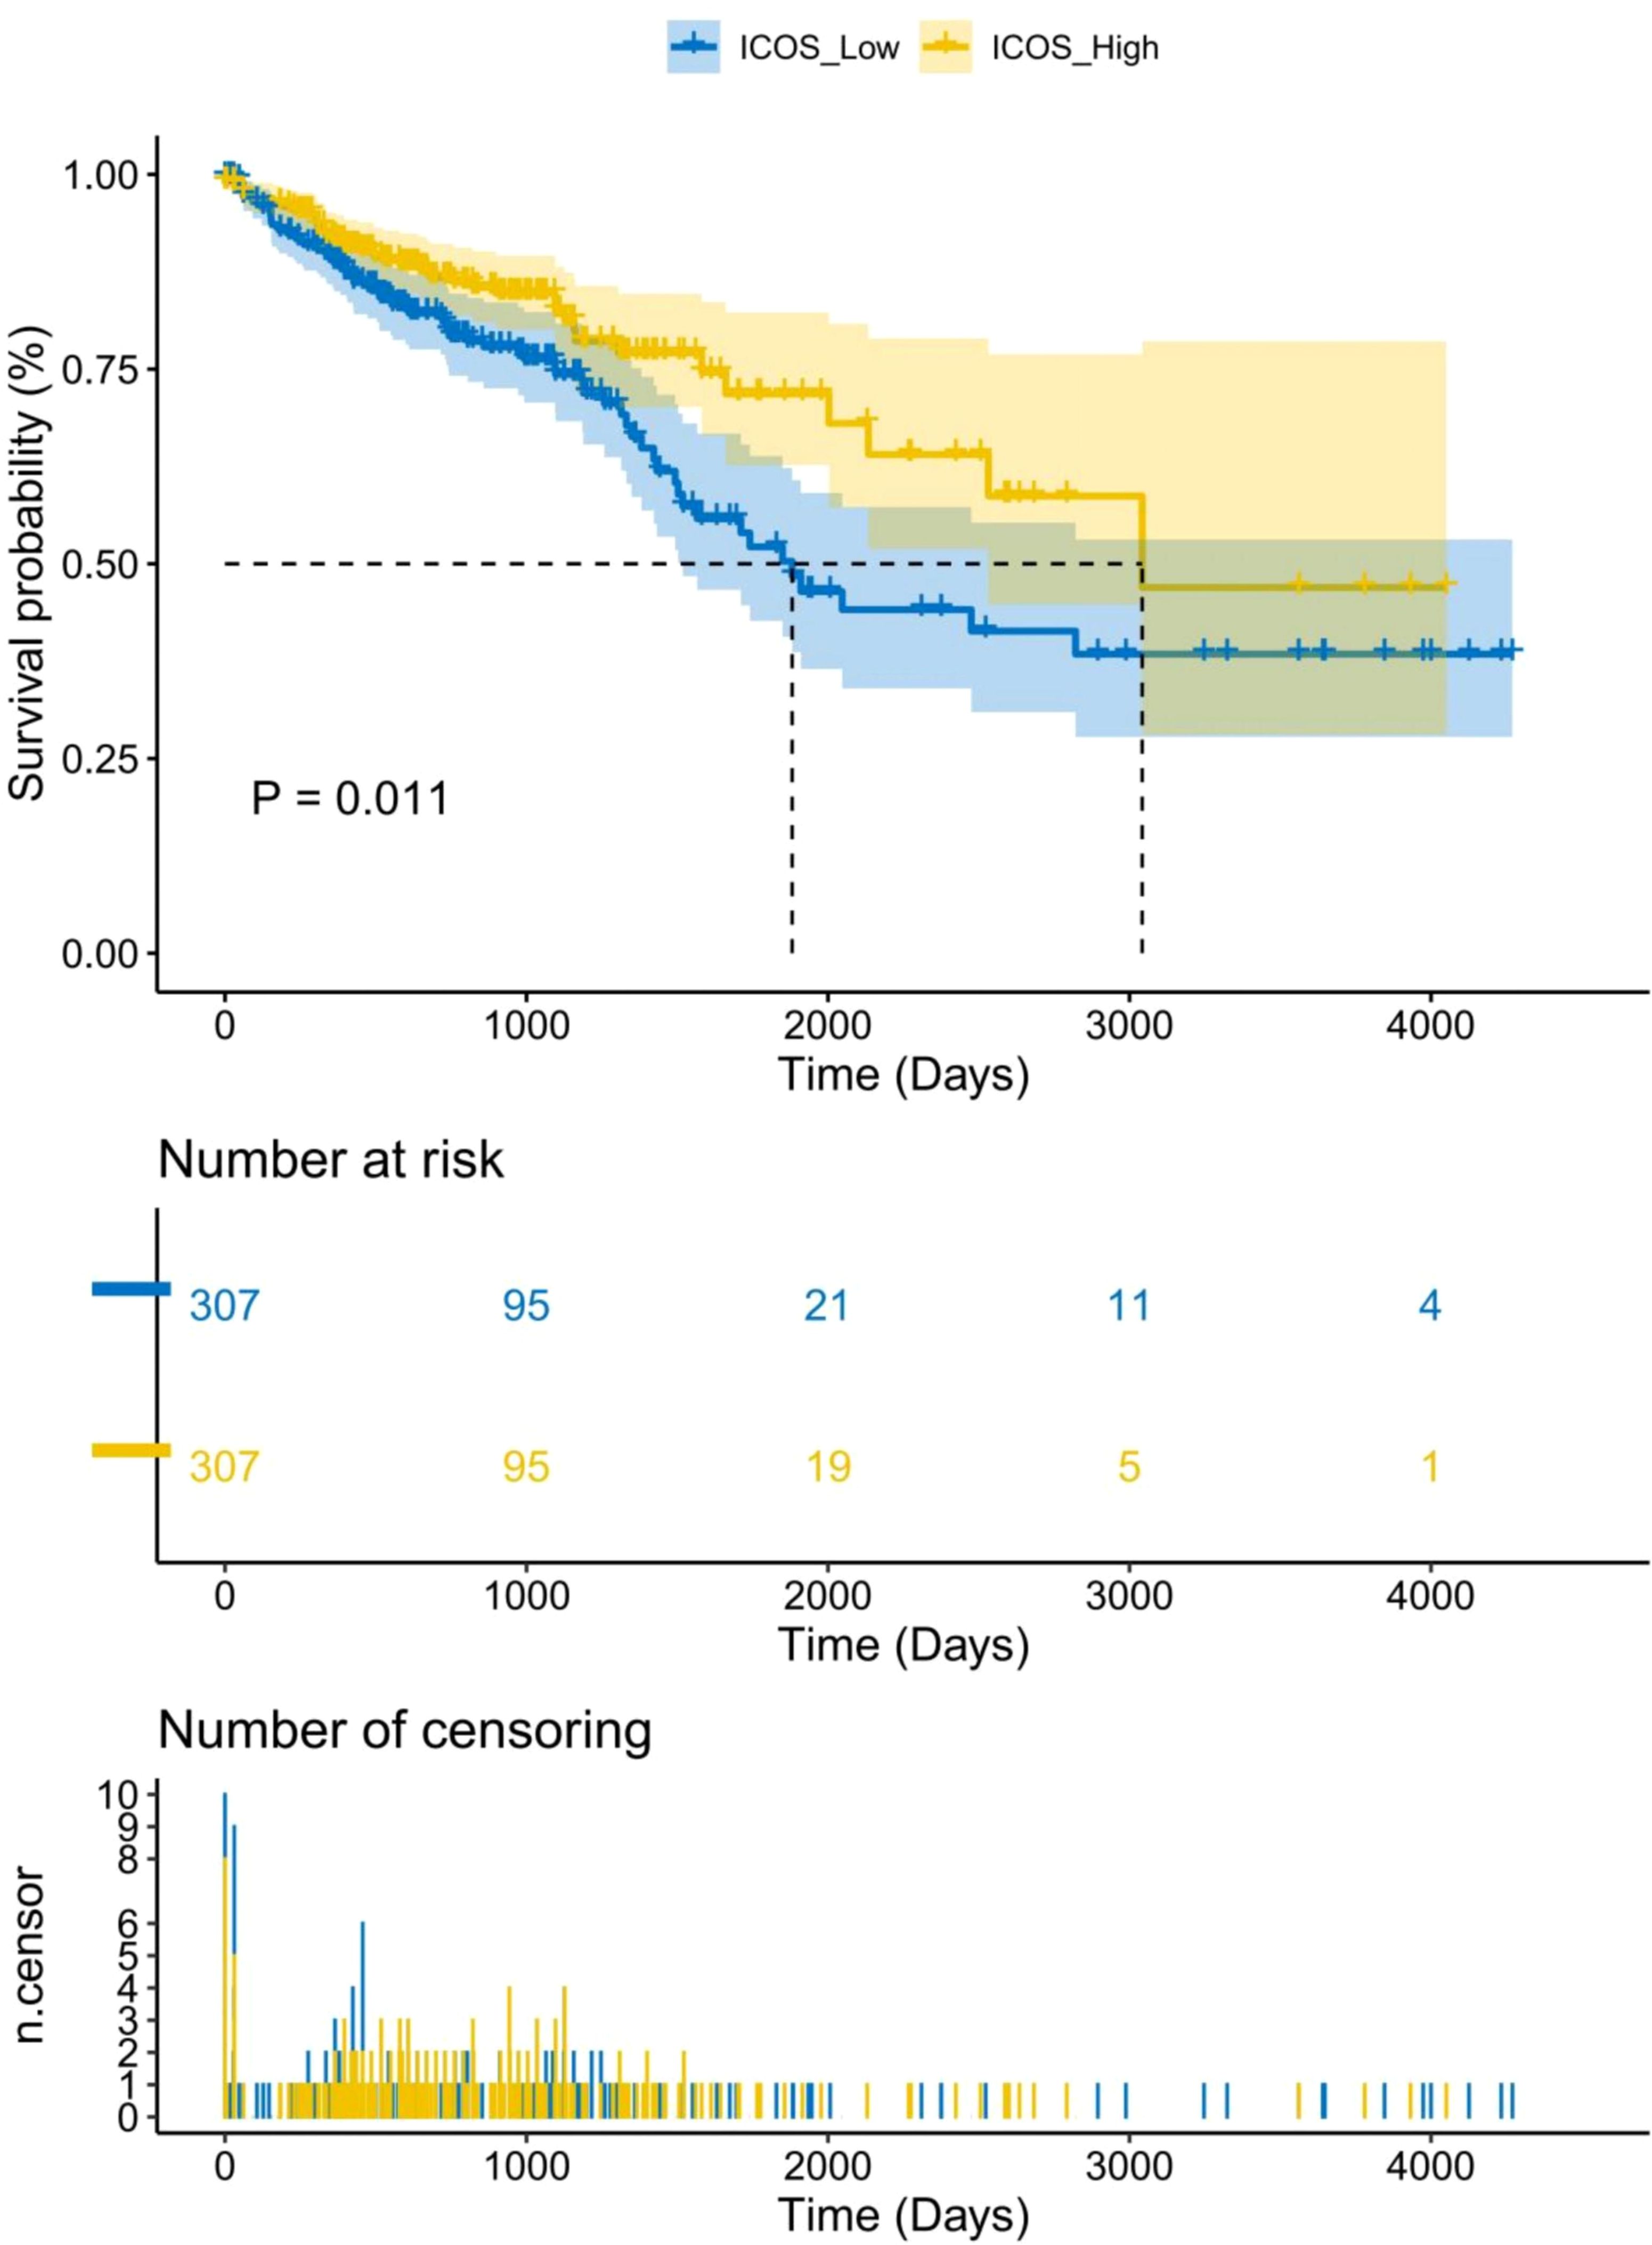
Figure 2 Association between ICOS expression and long-term survival rate of CRC patients. Data were obtained from the TCGA. There is a significant correlation between high expression of ICOS and survival time (p = 0.011). The number of long-term risks and censoring for low expression of ICOS is higher than that for high expression of ICOS.Statistical test method: Log-Rank test, n=669.
Immunohistochemistry results indicated that CD163 was primarily expressed on the cell membrane and cytoplasm of M2 macrophages, appearing in a brownish-yellow color (Figure 3A), and was weaker in peritumoral and normal tissues (Figures 3B, C). Foxp3 was predominantly expressed in brownish-yellow granules in the nuclei of Tregs, distributed throughout the cancer tissue in CRC patients (Figure 3D). In peritumoral and normal tissues, Foxp3 staining was weaker and localized (Figures 3E, F). ICOS was primarily expressed in the cell membrane and cytoplasm of colorectal cells, with stronger staining intensity in cancerous tissue (Figure 3G) than in peritumoral (Figure 3H) and normal tissues (Figure 3I).
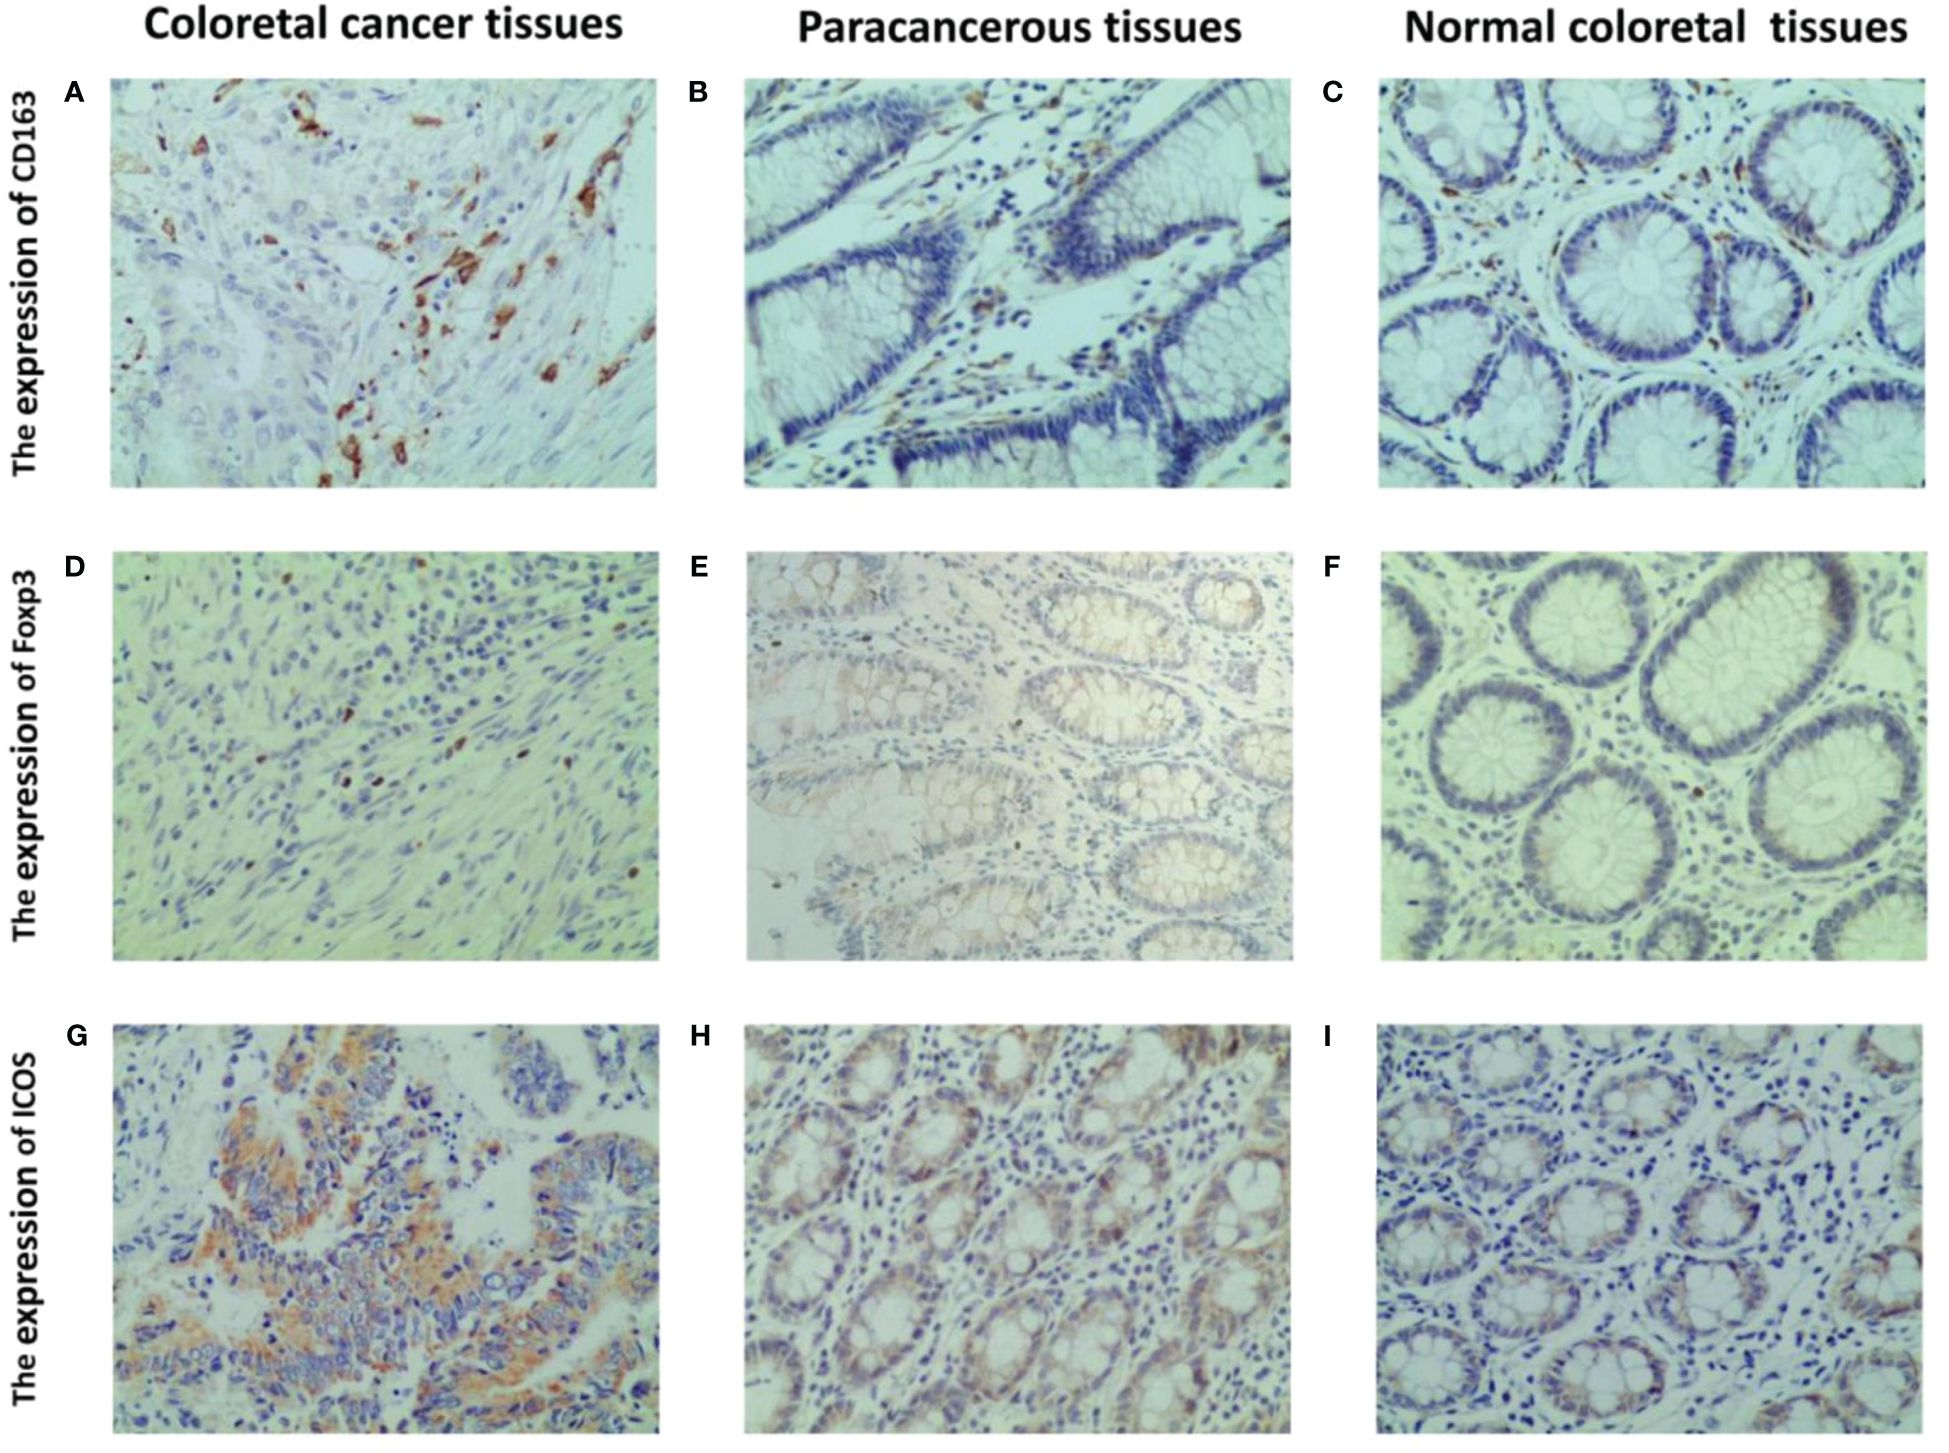
Figure 3 Representative IHC staining of CD163, foxp3 and ICOS in CRC tissues, paracancerous and normal tissues (400 × field). The cell membrane and cytoplasm of M2 macrophages are stained brown (A–C). The nucleus of Tregs are stained brown (D–F). The ICOS protein induces a brown coloration of the cellular membrane and cytoplasm (G–I).
When comparing the expression differences of CD163, Foxp3, and ICOS in cancerous, peritumoral, and normal tissues, it was found that their expressions varied among these tissues. Compared to peritumoral and normal tissues, the expression of CD163 (t=26.85, p <0.001; t=27.15, p <0.001), Foxp3 (t=25.70, p <0.001; t=25.76, p <0.001), and ICOS (t=24.21, p <0.001; t=24.22, p <0.001) increased in CRC tissues. There was no statistical difference in the expression of these three proteins between peritumoral and normal tissues (t=0.3056, p >0.99; t=0.0606, p >0.99; t=0.0097, p >0.99) (Figure 4).
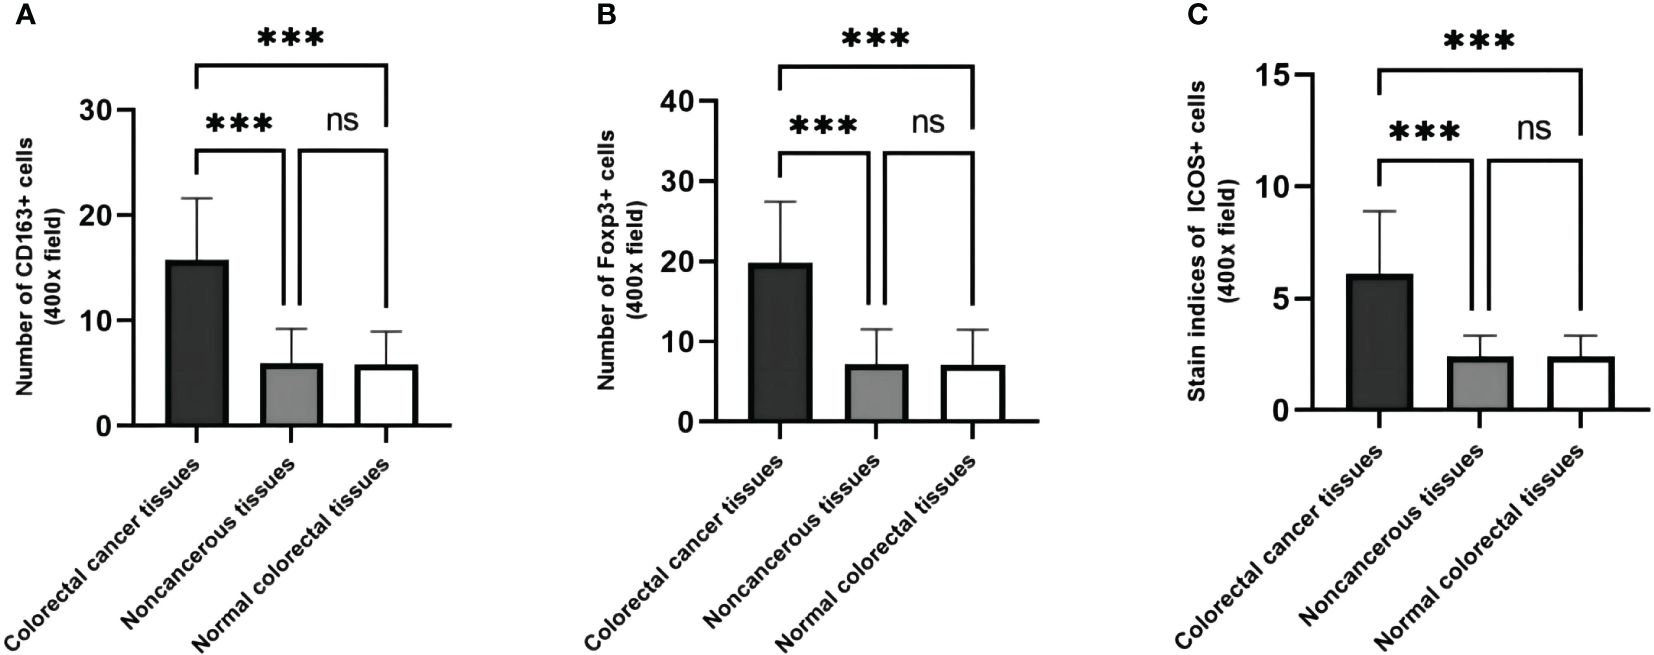
Figure 4 The expression levels of CD163, Foxp3 and ICOS are different in cancer, paracancerous and normal tissues. (A) The number of CD163 in CRC tissues, their matched paracancerous and normal tissues. (B) The number of Foxp3 in CRC tissues, their matched paracancerous and normal tissues. (C) The staining indices of ICOS in CRC tissues, their matched paracancerous and normal tissues. Statistical test method: independent sample t-test, n=268. "***" means less than equal to 0.001; "ns" means greater than 0.05.
As shown in Table 2, in CRC tissues, CD163 was related to tumor TNM stage (χ2 = 23.974, p <0.01), vascular cancer emboli (χ2 = 6.201, p =0.010), neural invasion (χ2 = 4.328, p =0.029), lymph node metastasis (χ2 = 15.663, p =0.002), and distant metastasis (χ2 = 4.273, p =0.029). Foxp3 was significantly associated with tumor TNM stage (χ2 = 22.025, p <0.01), vascular cancer emboli (χ2 = 5.089, p =0.022), neural invasion (χ2 = 5.289, p =0.018), lymph node metastasis (χ2 = 15.121, p =0.003), and distant metastasis (χ2 = 6.759, p =0.007). ICOS was related to tumor TNM stage (χ2 = 18.316, p <0.01), vascular cancer emboli (χ2 = 5.050, p =0.025), neural invasion (χ2 = 6.305, p =0.013), lymph node metastasis (χ2 = 9.287, p =0.008), and distant metastasis (χ2 = 7.564, p =0.006).
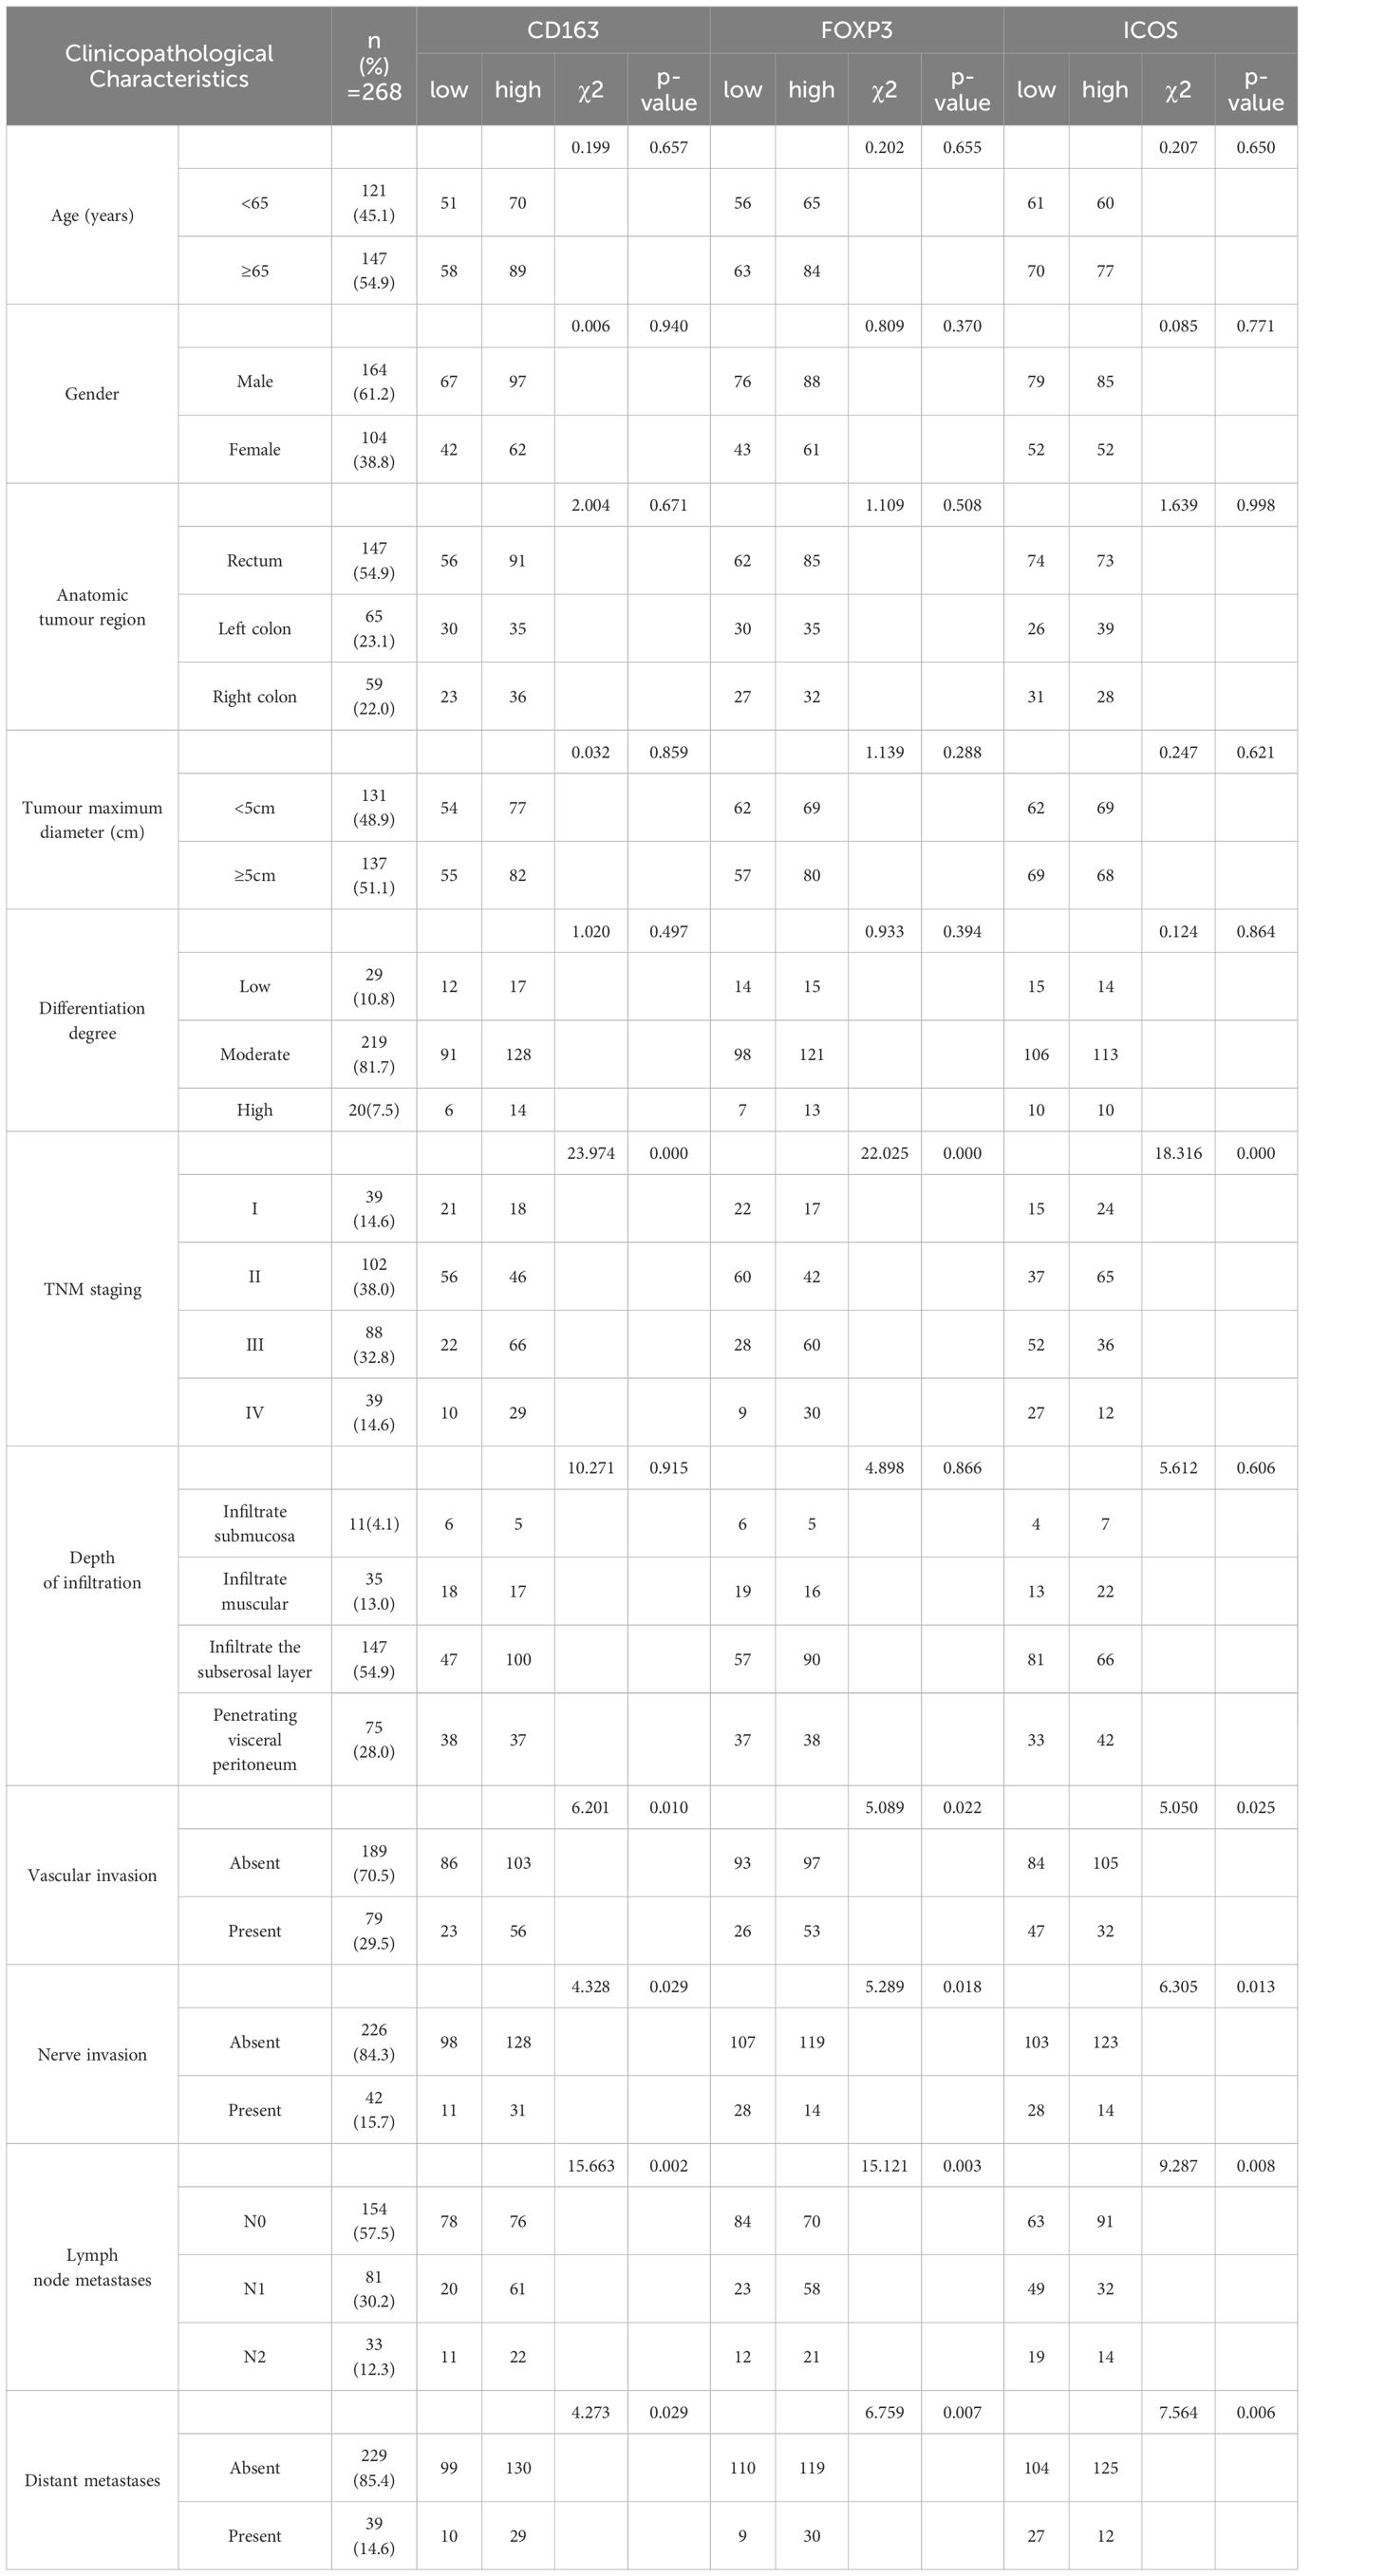
Table 2 Clinical and pathological information statistics of CD163, Foxp 3 and ICOS.
Analysis revealed a close relationship between the expression of CD163, Foxp3, and ICOS in CRC tissues and tumor TNM staging. It was found that the expression levels of these three proteins varied in different TNM stages of CRC patients (Figure 5).
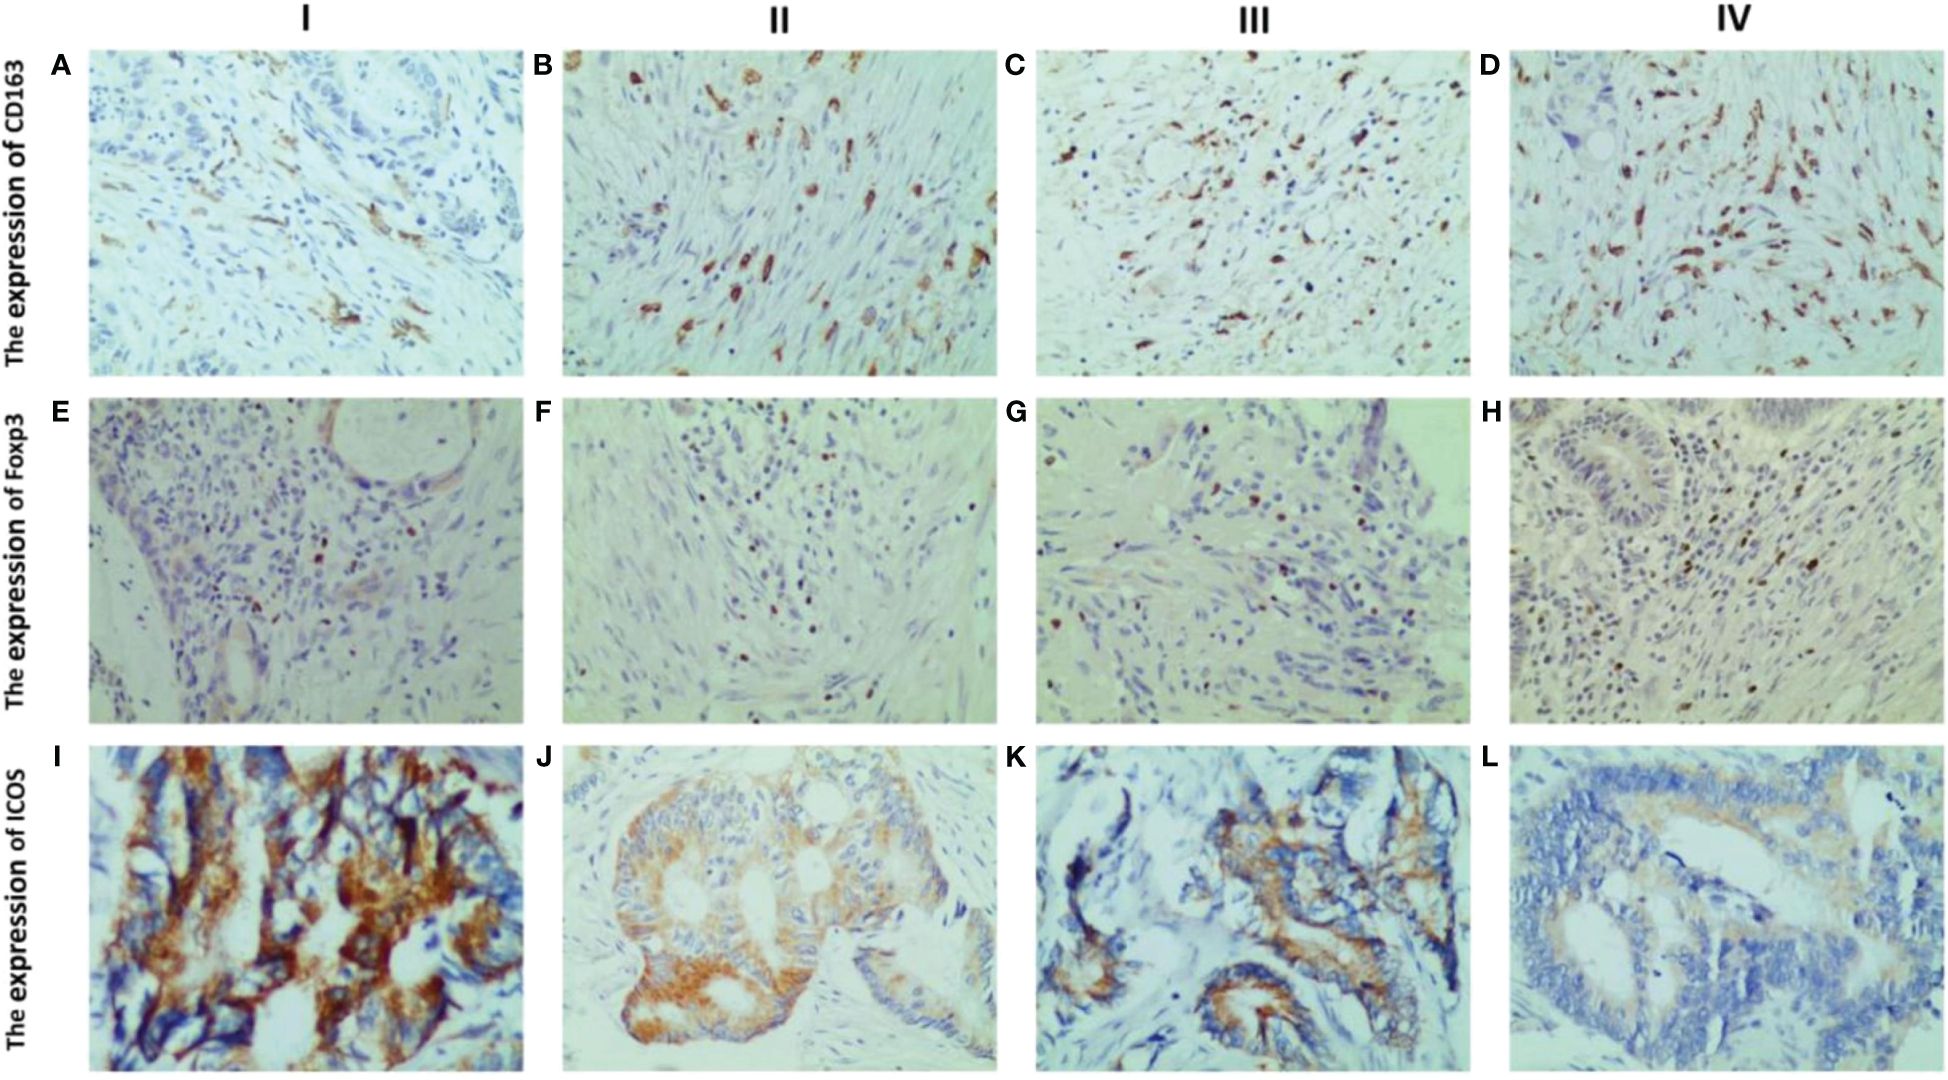
Figure 5 Representative IHC staining of CD163, Foxp3 and ICOS in different tumour TNM staging (400× field). The expression of CD163 in CRC at stages I, II, III and IV (A–D). The expression of Foxp3 in CRC at stages I, II, III and IV (E–H). The expression levels of ICOS in CRC at stages I, II, III and IV (I–L). The expression levels of the three were significantly different in the different TNM stages of CRC patients. With increasing TNM stage, CD163 and Foxp3 expression were significantly increased, while ICOS expression decreased significantly.
By comparing the expression levels of these three proteins in TNM stages of CRC patients, it was observed that with the increase in tumor TNM stage, invasion depth, lymph node metastasis, and distant metastasis, the expression levels of CD163 and Foxp3 significantly increased in TNM stages and distant metastasis (Figures 6A, D, E, H). And the expression levels of CD163 significantly increased in tumor infiltration depth (Figure 6B). However, the expression of ICOS significantly decreased in TNM stages, invasion depth, lymph node metastasis, and distant metastasis (Figures 6I–L). The expression level of CD163 did not show statistical significance in terms of lymph node metastasis. Similarly, the expression level of Foxp3 also lacked statistical significance in both infiltration depth and lymph node metastasis (p >0.05) (Figures 6C, F, G).
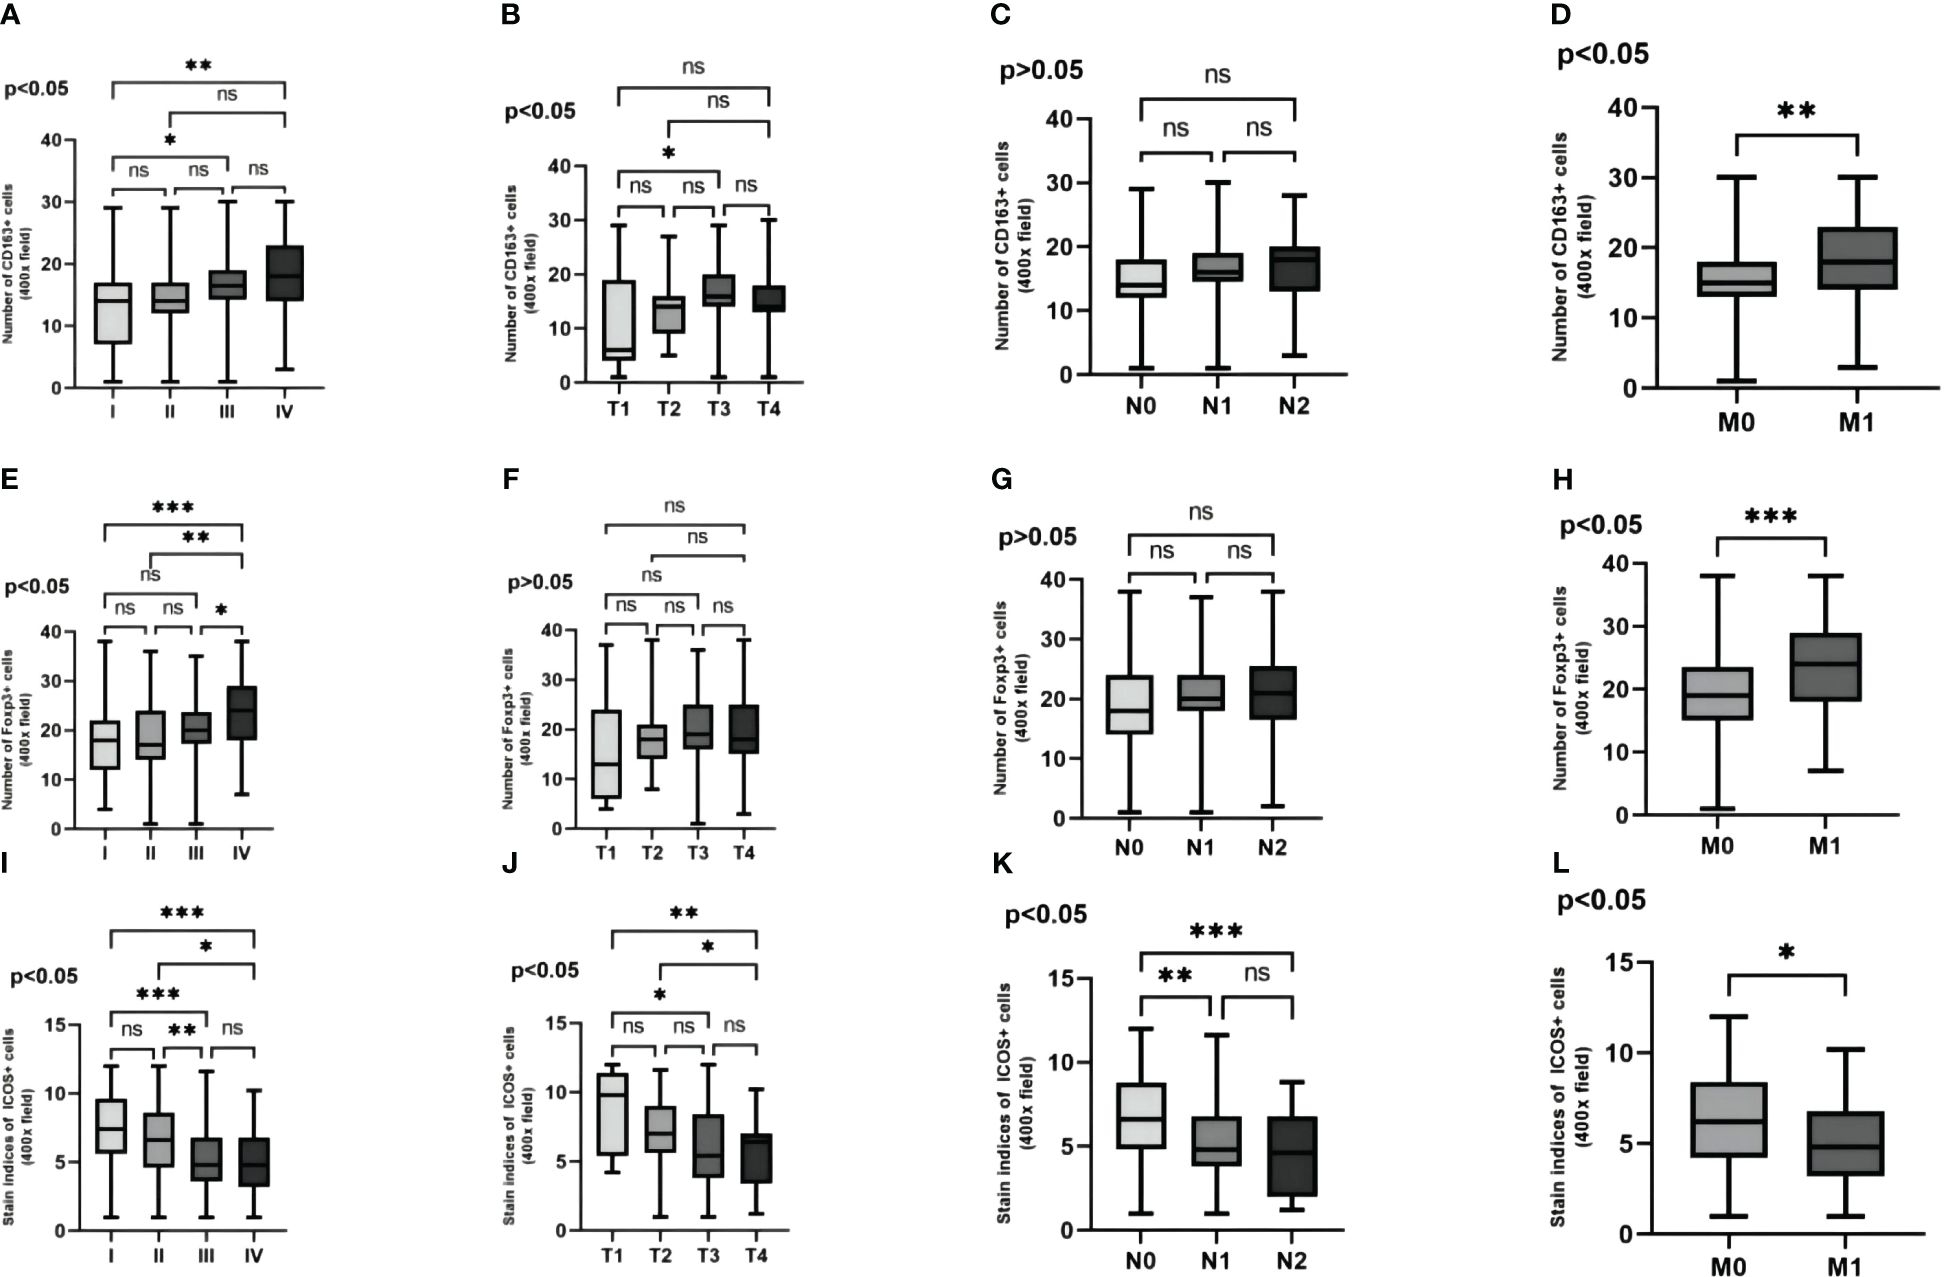
Figure 6 The variability of CD163, Foxp3 and ICOS in the pathological features are examined. The variability of three proteins in the TNM stagings of CRC patients' cancer tissue are analyzed (A, E, I). The variability of these three proteins in the depth of infiltration in CRC patients' cancer tissue are investigated (B, F, J). The variability of these three proteins in the lymph node metastasis in CRC patients' cancer tissue are explored (C, G, K). The variability of these three proteins in the distant metastasis in CRC patients' cancer tissue are evaluated (D, H, L). Statistical test method: ANOVA and independent samples' t-test, n=268. “*” means less than equal to 0.05 but greater than 0.02; “**” means less than equal to 0.02 but greater than 0.001; “***” means less than equal to 0.001; "ns" means more than 0.05.
As shown in Figure 7, the number of M2 macrophages was significantly positively correlated with the number of Tregs (r=0.575, p <0.01) (Figure 7A), while the number of M2 macrophages and Tregs was significantly negatively correlated with the ICOS staining index (r=-0.460, p <0.01; r=-0.417, p <0.01) (Figures 7B, C).
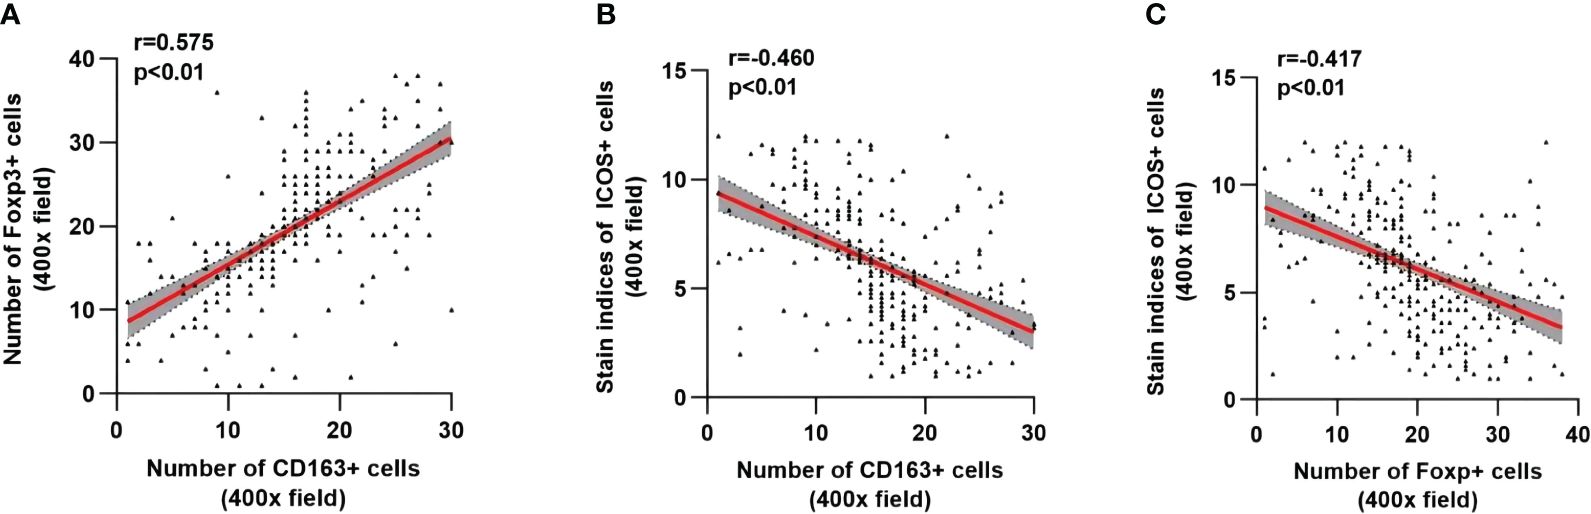
Figure 7 Correlation analysis among CD163, Foxp3 and ICOS in CRC. The linear correlation model is shown with a red line. Corresponding 95% confidence intervals (CI) are shown with the gray area. (A) Correlation between the number of CD163+ cells and Foxp3+ cells. (B) Correlation between the number of CD163+ cells and the staining indices of ICOS+ cells. (C) Correlation between the number of Foxp3+ cells and the staining indices of ICOS cells. Statistical test method: Spearman correlation analysis.
As shown in Table 3, Spearman correlation analysis was used to determine the correlation between the number of M2 macrophages and Tregs, ICOS staining index, and preoperative CEA, CA19–9, and CA72–4 in CRC. The number of M2 macrophages was significantly positively correlated with preoperative CEA (r=0.190, p =0.002), but had no significant correlation with preoperative CA19–9 and CA72–4 (r=0.116, p =0.058; r=0.037, p =0.550). The number of Tregs was significantly positively correlated with preoperative CEA and CA19–9 (r=0.205, p =0.001; r=0.183, p =0.003), but had no significant correlation with preoperative CA72–4 (r=0.008, p =0.892). The ICOS staining index was significantly negative correlated with preoperative CEA and CA19–9 (r=-0.176, p =0.004; r=-0.158, p =0.010), but had no significant correlation with preoperative CA72–4 (r=-0.056, p =0.362).
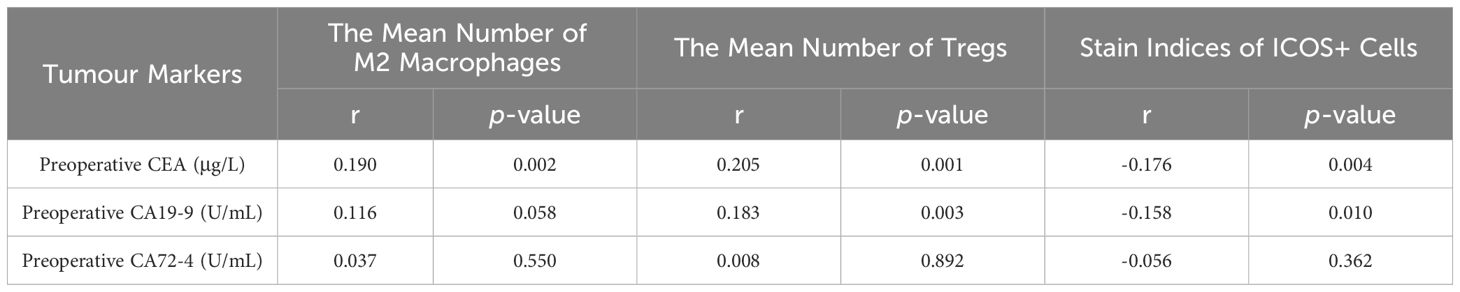
Table 3 Correlation analysis of the number of M2 macrophages and tregs and stain Indices of ICOS Cells with Preoperative CEA, CA19-9 and CA72-4.
This study, involving immunohistochemical (IHC) staining of cancerous, peritumoral, and normal tissues from 268 colorectal cancer (CRC) patients, has for the first time discovered a correlation between ICOS, M2 macrophages, and regulatory T cells (Tregs) in CRC. As CRC progresses, ICOS exhibits a significant negative correlation with M2 macrophages and Tregs. The expression levels of M2 macrophages and Tregs increase with tumor progression, whereas ICOS expression decreases. This trend may be associated with the ICOS/ICOSL signaling pathway. All three proteins showed higher expression in cancerous tissues compared to peritumoral and normal tissues. Bioinformatics analysis indicated that high ICOS expression significantly impacts long-term survival rates.
M2 macrophages and Tregs are vital components of the tumor microenvironment (TME) and play a crucial role in the development and progression of malignancies. Previous studies have found a close relationship between M2 macrophages and Tregs in various cancers, including gastric, colorectal, ovarian epithelial, and prostate cancers (17–20). M2 macrophages, as the primary expression form of tumor-associated macrophages, promote Th2 cell differentiation through the induction of IL-4, IL-13, and other cytokines and secrete IL-10, TGF-β to suppress inflammatory cytokines (4). Tumor-associated M2 macrophages play a significant role in tumor progression and immune escape by secreting anti-inflammatory factors and activating related signaling pathways (21). Studies by Gigliotti CL and others have shown that ICOS-CH3, by activating ICOSL, differentially regulates human M1 and M2 macrophages under various polarization conditions. ICOS-CH3 inhibits M2 macrophage polarization, thus reducing cytokine secretion and cell migration (15). Chang SR’s findings in advanced head and neck squamous cell carcinoma (HNSCC) and oral squamous cell carcinoma (OSCC) indicate increased M2 macrophage expression and decreased ICOS expression (22). Our study corroborates these findings.
Tregs, as a critical subset of functionally suppressive T cells, play a vital role in immune self-tolerance (6). They can suppress the function of effector T cells either through direct cell-to-cell contact or by secreting immunosuppressive factors (9). Research by Liyanage has shown that in pancreatic or breast cancer, the proportion of Tregs in tumor-infiltrating lymphocytes (TILs) and peripheral blood increases. Tregs suppress the proliferation of CD4+ and CD8+ T cells, reducing anti-tumor immune responses and are closely related to tumor prognosis (23). Studies have found that ICOS, by triggering ICOSL, promotes the differentiation of Tregs and Th-17 cells, regulating T cell activation in lymphoid organs and T cell function at inflammatory sites (24, 25). Mesturini and others discovered that ICOS in the TME inhibits the differentiation of naïve T cells into Tregs through its soluble ligand form, thereby inhibiting tumor progression (26). We hypothesize that the increase in Tregs could inversely inhibit the ICOS/ICOSL signaling pathway, further suppressing effector T cell immune responses against the tumor and promoting CRC development.
ICOS, a co-stimulatory receptor homologous to the stimulatory receptor CD28 and inhibitory receptor CTLA-4, plays a dual role in regulating T cell function across different tumors (10, 27). Programmed cell death-1 ligand 1 (PD-L1) leads to upregulation of M2 macrophages in the TME through activation of signal transducer and activation of transcription 3 (STAT 3)/nuclear factor kappa-B (NF- κ B) signaling pathway, leading to immunosuppression and EMT in CRC (28). The FDA-approved ipilimumab, a CTLA-4 blocking antibody, has shown success in various malignancies by targeting the PD-1 pathway, highlighting the significance of the B7-CD28 family in tumor immunotherapy (29). ICOS-mediated ICOSL triggering drives a “reverse signal” that inhibits migration and cytokine secretion in endothelial cells (ECs), dendritic cells (DCs), and tumor cells (30–33). Additionally, ICOSL triggering promotes antigen cross-presentation in dendritic cells and inhibits osteoclast (OC) differentiation and function (34). In tumor cells, high-level ICOSL expression activated by ICOS significantly reduces tumor cell metastasis, indicating that the inhibitory effect of ICOS-mediated ICOSL triggering surpasses the promoting effect of OPN-mediated ICOSL triggering. Furthermore, ICOS-Fc treatment increases effector T cells and reduces regulatory T cells, inhibiting tumor cell metastasis (35). In OSCC and HNSCC, higher ICOS or lower CD276/ICOS is a good prognostic marker for patient survival and lymph node metastasis (22). This is consistent with our findings where ICOS expression decreases with CRC progression, and high ICOS expression is significantly correlated with long-term survival (16).
The interaction between M2 macrophages and Tregs can promote CRC progression (18). In the TME, inhibiting the ICOS/ICOSL signaling pathway promotes the differentiation of naive T cells into Tregs (14). High levels of Tregs might induce tumor-associated macrophages to polarize towards the M2 type by inhibiting ICOS expression. Tumor markers have been widely used in CRC research, with their specificity indices playing a crucial role in early cancer screening and postoperative recovery (36). Preoperative CEA has been found to be significantly positively correlated with the expression levels of M2-type macrophages and Tregs in CRC, closely related to CRC lymph node metastasis, consistent with our research findings (18). Dianzani C and others found that ICOS-Fc treatment inhibited tumor cell migration to the lungs in mice, increasing IL-17A and RAR-related orphan receptor C (RORc) expression while reducing IL-10 and Foxp3 expression. ICOS-Fc inhibited tumor epithelial-mesenchymal transition (EMT) and migration in vitro and metastasis in vivo (32). M2 macrophages and Tregs in CRC have a synergistic effect, with the inhibition of the ICOS/ICOSL signaling pathway likely playing a key role. Although ICOS’s role in tumor immunology has been extensively studied, its specific role and mechanism in CRC remain unclear. Particularly, the role of ICOS in regulating Tregs and affecting M2-type macrophage polarization requires further exploration. This study aims to fill this research gap, with future investigations focusing on how Tregs promote CRC development by inducing M2-type macrophage polarization through ICOS. The dual role of ICOS in different malignancies is clear, but its positive prognostic significance in CRC is undeniable.
However, this study has limitations. As a cross-sectional study, we cannot infer causality and need more longitudinal studies to verify our results. Secondly, the participants’ origin from China may limit the generalizability of our findings. Lastly, immunohistochemistry has limitations in repeatability and accuracy compared to more advanced methods.
The expression levels of M2 macrophages and Tregs increased with tumor progression, while ICOS expression showed a decreasing trend. Tregs may promote CRC tumor progression by downregulating ICOS and inhibiting the ICOS/ICOSL signaling pathway, inducing M2-type macrophage polarization. M2-type macrophages, Tregs, and the ICOS/ICOSL signaling pathway could become new potential targets for immune therapy in CRC, holding significant clinical value for the diagnosis, treatment, and prognosis of CRC patients.
The data that support the findings of this study are available on request from the corresponding author.
The study was conducted in accordance with the Ethics Committee of the First Affiliated Hospital of Jinzhou Medical University (KYLL 202463) and the 1964 Helsinki Declaration. Written informed consent obtained from all participants included in the study.
JX: Conceptualization, Data curation, Formal analysis, Funding acquisition, Investigation, Methodology, Project administration, Resources, Software, Supervision, Validation, Visualization, Writing – original draft, Writing – review & editing. YG: Conceptualization, Data curation, Formal analysis, Funding acquisition, Investigation, Methodology, Project administration, Resources, Software, Supervision, Validation, Visualization, Writing – original draft, Writing – review & editing. YD: Writing – review & editing. YF: Writing – review & editing. JC: Writing – review & editing. SZ: Writing – review & editing. XS: Writing – review & editing. SQ: Writing – original draft, Writing – review & editing, Conceptualization, Data curation, Formal analysis, Funding acquisition, Investigation, Methodology, Project administration, Resources, Software, Supervision, Validation, Visualization.
The author(s) declare that no financial support was received for the research, authorship, and/or publication of this article.
The authors sincerely appreciate the assistance of The First Affiliated Hospital of Jinzhou Medical University.
The authors declare that the research was conducted in the absence of any commercial or financial relationships that could be construed as a potential conflict of interest.
All claims expressed in this article are solely those of the authors and do not necessarily represent those of their affiliated organizations, or those of the publisher, the editors and the reviewers. Any product that may be evaluated in this article, or claim that may be made by its manufacturer, is not guaranteed or endorsed by the publisher.
1. Sung H, Ferlay J, Siegel RL, Laversanne M, Soerjomataram I, Jemal A, et al. Global cancer statistics 2020: GLOBOCAN estimates of incidence and mortality worldwide for 36 cancers in 185 countries. CA: Cancer J Clin. (2021) 71:209–49. doi: 10.3322/caac.21660
2. Siegel RL, Wagle NS, Cercek A, Smith RA, Jemal A. Colorectal cancer statistics, 2023. CA: Cancer J Clin. (2023) 73:233–54. doi: 10.3322/caac.21772
3. Quail DF, Joyce JA. Microenvironmental regulation of tumor progression and metastasis. Nat Med. (2013) 19:1423–37. doi: 10.1038/nm.3394
4. Qian BZ, Pollard JW. Macrophage diversity enhances tumor progression and metastasis. Cell. (2010) 141:39–51. doi: 10.1016/j.cell.2010.03.014
5. Ding D, Yao Y, Yang C, Zhang S. Identification of mannose receptor and CD163 as novel biomarkers for colorectal cancer. Cancer biomarkers: section A Dis Markers. (2018) 21:689–700. doi: 10.3233/cbm-170796
6. Takeuchi Y, Nishikawa H. Roles of regulatory T cells in cancer immunity. Int Immunol. (2016) 28:401–9. doi: 10.1093/intimm/dxw025
7. Fontenot JD, Gavin MA, Rudensky AY. Foxp3 programs the development and function of CD4+CD25+ regulatory T cells. Nat Immunol. (2003) 4:330–6. doi: 10.1038/ni904
8. Devaud C, Yong CS, John LB, Westwood JA, Duong CP, House CM, et al. Foxp3 expression in macrophages associated with RENCA tumors in mice. PloS One. (2014) 9:e108670. doi: 10.1371/journal.pone.0108670
9. Chaudhary B, Elkord E. Regulatory T cells in the tumor microenvironment and cancer progression: role and therapeutic targeting. Vaccines (Basel). (2016) 4. doi: 10.3390/vaccines4030028
10. Sharpe AH, Freeman GJ. The B7-CD28 superfamily. Nat Rev Immunol. (2002) 2:116–26. doi: 10.1038/nri727
11. Hutloff A, Dittrich AM, Beier KC, Eljaschewitsch B, Kraft R, Anagnostopoulos I, et al. ICOS is an inducible T-cell co-stimulator structurally and functionally related to CD28. Nature. (1999) 397:263–6. doi: 10.1038/16717
12. Lee H, Kim JH, Yang SY, Kong J, Oh M, Jeong DH, et al. Peripheral blood gene expression of B7 and CD28 family members associated with tumor progression and microscopic lymphovascular invasion in colon cancer patients. J Cancer Res Clin Oncol. (2010) 136:1445–52. doi: 10.1007/s00432–010-0800–4
13. Le KS, Thibult ML, Just-Landi S, Pastor S, Gondois-Rey F, Granjeaud S, et al. Follicular B lymphomas generate regulatory T cells via the ICOS/ICOSL pathway and are susceptible to treatment by anti-ICOS/ICOSL therapy. Cancer Res. (2016) 76:4648–60. doi: 10.1158/0008–5472.CAN-15–0589
14. Martin-Orozco N, Li Y, Wang Y, Liu S, Hwu P, Liu YJ, et al. Melanoma cells express ICOS ligand to promote the activation and expansion of T-regulatory cells. Cancer Res. (2010) 70:9581–90. doi: 10.1158/0008–5472.CAN-10–1379
15. Gigliotti CL, Dianzani C, Stoppa I, Monge C, Sutti S, Sblattero D, et al. Differential modulation of human M1 and M2 macrophage activity by ICOS-mediated ICOSL triggering. Int J Mol Sci. (2023) 24. doi: 10.3390/ijms24032953
16. Zhang Y, Luo Y, Qin SL, Mu YF, Qi Y, Yu MH, et al. The clinical impact of ICOS signal in colorectal cancer patients. Oncoimmunology. (2016) 5:e1141857. doi: 10.1080/2162402x.2016.1141857
17. Liu X, Xu D, Huang C, Guo Y, Wang S, Zhu C, et al. Regulatory T cells and M2 macrophages present diverse prognostic value in gastric cancer patients with different clinicopathologic characteristics and chemotherapy strategies. J Transl Med. (2019) 17:192. doi: 10.1186/s12967–019-1929–9
18. Chen Y, Gao Y, Ma X, Wang Y, Liu J, Yang C, et al. A study on the correlation between M2 macrophages and regulatory T cells in the progression of colorectal cancer. Int J Biol markers. (2022) 37:412–20. doi: 10.1177/03936155221132572
19. Zhu Q, Wu X, Wu Y, Wang X. Interaction between Treg cells and tumor-associated macrophages in the tumor microenvironment of epithelial ovarian cancer. Oncol Rep. (2016) 36:3472–8. doi: 10.3892/or.2016.5136
20. Erlandsson A, Carlsson J, Lundholm M, Falt A, Andersson SO, Andren O, et al. M2 macrophages and regulatory T cells in lethal prostate cancer. Prostate. (2019) 79:363–9. doi: 10.1002/pros.23742
21. Shapouri-Moghaddam A, Mohammadian S, Vazini H, Taghadosi M, Esmaeili SA, Mardani F, et al. Macrophage plasticity, polarization, and function in health and disease. J Cell Physiol. (2018) 233:6425–40. doi: 10.1002/jcp.26429
22. Chang SR, Chou CH, Liu CJ, Lin YC, Tu HF, Chang KW, et al. The concordant disruption of B7/CD28 immune regulators predicts the prognosis of oral carcinomas. Int J Mol Sci. (2023) 24. doi: 10.3390/ijms24065931
23. Liyanage UK, Moore TT, Joo HG, Tanaka Y, Herrmann V, Doherty G, et al. Prevalence of regulatory T cells is increased in peripheral blood and tumor microenvironment of patients with pancreas or breast adenocarcinoma. J Immunol (Baltimore Md: 1950). (2002) 169:2756–61. doi: 10.4049/jimmunol.169.5.2756
24. Nurieva RI. Regulation of immune and autoimmune responses by ICOS-B7h interaction. Clin Immunol. (2005) 115:19–25. doi: 10.1016/j.clim.2005.02.010
25. Bauquet AT, Jin H, Paterson AM, Mitsdoerffer M, Ho IC, Sharpe AH, et al. The costimulatory molecule ICOS regulates the expression of c-Maf and IL-21 in the development of follicular T helper cells and TH-17 cells. Nat Immunol. (2009) 10:167–75. doi: 10.1038/ni.1690
26. Mesturini R, Nicola S, Chiocchetti A, Bernardone IS, Castelli L, Bensi T, et al. ICOS cooperates with CD28, IL-2, and IFN-gamma and modulates activation of human naïve CD4+ T cells. Eur J Immunol. (2006) 36:2601–12. doi: 10.1002/eji.200535571
27. Carreno BM, Collins M. The B7 family of ligands and its receptors: new pathways for costimulation and inhibition of immune responses. Annu Rev Immunol. (2002) 20:29–53. doi: 10.1146/annurev.immunol.20.091101.091806
28. Júnior RFA, Lira GA, Schomann T, Cavalcante RS, Vilar NF, De Paula RCM, et al. Retinoic acid-loaded PLGA nanocarriers targeting cell cholesterol potentialize the antitumour effect of PD-L1 antibody by preventing epithelial-mesenchymal transition mediated by M2-TAM in colorectal cancer. Trans Oncol. (2023) 31:101647. doi: 10.1016/j.tranon.2023.101647
29. Ceeraz S, Nowak EC, Noelle RJ. B7 family checkpoint regulators in immune regulation and disease. Trends Immunol. (2013) 34:556–63. doi: 10.1016/j.it.2013.07.003
30. Tang G, Qin Q, Zhang P, Wang G, Liu M, Ding Q, et al. Reverse signaling using an inducible costimulator to enhance immunogenic function of dendritic cells. Cell Mol Life Sci. (2009) 66:3067–80. doi: 10.1007/s00018–009-0090–7
31. Dianzani C, Minelli R, Mesturini R, Chiocchetti A, Barrera G, Boscolo S, et al. B7h triggering inhibits umbilical vascular endothelial cell adhesiveness to tumor cell lines and polymorphonuclear cells. J Immunol (Baltimore Md: 1950). (2010) 185:3970–9. doi: 10.4049/jimmunol.0903269
32. Dianzani C, Minelli R, Gigliotti CL, Occhipinti S, Giovarelli M, Conti L, et al. B7h triggering inhibits the migration of tumor cell lines. J Immunol (Baltimore Md: 1950). (2014) 192:4921–31. doi: 10.4049/jimmunol.1300587
33. Occhipinti S, Dianzani C, Chiocchetti A, Boggio E, Clemente N, Gigliotti CL, et al. Triggering of B7h by the ICOS modulates maturation and migration of monocyte-derived dendritic cells. J Immunol (Baltimore Md: 1950). (2013) 190:1125–34. doi: 10.4049/jimmunol.1201816
34. Gigliotti CL, Boggio E, Clemente N, Shivakumar Y, Toth E, Sblattero D, et al. ICOS-ligand triggering impairs osteoclast differentiation and function in vitro and in vivo. J Immunol (Baltimore Md: 1950). (2016) 197:3905–16. doi: 10.4049/jimmunol.1600424
35. Raineri D, Cappellano G, Vilardo B, Maione F, Clemente N, Canciani E, et al. Inducible T-cell costimulator ligand plays a dual role in melanoma metastasis upon binding to osteopontin or inducible T-cell costimulator. Biomedicines. (2021) 10. doi: 10.3390/biomedicines10010051
Keywords: M2 Macrophages, Tregs, ICOS, colorectal cancer, ICOS
Citation: Xu J, Gao Y, Ding Y, Feng Y, Chen J, Zhang S, Song X and Qiao S (2024) Correlation between Tregs and ICOS-induced M2 macrophages polarization in colorectal cancer progression. Front. Oncol. 14:1373820. doi: 10.3389/fonc.2024.1373820
Received: 20 January 2024; Accepted: 01 July 2024;
Published: 22 July 2024.
Edited by:
Donatella Delle Cave, National Research Council (CNR), ItalyReviewed by:
H. Atakan Ekiz, Izmir Institute of Technology, TürkiyeCopyright © 2024 Xu, Gao, Ding, Feng, Chen, Zhang, Song and Qiao. This is an open-access article distributed under the terms of the Creative Commons Attribution License (CC BY). The use, distribution or reproduction in other forums is permitted, provided the original author(s) and the copyright owner(s) are credited and that the original publication in this journal is cited, in accordance with accepted academic practice. No use, distribution or reproduction is permitted which does not comply with these terms.
*Correspondence: Yu Gao, anp5a2R4Z3lAMTYzLmNvbQ==
Disclaimer: All claims expressed in this article are solely those of the authors and do not necessarily represent those of their affiliated organizations, or those of the publisher, the editors and the reviewers. Any product that may be evaluated in this article or claim that may be made by its manufacturer is not guaranteed or endorsed by the publisher.
Research integrity at Frontiers
Learn more about the work of our research integrity team to safeguard the quality of each article we publish.