 Mengqi Huang
- Tongji Hospital, Tongji Medical College, Huazhong University of Science and Technology, Wuhan, Hubei, China
Purpose: To assess the utility of fat fraction quantification using quantitative multi-echo Dixon for evaluating tumor proliferation and microvascular invasion (MVI) in hepatocellular carcinoma (HCC).
Methods: A total of 66 patients with resection and histopathologic confirmed HCC were enrolled. Preoperative MRI with proton density fat fraction and R2* mapping was analyzed. Intratumoral and peritumoral regions were delineated with manually placed regions of interest at the maximum level of intratumoral fat. Correlation analysis explored the relationship between fat fraction and Ki67. The fat fraction and R2* were compared between high Ki67(>30%) and low Ki67 nodules, and between MVI negative and positive groups. Receiver operating characteristic (ROC) analysis was used for further analysis if statistically different.
Results: The median fat fraction of tumor (tFF) was higher than peritumor liver (5.24% vs 3.51%, P=0.012). The tFF was negatively correlated with Ki67 (r=-0.306, P=0.012), and tFF of high Ki67 nodules was lower than that of low Ki67 nodules (2.10% vs 4.90%, P=0.001). The tFF was a good estimator for low proliferation nodules (AUC 0.747, cut-off 3.39%, sensitivity 0.778, specificity 0.692). There was no significant difference in tFF and R2* between MVI positive and negative nodules (3.00% vs 2.90%, P=0.784; 55.80s-1 vs 49.15s-1, P=0.227).
Conclusion: We infer that intratumor fat can be identified in HCC and fat fraction quantification using quantitative multi-echo Dixon can distinguish low proliferative HCCs.
Highlights
● The intratumor fat on MRI is commonly detected and serves as an important ancillary feature for the diagnosis of HCC.
● The intratumor fat can be identified in HCC with chronic hepatitis and distinguish low proliferative HCCs which hold promise as a prognostic predictor.
Introduction
Tumor proliferation and microvascular invasion (MVI) in hepatocellular carcinoma (HCC) are pivotal factors leading to early recurrence following radical therapy and portend a poor prognosis (1). The immunohistochemical marker Ki-67 serves as a common indicator of cell proliferation and has been established as an independent predictor of early recurrence and poor prognosis in surgically resected HCC (2). A preoperative evaluation of proliferation and MVI may furnish additional insights for treatment strategies, such as limitation of ablation and liver transplantation, neoadjuvant and adjuvant therapeutics. However, determining proliferation and MVI is currently confined to specimens, limiting their broader clinical application.
The intra-tumoral fat is commonly identified in HCC, manifesting in various degrees of differentiation (3). Fatty change is known to be a marker of transformation from dysplastic nodule to HCC. It is more prevalent in well-differentiated HCC, with focal fatty changes observed in larger tumors. In clinical practice, poorly differentiated HCC often exhibits focal fatty change. A prevalent hypothesis for intra-tumoral fatty change involves reduced blood flow due to portal tract destruction and inadequate neovascularization (4, 5), which exposes the HCC to a hypoxic environment. Concurrently, upregulation of hypoxia-related signaling pathways promote the proliferation and migration of cancer cells (6). Therefore, quantifying fatty changes may serve as an indicator of HCC proliferation. Additionally, the invasiveness of HCC is corelated with increased tumor vascularity, and the HCC with diffuse fat tends to grow slowly and with lower risk of MVI (7), leading to favorable prognosis (8). Nevertheless, the relationship between the risk of MVI and the fat quantification in HCC with focal fat and chronic hepatitis remains unclear.
MRI with multi-echo Dixon and chemical shift encoded technique possesses a unique advantage in evaluating intra-cellular fat, as it can distinguish signals of water, triglyceride (9), and iron (10), which provide a non-invasive and quantitative evaluation. The quantitative multi-echo Dixon enables iron correction and accurate detection of fat, as well as MRI spectroscopy (11, 12). The intra-tumoral fat on MRI is an important ancillary feature for diagnosing HCC (13) and a potential biomarker for favorable performances after treatment (14). Thus, we hypothesize that the quantitative multi-echo Dixon may enable preoperative, non-invasive, and comprehensive assessment of cell proliferation and MVI, which may guide clinical treatment selection. Hence, this study aims to estimate the diagnostic value of fat fraction quantification based on MRI quantitative multi-echo Dixon for tumor proliferation and MVI in HCC.
Materials and methods
This retrospective study was approved by the institutional ethics committee and the requirement of informed written consent was waived.
Patients
We enrolled 203 consecutive patients who were suspected or known of hepatocellular carcinoma clinically or at previously performed ultrasonography or computed tomography underwent dynamic enhanced liver MRI and quantitative multi-echo Dixon from August 2021 to March 2023 in this study. We excluded patients who (1) had undergone non-surgical treatments (n=67); (2) has previous treated HCCs (n=18); (3) had histopathologically proven non-HCC (n=31); (4) encountered analysis difficulties due to small lesion size (n=10) or apparent artifacts in fat fraction mapping and R2* mapping(n=11). A final cohort of 66 patients with 66 lesions were analyzed. The study flowchart of patient selection is presented in Figure 1.
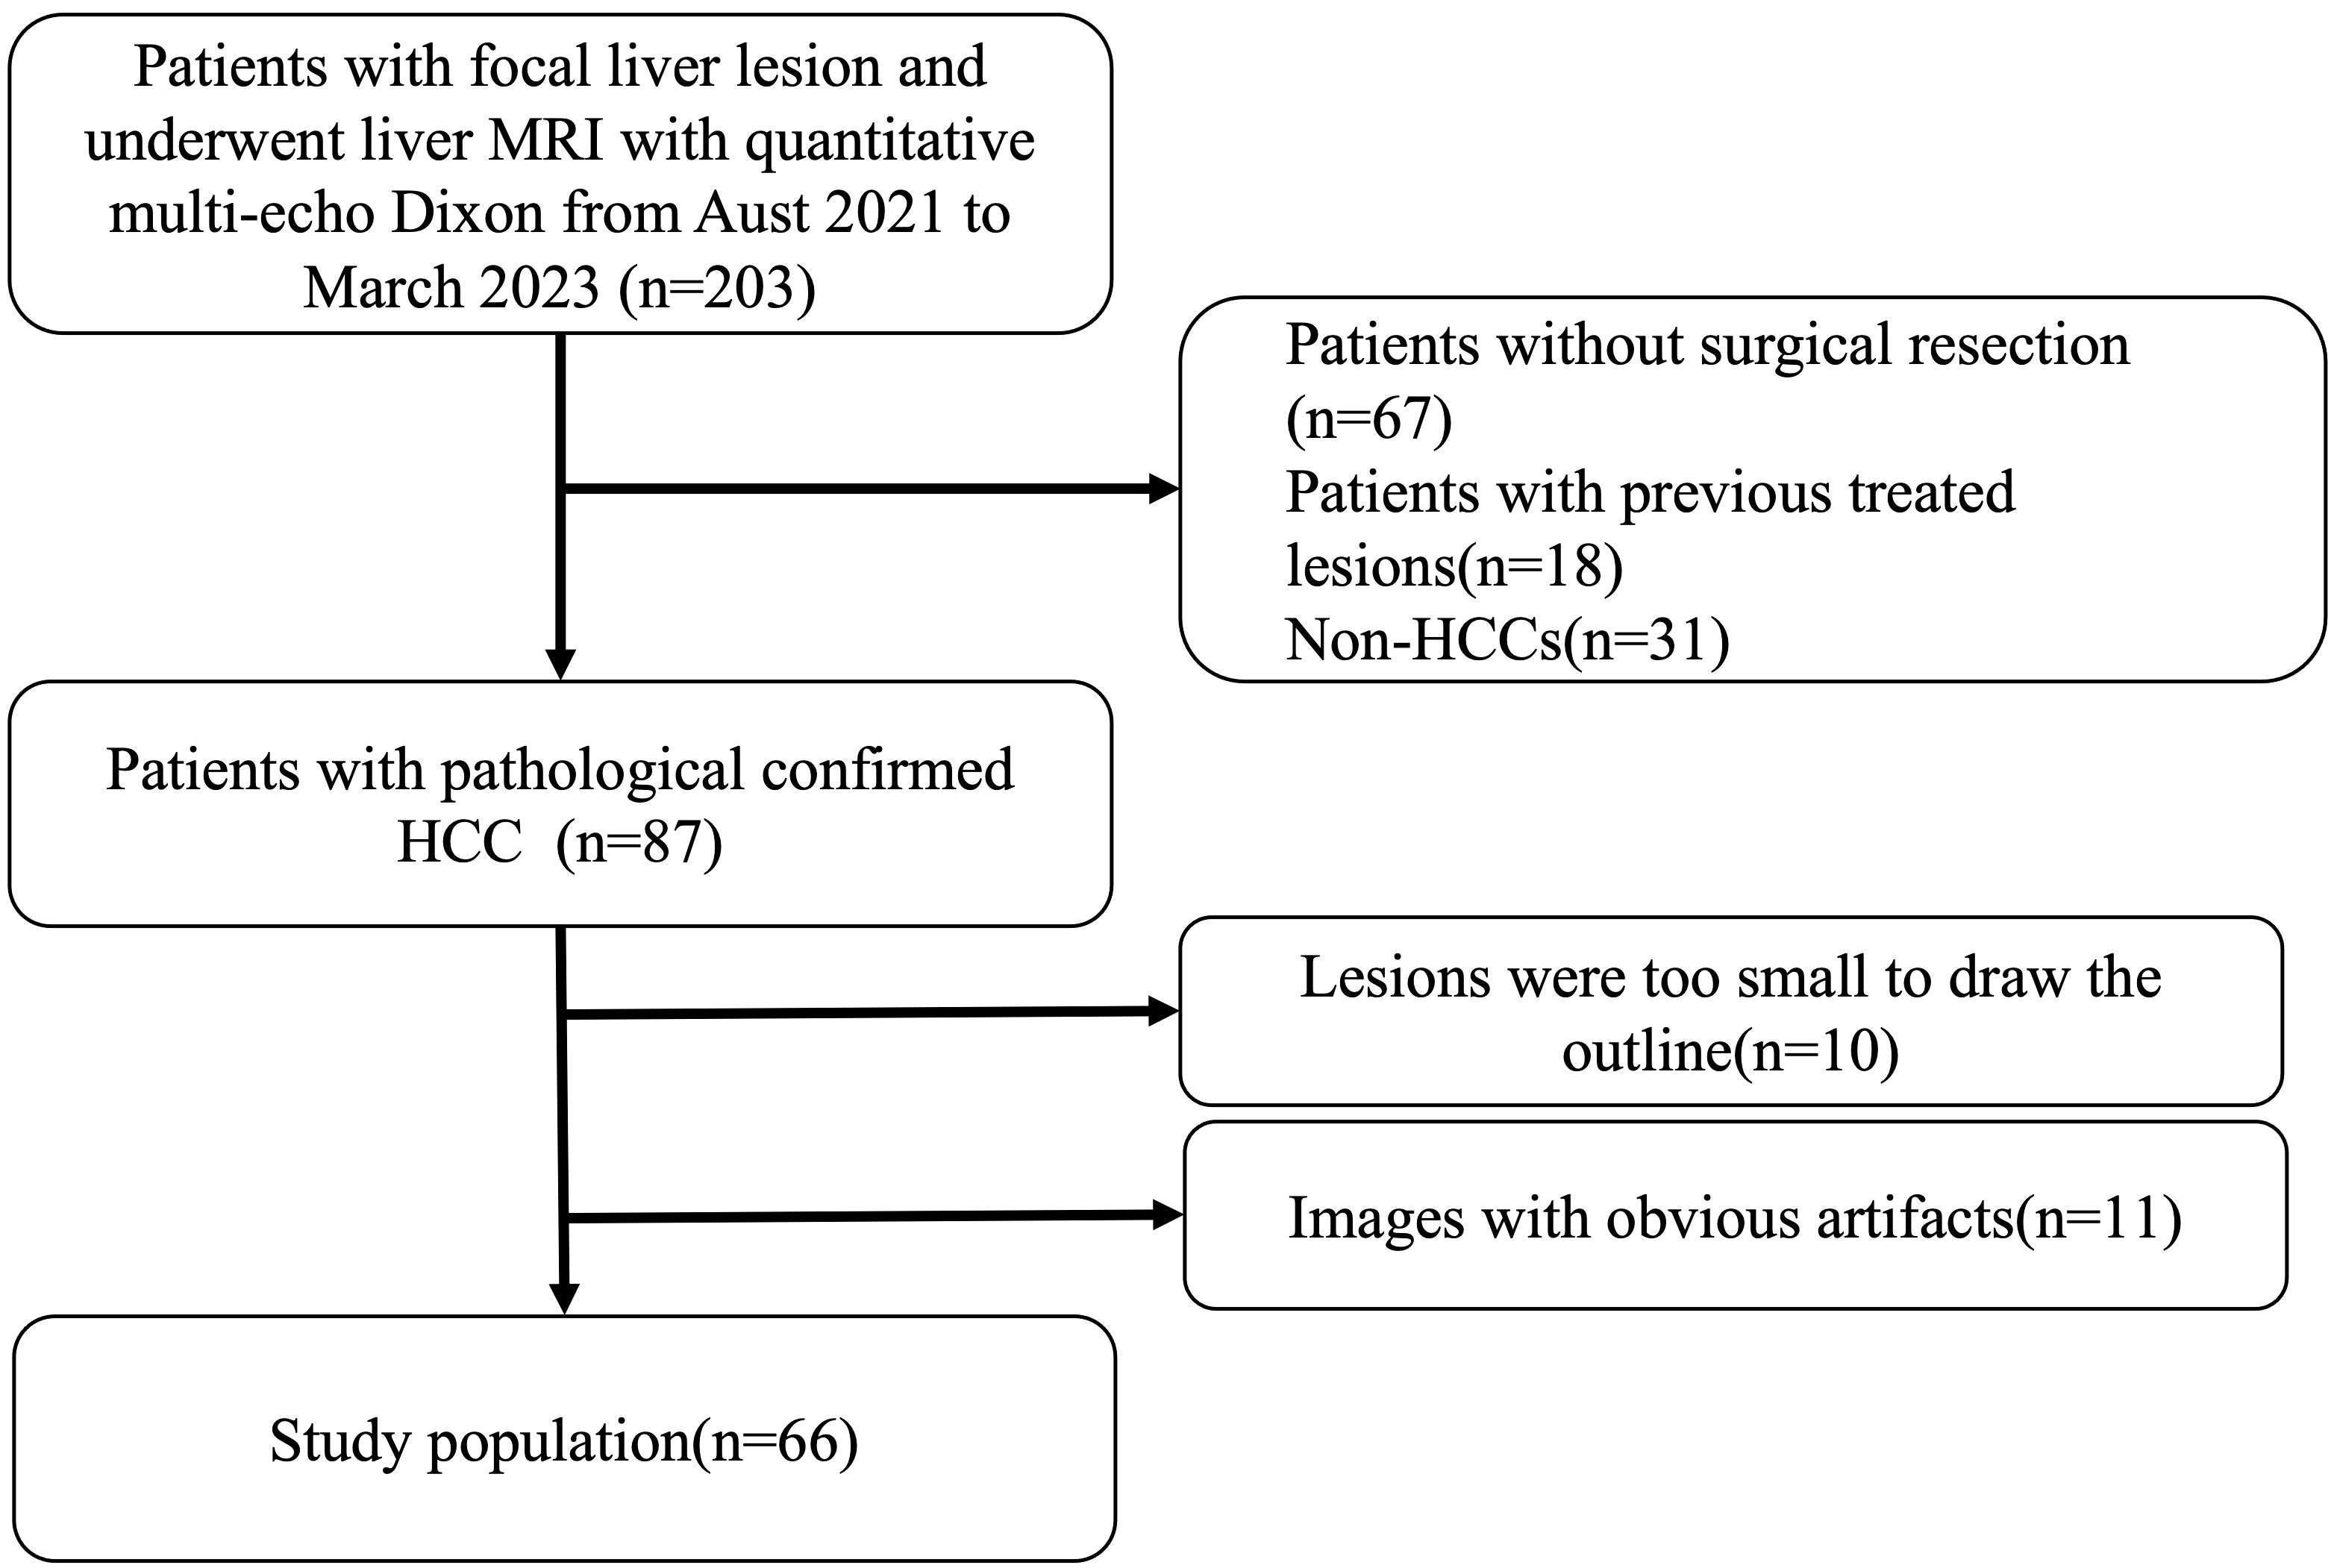
Figure 1 Patient selection. We enrolled 203 consecutive patients who were suspected or known of hepatocellular carcinoma clinically or at previously performed ultrasonography or computed tomography underwent dynamic enhanced liver MRI and quantitative multi-echo Dixon from August 2021 to March 2023 in this study. Patients who had undergone non-surgical treatments (n=67), had previous treated HCCs (n=18), had histopathologically proven non-HCC (n=31), encountered analysis difficulties due to small lesion size (n=10) or apparent artifacts in fat fraction mapping and R2* mapping(n=11) were excluded. And a final cohort of 66 patients with 66 lesions were enrolled.
Clinical information including demographics, causes of liver disease and laboratory data (total bilirubin, alanine transaminase, aspartate transaminase, albumin, serum alpha-foetoprotein) were collected.
MRI protocol
All MRI examinations were performed using the same protocol at 3.0T (MAGNETOM Skyra, Siemens, Germany) with an 18-channel phased-array coil and the spine coil with feet first and supine position. After conventional MRI sequences include the coronal T2-weighted Half-Fourier acquisition single-shot turbo spin-echo sequence (HASTE), the axial T1-weithted dual-echo sequence, the quantitative multi-echo Dixon was acquired in a single 20-second breath-hold. The detailed scanning parameters were as follows: repetition time (TR) = 9.00 msec, echo time (TE) =1.05/2.46/3.69/4.92/6.15/7.38msec, field of view (FOV) = 450 mm × 450 mm; slice thickness = 3.5mm, voxel size = 1.4 × 1.4 × 3.5mm; Flip angle= 4°; matrix size=160 ×95, bandwidth=1080Hz/Px, and an acceleration technique of CAIPIRINHA was employed with the acceleration factor was 2. A Levenberg-Marquardt nonlinear fitting was then utilized to fit the magnitude of the complex signal of the multi-echo data. Inline reconstruction was performed by addressing confounding factors that included magnetic field inhomogeneity, eddy currents, T1 bias, T2* decay, and spectral complexities.
Imaging analysis
The fat fraction mapping and R2* mapping was automatically calculated without the need for further post-processing. The region of interest (ROI) of the tumor, peritumoral regions, and liver were manually drawn. The ROI of the tumor was delineated in the maximum plane of the intatumoral fat or the maximum plane of tumor if no significant fat was depicted in fat fraction mapping and was delineated in the T1WI and copied to the fat fraction mapping and R2* mapping (Figure 2). The ROI of the peritumor liver was delineated in the peritumoral region of the tumor with a circle of about 1cm2 which avoided the main vessels and bile duct. The fat fraction of liver was the average of 3 different ROIs randomly delineated in the liver with 3 circles of about 3cm2, and avoided the main vessels and bile duct.
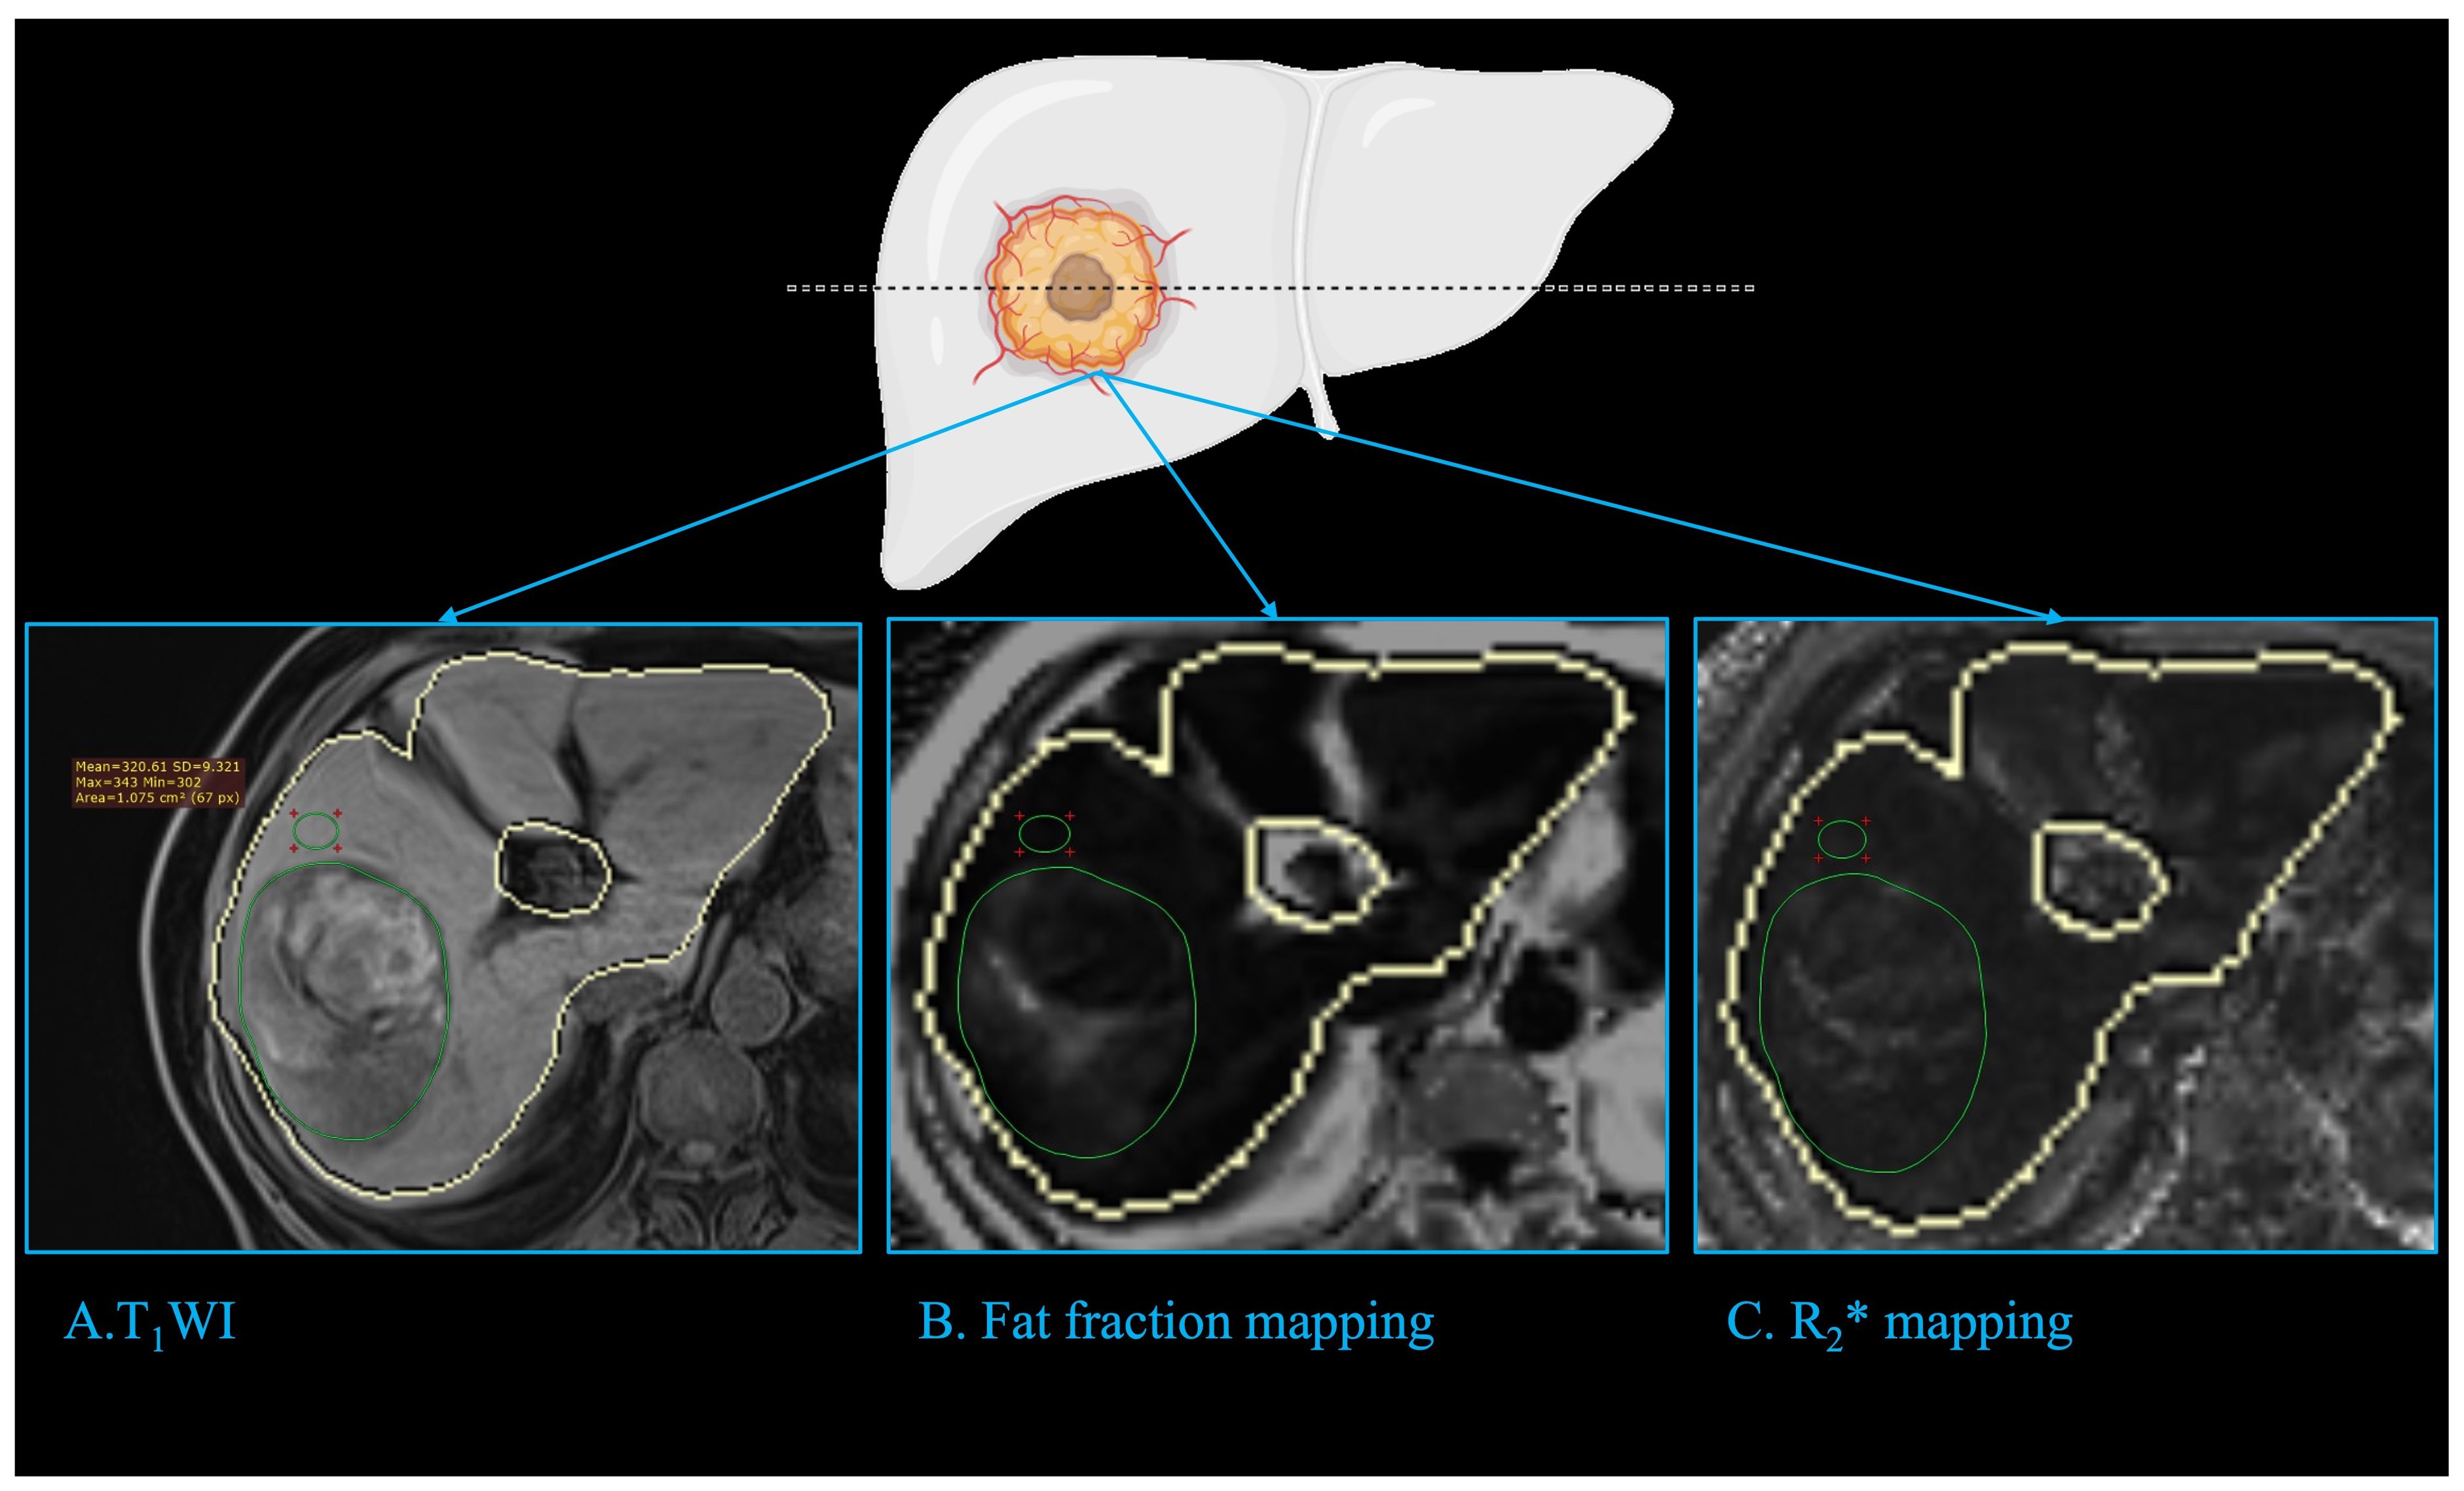
Figure 2 Imaging analysis. The fat fraction mapping and R2* mapping was automatically calculated with the liver automatically delineated (closed yellow curve). The ROI of tumor (green circle) was delineated in the maximum plane of the intatumoral fat or the tumor if no significant fat was depicted in fat fraction mapping, and was delineated in the T1WI (A) and copied to fat fraction mapping (B) and R2* mapping (C). The ROI of the peritumor liver (green circle) was delineated in the peritumoral region of the tumor with a circle of about 1cm2, which avoided the main vessels and bile duct. ROI: region of interest.
Histopathological analysis
Data of tumor pathologic factors including size, tumor differentiation based on Edmondson-Steiner grade, MVI, satellite nodule and expression of Ki67 were obtained from pathology reports. MVI was defined as the presence of tumor cells in the vessels of surrounding liver tissue which were lined by the endothelium that was visible only on microscopy. The positive cellular index of Ki67 was evaluated by a trained pathologist and described according to the presence of nuclear staining regardless of the intensity of staining. The percentage of Ki67 was determined by counting 1000 cells/slide at 100x magnification in five randomly selected fields.
Statistical analysis
Continuous variables were reported as means and standard deviations or medians and interquartile ranges. Categorical variables were displayed as percentages and numbers. The differences between groups were assessed using Mann-Whitney U test or Chi-squared test because data were non-normally distributed. The relationship between MRI parameters and Ki67 was assessed through nonparametric Spearman correlation coefficients. ROC analysis was performed if the MRI parameters showed statistically significant differences between the two Ki67 groups. A two-sided P-value less than 0.05 was considered statistically significant. All statistical analyses, utilizing SPSS software (version 26.0) and R statistical software (version 4.1.2), included t-tests, paired t-tests, and Mann–Whitney U tests for continuous variables, and the chi-square test for categorical variables. ROC analysis was performed using the “pROC” and “ggplot2” packages.
Results
Clinical characteristics
Of the 66 patients (mean age, 55.59 ± 8.99 years, 55(83.33%) males), 60 patients were infected with HBV, while 4 patients were infected with HCV and 2 patients have pathology proved chronic hepatitis change and no history of HBV, HCV, ASH, NASH and alcohol abuse. Furthermore, 18 (27.27%) HCCs were well-differentiated, while 17 (25.76%) patients had moderately differentiated HCCs and 31 (46.97%) HCCs were poorly differentiated. More details of patients are given in Table 1.
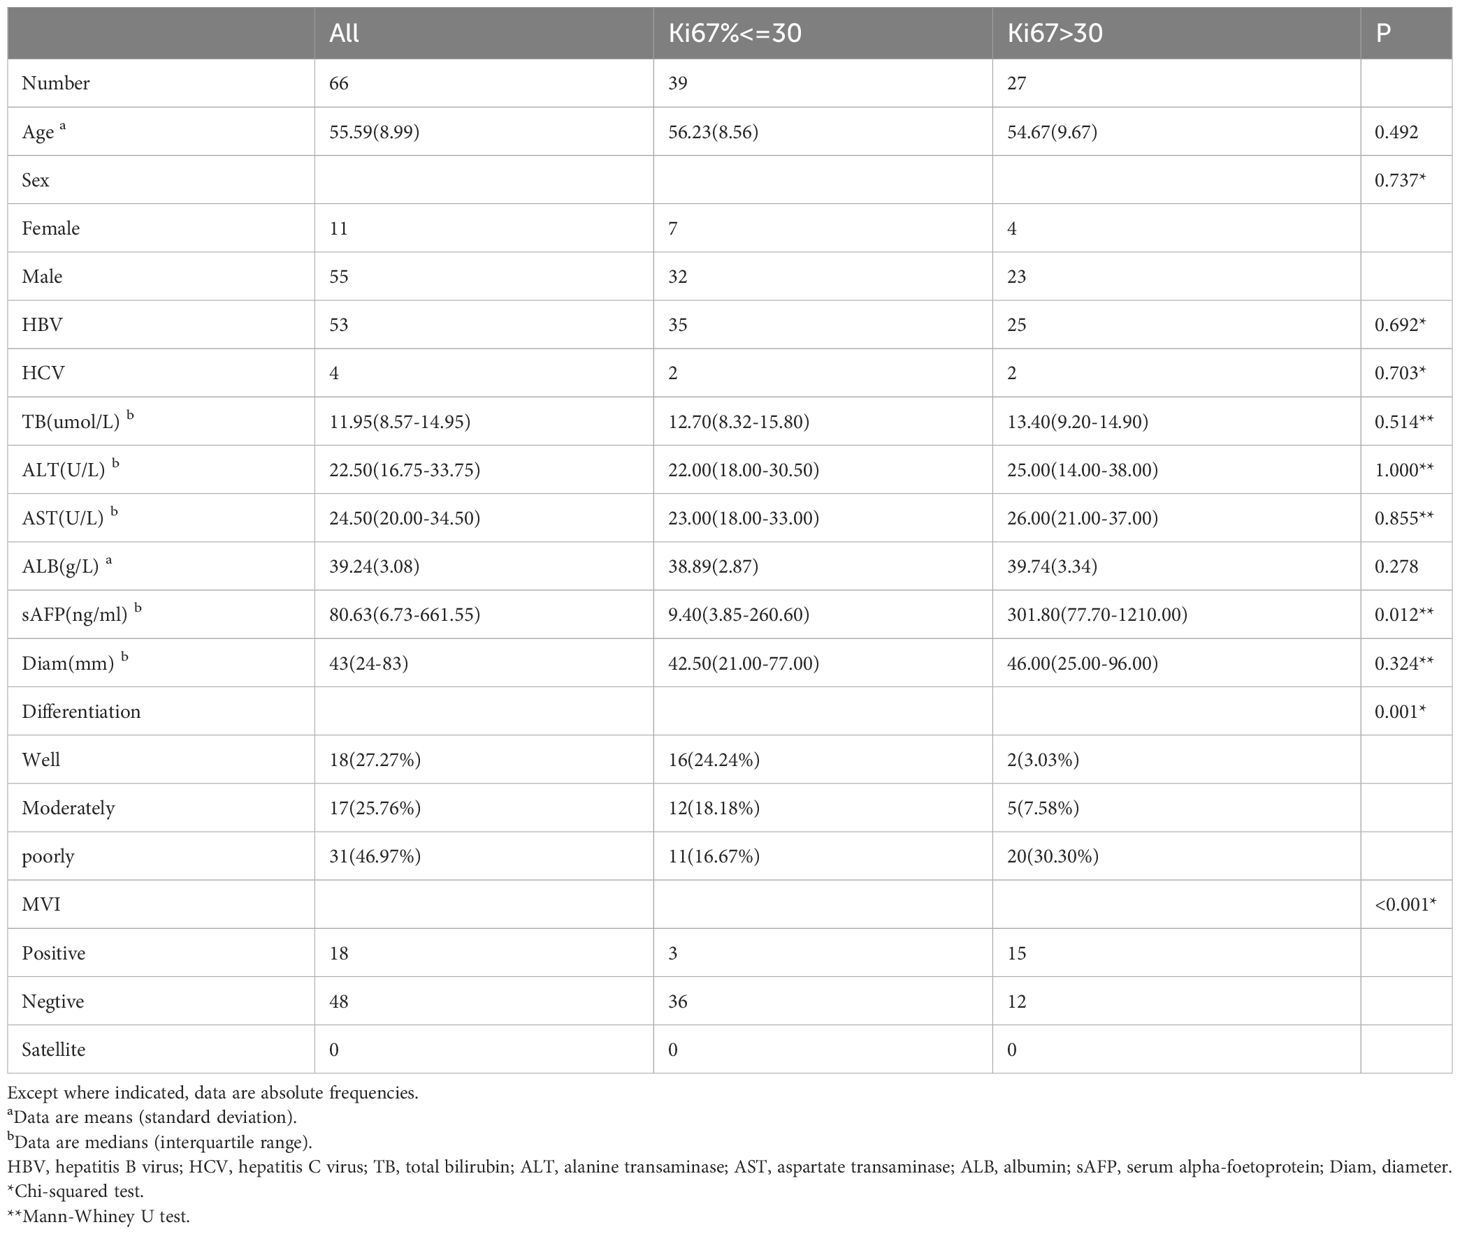
Table 1 Characteristics of the study population.
Fat fraction and R2* of tumor and liver
The HCCs have a median intratumor fat fraction (tFF) of 5.24% (IQR 1.88% - 8.52%) and was higher than the median fat fraction of peritumor liver (5.24% vs 3.51%, P=0.012). Of the 66 HCCs, 42 (63.64%) had an tFF of less than 5%, 13 (19.69%) had an intratumor fat fraction of more than 5% and less than 10%, and 11 (16.67%) had an intratumor fat fraction of more than 15%. The fat fraction of peritumor was not significantly different from fat fraction of liver (3.51% vs 3.54%, P =0.739). Of the 66 patients, 9 (13.64%) had fatty liver with a liver fat fraction of more than 5% (15). The fat fraction of tumor had no significant difference between the fatty liver patients and nonfatty liver patients (4.32% vs5.38%, P=0.502).
The median R2* of HCC was 38.55s-1 (IQR 26.40-47.81 s-1) while that of the peritumor liver was 51.40 s-1(IQR 42.75-69.82 s-1). The R2* of the tumor was significantly lower than that of the peritumor liver (38.55s-1 vs 51.40s-1, P<0.001).
Relationship of fat fraction and R2* with the Ki67
The spearman’s correlation analysis indicated that the tFF was negatively correlated with the expression of Ki67 (r=-0.306, P=0.012). The correlation analysis showed that the fat fraction of the liver, R2* of the tumor and R2* of the liver were not significantly correlated with the Ki67 of the tumor (P>0.05), as shown in Table 2.
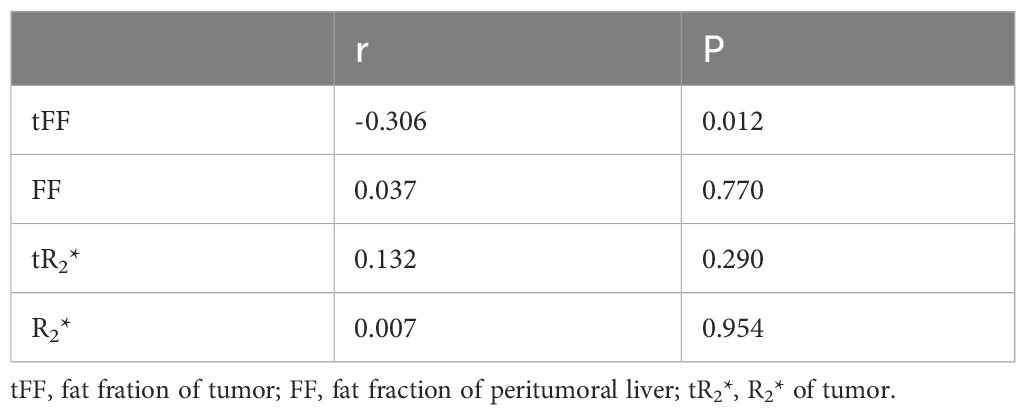
Table 2 Spearman’s correlation analysis of MRI and Ki67.
The median Ki67 of the 66 HCCs was 27.5% (IQR 10.0%-50.0%), with 39 HCCs had less than 30.0%. The tFF was higher in the Ki67<=30% group than the Ki67>30% group (4.90% vs 2.10%, P=0.001), and the R2* of the liver was higher in the Ki67<=30% group than the Ki67>30% group (56.90 s-1 vs 49.60 s-1, P=0.003), as shown in Table 3 and Figure 3. The ROC analysis demonstrated that the tFF could distinguish the Ki67<=30% group with an AUC was 0.747(95%CI 0.628-0.867) and a cut-off of 3.39% (sensitivity 77.8%, specificity 69.2%), as shown in Figure 4. The R2* could not be used to distinguish the Ki67<=30% group (AUC 0.553, 95%CI 0.409-0.697, P=0.469).
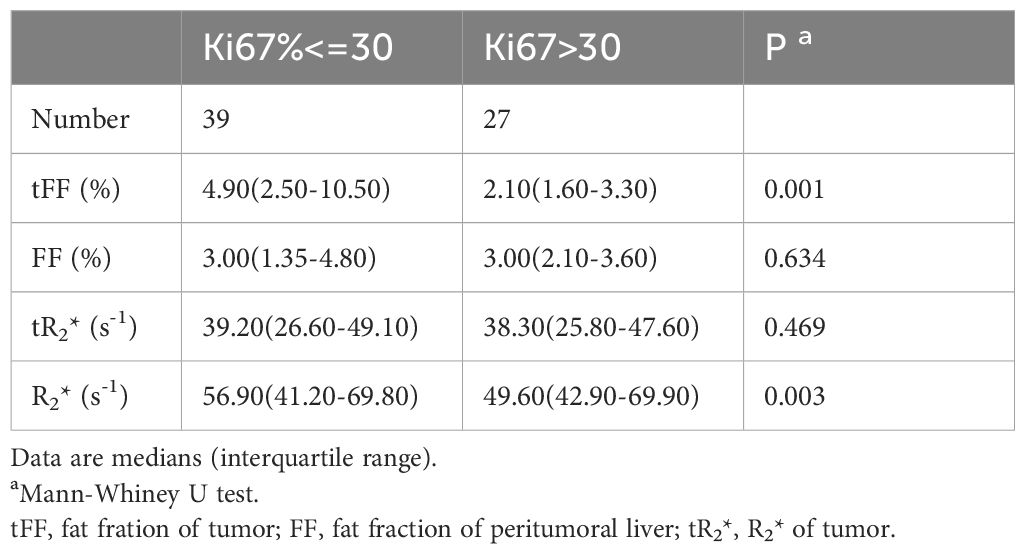
Table 3 Comparison of MRI between the low Ki67 and high Ki67 groups.
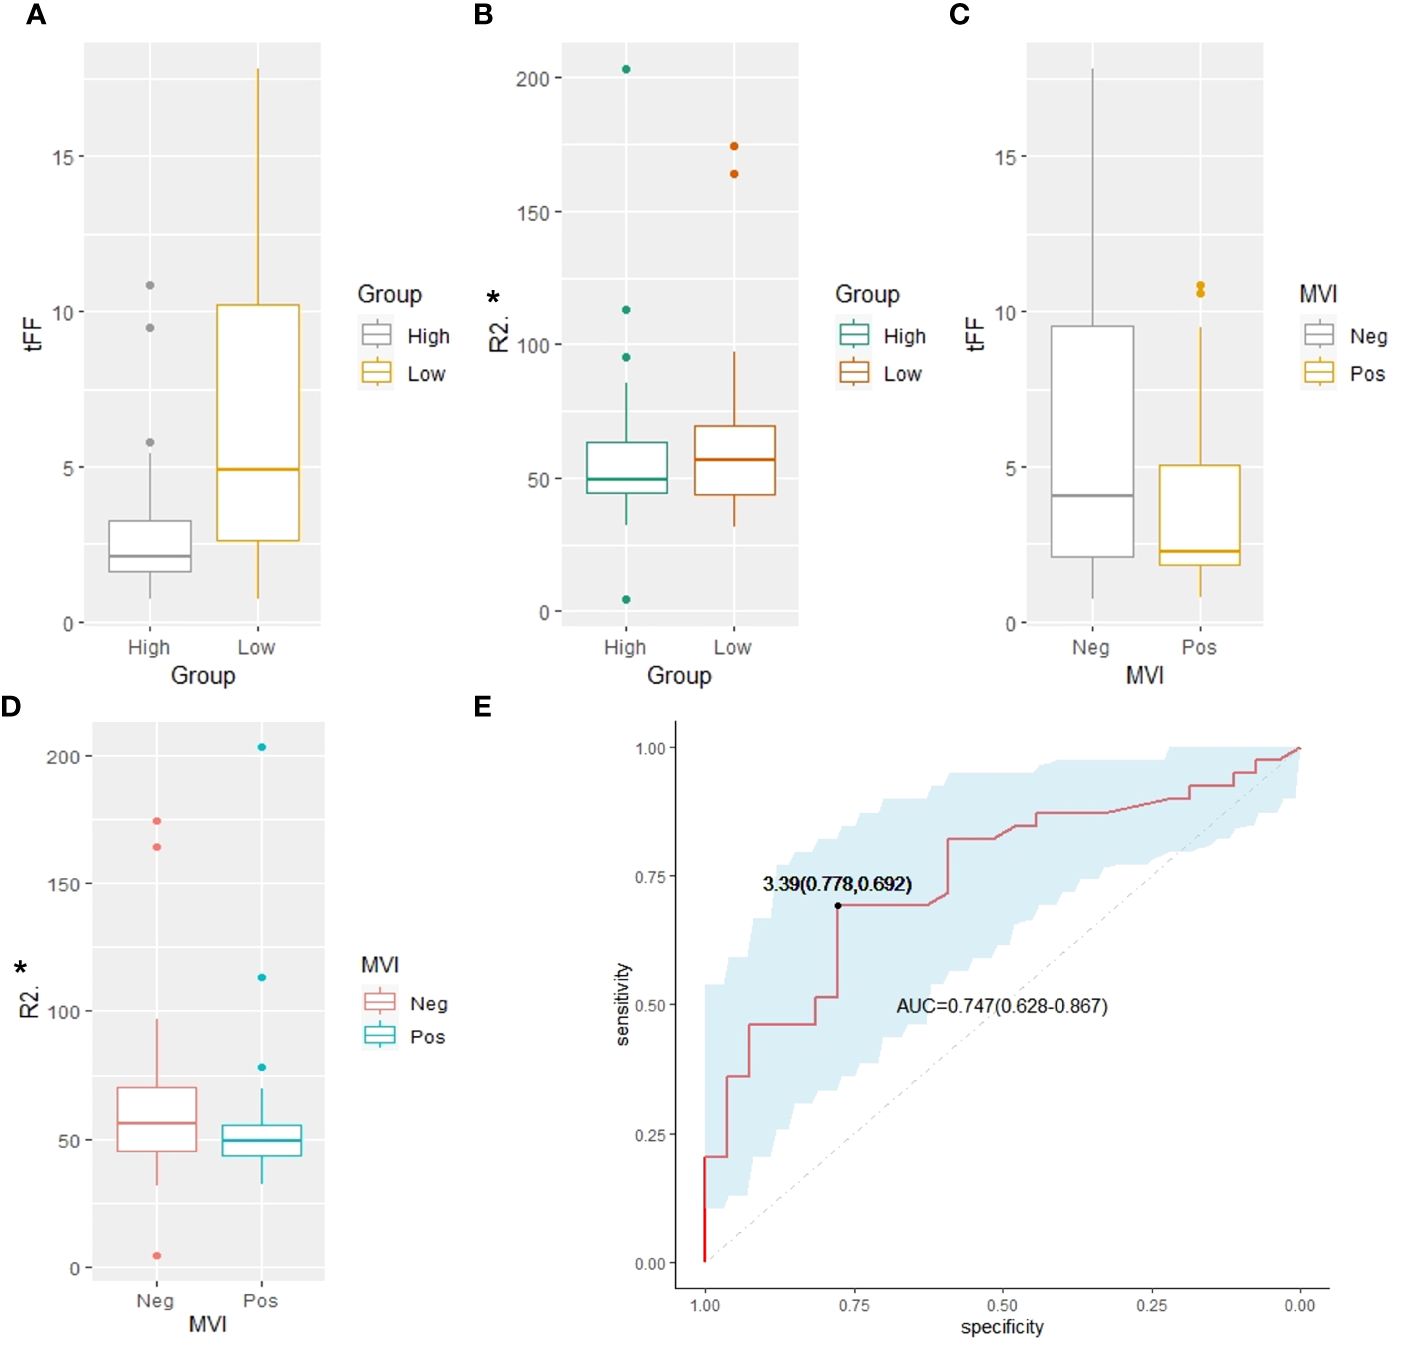
Figure 3 Comparison analysis. (A) The tFF of the high Ki67 was lower than that of the low Ki67 group (2.10% vs 4.90%, P=0.001). (B) The R2* of the high Ki67 was lower than that of the low Ki67 group (49.60 s-1 vs56.90 s-1, P=0.003). (C) The tFF in MVI negative group had no significant difference from that of the MVI positive group (4.05% vs 2.25%, P=0.087). (D) The R2* of the tumor in MVI negative group had no significant difference from that of the MVI positive group (36.60s-1 vs 39.05s-1, P=0.194). (E) The ROC analysis demonstrated that the tFF of the tumor can distinguish the Ki67<=30% group with an AUC of 0.747(95%CI 0.628-0.867) and cut-off of 3.39% (sensitivity 77.8%, specificity 69.2%). tFF, the fat fraction of the tumor; MVI, microvascular invasion; ROC, receiver operating characteristic; AUC, area under the curve.
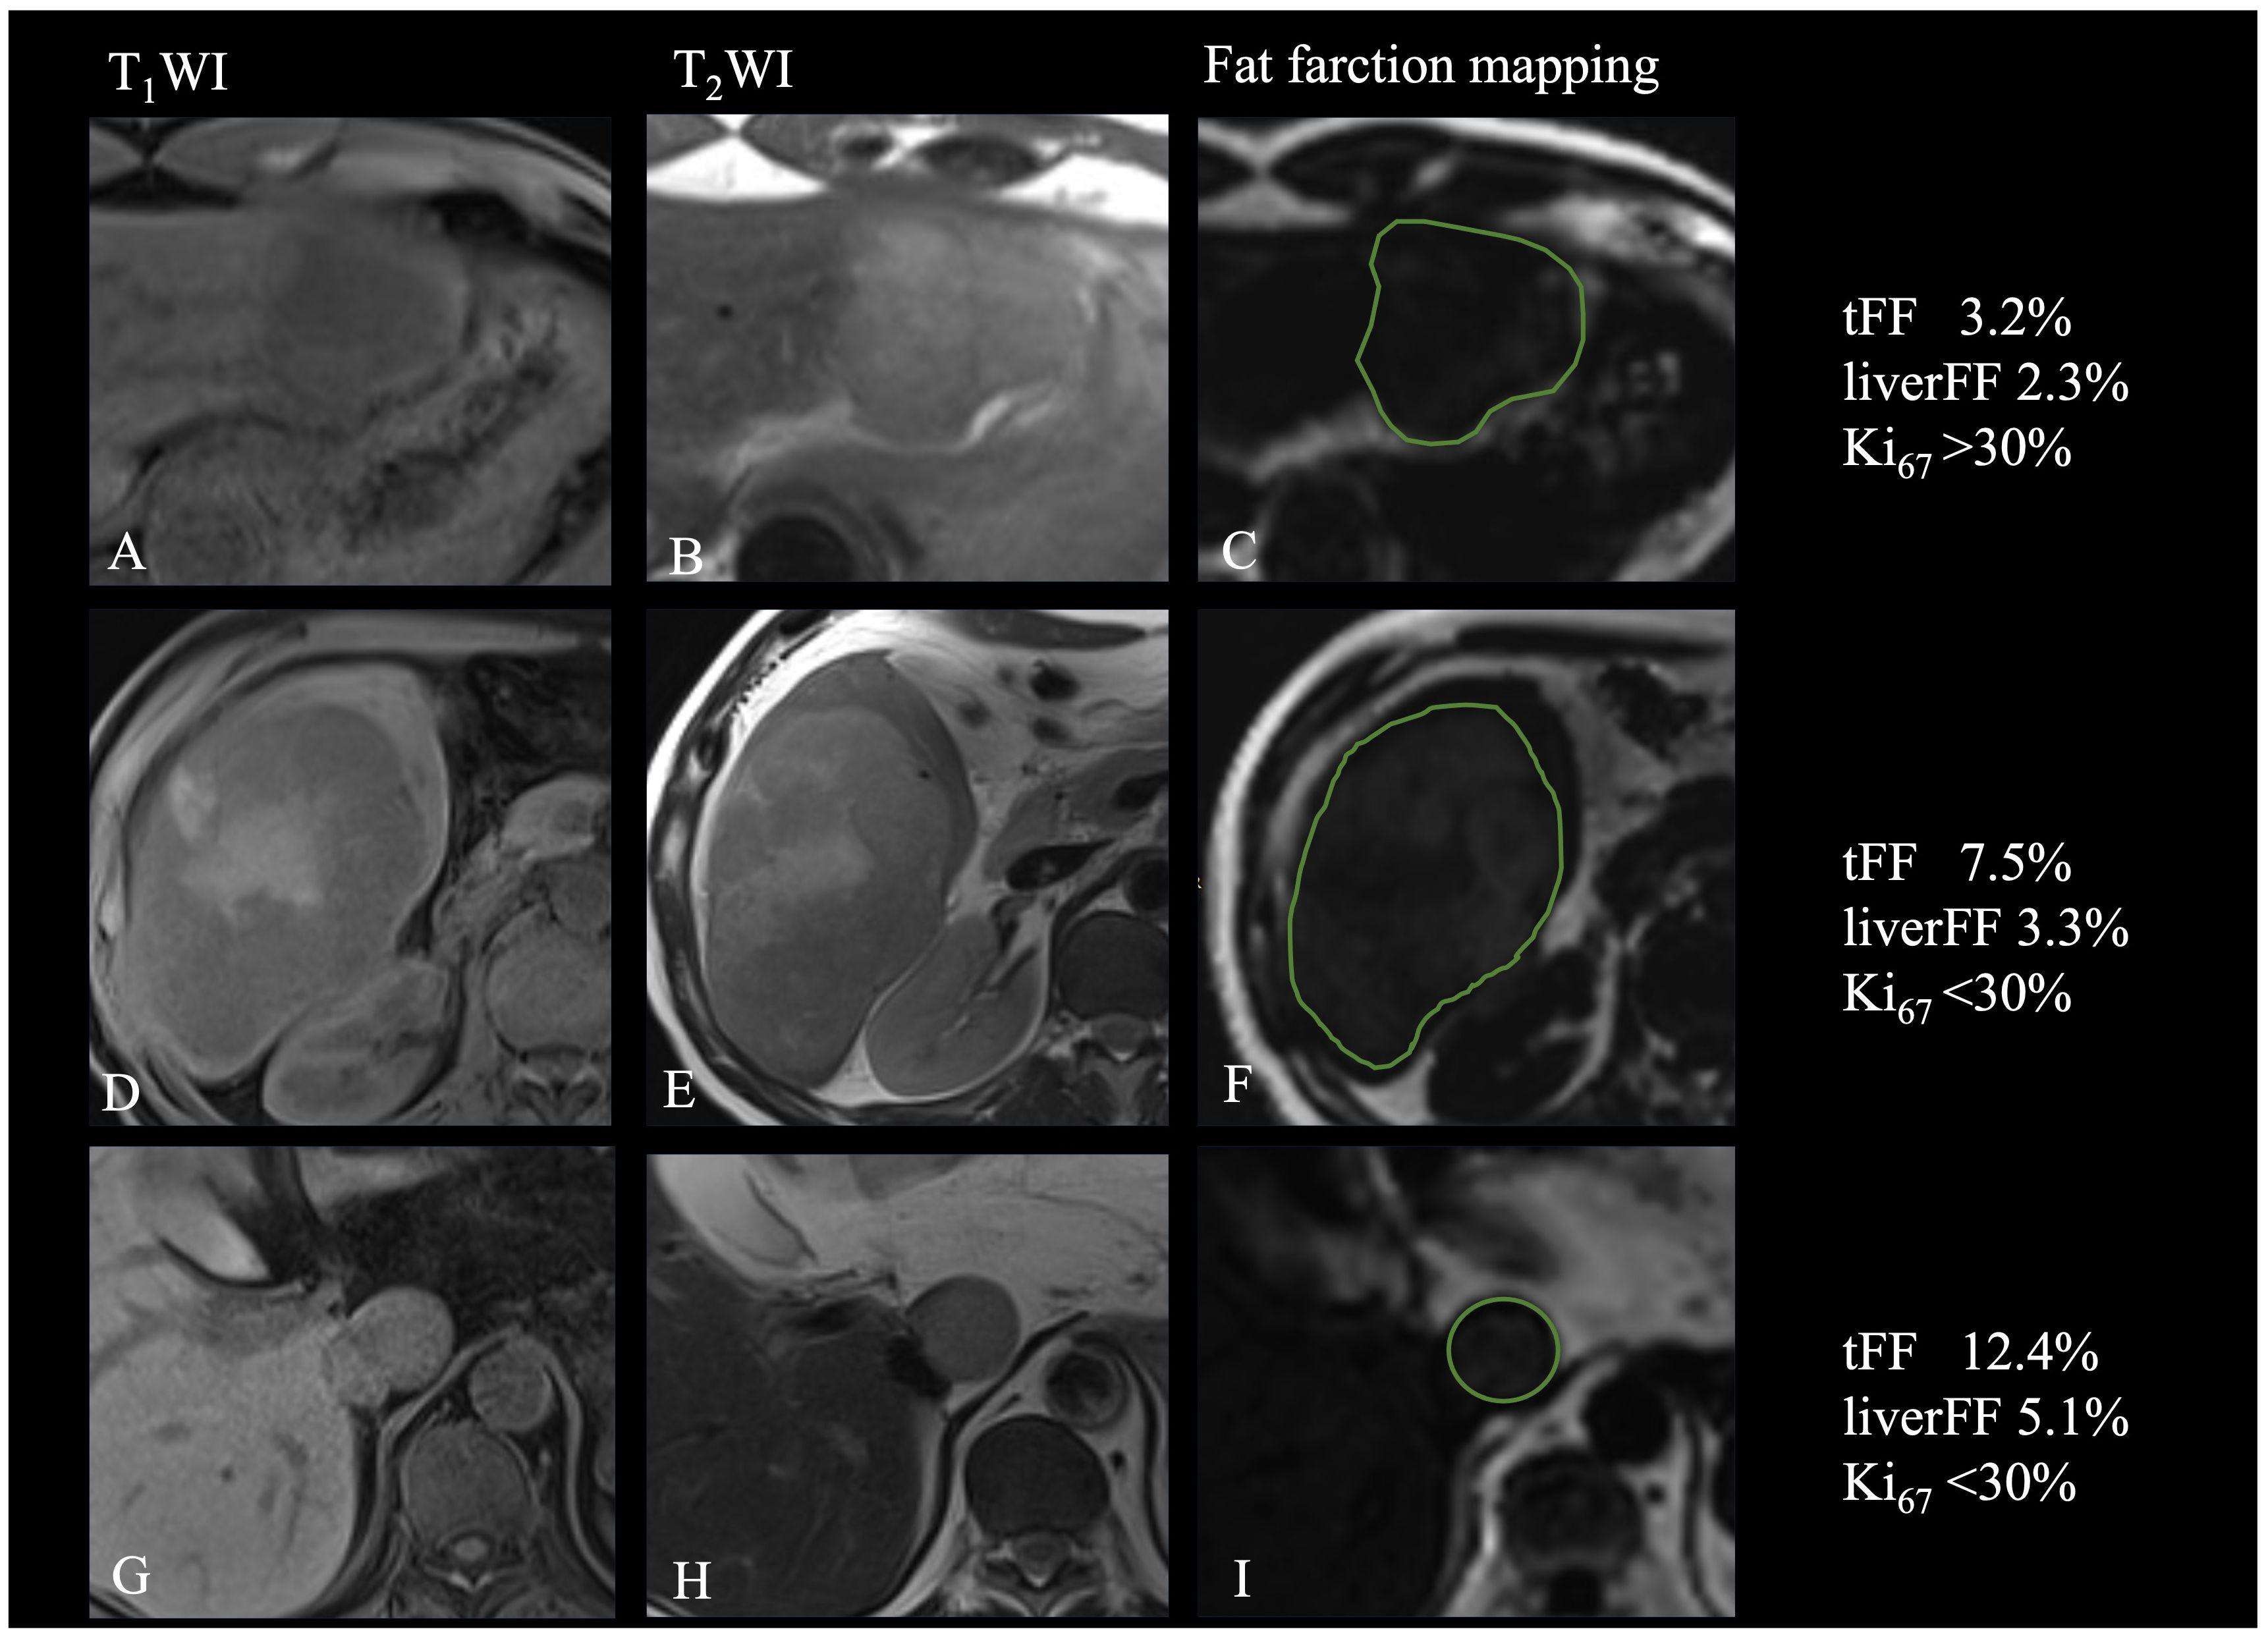
Figure 4 Relationship of fat fraction and R2* with the Ki67. (A-C) Patient with focal fat and high expression of Ki67. (D-F). Patient with diffuse fat in mass and low expression of Ki67. (G-I) Patient with diffuse fat in small lesion and low expression of Ki67.
Relationship of fat fraction and R2* with the MVI
Of the 66 patients, 48 (72.73%) had no MVI in the peritumoral liver, while 18 (27.27%) had MVI in at least one vessel in the peritumoral region. The fat fraction and R2* of the tumor in MVI negative group were not significantly different from those in the MVI positive group (4.05% vs 2.25%, P=0.087; 36.60s-1 vs 39.05s-1, P=0.194). The fat fraction and R2* of the liver in the MVI negative group were also not significantly different from those in the MVI positive group (3.00% vs 2.90%, P=0.784; 55.80s-1 vs 49.15s-1, P=0.227), as shown in Table 4. The frequency of MVI was not significantly different between the high tFF HCCs and the low tFF HCCs (25.00% vs 30.00%, P=0.650).
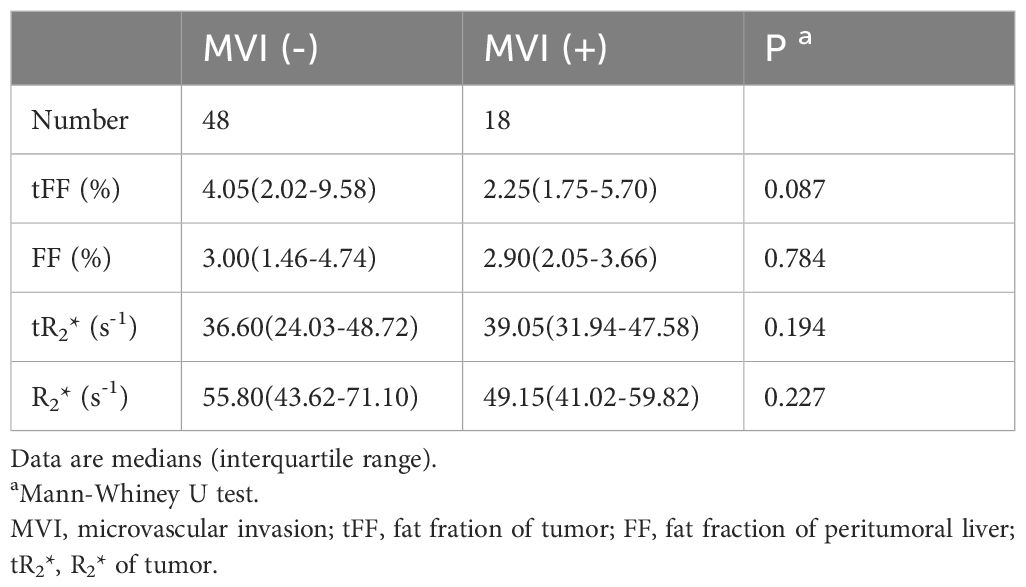
Table 4 Comparison of MRI between the negative and positive MVI groups.
Discussion
This study estimated the relationship between the proliferation marker Ki67 of HCC and the fat fraction of the tumor, as determined by the MRI quantitative multi-echo Dixon. Furthermore, the ROC analysis highlighted the fat fraction of the tumor as a good discriminator of HCCs with Ki67<=30%. Thus, we have successfully validated the fat fraction as an accurate, noninvasive, and in vivo biomarker of proliferation for HCCs.
The tumor proliferation of HCC can be non-invasively evaluated with MRI. Chen at al. reported a strong relationship of Ki67 with Gd-EOB-DTPA-enhanced MRI in HCC (16). And Jing at al. indicated that the expression of Ki67 was associated with apparent diffusion coefficients (17). Gd-EOB-DTPA-enhanced MRI and apparent diffusion coefficient is an advanced MRI technique, which needs special contrast media and advanced post-operative software. And these two techniques were used to evaluate the tumor proliferation from the perspective of uptake of specific contrast agents and tissue microstructure. Furthermore, Hu et al. estimated the value of viscoelasticity measured by MRI elastography for prediction of Ki67 expression (18). Our study revealed similar result that the MRI quantitative multi-echo Dixon was a good discriminator of Ki67, which is a completely different MRI technique that mainly reflects fatty changes within the tumor. To our knowledge, it was the first to evaluate the proliferation of HCC using the fat quantification of MRI.
The intra tumoral fat is an important feature of HCC (19) and represents focal hypoxia due to the transition of blood supply from portal vein to hepatic artery with insufficient neovascularization. Intra tumoral fat was found in both early stage and progressed HCCs. Our study demonstrated that 13 (19.69%) patients had an intratumor fat fraction of more than 5% and less than 10%, and 11 (16.67%) had an intratumor fat fraction of more than 15%, with most patients having chronic HBV and HCV infection, which suggested that intra tumoral fat was not only found in patients with fatty liver. Furthermore, our study reveals a negative correlation between fat fraction and Ki67, suggesting that intra-tumoral fat serves as a marker of tumor proliferation. The most possible hypothesis may be that the intra tumoral fat was caused by dysregulated lipogenesis that was due to clonal proliferation in proliferative HCCs (20). And the intracellular lipid droplets broke down if energy was deficient in proliferative tumors (21). Hence, the intra tumoral fat can also be found in proliferative HCCs and the fat fraction may be less than that in less proliferative HCCs. Previous studies have also suggested that poorly differentiated HCC is prone to have focal steatosis (5), which may explain the relative low-fat fraction observed in high Ki67 group in our quantitative measurement study. This study provides a quantitative method for measuring fat fraction and demonstrates its potential as an imaging marker of tumor proliferation.
Some studies have reported that increased fat content may correlated with improved prognosis (14, 22). The mild accumulation of fat may reflect changes in the microenvironment of hepatocellular carcinoma tumors that reduce tumor aggressiveness. Tani et al. also demonstrated that the peritumoral fat content, as identified by MRI, correlates with prognosis of breast cancer (23). This study demonstrates the potential of fat fraction as an imaging marker of tumor proliferation, which is a prognostic factor in HCC. Consequently, the fat content in hepatocellular carcinoma may affect the response to treatment, such as resection, chemotherapy, or radiation therapy (22). In summary, fat content is associated with outcomes in patients with HCC and has important clinical implications. Through further research and validation, we can better use this indicator of fat fraction based on MRI to guide the treatment and management of HCC patients, and it may also have application prospects in other types of cancer.
Additionally, our study finds that the fat fraction of the tumor does not significantly differ between patients with fatty liver and non-fatty liver, despite a previous study indicating a higher median fat fraction in HCCs with liver steatosis (3). It’s worth noting that steatotic and steatohepatitic HCCs, which often exhibit diffuse fat in the mass (24), are closely associated with underlying fatty liver disease and metabolic syndrome (25). Most of the patients with fatty liver or without fatty liver in this study were accompanied by chronic HBV or HCV infection. Chronic hepatitis is suggested to have an influence on metabolic changes (26), potentially leading to fatty liver development. Therefore, the observed fatty liver in our study may be attributed to chronic hepatitis rather than non-alcoholic fatty liver disease or metabolic syndrome, explaining the lack of significant differences in tumor fat fraction between the two groups.
Numerous studies have been devoted to the preoperative prediction of MVI and the results are still uncertain. In our present study, the fat fraction determined by MRI quantitative multi-echo Dixon did not exhibit significant difference between the MVI-negative and MVI-positive groups. Some researchers have indicated that the intra tumoral fat may suggest a lower risk of MVI (7), which was partially explained by the relationship of intra tumoral fat and lower histological grades. However, not all studies support this finding (27). Further investigations, such as subclassification analysis of MVI number and location (28), or advanced analyses of intra-tumoral fat using texture analysis or radiomics (29), may enhance our understanding of this relationship.
This study has some limitations. First, it was a retrospective, single-center research with a small number of HCC patients accompanied with HBV, HCV infection or pathology proved hepatitis. However, the present study was the first to evaluate the proliferation of HCC using the fat quantification of MRI. Therefore, it will be necessary to confirm the results through prospective, multicenter study with a larger number of patients. Second, the Ki-67 index has traditionally served as a biomarker indicating tumor proliferation, while recent studies has classified HCC proliferation through diverse molecular analyses and genomic profiling. Third, we did not assess the influence of ROI sampling strategies on measurement and reproducibility of quantitative multi-echo Dixon. Previous studies have indicated that the reproducibility and repeatability of measurements were improved as much area of the ROI (30). Therefore, the ROI of the tumor was delineated in the maximum plane of the intatumoral fat or tumor in this study. And the fat fraction based on MRI has been extensively explored in the literature and is considered a stable and non-invasive tool compared to pathology. Forth, the fat fraction in the maximum plane of the intatumoral fat or tumor was used to analyze, and the distribution of intra tumoral fat was not evaluated. As the distribution of fat is another important feature for the diagnosis of steatotic or steatohepatitic HCCs, we hypothesize that the quantification and distribution of fat could offer greater clinical insight for prognosis and treatment. Thus, we intent to investigate further how fat quantification and radiomic or machine learning features will influence patient prognosis and treatment outcomes in subsequent studies. Lastly, this study did not investigate how fat quantification affects patient outcomes due to the limited follow-up time. Previous studies have shown that fat sparing in solid mass was potential marker to evaluate the survival with favorable performance and discriminator of complete response under TACE treatment (14). Therefore, a further validation study is needed to confirm the prognostic value of fat fraction.
Conclusion
In conclusion, fat fraction quantification based on quantitative multi-echo Dixon can effectively differentiate low-proliferation HCCs, although it may not be suitable for diagnosing MVI. Fat fraction quantification holds promise as a potential prognostic predictor of treatment option.
Data availability statement
The original contributions presented in the study are included in the article/supplementary material. Further inquiries can be directed to the corresponding author.
Ethics statement
The studies involving humans were approved by Ethics Committee of Tongji Hospital, Tongji Medical College, Huazhong University of Science and Technology. The studies were conducted in accordance with the local legislation and institutional requirements. The ethics committee/institutional review board waived the requirement of written informed consent for participation from the participants or the participants’ legal guardians/next of kin because This was a retrospective study and the patient information was encrypted during the study.
Author contributions
MH: Conceptualization, Data curation, Formal analysis, Funding acquisition, Investigation, Methodology, Project administration, Resources, Software, Supervision, Validation, Visualization, Writing – original draft, Writing – review & editing. FZ: Investigation, Data curation, Formal analysis, Methodology, Project administration, Software, Validation, Writing – original draft. ZL: Data curation, Formal analysis, Investigation, Methodology, Project administration, Software, Validation, Conceptualization, Resources, Supervision, Writing – review & editing. YL: Conceptualization, Data curation, Formal analysis, Investigation, Methodology, Project administration, Writing – review & editing, Funding acquisition. JL: Conceptualization, Data curation, Formal analysis, Funding acquisition, Investigation, Methodology, Project administration, Writing – review & editing, Resources. ZW: Conceptualization, Data curation, Formal analysis, Investigation, Methodology, Project administration, Writing – original draft. LM: Investigation, Methodology, Project administration, Resources, Validation, Writing – review & editing. GC: Investigation, Methodology, Project administration, Writing – review & editing, Conceptualization, Data curation, Formal analysis, Software. XH: Conceptualization, Investigation, Writing – review & editing, Resources, Supervision.
Funding
The author(s) declare that financial support was received for the research, authorship, and/or publication of this article. This work was supported by National Natural Science Foundation of China (82202127, 82001786) and Foundation of Tongji Hospital (2022B14).
Conflict of interest
The authors declare that the research was conducted in the absence of any commercial or financial relationships that could be construed as a potential conflict of interest.
Publisher’s note
All claims expressed in this article are solely those of the authors and do not necessarily represent those of their affiliated organizations, or those of the publisher, the editors and the reviewers. Any product that may be evaluated in this article, or claim that may be made by its manufacturer, is not guaranteed or endorsed by the publisher.
Abbreviations
HCC, Hepatocellular carcinoma; MVI, Microvascular invasion; MRI, Magnetic Resonance Imaging; HBV, Hepatitis B Virus; HCV, Hepatitis C Virus; tFF, Fat fraction of tumor; TR, Repetition Time; TE, Echo Time; FOV, Field of View; ROI, Region of Interest; AUC, Area Under the Curve; ROC, Receiver Operating Characteristic
References
1. Lee S, Kang TW, Song KD, Lee MW, Rhim H, Lim HK, et al. Effect of microvascular invasion risk on early recurrence of hepatocellular carcinoma after surgery and radiofrequency ablation. Ann Surg. (2021) 273:564–71. doi: 10.1097/SLA.0000000000003268
2. Li H-H, Qi LN, Ma L, Chen ZS, Xiang BD, Li LQ. Effect of KI-67 positive cellular index on prognosis after hepatectomy in Barcelona Clinic Liver Cancer stage A and B hepatocellular carcinoma with microvascular invasion. OncoTargets Ther. (2018) 11:4747–54. doi: 10.2147/OTT
3. Kupczyk PA, Kurt D, Endler C, Luetkens JA, Kukuk GM, Fronhoffs F, et al. MRI proton density fat fraction for estimation of tumor grade in steatotic hepatocellular carcinoma. Eur Radiol. (2023) 33(12):8974–85. doi: 10.1007/s00330-023-09864-x
4. Kutami R, Nakashima Y, Nakashima O, Shiota K, Kojiro M. Pathomorphologic study on the mechanism of fatty change in small hepatocellular carcinoma of humans. J Hepatol. (2000) 33:282–9. doi: 10.1016/S0168-8278(00)80369-4
5. Asayama Y, Nishie A, Ishigami K, Ushijima Y, Takayama Y, Okamoto D, et al. Fatty change in moderately and poorly differentiated hepatocellular carcinoma on MRI: a possible mechanism related to decreased arterial flow. Clin Radiol. (2016) 71:1277–83. doi: 10.1016/j.crad.2016.04.020
6. Li Y, Liang X, Che G, Chen Y, Luo L, Liu K, et al. Molecular classification of genes associated with hypoxic lipid metabolism in pancreatic cancer. Biomolecules. (2022) 12(10):1533. doi: 10.3390/biom12101533
7. Min JH, Kim YK, Lim S, Jeong WK, Choi D, Lee WJ. Prediction of microvascular invasion of hepatocellular carcinomas with gadoxetic acid-enhanced MR imaging: Impact of intra-tumoral fat detected on chemical-shift images. Eur J Radiol. (2015) 84:1036–43. doi: 10.1016/j.ejrad.2015.03.002
8. An C, Kim M-J. Imaging features related with prognosis of hepatocellular carcinoma. Abdominal Radiol (New York). (2019) 44:509–16. doi: 10.1007/s00261-018-1758-y
9. Yang Y, Xu K, Chen X, Ding J, Shi J, Li J. The accuracy and clinical relevance of the multi-echo dixon technique for evaluating changes to hepatic steatosis in patients with non-alcoholic fatty liver disease treated with formulated food. Magnetic Resonance In Med Sciences: MRMS. (2023) 22:263–71. doi: 10.2463/mrms.mp.2021-0168
10. Hu F, Yang R, Huang Z, Wang M, Yuan F, Xia C, et al. 3D Multi-Echo Dixon technique for simultaneous assessment of liver steatosis and iron overload in patients with chronic liver diseases: a feasibility study. Quantitative Imaging In Med Surg. (2019) 9:1014–24. doi: 10.21037/qims
11. Zhan C, Olsen S, Zhang HC, Kannengiesser S, Chandarana H, Shanbhogue KP. Detection of hepatic steatosis and iron content at 3 Tesla: comparison of two-point Dixon, quantitative multi-echo Dixon, and MR spectroscopy. Abdominal Radiol (New York). (2019) 44:3040–8. doi: 10.1007/s00261-019-02118-9
12. Rajlawot K, Jiang T, Zhou J, Lin C, Kuang S, Chen J, et al. Accuracies of chemical shift in/opposed phase and chemical shift encoded magnetic resonance imaging to detect intratumoral fat in hepatocellular carcinoma. J Magnetic Resonance Imaging: JMRI. (2021) 53:1791–802. doi: 10.1002/jmri.27539
13. Nougaret S, Monsonis B, Molinari N, Riviere B, Piron L, Kassam Z, et al. Quantification of liver fat content in liver and primary liver lesions using triple-echo-gradient-echo MRI. Eur Radiol. (2020) 30:4752–61. doi: 10.1007/s00330-020-06757-1
14. Song W, Chen Q, Guo D, Jiang C. Preoperative estimation of the survival of patients with unresectable hepatocellular carcinoma achieving complete response after conventional transcatheter arterial chemoembolization: assessments of clinical and LI-RADS MR features. La Radiologia Med. (2022) 127:939–49. doi: 10.1007/s11547-022-01517-1
15. Starekova J, Hernando D, Pickhardt PJ, Reeder SB. Quantification of liver fat content with CT and MRI: state of the art. Radiology. (2021) 301:250–62. doi: 10.1148/radiol.2021204288
16. Chen Y, Qin X, Long L, Zhang L, Huang Z, Jiang Z, et al. Diagnostic value of gd-EOB-DTPA-enhanced MRI for the expression of ki67 and microvascular density in hepatocellular carcinoma. J Magnetic Resonance Imaging: JMRI. (2020) 51:1755–63. doi: 10.1002/jmri.26974
17. Jing M, Cao Y, Zhang P, Zhang B, Lin X, Deng L, et al. The benefit of apparent diffusion coefficient in evaluating the invasiveness of hepatocellular carcinoma. Front In Oncol. (2021) 11:719480. doi: 10.3389/fonc.2021.719480
18. Hu X, Zhou J, Li Y, Wang Y, Guo J, Sack I, et al. Added value of viscoelasticity for MRI-based prediction of ki-67 expression of hepatocellular carcinoma using a deep learning combined radiomics (DLCR) model. Cancers. (2022) 14(11):2575. doi: 10.3390/cancers14112575
19. Mulé S, Serhal A, Pregliasco AG, Nguyen J, Vendrami CL, Reizine E, et al. MRI features associated with HCC histologic subtypes: a western American and European bicenter study. Eur Radiol. (2023) 33:1342–52. doi: 10.1007/s00330-022-09085-8
20. Zhu Y, Weng S, Li Y, Yan C, Ye R, Wen L, et al. A radiomics nomogram based on contrast-enhanced MRI for preoperative prediction of macrotrabecular-massive hepatocellular carcinoma. Abdominal Radiol (New York). (2021) 46:3139–48. doi: 10.1007/s00261-021-02989-x
21. Paul B, Lewinska M, Andersen JB. Lipid alterations in chronic liver disease and liver cancer. JHEP Reports: Innovation In Hepatol. (2022) 4:100479. doi: 10.1016/j.jhepr.2022.100479
22. Hermida M, Preel A, Assenat E, Piron L, Cassinotto C, Ursic-Bedoya J, et al. Small steatotic HCC: A radiological variant associated with improved outcome after ablation. Hepatol Commun. (2021) 5:689–700. doi: 10.1002/hep4.1661
23. Tani NH, Koreeda Y, Nawata A, Fujisaki A, Hayashida Y, Shimajiri S, et al. Peritumoral fat content identified using iterative decomposition of water and fat with echo asymmetry and least-squares estimation (IDEAL) correlates with breast cancer prognosis. Magnetic Resonance In Med Sci. (2024). doi: 10.2463/mrms.mp.2023-0127
24. Chen K, Xu Y, Dong Y, Han H, Mao F, Wang H, et al. Contrast-enhanced imaging features and clinicopathological investigation of steatohepatitic hepatocellular carcinoma. Diagnostics (Basel Switzerland). (2023) 13(7):1337. doi: 10.3390/diagnostics13071337
25. Park JH, Park YN, Kim MJ, Park MS, Choi JY, Chung YE, et al. Steatotic hepatocellular carcinoma: Association of MRI findings to underlying liver disease and clinicopathological characteristics. Liver Int. (2023) 43:1332–44. doi: 10.1111/liv.15589
26. Tourkochristou E, Assimakopoulos SF, Thomopoulos K, Marangos M, Triantos C. NAFLD and HBV interplay - related mechanisms underlying liver disease progression. Front In Immunol. (2022) 13:965548. doi: 10.3389/fimmu.2022.965548
27. Chen J, Zhou J, Kuang S, Zhang Y, Xie S, He B, et al. Liver imaging reporting and data system category 5: MRI predictors of microvascular invasion and recurrence after hepatectomy for hepatocellular carcinoma. AJR. Am J Roentgenol. (2019) 213:821–30. doi: 10.2214/AJR.19.21168
28. Kang I, Jang M, Lee JG, Han DH, Joo DJ, Kim KS, et al. Subclassification of microscopic vascular invasion in hepatocellular carcinoma. Ann Surg. (2021) 274:e1170–8. doi: 10.1097/SLA.0000000000003781
29. Chong H-H, Yang L, Sheng RF, Yu YL, Wu DJ, Rao SX, et al. Multi-scale and multi-parametric radiomics of gadoxetate disodium-enhanced MRI predicts microvascular invasion and outcome in patients with solitary hepatocellular carcinoma ≤ 5 cm. Eur Radiol. (2021) 31:4824–38. doi: 10.1007/s00330-020-07601-2
Keywords: hepatocellular carcinoma, fat fraction, proliferation, MVI, MRI
Citation: Huang M, Zhang F, Li Z, Luo Y, Li J, Wang Z, Ma L, Chen G and Hu X (2024) Fat fraction quantification with MRI estimates tumor proliferation of hepatocellular carcinoma. Front. Oncol. 14:1367907. doi: 10.3389/fonc.2024.1367907
Received: 09 January 2024; Accepted: 26 March 2024;
Published: 11 April 2024.
Edited by:
Liliana Chemello, University of Padua, ItalyReviewed by:
Hao Chi, Southwest Medical University, ChinaYandong Wang, Tianjin Third Central Hospital, China
Copyright © 2024 Huang, Zhang, Li, Luo, Li, Wang, Ma, Chen and Hu. This is an open-access article distributed under the terms of the Creative Commons Attribution License (CC BY). The use, distribution or reproduction in other forums is permitted, provided the original author(s) and the copyright owner(s) are credited and that the original publication in this journal is cited, in accordance with accepted academic practice. No use, distribution or reproduction is permitted which does not comply with these terms.
*Correspondence: Xuemei Hu, mayjuly3720@163.com; Gen Chen, genchen@hust.edu.cn