 Ying Hu
 Kai Zhang
- 1Department of Radiology, West China Hospital, Sichuan University, Chengdu, China
- 2West China Biomedical Big Data Center, West China Hospital, Sichuan University, Chengdu, China
Purpose: To investigate the predictive value of multi-parameters derived from advanced MR imaging for Ki-67 labeling index (LI) in glioma patients.
Materials and Methods: One hundred and nine patients with histologically confirmed gliomas were evaluated retrospectively. These patients underwent advanced MR imaging, including dynamic susceptibility-weighted contrast enhanced MR imaging (DSC), MR spectroscopy imaging (MRS), diffusion-weighted imaging (DWI) and diffusion-tensor imaging (DTI), before treatment. Twenty-one parameters were extracted, including the maximum, minimum and mean values of relative cerebral blood flow (rCBF), relative cerebral blood volume (rCBV), relative mean transit time (rMTT), relative apparent diffusion coefficient (rADC), relative fractional anisotropy (rFA) and relative mean diffusivity (rMD) respectively, and ration of choline (Cho)/creatine (Cr), Cho/N-acetylaspartate (NAA) and NAA/Cr. Stepwise multivariate regression was performed to build multivariate models to predict Ki-67 LI. Pearson correlation analysis was used to investigate the correlation between imaging parameters and the grade of glioma. One-way analysis of variance (ANOVA) was used to explore the differences of the imaging parameters among the gliomas of grade II, III, and IV.
Results: The multivariate regression showed that the model of five parameters, including rCBVmax (RC=0.282), rCBFmax (RC=0.151), rADCmin (RC= -0.14), rFAmax (RC=0.325) and Cho/Cr ratio (RC=0.157) predicted the Ki-67 LI with a root mean square (RMS) error of 0. 0679 (R2 = 0.8025).The regression check of this model showed that there were no multicollinearity problem (variance inflation factor: rCBVmax, 3.22; rCBFmax, 3.14; rADCmin, 1.96; rFAmax, 2.51; Cho/Cr ratio, 1.64), and the functional form of this model was appropriate (F test: p=0.682). The results of Pearson correlation analysis showed that the rCBVmax, rCBFmax, rFAmax, the ratio of Cho/Cr and Cho/NAA were positively correlated with Ki-67 LI and the grade of glioma, while the rADCmin and rMDmin were negatively correlated with Ki-67 LI and the grade of glioma.
Conclusion: Combining multiple parameters derived from DSC, DTI, DWI and MRS can precisely predict the Ki-67 LI in glioma patients.
Introduction
Glioma is the most common neuroepithelial tumor of the cerebral nervous system (1). Ki-67 labeling index (LI) is a nuclear antigen expressed only by proliferating cells (2). Previous studies showed that Ki-67 LI was one of the vital biological behavior biomarkers in glioma and correlated with glioma grading and prognosis (3, 4).Therefore, accurate measurement of the Ki-67 LI is important for grading and synthesizing prognosis information in glioma.
Advanced MR imaging, such as dynamic susceptibility-weighted contrast enhanced imaging (DSC), diffusion-weighted imaging (DWI), diffusion tensor imaging (DTI) and magnetic resonance spectroscopic imaging (MRS), provide important information for evaluating tumors preoperatively. DSC magnetic resonance (MR) imaging is the most commonly used MR perfusion technique in clinical practice and is well established for evaluating relative cerebral blood volume (rCBV) and relative cerebral blood flow (rCBF) in brain tumors (5). Many studies have shown that the rCBV and the rCBF correlate with tumor grade and tumor vascularity (6, 7). Diffusion tensor imaging (DTI) can provide two quantitative parameters, namely mean diffusivity (MD) which is inversely correlated with tumor cellularity and grading in glioma (8) and fractional anisotropy (FA) (9). Recent studies demonstrated that the FA derived from DTI may correlate with tumor cellularity (10). Diffusion-weighted imaging (DWI) can noninvasively provide insight into the microscopic properties of tissues through evaluating Brownian movement of water, and the apparent diffusion coefficient (ADC) value can quantitatively reflect cellularity of the lesions (11, 12). MRS is a noninvasive tool which estimates the concentration of metabolites (13). Previous studies showed that choline (Cho)-containing compounds in tumors were considered to be markers for cell proliferation (14). Shimizu H and colleagues found a direct correlation between Ki-67 LI and Cho, Cho/Cr and Cho/NAA ratio (14).
To date, most of studies explored the correlation between individual parameters and Ki-67 LI. Few studies have combined multiple parameters to predict Ki-67 LI. Although there have been some efforts to combine advanced MR imaging in characterizing gliomas (15, 16). However, most of these studies focused on the grading of gliomas (17, 18) and few focused on cell proliferation or Ki-67 LI.
Therefore, the aim of this work was to investigate whether the multi-parameters derived from DSC, MRS, DWI and DTI technique can predict Ki-67 LI in glioma patients using stepwise multivariate regression.
Materials and methods
Participants
The institutional review board approved this retrospective study and waived the informed consent requirement. We retrospectively reviewed our institution’s database and identified 710 patients who underwent MR imaging for brain tumor evaluation from September 2018 to December 2023. Among these patients, 109 patients were finally enrolled for analysis according to the following inclusion criteria: a) patients were confirmed to have gliomas by pathologic analysis (excluded 357 subjects); b) The samples of pathologic analysis were from surgical resection (excluded 29 subjects); c) the reports of pathologic analysis included Ki-67 LI (excluded 39 subjects); d) The MR imaging were performed before any treatment (excluded 156 subjects); e) Their MR imaging had adequate image acquisition and without motion or susceptibility artifact (excluded 20 subjects). Therefore, 109 patients (61 men and 48 women, aged 4–80 years; mean age, 41.63 years) were finally evaluated.
MR acquisition
MR acquisition were performed with a 3-T MR imaging system (Magnetom Skyra, Siemens Healthineers) with a twenty channel head and neck combined coil. All patients underwent conventional MR imaging and DTI, DWI, MRS and DSC imaging. The precontrast DTI protocol included TR/TE, 6000/93 ms; FOV, 230mm × 230mm; Matrix, 128 × 128; section thickness, 3 mm; voxel size, 1.8×1.8×3mm; number of section, 44; diffusion gradient encoding in 30 directions; b value, 1000 s/mm2.DWI scan parameters were as follows: TR/TE = 8200/102 ms; FOV, 230mm × 230mm; Matrix, 128 × 128; section thickness, 5 mm; b values = 0 and 1000 s/mm2. Multivoxel 2D MR spectroscopy was performed before the administration of contrast agent. The detailed imaging parameters for the MRS study were as follows: TR/TE, 1700/135 ms; flip angle 90°; section thickness, 10mm; FOV, 160mm×160mm; voxel size,10×10×10mm; coding phase, 16 ×16; Averages, 1. DSC MR perfusion imaging was performed by using a gradient-echo echo-planar sequence during the administration of 0.2 mmol/kg of gadoterate meglumine delivered with a power injector at a rate of 2ml/s followed by a 20ml bolus of saline administered at the same rate. Scan parameters were as follows: TR/TE, 1640 ms/30 ms; flip angle 90°; Averages, 1; FOV, 220 mm×220 mm; matrix 128 ×128; section thickness, 5mm; voxel size, 1.7×1.7×5mm; number of section, 21.
Image processing and analysis
All imaging data were transferred from the scanner to a MMWP workstation (Siemens Healthcare, Erlangen, Germany) for postprocessing. For quantitative analysis, CBV maps, CBF maps, MTT maps, ADC maps, FA maps and MD maps were independently evaluated by two experienced neuro-radiologists who were blinded to the clinical and pathological information and any disagreements were resolved by consensus. The multi-parameters were calculated according to the method described in the previous studies (8, 19). The specific steps were as follows: a) Five circular regions of interest (ROIs) of 25mm2 to 30mm2 were carefully placed within the regions with the highest signal strength in the contrast-enhanced T1-weighted images to ensure the ROIs were placed in the solid component of a tumor and the normal tissue, the cystic, large necrotic, or hemorrhagic components of the tumor were avoided. These locations were then copied to the CBV maps, CBF maps, MTT maps, ADC maps, FA maps and MD maps; b) Five circular ROIs of same size from a) were placed in contralateral normal-appearing white matter. The mean value of these five ROIs was calculated as reference value; c) The highest, lowest, and mean CBV, CBF, MTT, ADC, FA and MD among the five ROIs acquired from a) were divided by the reference value to compute rCBVmax, rCBVmin, rCBVmean, rCBFmax, rCBFmin, rCBFmean, rMTTmax, rMTTmin, rMTTmean, rADCmax, rADCmin, rADCmean, rFAmax, rFAmin, rFAmean, rMDmax, rMDmin, rMDmean. An example of ROI placement was shown in Figure 1.
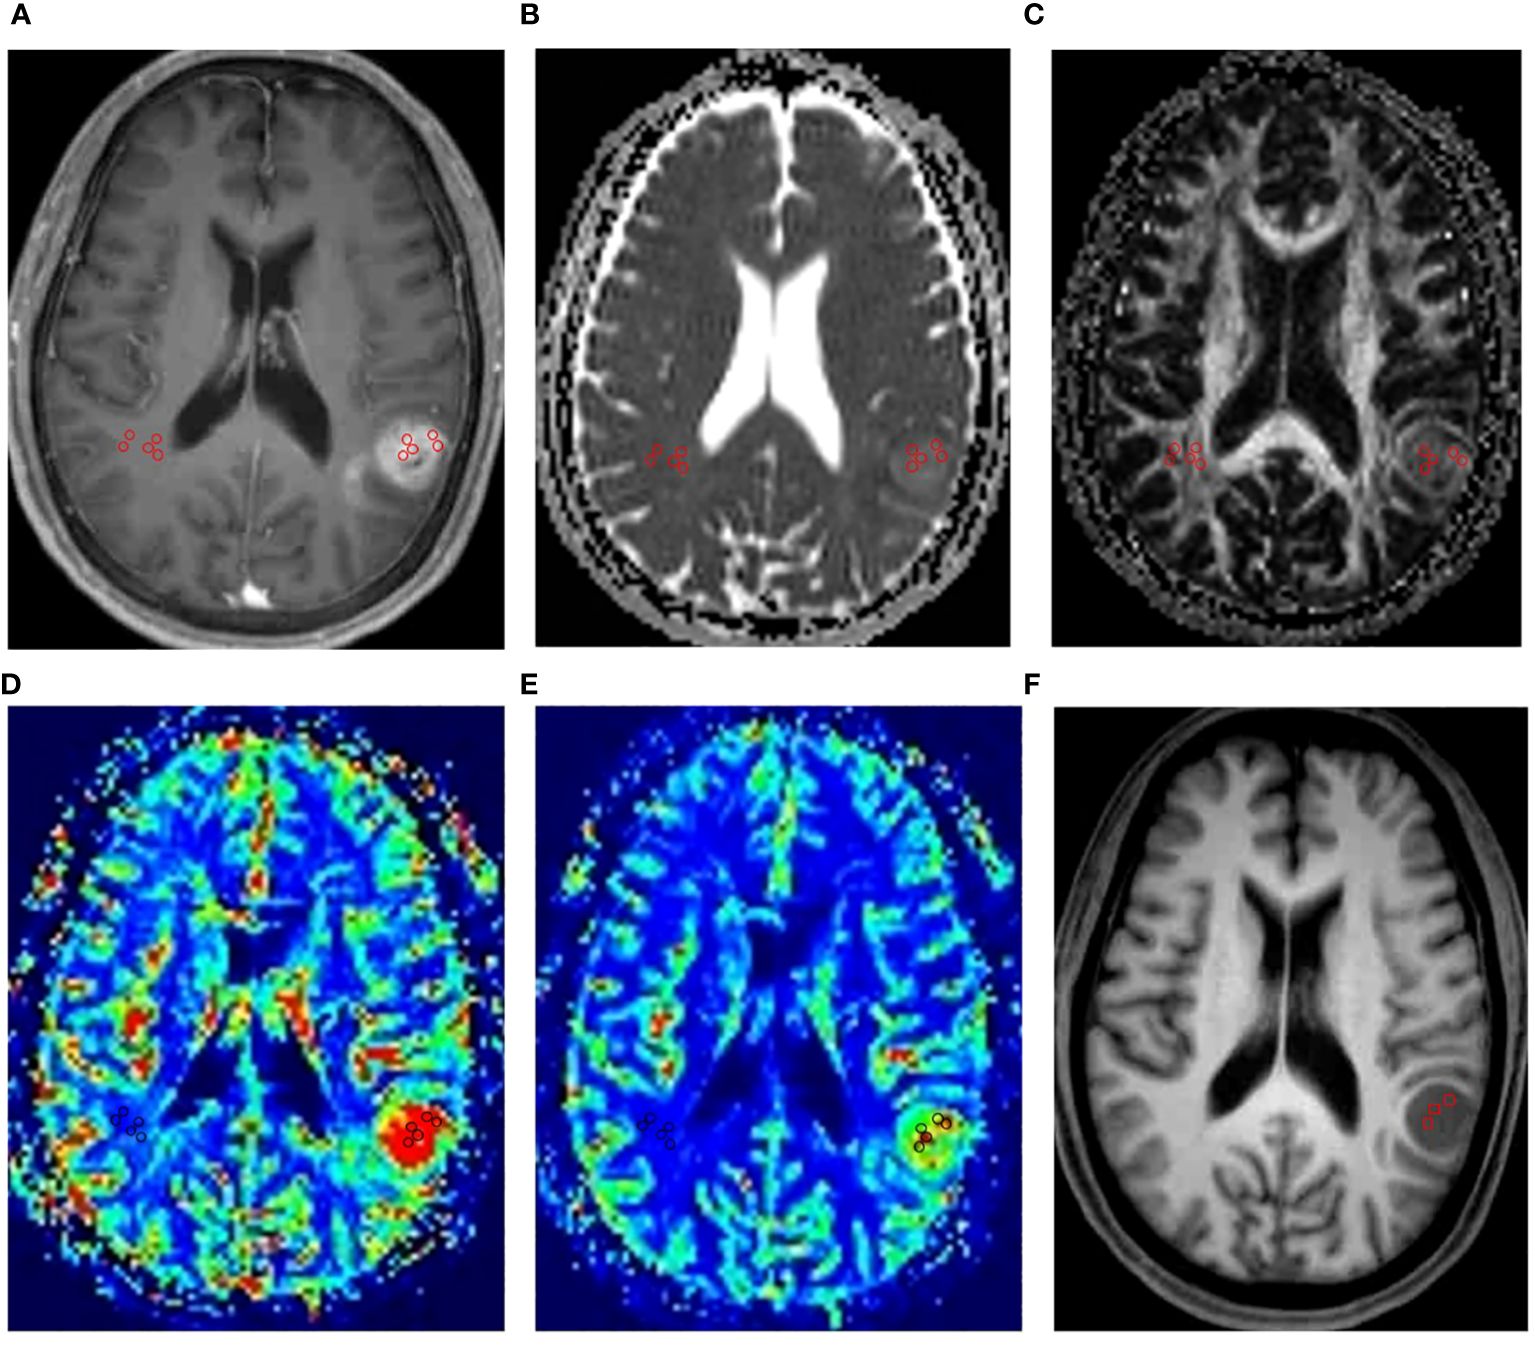
Figure 1 An example of ROI placement. This figure showed the ROI placement for a 62-year-old male patient with IDH1 wild-type grade IV glioma in the left temporal lobe. Firstly, we placed five circular regions of interest (ROIs) of 25mm2 to 30mm2 within the regions with the highest signal strength in the contrast-enhanced T1-weighted images (A). Then, we copied the ROIs to the ADC maps (B), FA maps (C), CBV maps (D), CBF maps (E). Finally, five circular ROIs of same size from the above maps were placed in contralateral normal-appearing white matter. In MRS, the VOIs were placed in the structural MR imaging (F) within the solid portion of the tumor to avoid contamination from normal tissue or areas of necrosis, cysts or hemorrhage.
The spectra were automatically analyzed for the relative signal intensity (area under the fitted peaks in the time domain) of the following metabolites: Cho, Cr, NAA. The metabolite peaks were assigned at the following frequencies: choline (Cho) at 3.22 ppm, creatine (Cr) at 3.02 ppm, N-acetylaspartate (NAA) at 2.02 ppm. We selected one to three Volumes of interest (VOIs) (250mm3 to 300mm3) within the solid portion of the tumor to avoid contamination from normal tissue or areas of necrosis, cysts or hemorrhage based on conventional MR imaging as much as possible. The measured metabolites in these VOIs were averaged to represent the tumor. The ratios of Cho/Cr, Cho/NAA and NAA/Cr were finally calculated.
Pathology
The histopathologic diagnosis was performed by pathologists and based on the WHO 2016 classification (20). The specimens were obtained from continuous sections after surgical resection. Surgical specimens were fixed in formalin and embedded in paraffin. The hematoxylin and eosin-stained specimens were checked to make the primary histopathological tissue diagnoses. The Ki-67 LI was obtained using the technique described in previous study (10, 21). Briefly, Ki-67 immunohistochemical staining was performed on paraffin embedded sections using the MIB-1 anti-human Ki-67 LI mouse monoclonal antibody (Dako, Carpinteria CA) at dilution of 1/600 and the EnvisionTM FLEX Targeted Retrieval System at high pH (Dako). Diaminobenzidine (DAB) was used as the chromogen. The Ki-67 LI was determined by calculating the percentage of MIB-1–positive tumor cell nuclei in a microscopic field containing approximately 400 to 500 tumor cells.
In each case, areas with the highest number of positive-staining tumor nuclei were selected for calculating the Ki-67 LI.
Statistical analyses
Interobserver and intraobserver reliability coefficient of MRI parameters was assessed using intraclass correlation coefficients (ICC) with 95% confidence intervals (SPSS, version 20.0, IBM). All other statistical analyses were performed using stata (version,15.0). Firstly, the Pearson correlation was used to analyze the correlation between each parameter and Ki-67 LI respectively. Through correlation analysis, we screened out the imaging indicators that had the greatest correlation with Ki-67 LI among the maximum, minimum and mean values of CBF, CBV, MTT, ADC, FA and MD respectively. Using these indicators with high correlation with Ki-67 LI to represent tumors can reduce the possible mismatch between the location of pathological sampling and the placement of ROI or VOI. Therefore, these screened indicators and those obtained in MRS were used for subsequent statistical analysis.
Jones (22) pointed out that it is most appropriate to use multivariate linear regression to explore the predictive relationship between multiple parameters. In this study, Ki-67 LI was dependent variable, the image indicators were independent variables, age and sex were control variables.
The following was the mathematical formula and statistical process of the regression model of this study:
Where i is the sample size and k is the number of model’s independent variables. Yik is the predicted value of the dependent variable (Ki-67 LI) and Xik is the column vectors, which represents the independent variables. βik is the regression coefficient of the kth variable (ie, the prediction effect), and εik is the regression residual term, α is the intercept term of the regression equation. The above selected image indicators were gradually added into the model as independent variables according to the order of correlation with Ki-67 LI to form the predictive model of Ki-67 LI. We used the R2, RMSE, AIC and BIC to assess model quality.
We used the Ki-67 LI prediction model constructed above in the validation sample set to estimate the Ki-67 LI index for these subjects, and t test was used to compare whether there were differences between these predicted Ki-67 LI and the actual Ki-67 LI.
In addition, we analyzed the correlation between imaging indicators and the grade of glioma using the Pearson correlation analysis. We compared the differences of imaging indicators among the gliomas of grade II, III, and IV using one-way analysis of variance (ANOVA). Post-hoc tests using Bonferroni correction for multiple comparisons. Since there were only two subjects with glioma of grade I in this study, gliomas with tumor grade I were not included in the group comparison.
Results
Among the 109 subjects included in this study, 79 subjects (age, 40.63 ± 16.82 years; age range, 4–80 years; female, 49; male, 30) were used as a dataset to construct the predictive model of Ki 67 LI, and 30 subjects (age, 43.16 ± 15.71 years; age range, 9–76 years; female, 12; male, 18) were used as a validation set for the predictive model. The information for the samples used to construct the Ki-67 LI prediction model was shown in Table 1. The average size of the ROIs which were placed within the solid component of the tumor were 26.3 ± 11.9mm2 for the neuroradiologist A and 28.75 ± 15.10 mm2 for the neuroradiologist B, respectively. There was no difference in the size of ROIs by the two neuroradiologists. The detailed size of ROIs placed by two neuroradiologists in each MRI maps were listed in Table 2. Intra-observer and inter-observer agreements for MRI parameters were good to excellent with ICCs ranging from 0.836 to 0.964 (Table 3).
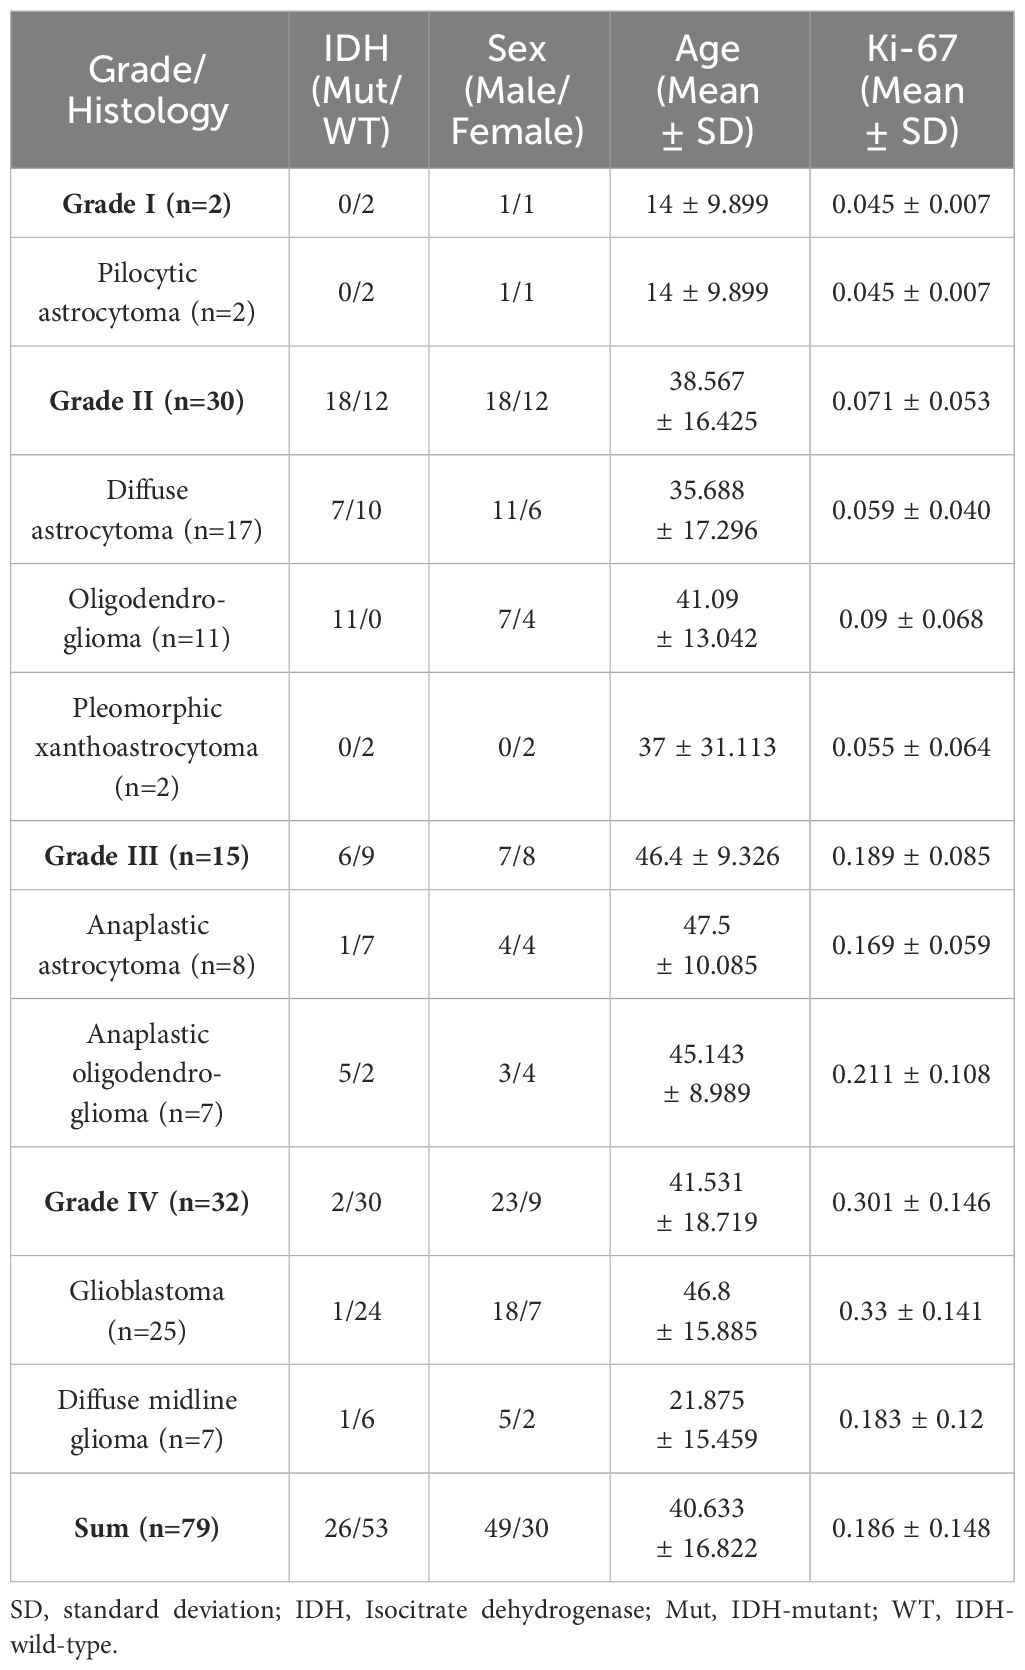
Table 1 Patient demographic data characteristics.
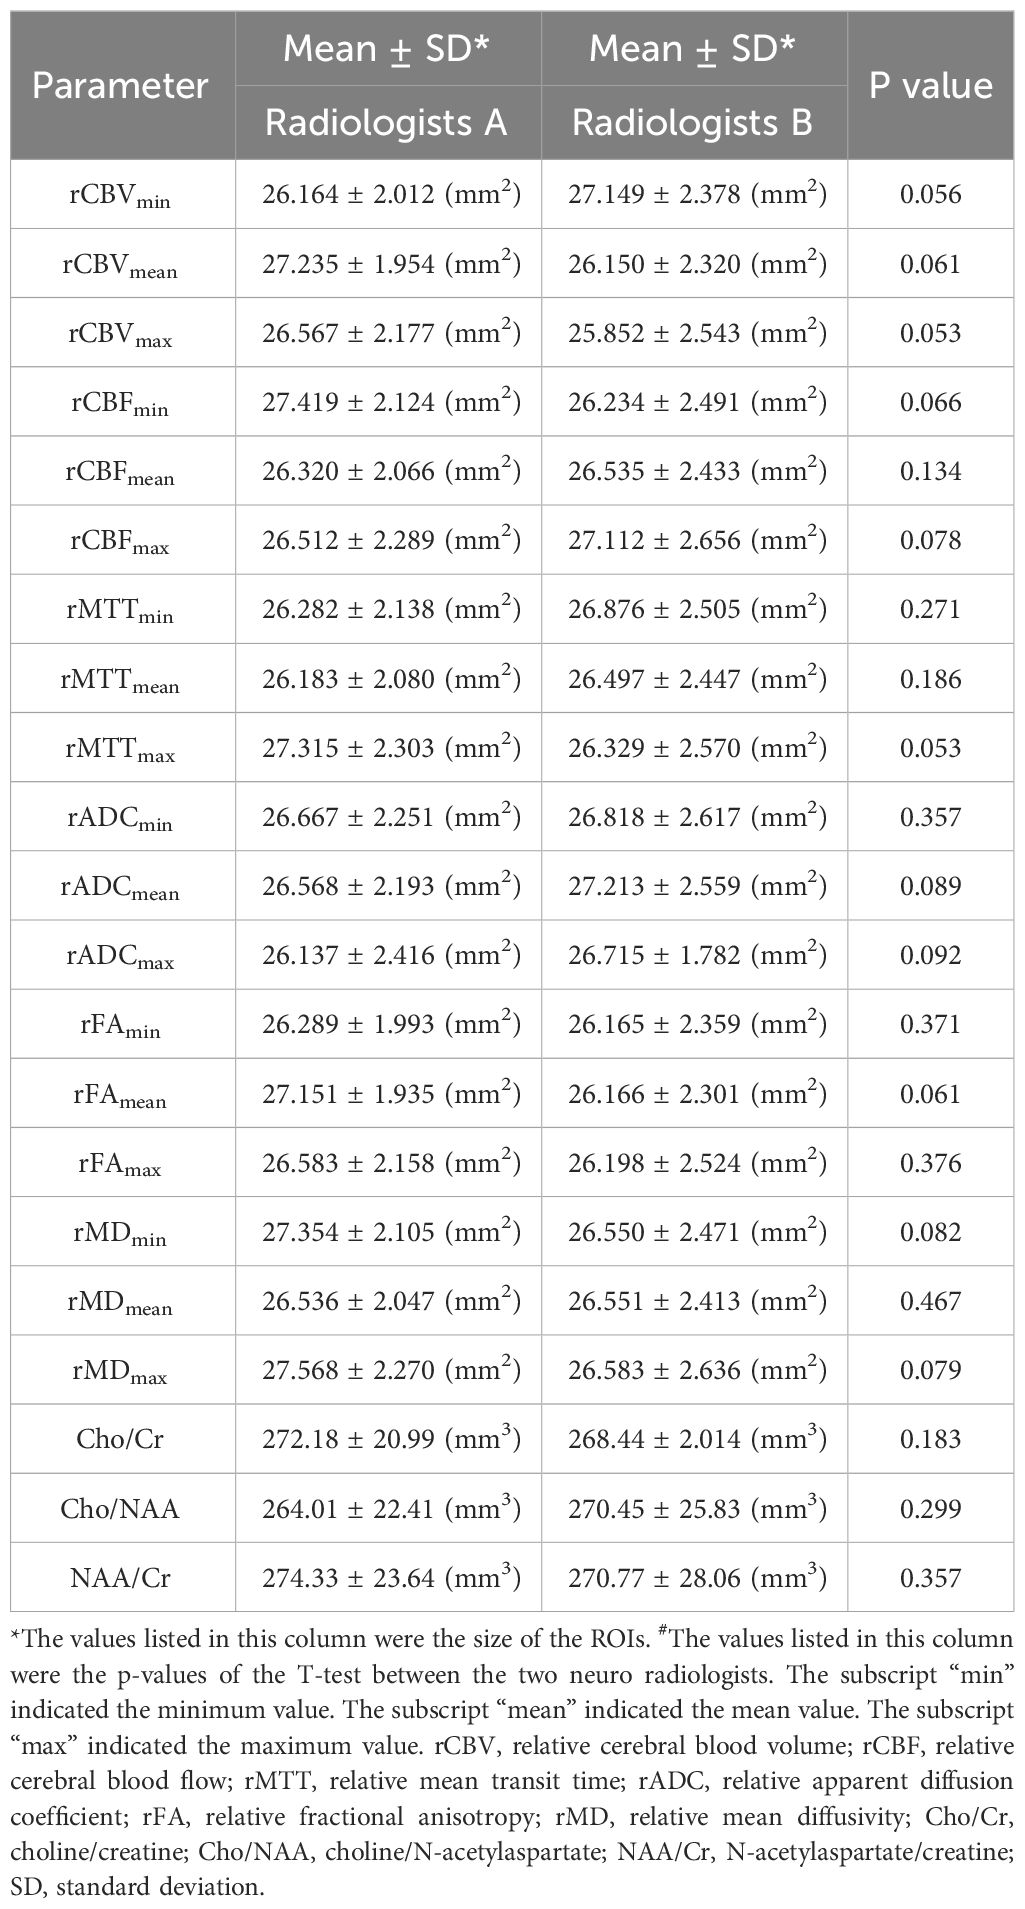
Table 2 The size of the ROIs or VOIs.
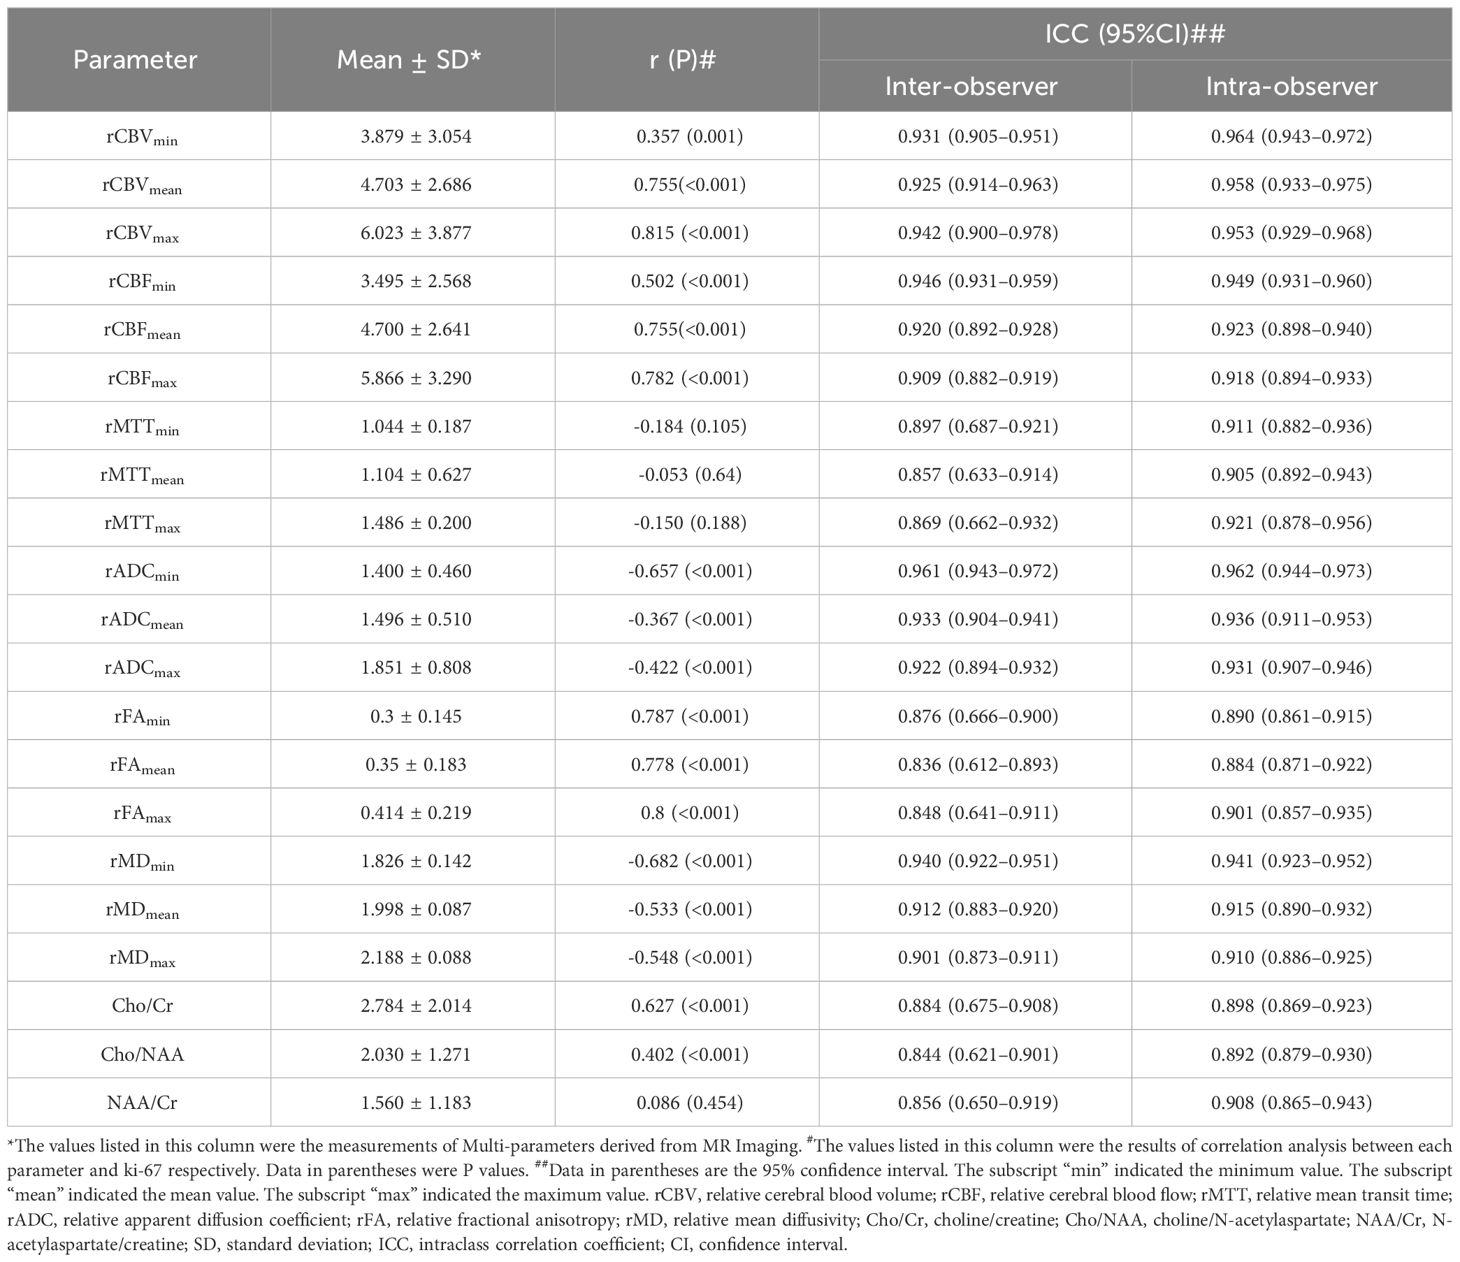
Table 3 The results of correlation analysis and intra-class correlation coefficients.
The results of the correlation analysis between each imaging indicators and Ki-67 LI showed that the rCBVmax (r=0.815, p<0.001), rCBFmax (r=0.782, p<0.001), rADCmin (r= -0.657, p<0.001), rFAmax (r=0.8, p<0.001), rMDmin (r=-0.682, p<0.001) had relatively high correlation with Ki-67 LI (Table 3). Therefore, the above indicators and ratios of Cho/Cr and Cho/NAA were included in subsequent stepwise regression analysis and group comparison. The ratio of NAA/Cr was not correlated with Ki-67 LI, so it was excluded from stepwise regression analysis.
The regression coefficients listed in our study were all non-standardized coefficients unless otherwise stated. The results of the stepwise regression analyses were as follows (Table 4): The model 1 showed that the regression coefficient of rCBVmax was 0.03 (P<0.001). In this model, the regression coefficients of age and sex were not statistically significant. Therefore, we excluded age and sex in the subsequent model construction. When the rFAmax was added, the model had higher R2 and lower RMSE, AIC and BIC, which means model 2 had better explanatory power for Ki-67 LI. In addition, the regression coefficient of rCBVmax was 0.03 (P<0.01). Thus, the model 1 overestimated the regression coefficient of rCBVmax. We found that the model 3 had higher R2 and lower RMSE, AIC and BIC compared to model 2. The model 4 had higher increased R2 and lower RMSE, AIC and BIC compared to model 3. Therefore, model 3 was better than model 2, and model 4 was better than model 3. In model 4, the regression coefficient of rMDmin was not statistically significant. Therefore, we excluded rMDmin in the subsequent model construction. The model 5 had higher increased R2 and lower RMSE, AIC and BIC compared to model 4. The model 6 had higher increased R2 and lower RMSE, AIC and BIC compared to model 5. Therefore, model 5 was better than model 4, and model 6 was better than model 5. In addition, the value of regression coefficient of rCBVmax, rFAmax, rCBFmax were gradually decreased from model 1 to model 6 (Table 4), which means that the regression coefficients were overestimated in model 1 to model 5. The R2 in model 7 were similar with model 6. However, the RMSE, AIC and BIC were increased in model 7 compared to model 6 (Table 4). That is to say, the explanatory power of model 7 did not increase, but the simplicity of the model was affected compared to model 6.
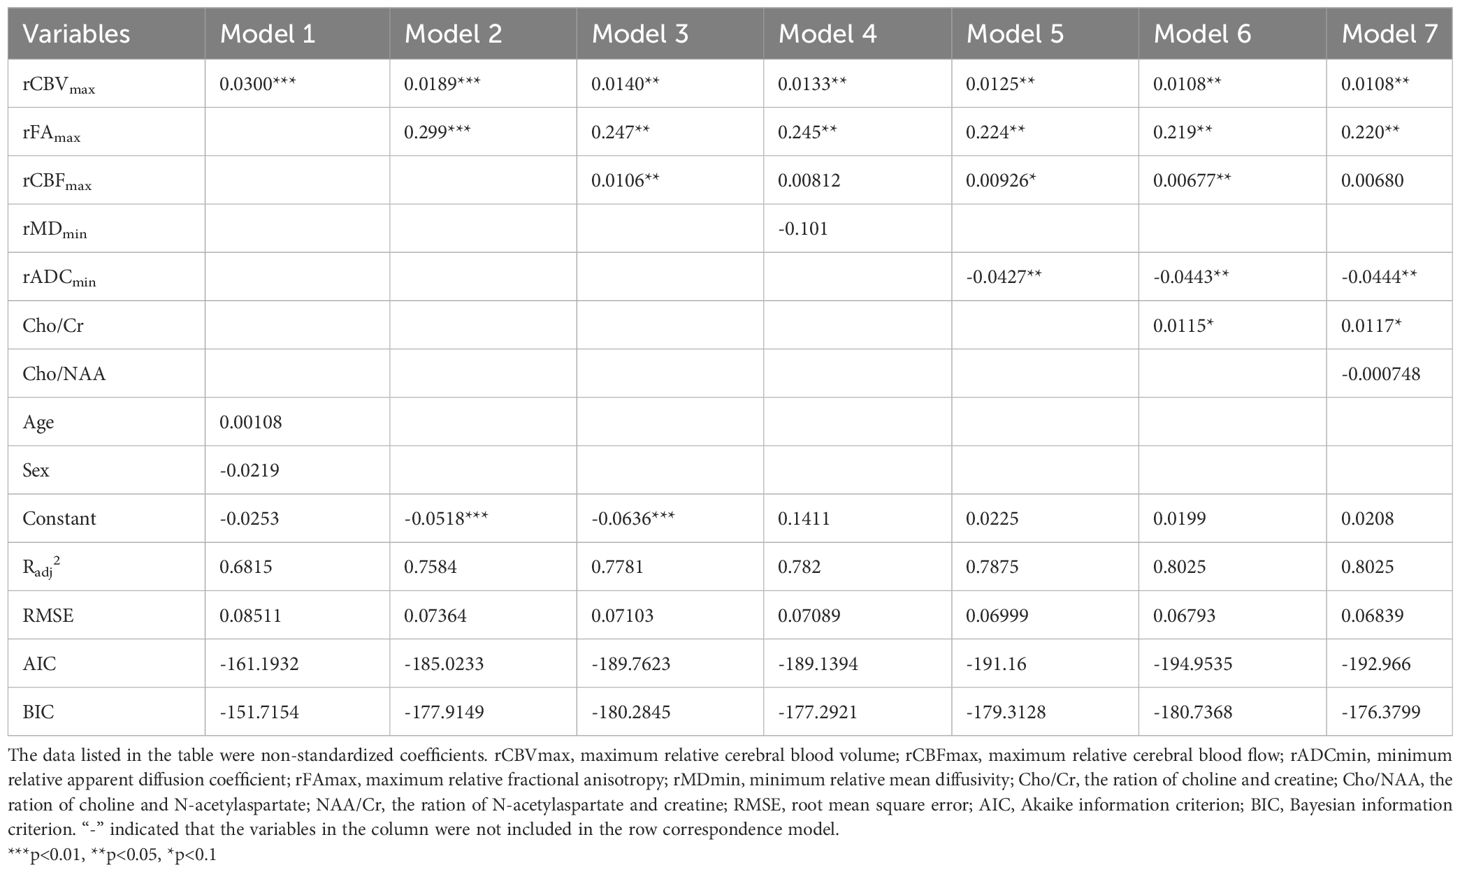
Table 4 The results of stepwise multivariable regression.
We could conclude that model 6 (Ki67 = 0.0199 + 0.0108rCBVmax + 0.219rFAmax + 0.00677rCBFmax + 0.0115Cho/Cr - 0.0443rADCmin) may be the best model among these seven models. The standardized regression coefficients of each imaging indicator in this model were as follows: rCBVmax (RC= 0.282), rFAmax (RC=0.325), rCBFmax (RC=0.151), rADCmin (RC= -0.14), Cho/Cr (RC=0.157).
Then, we did regression check on model 6 and the results showed that there were no multicollinearity problem (Variance inflation factors of all independent variables were less than five: rCBVmax, 3.22; rCBFmax, 3.14; rADCmin, 1.96; rFAmax, 2.51; Cho/Cr ration, 1.64), which means that the model had no redundant information. In addition, the regression check demonstrated that the residuals were normally distributed (Shapiro-Wilk W normality test: z, 2.140; p, 0.016), which means that the model did not miss important variables. Finally, there was an appropriate functional form (Test for appropriate functional form: F, 0.502; p, 0.682). The scatterplot matrix showed that Ki-67 LI was positively linearly distributed with rCBVmax, rCBFmax, rFAmax and ratio of Cho/Cr respectively, while it was negatively linearly distributed with rADCmin (Figure 2). We used the Ki-67 LI prediction model obtained above to estimate the Ki-67 LI of the validation sample. There was no difference (P=0.087 for t test) between the estimation of Ki-67 LI (0.177 ± 0.126) estimate and the actual value of Ki-67 LI (0.186 ± 0.147) in the validation sample.
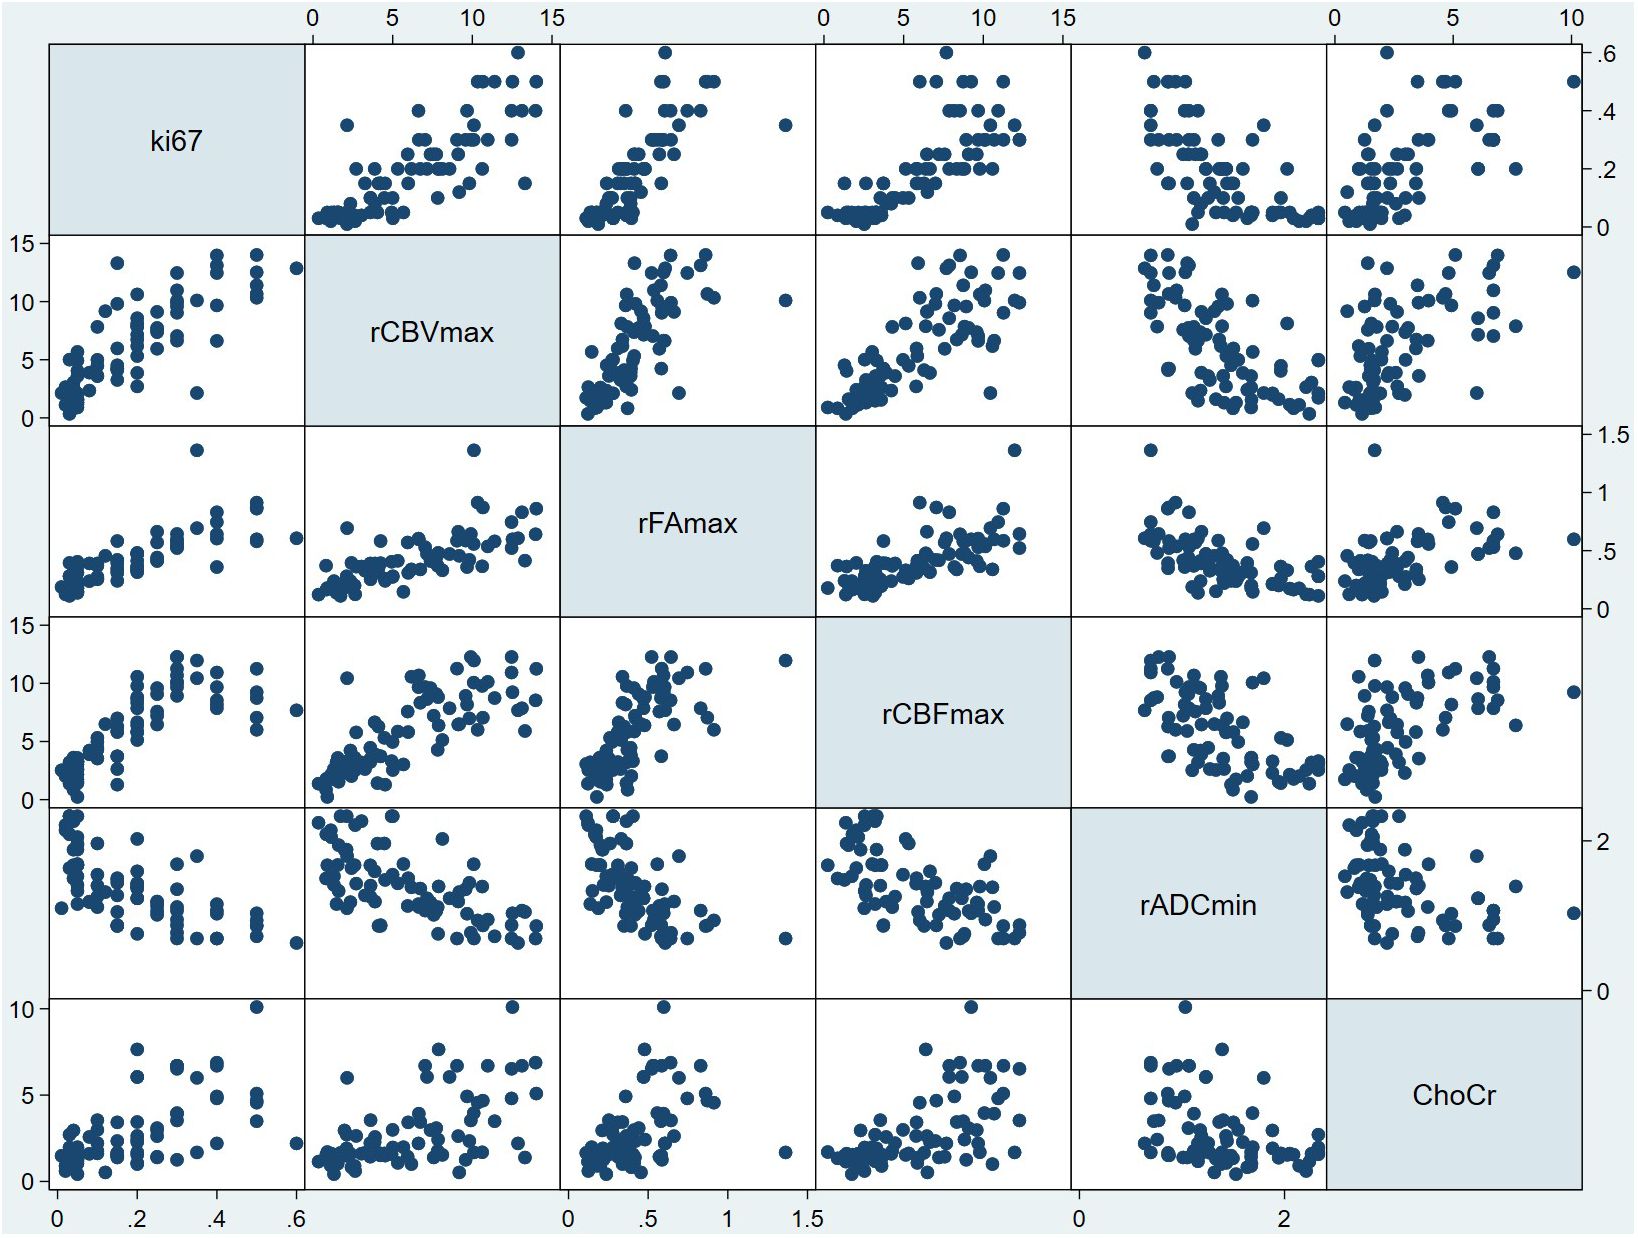
Figure 2 Scatterplot matrix of all variables in model 6. In each plot, the variable to the side of the graph was used as the Y variable, and the variable above and below the graph was used as the X variable. For example, in all the plots in the first column, the horizontal coordinate was Ki-67 LI, and the vertical coordinate from top to bottom was rCBVmax, the rFAmax, the rCBFmax, the rADCmin and Cho/Cr respectively. In addition, in all the plots in the first row, the vertical coordinate was Ki-67 LI, and the horizontal coordinate from left to right was rCBVmax, the rFAmax, the rCBFmax, the rADCmin and Cho/Cr respectively. From this figure, it can be seen that Ki-67 LI may have a positive correlation with rCBVmax, rFAmax, rCBFmax,Cho/Cr ration, while Ki-67 LI may have a negative correlation with rADCmin. ChoCr, Cho/Cr ration; rCBVmax, maximum relative cerebral blood volume; rCBF, relative cerebral blood flow; rADCmin, minimum relative apparent diffusion coefficient; rFAmax, maximum relative fractional anisotropy.
In addition, the analysis of the correlation between imaging indicators and the grade of glioma showed that the rCBVmax, rCBFmax, rFAmax, the ratio of Cho/Cr and Cho/NAA were positively correlated with the grade of glioma, while the rADCmin and rMDmin were negatively correlated with the grade of glioma (Table 5). The results of ANOVA showed that the rCBVmax, rCBFmax, rADCmin, rFAmax, rMDmin, the ration of Cho/Cr and Cho/NAA were different among grade II, III, and IV (Table 5). The Post-hoc tests showed that the rCBVmax, rCBFmax, rADCmin and rFAmax were different between grade II and grade III, the rCBVmax, rCBFmax, rADCmin, rFAmax, rMDmin, the ration of Cho/Cr and Cho/NAA were different between grade II and grade IV, and the rFAmax, rMDmin and the ration of Cho/Cr were different between grade III and grade IV (Table 5). The box blots of rCBVmax, the rCBFmax, the rADCmin, the rFAmax, the rMDmin, the ration of Cho/Cr, the Cho/NAA and the NAA/Cr in grade II, grade III and grade IV gliomas were showed in Figure 3.
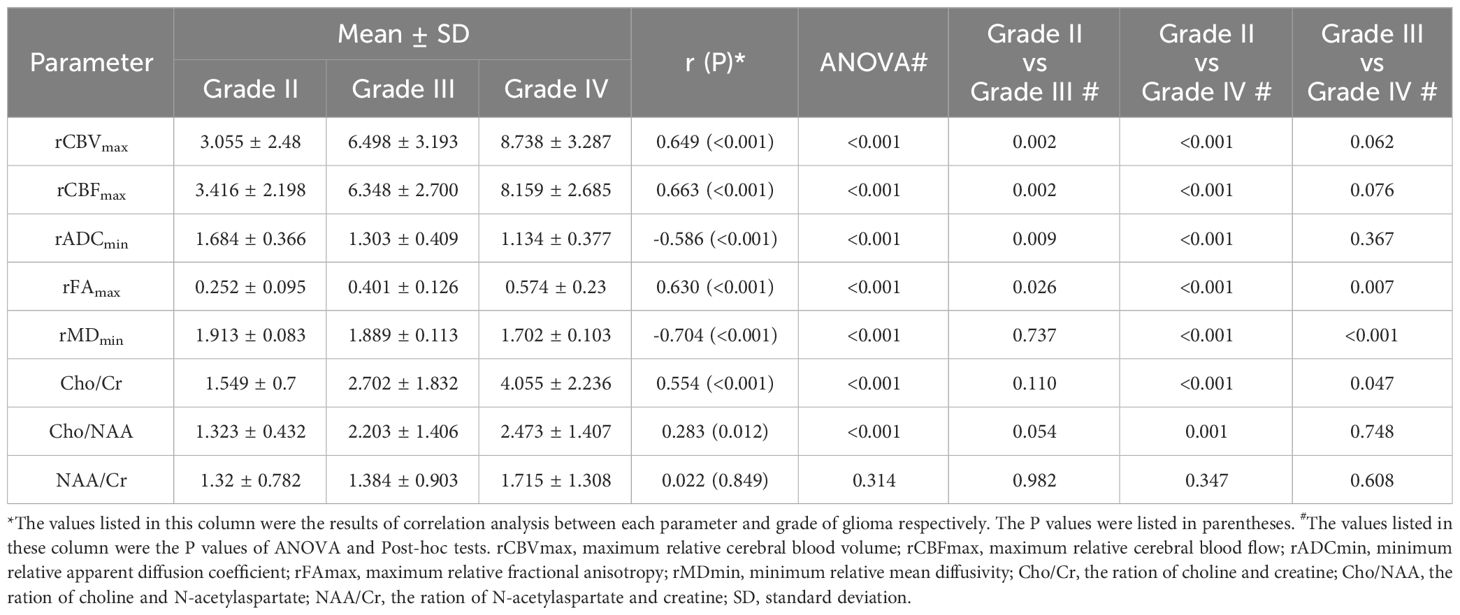
Table 5 The results of correlation analysis between each parameter and grade and the results of group comparison.
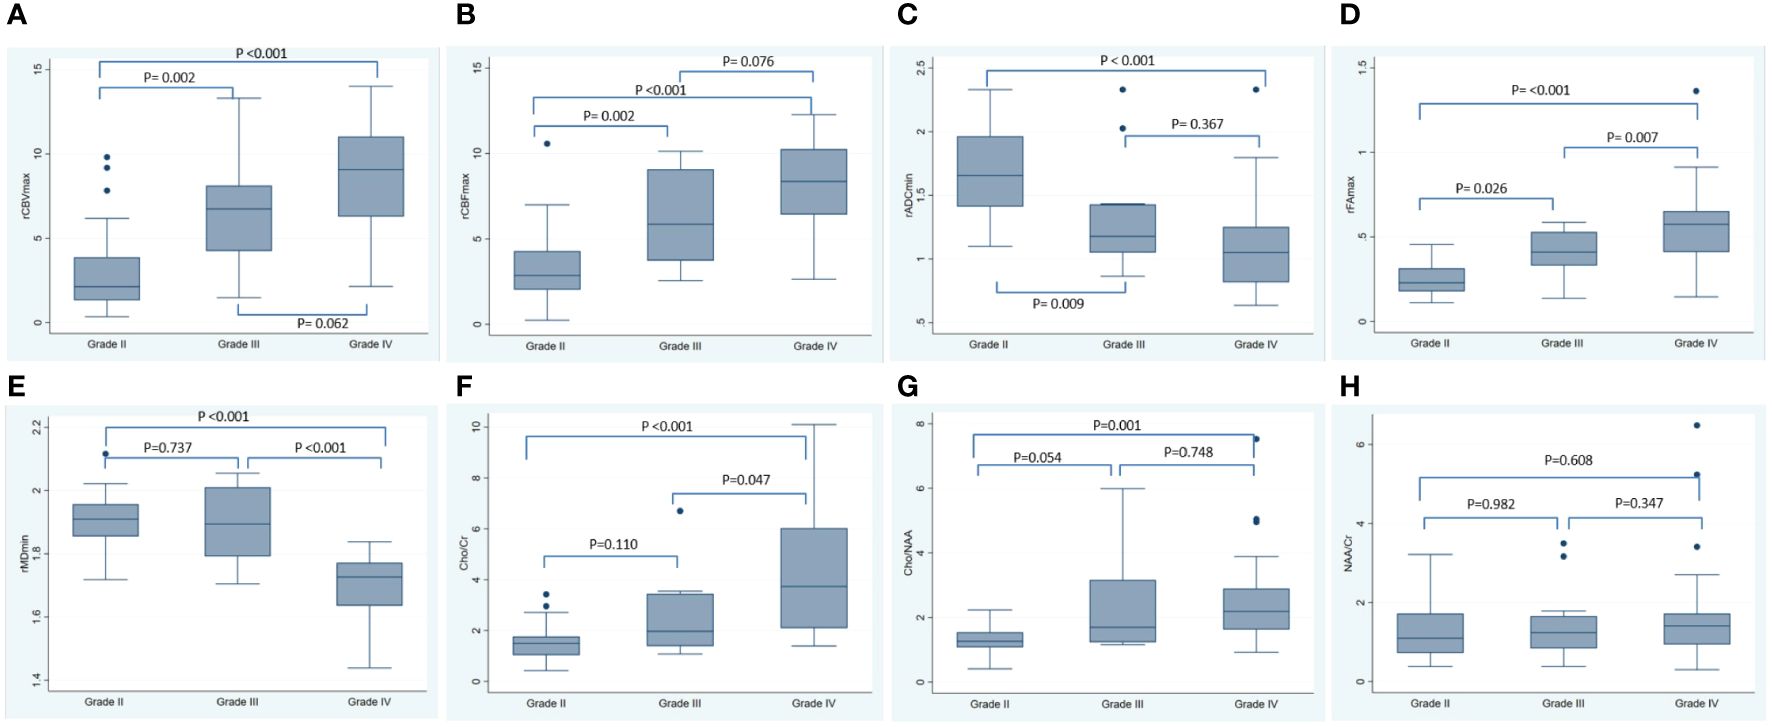
Figure 3 The box blots of various MRI metrics in different tumor grade. This figure showed the box plots for the rCBVmax (A), the rCBFmax (B), the rADCmin (C), the rFAmax (D), the rMDmin (E), the Cho/Cr (F), the Cho/NAA (G) and the NAA/Cr (H) in grade II, grade III and grade IV gliomas. The P-values listed in the picture were the results of Post-hoc tests using Bonferroni correction for multiple comparisons. rCBF, relative cerebral blood flow; rCBV, relative cerebral blood volume; rADC, relative apparent diffusion coefficient; rFA, relative fractional anisotropy; rMD, relative mean diffusivity; Cho/Cr, choline/creatine; Cho/NAA, choline/N-acetylaspartate; NAA/Cr, N-acetylaspartate/creatine; SD, standard deviation.
Discussion
This study estimated Ki-67 LI in glioma patients based on multi-parameters derived from DSC, DWI, DTI and MR spectroscopy imaging using multivariate regression and demonstrated that combining multiple parameters can precisely predict the Ki-67 LI. The model in our study with five dominant variables (rCBVmax, rCBVmax, rADCmin, rFAmax and Cho/Cr ratio) could predict Ki-67 LI with an R2 of 0. 8025 and a root mean square (RMS) error of 0.0679.
In addition, we found that rCBVmax, rCBFmax, rFAmax, the ratio of Cho/Cr and Cho/NAA were positively correlated with Ki-67 LI and the grade of glioma, while the rADCmin and rMDmin were negatively correlated with Ki-67 LI and the grade of glioma.
The results about the correlation between various imaging indicator and Ki-67 LI and the grade of glioma in our study were generally agree with previous studies. Many studies reported a significant inverse correlation between ADC values or ADC ratio (lesion-to-normal) and Ki-67 LI (21, 22). Yan et al. (23) demonstrated that ADC was a reliable biomarker in predicting the proliferation level. This may be due to the level of ADC signal correlated with cell density in gliomas (23). MD measures the average motion of water molecules, independent of tissue directionality (24); it is considered a synonym of the coefficient of diffusion in different space guidelines (25). Therefore, our study also found that the rMDmin were negatively correlated with Ki-67 LI and the grade of glioma. Fractional anisotropy (FA) provides a quantitative estimation of diffusion anisotropy, and positive correlation was observed between the FA and Ki-67 LI in many studies (26, 27). George A. Alexiou and colleagues found significant negative correlation between the ADC ratio (lesion-to-normal ration) and the Ki-67 LI (rho = −0.545, p = 0.0087) and significant positive correlation between the FA ratio and the Ki-67 LI (rho = 0.489, p =0.02) (26). DSC imaging has been widely used to estimate CBV and CBF. Many studies reported a positive correlation between absolute or relative CBV and CBF values and cell density (28, 29). George A. Alexiou (26) and Anastasia K. Zikou (27) found strong correlation between rCBV and the Ki-67 LI in glioma (rho = 0.853, p < 0.0001) and in glioblastomas (r = 0.628, p = 0.07). Higher Cho metabolites at MR spectroscopy indicate increased membrane turnover and increased cellular density (30). However, Hiroaki Shimizu and colleagues showed that the Cho value tends to be underestimated in heterogeneous tumors resulting from intratumoral cyst, necrosis, hematoma, and indicate that the Cho value may no longer be reliable (14). Hiroaki Shimizu and colleagues demonstrated a linear relationship between the Ki-67 LI and Cho/Cr ratio (r =0.58, p = 0.02) and the Cho/NAA ratio (r= 0.60, p=0.02) (16). The regression coefficients between Ki-67 LI and rCBVmax, rADCmin, rFAmax and Cho/Cr ration in our study were relatively lower in our study compared with previous studies. The inconsistency may be due to the differences in statistical analyses. They performed univariate linear regression analysis which may lead to miscalculation of regression coefficients resulting from missing important variables. The above showed that diffusion, perfusion and spectroscopy imaging can be used to assess vascularity, metabolic activity, biochemical concentration and cellularity. These may be the reasons for the correlation between the parameters obtained in advanced MRI and the Ki-67 LI and the grade of glioma in this study.
We are not aware of previous work presenting Ki-67 predictive models based on multi-parameters derived from MR imaging using stepwise multivariate regression. Recently, Evan D. H. Gates and colleagues estimated Ki-67 maps using multi-parameters and reported the random forest algorithm best modeled Ki-67 with 4 imaging inputs (T2-weighted, fractional anisotropy, cerebral blood flow, Ktrans) and with a RMSE of 0.035 (R2 = 0.75) (4). In our study, the model with also 5 variables (rCBVmax, rCBFmax, rADCmin, rFAmax and Cho/Cr ration) predicted Ki-67 LI with a RMSE of 0.0679 (R2 = 0.8025). The RMSE in our research was slightly larger, the reason maybe the MR sequences and statistical analyses were different between our and their study which may lead to some differences in results. However, our model was tested by regression diagnosis which showed there was an appropriate functional form and the model did not miss important variables. In addition, we also tested in the validation set that there was no statistical difference between the Ki-67 LI evaluated by the predictive model constructed in this study and the actual Ki-67 LI. Therefore, our model also had important clinical value in noninvasively predicting the Ki-67 LI.
Ki-67 LI, a tumor cell proliferation index, is a widely recognized biomarker for quantitative evaluation of glioma growth and prognosis of patients (31). The Ki-67 LI prediction model constructed in this study will lead to more accurate characterization of tumors and allows us to distinguish between high-proliferating and low-proliferating gliomas. Such features afford additional presurgical information to the conventional morphological images. In clinical application, we suggest that advanced magnetic resonance examination, especially DTI, DWI, DSC and MRS imaging, be performed before surgery in glioma patients, and combine the model in our study to predict Ki-67 LI before surgery to noninvasive evaluation of pathological features of glioma.
This study has several limitations. Firstly, this was a retrospective research and only DSC, DWI, DTI and MR spectroscopy imaging were analyzed. In the future, more advanced MR imaging techniques need to be included to verify the results of this study. Second, the relation between the ROIs placement on the parameter maps of MR imaging and the histologic sampling used for the proliferation analysis remains unclear, although Ki-67 LI was determined in the highest density of stained areas. Another limitation was the heterogeneity of Ki-67 LI in glioma. The Ki-67 LI of the same lesion in the same patient in different areas was very different, although we try to enroll the maximum of Ki-67 LI in the section in this study, and select the ROI representing the most serious lesions in the image, so as to achieve the match between MR image and pathology as much as possible. The third limitation is that all MRI scans were performed on a single machine, which can avoid errors due to different machines, but it is also impossible to know whether the models constructed in this study will be applicable on other MRI machines. In the future, it is necessary to include more patients scanned on different MRI machines to verify whether the model obtained in this study is applicable to other machines, or to build a standardized model that can be applied to different MRI machines. The fourth limitation is that due to the limited sample size, the prediction model of glioma histological type was not constructed in this study, and the prediction model of glioma Ki-67 LI was not constructed according to the histological types. It may be possible to get a more accurate predictive model by building models based on histological types. Therefore, a larger sample size including various histological types will be needed in the future to complete this work. Finally, there are many new methods for feature extraction of magnetic resonance data, such as texture analysis. It is unknown whether the magnetic resonance parameters obtained by these new methods can build a more reliable prediction model for Ki-67 LI. Although the magnetic resonance parameters obtained in this study are more convenient compared with texture analysis, it is of great value to use more new magnetic resonance parameters to construct the Ki-67 LI model, and compare the differences between the model obtained in this study and the model obtained by the new method, or standardize the model between the parameters obtained by the traditional method and the parameters obtained by the new method.
In conclusion, we found that rCBVmax, rCBFmax, rADCmin, rFAmax and Cho/Cr ratio are correlated to Ki-67 LI in glioma patients. At the same time, combining multiple parameters derived from DSC, DWI, DTI and MRS can precisely predict the Ki-67 LI in glioma patients. This will allow us to noninvasively evaluate the pathological features and predict the prognosis of patients with glioma before surgery, and provide some information for the selection of clinical treatment.
Data availability statement
The raw data supporting the conclusions of this article will be made available by the authors, without undue reservation.
Ethics statement
The studies involving humans were approved by West China hospital of Sichuan University. The studies were conducted in accordance with the local legislation and institutional requirements. The participants provided their written informed consent to participate in this study.
Author contributions
YH: Writing – review & editing, Writing – original draft, Visualization, Validation, Supervision, Software, Resources, Project administration, Methodology, Investigation, Funding acquisition, Formal analysis, Data curation, Conceptualization. KZ: Writing – review & editing, Visualization, Software, Resources, Project administration, Methodology, Investigation, Formal analysis, Data curation.
Funding
The author(s) declare that no financial support was received for the research, authorship, and/or publication of this article.
Conflict of interest
The authors declare that the research was conducted in the absence of any commercial or financial relationships that could be construed as a potential conflict of interest.
Publisher’s note
All claims expressed in this article are solely those of the authors and do not necessarily represent those of their affiliated organizations, or those of the publisher, the editors and the reviewers. Any product that may be evaluated in this article, or claim that may be made by its manufacturer, is not guaranteed or endorsed by the publisher.
Abbreviations
ADC, Apparent diffusion coefficient; AIC, Akaike information criterion; BIC, Bayesian information criterion; CBV, Cerebral blood volume; Cho, Choline; Cr, Creatine; DTI, Diffusion tensor imaging; DSC, Dynamic susceptibility-weighted contrast enhanced imaging; DWI, Diffusion-weighted imaging; FA, fractional anisotropy; MD, mean diffusivity; MRS, Magnetic resonance spectroscopy imaging; NAA, N-acetylaspartate; ROI, Region of interest; RMSE, Root mean square error;VOI, Volume of interest.
References
1. Su C, Jiang J, Zhang S, Shi J, Xu K, Shen N, et al. Radiomics based on multicontrast MRI can precisely differentiate among glioma subtypes and predict tumor-proliferative behavior. Eur Radiol. (2019) 29:1986–96. doi: 10.1007/s00330-018-5704-8
2. Burger PC, Shibata T, Kleihues P. The use of the monoclonal antibody Ki-67 in the identification of proliferating cells: application to surgical neuropathology. Am J Surg Pathol. (1986) 10:611–7. doi: 10.1097/00000478-198609000-00003
3. Torp SH. Diagnostic and prognostic role of Ki-67 immunostaining in human astrocytomas using four different antibodies. Clin Neuropathol. (2002) 21:252–7.
4. Gates EDH, Lin JS, Weinberg JS, Hamilton J, Prabhu SS, Hazle JD, et al. Guiding the first biopsy in glioma patients using estimated Ki-67 maps derived from MRI: conventional versus advanced imaging. Neuro-oncology. (2019) 21:527–36. doi: 10.1093/neuonc/noz004
5. Cha S, Knopp EA, Johnson G, Wetzel SG, Litt AW, Zagzag D. Intracranial mass lesions: dynamic contrast enhanced susceptibility-weighted echo-planar perfusion MR imaging. Radiology. (2002) 223:11–29. doi: 10.1148/radiol.2231010594
6. Sugahara T, Korogi Y, Kochi M, Ikushima I, Hirai T, Okuda T, et al. Correlation of MR imaging determined cerebral blood volume maps with histologic and angiographic determination of vascularity of gliomas. AJR Am J Roentgenol. (1998) 171:1479–86. doi: 10.2214/ajr.171.6.9843274
7. Aronen HJ, Gazit IE, Louis DN, Buchbinder BR, Pardo FS, Weisskoff RM, et al. Cerebral blood volume maps of gliomas: comparison with tumor grade and histologic findings. Radiology. (1994) 191:41–51. doi: 10.1148/radiology.191.1.8134596
8. Higano S, Yun X, Kumabe T, Watanabe M, Mugikura S, Umetsu A, et al. Malignant astrocytic tumors: clinical importance of apparent diffusion coefficient in prediction of grade and prognosis. Radiology. (2006) 241:839 – 46. doi: 10.1148/radiol.2413051276
9. Liu X, Tian W, Kolar B, Yeaney GA, Qiu X, Johnson MD. MR diffusion tensor and perfusion-weighted imaging in preoperative grading of supratentorial non enhancing gliomas. Neuro-oncology. (2011) 13:447–55. doi: 10.1093/neuonc/noq197
10. Kinoshita M, Hashimoto N, Goto T, Kagawa N, Kishima H, Izumoto S, et al. Fractional anisotropy and tumor cell density of the tumor core show positive correlation in diffusion tensor magnetic resonance imaging of Malignant brain tumors. Neuroimage. (2008) 43:29–35. doi: 10.1016/j.neuroimage.2008.06.041
11. Zeng Q, Dong F, Shi F, Ling C, Jiang B, Zhang J. Apparent diffusion coefficient maps obtained from high b value diffusion-weighted imaging in the preoperative evaluation of gliomas at 3T: comparison with standard b value diffusion-weighted imaging. Eur Radiol. (2017) 27:5309–15. doi: 10.1007/s00330-017-4910-0
12. Yang X, Hu C, Xing Z, Lin Y, Su Y, Wang X. Prediction of Ki-67 labeling index, ATRX mutation, and MGMT promoter methylation status in IDH-mutant astrocytoma by morphological MRI, SWI, DWI, and DSC-PWI. Eur Radiol. (2023) 33:7003–14. doi: 10.1007/s00330-023-09695-w
13. Nelson SJ, Kadambi AK, Park I, Li Y, Crane J, Olson M, et al. Association of early changes in 1H MRSI parameters with survival for patients with newly diagnosed glioblastoma receiving a multimodality treatment regimen. Neuro-oncology. (2016) 19:430–9. doi: 10.1093/neuonc/now159
14. Shimizu H, Kumabe T, Shirane R, Yoshimoto T. Correlation between choline level measured by proton MR spectroscopy and Ki-67 labeling index in gliomas. AJNR Am J Neuroradiol. (2000) 21:659–65.
15. Law M, Cha S, Knopp EA, Johnson G, Arnett J, Litt AW. High-grade gliomas and solitary metastases: differentiation by using perfusion and proton spectroscopic imaging. Radiology. (2002) 222:715–21. doi: 10.1148/radiol.2223010558
16. Law M, Yang S, Wang H, Babb JS, Johnson G, Cha S, et al. Glioma grading: sensitivity, specificity, and predictive values of perfusion MR imaging and proton MR spectroscopic imaging compared with conventional MR imaging. Am J Neuroradiol. (2003) 24:1989–98.
17. Vamvakas A, Williams SC, Theodorou K, Kapsalaki E, Fountas K, Kappas C, et al. Imaging biomarker analysis of advanced multiparametric MRI for glioma grading. Physica Med. (2019) 60:188–98. doi: 10.1016/j.ejmp.2019.03.014
18. Wang Q, Li Q, Mi R, Ye H, Zhang H, Chen B, et al. Radiomics nomogram building from multiparametric MRI to predict grade in patients with glioma: A cohort study. J Magnetic Resonance Imaging. (2019) 49:825–33. doi: 10.1002/jmri.26265
19. Calvar JA, Meli FJ, Romero C, Calcagno ML, Yánez P, Martinez AR, et al. Characterization of brain tumors by MRS, DWI and Ki-67 labeling index. J Neurooncol. (2005) 72:273–80. doi: 10.1007/s11060-004-3342-2
20. Louis DN, Perry A, Reifenberger G, von Deimling A, Figarella-Branger D, Cavenee WK, et al. The 2016 World Health Organization classification of tumors of the central nervous system: a summary. Acta neuropathologica. (2016) 131:803–20. doi: 10.1007/s00401-016-1545-1
21. Saksena S, Jain R, Narang J, Scarpace L, Schultz LR, Lehman NL, et al. Predicting survival in glioblastomas using diffusion tensor imaging metrics. J Magn Reson Imaging. (2010) 32:788–95. doi: 10.1002/jmri.22304
22. Jones AM. Health econometrics[M]. Elsevier. (2000) 1:265–344. doi: 10.1016/S1574-0064(00)80165-1
23. Yan R, Haopeng P, Xiaoyuan F, Jinsong W, Jiawen Z, Chengjun Y, et al. Non-Gaussian diffusion MR imaging of glioma: comparisons of multiple diffusion parameters and correlation with histologic grade and MIB-1 (Ki-67 labeling) index. Neuroradiology. (2016) 58:121–32. doi: 10.1007/s00234-015-1606-5
24. Pierpaoli C, Basser PJ. Toward a quantitative assessment of diffusion anisotropy. Magn Reson Med. (1996) 36:893–906. doi: 10.1002/mrm.1910360612
25. Mori S, Barker PB. Diffusion magnetic resonance imaging: its principle and applications. Anat Rec. (1999) 257:102–9. doi: 10.1002/(ISSN)1097-0185
26. Alexiou GA, Zikou A, Tsiouris S, et al. Correlation of diffusion tensor, dynamic susceptibility contrast MRI and 99mTc-Tetrofosmin brain SPECT with tumor grade and Ki-67 immunohistochemistry in glioma. Clin Neurol Neurosurg. (2014) 116:41–5. doi: 10.1016/j.clineuro.2013.11.003
27. Zikou AK, Alexiou GA, Kosta P, Goussia A, Astrakas L, Tsekeris P, et al. Diffusion tensor and dynamic susceptibility contrast MRI in glioblastoma. Clin Neurol Neurosurg. (2012) 114:607–12. doi: 10.1016/j.clineuro.2011.12.022
28. Sadeghi N, Salmon I, Decaestecker C, Levivier M, Metens T, Wikler D, et al. Stereotactic comparison among cerebral blood volume, methionine uptake, and histopathology in brain glioma. Am J Neuroradiol. (2007) 28:455–61.
29. Sadeghi N, D’Haene N, Decaestecker C, Levivier M, Metens T, Maris C, et al. Apparent diffusion coefficient and cerebral blood volume in brain gliomas: relation to tumor cell density and tumor microvessel density based on stereotactic biopsies. Am J Neuroradiol. (2008) 29:476–82. doi: 10.3174/ajnr.A0851
30. Tamiya T, Kinoshita K, Ono Y, Matsumoto K, Furuta T, Ohmoto T. Proton magnetic resonance spectroscopy reflects cellular proliferative activity in astrocytomas. Neuroradiology. (2000) 42:333–38. doi: 10.1007/s002340050894
Keywords: magnetic resonance imaging, diffusion tensor imaging, diffusion weighted imaging, perfusion imaging, magnetic resonance spectroscopy, glioma, Ki-67 labeling index
Citation: Hu Y and Zhang K (2024) Noninvasive assessment of Ki-67 labeling index in glioma patients based on multi-parameters derived from advanced MR imaging. Front. Oncol. 14:1362990. doi: 10.3389/fonc.2024.1362990
Received: 29 December 2023; Accepted: 02 May 2024;
Published: 17 May 2024.
Edited by:
John Bianco, Princess Maxima Center for Pediatric Oncology, NetherlandsReviewed by:
Haidy G. Nasief, Medical College of Wisconsin, United StatesPaola Feraco, Santa Chiara Hospital, Italy
Copyright © 2024 Hu and Zhang. This is an open-access article distributed under the terms of the Creative Commons Attribution License (CC BY). The use, distribution or reproduction in other forums is permitted, provided the original author(s) and the copyright owner(s) are credited and that the original publication in this journal is cited, in accordance with accepted academic practice. No use, distribution or reproduction is permitted which does not comply with these terms.
*Correspondence: Ying Hu, eWluZ2h1QHdjaHNjdS5jbg==