
94% of researchers rate our articles as excellent or good
Learn more about the work of our research integrity team to safeguard the quality of each article we publish.
Find out more
ORIGINAL RESEARCH article
Front. Oncol., 22 February 2024
Sec. Pharmacology of Anti-Cancer Drugs
Volume 14 - 2024 | https://doi.org/10.3389/fonc.2024.1354049
This article is part of the Research TopicGenomic Discoveries and Pharmaceutical Development in Urologic TumorsView all 17 articles
 Yongsheng Huang1†
 Wenyi Guo2†
 Yuan Zeng1Xinrong Wang3Bohao Fan1Ying Zhang4
 Lei Yan1Gangli Gu1*
 Zhao Liu1*
Background: Gap junction proteins (GJPs) are a class of channel proteins that are closely related to cell communication and tumor development. The objective of this study was to screen out GJPs related prognostic signatures (GRPS) associated with clear cell renal cell carcinoma (ccRCC).
Materials and Methods: GJPs microarray data for ccRCC patients were obtained from The Gene Expression Omnibus (GEO) database, along with RNA sequencing data for tumor and paired normal tissues from The Cancer Genome Atlas (TCGA) database. In the TCGA database, least absolute shrinkage and selection Operator (LASSO) and Cox regression models were used to identify GJPs with independent prognostic effects as GRPS in ccRCC patients. According to the GRPS expression and regression coefficient from the multivariate Cox regression model, the risk score (RS) of each ccRCC patient was calculated, to construct the RS prognostic model to predict survival. Overall survival (OS) and progression-free survival (PFS) analyses; gene pan-cancer analysis; single gene survival analysis; gene joint effect analysis; functional enrichment analysis; tumor microenvironment (TME) analysis; tumor mutational burden (TMB) analysis; and drug sensitivity analysis were used to explore the biological function, mechanism of action and clinical significance of GRPS in ccRCC. Further verification of the genetic signature was performed with data from the GEO database. Finally, the cytofunctional experiments were used to verify the biological significance of GRPS associated GJPs in ccRCC cell lines.
Results: GJA5 and GJB1, which are GRPS markers of ccRCC patients, were identified through LASSO and Cox regression models. Low expression of GJA5 and GJB1 is associated with poor patient prognosis. Patients with high-RS had significantly shorter OS and PFS than patients with low-RS (p< 0.001). The risk of death for individuals with high-RS was 1.695 times greater than that for those with low-RS (HR = 1.695, 95%CI= 1.439-1.996, p< 0.001). Receiver Operating Characteristic (ROC) curve showed the great predictive power of the RS prognostic model for the survival rate of patients. The area under curve (AUC) values for predicting 1-year, 3-year and 5-year survival rates were 0.740, 0.781 and 0.771, respectively. The clinical column chart was also reliable for predicting the survival rate of patients, with AUC values of 0.859, 0.846 and 0.796 for predicting 1-year, 3-year and 5-year survival, respectively. The GRPS was associated with immune cell infiltration, the TME, the TMB, and sensitivity to chemotherapy drugs. Further in vitro experiments showed that knockdown of GJA5 or GJB1 could promote the proliferation, migration and epithelial-mesenchymal transition (EMT) and inhibit apoptosis of ccRCC cells.
Conclusion: GJA5 and GJB1 could be potential biological markers for predicting survival in patients with ccRCC.
Among all types of cancer, renal cancer is the 16th most common cancer, accounting for approximately 1.8% of cancer-related deaths (1). Clear cell renal cell carcinoma (ccRCC) is the most common histological type of cancer and represents 75% of all cases (2, 3). More than 50% of renal cancer cases are detected through health examination (4). At the time of initial diagnosis, approximately 30% of patients have already developed distant metastasis (5–7). The 5-year survival rate for patients with ccRCC varies depending on the stage of the disease. The survival rate ranges from 20% to 95% for patients in the early, middle, and advanced stages, while for patients with metastatic ccRCC, the survival rate is only between 0% and 10% (8, 9). Early diagnosis plays a crucial role in improving overall survival (OS) and progression-free survival (PFS) in ccRCC patients. Therefore, it is clinically important to explore valuable prognostic indicators that can be used for personalized prognosis assessment and treatment planning, to ultimately improve the overall prognosis of patients.
Gap junction proteins (GJPs) are a family of hexamer-structured channel proteins that facilitate molecular and ion exchange between neighboring cells, thereby regulating various biological processes (10–12). The functional diversity of GJPs is attributed to variations in the molecular weight of the constituent proteins that form the gap junction channels (13). These proteins are involved in multiple biological processes, such as apoptosis, proliferation, immune response, and digestion (14, 15). Presently, 35 genetic diseases in humans are known to result from mutations in 11 different GJPs (16, 17). In addition, the obstruction of gap junction channels diminishes communication between immune cells and reduces the permeability of chemotherapy drugs. These findings suggest that GJPs potentially play a crucial role in cancer development and treatment, as well as in maintaining intercellular signal transmission and the stability of the tumor microenvironment (TME). To our knowledge, no reports have explored the clinical significance of GJPs in ccRCC, necessitating further investigation. This study identified a GJP-related prognostic signatures (GRPS) in ccRCC. Subsequently, an in-depth analysis was conducted to explore the clinical value of the GRPS in assessing ccRCC prognosis, as well as its influence on the tumor mutational burden (TMB) and the tumor microenvironment (TME). Furthermore, additional cytological experiments validated the analysis results, providing evidence that the GRPS may serve as a novel biomarker for predicting the survival prognosis of ccRCC patients.
The RNA sequencing data, clinical trait data, pan-cancer data and simple nucleotide variation data of ccRCC were obtained from The Cancer Genome Atlas (TCGA) database (https://portal.gdc.cancer.gov/); Microarray data (GSE29609, GSE95425, GSE73731) were retrieved from Gene Expression Omnibus (GEO) database (https://www.ncbi.nlm.nih.gov/geo/). This study constructed and validated the GRPS for ccRCC prognosis using various statistical methods. The detailed workflow of this analysis is depicted in Figure 1. The general clinical information of the ccRCC patients in the TCGA database can be found in Supplementary Table 1.

Figure 1 Workflow chart.
A total of 21 GJPs were observed to be expressed in ccRCC. This study combines the survival information of ccRCC patients in the TCGA database (including survival status and survival time) with the gene expression data of GJP to generate a total sample (total sample, TS) for data analysis. Subsequently, a sequence of univariate Cox regression models (p< 0.001, KMP = 1 for filtration criteria), LASSO regression models, and multivariate Cox regression models was constructed for TS.
Pan-cancer data for 33 tumors were obtained from the TCGA database. The differential expression of GJA5 and GJB1 in 33 cancers was examined via pan-cancer analysis. The difference analysis data of GRPS in ccRCC tumor tissue and normal tissue were obtained from TCGA database and GEO database (GSE73731 and GSE95425). Single-and dual-gene combined survival (Kaplan-Meier, [KM]) analyses were used to determine the significance of GJA5 and GJB1 in survival and prognosis of patients with ccRCC.
To further explore the prognostic significance of the GRPS in ccRCC, a computation was performed based on the coefficients derived from the multivariate Cox regression model, along with the corresponding gene expression levels. Subsequently, an risk scores (RS) prognostic model was constructed utilizing the RS values. The RS formula employed in the RS model was as follows:
The high-RS group and low-RS group were divided according to the median RS. The RS prognostic model was developed and validated. The 70% of the samples randomly selected from the TS were assigned to the training dataset, while the remaining 30% of the samples and the GSE29609 dataset were used as the testing set (18), to confirm the generalizability of the GRPS. KM analysis, ROC curve analysis, and comparisons of clinical traits (including age, sex, grade, stage, and metastasis) between risk groups were also performed to assess the clinical significance of the GRPS.
This study developed a clinical nomogram incorporating patient clinicopathologic characteristics, risk groupings, and GJA5 and GJB1 expressions. Furthermore, calibration curve, ROC curve, and Decision Curve Analysis (DCA) analyses were performed to assess the clinical availability of the nomogram.
The biological function and underlying mechanisms of GRPS were investigated through gene enrichment analysis. Genes with statistical significance in the risk grouping (selected using the R package “Limma” with the criteria of p< 0.05, logFC = 1, and FDR< 1) were subjected to GO and KEGG enrichment analysis.
Alterations in the TME and the infiltration of immune cells have garnered significant attention in the field of cancer therapy. The mechanism triggering immune escape was investigated by examining the TME and immune cell infiltration in risk groups.
After the calculation of the levels of 22 immune cells and the abundance of TME-related molecules in patients with ccRCC, the differences in the levels of immune cells and the abundance of TME-related molecules between risk groups were analyzed, and p< 0.05 was considered statistically significant. TMB refers to the number of gene mutation sites that occur in tumor tissues and includes somatic gene coding errors, base substitutions, insertions or deletions (19). The TMB values of patients in the TS cohort were calculated based on simple nucleotide variation data from ccRCC patients in the TCGA database. The estimated TMB was calculated as the ratio of the total mutation frequency to the length of human exons (20). Finally, the TMB values of the ‘high-RS and low-RS groups were compared for any significant difference.
The GDSC2 dataset used for drug sensitivity analysis was derived from the GDSC database (https://www.cancerrxgene.org). We calculated the susceptibility of ccRCC patients to 198 chemotherapeutic agents from the TCGA database. To provide accurate individualized treatment plans for patients, we used p< 0.001 as the filtering standard to analyze the difference in the sensitivity of patients with advanced ccRCC to targeted drugs according to risk group, which is helpful for providing medication guidance for different groups of patients with ccRCC.
The analysis of the data and the generation of graphs were carried out with R language (version 4.2.1). The LASSO regression model, univariate and multivariate Cox regression models were constructed through the “glmnet” package; The “survival, survminer” package was used to perform KM analysis of the combined effect of a single gene and dual genes. The “timeROC” package was used to perform ROC curve analysis; The clinical nomogram was developed through the “survival”, “regplot” and “rms” packages; The “ggDCA” package was used for DCA analysis; GO enrichment analysis was carried out through the package “clusterProfiler, org.Hs.eg.db, enrichplot, ggplot2”; The “clusterProfiler, org.Hs.eg.db, enrichplot, ggplot2, circlize, RColorBrewer, ComplexHeatmap” package was used for KEGG enrichment analysis. We calculated the proportions of 22 immune cells in ccRCC tissue using the CIBERSORT algorithm and evaluated the abundance of related molecules in the TME using the R package “estimate”. The oncoPredict package was used to calculate a sensitivity score for ccRCC patients to chemotherapy drugs. The chi-square test was used to analyze the difference in clinicopathological information between the training set and the testing set. Unless otherwise stated in this paper, p< 0.05 was considered to indicate statistically significant.
The HK2 and A498 cells were cultured in Dulbecco’s modified eagle medium (DMEM) supplemented with 10% fetal bovine serum (FBS) at 37°C in a 5% CO2 incubator; the 786-O cells were cultured in Roswell Park Memorial Institute-1640 (RPMI-1640) supplemented with 10% FBS at 37°C in a 5% CO2 incubator. Cells in logarithmic phase were chosen for functional experiments. Interference of GJA5 was performed using small interfering RNA (si-GJA5-NC; si-GJA5-1, si-GJA5-2, and si-GJA5-3) sequences synthesized by RiboBio Biotechnology (Guangzhou, China). The sequences used were as follows: si-GJA5-1 (AGGCTGATTTCCGGTGTGA), si-GJA5-2 (CATGGCTATCATAGTGACA), si-GJA5-3 (AATCCCTTCAGCAATAATA). Interference of GJB1 was performed using small interfering RNA (si-GJB1-NC; si-GJB1-1, si-GJB1-2, and si-GJB1-3) sequences synthesized by RiboBio Biotechnology (Guangzhou, China). The sequences used were as follows: si-GJB1-1 (GCTGCAACAGCGTTTGCTA), si-GJB1-2 (TGTTCCGGCTGTTGTTTGA), si-GJB1-3 (CGTGAACCGGCATTCTACT). Transfection was performed using Lipofectamine 3000 (Invitrogen, Shanghai, China). The relevant experiments were conducted 48 hours post transfection.
Total RNA was extracted from HK2, A498, and 786O cells using TRIzol Reagent (Servicebio, Wuhan, China). The quality of the extracted RNA was assessed by measuring the OD ratio (A260/A280) using a Nano-400A spectrophotometer (Allsheng, Hangzhou, China). Subsequently, total RNA was transcribed into complementary DNA (cDNA) using the HiScript II Q RT SuperMix Kit (Vazyme). Amplified products were then detected using SYBR Green (Vazyme, Nanjing, China). β-actin was selected as the endogenous references. The specific primers used were GJA5: 5′-GAACACAGACAGGCAGAGGAT-3′ (F), 5′-GGAAGCTCAATCGCCCATC-3′ (R); GJB1: 5′-CCTGCACAGACATGAGACCA-3′ (F), 5′-AGAGCCATACTCGGCCAATG-3′ (R); and β-actin: 5′- CCTAGAAGCATTTGCGGT -3′ (F), 5′- GAGCTACGAGCTGCCTGACG-3′ (R).
An EdU Kit (Beyotime, Shanghai, China) was used to detect cell proliferation. Then, the A498 and 786O cells were incubated with EdU solution, fixed with 4% paraformaldehyde and infiltrated with Triton X-100 solution (Solarbio, Beijing, China). Then, the cells were stained with 4’,6-diamidino-2-phenylindole (DAPI; Beyotime, Shanghai, China). Ultimately, the EdU-positive cells (EdU+ DAPI-stained cells) were counted under a fluorescence microscope.
The cells were seeded in 6-well plates. The confluent cell cultures were then scratched using a sterile tip. The wound healing process was monitored at different time points, and images of the scratches were captured using an inverted microscope after 12 hours.
Cell migration was assessed using the transwell assay. In this assay, we seeded 1.5×10⁴ cells into the upper chamber and cultured them in a serum-free medium, while the lower chamber was supplemented with DMEM or RPMI-1640 containing 10% FBS as a chemoattractant. After 24 hours of incubation, the cells that had migrated through the pores of the transwell membrane were fixed with 4% methanol. Subsequently, the sections were stained with crystal violet, images were captured and cell counts were performed using an inverted microscope.
Total protein was extracted using radioimmunoprecipitation assay (RIPA) lysis buffer (Servicebio, Wuhan, China) supplemented with phenylmethylsulfonyl fluoride (Beyotime, Shanghai, China) at a ratio of 50:1. The protein concentration was determined using the bicinchoninic acid (BCA) assay (Solarbio, Beijing, China). Subsequently, the samples were mixed with loading buffer and boiled for 10 minutes to denature the proteins before further analysis. Subsequently, 20 μg of protein was loaded into each lane and separated by sodium dodecyl sulfate-polyacrylamide gel electrophoresis (SDS-PAGE) with an 8-15% acrylamide gradient gel. The separated proteins were then transferred onto polyvinylidene fluoride (PVDF) membranes. To prevent nonspecific binding, the membranes were blocked with 5% nonfat dry milk in Tris-buffered saline supplemented with 0.1% Tween 20 (TBST) for a period of 2 hours. Primary antibodies against GJA5 (1:1,000; ABclonal, Wuhan, China), GJB1 (1:1000; ABclonal, Wuhan, China), GADPH (1:10,000; Proteintech, Wuhan, China), E-cad (1:1000; ABclonal, Wuhan, China), N-cad (1:1000; ABclonal, Wuhan, China), VIM (1:1000; ABclonal, Wuhan, China), Bax (1:1000; ABclonal, Wuhan, China), and Bcl-2 (1:1000; ABclonal, Wuhan, China) were incubated with the membrane overnight at 4°C. After the membranes were washed with TBST for 10 minutes, they were incubated with secondary antibodies (1:5000; Proteintech, Wuhan, China) for 2 hours, after which the membranes were washed 3 times with TBST. Finally, electrochemiluminescence (ECL, Thermo, China) was applied to visualize the results.
Apoptosis was detected with an annexin V apoptosis kit (Vazyme, Jiangsu, China). Fluorescence-activated cell sorting (FACS) was performed on a BD Accuri® C6 Plus [Becton, Dickinson, and Co. (BD) Biosciences, Franklin Lakes, NJ, USA] and analyzed by FlowJo software (https://www.flowjo.com/). Briefly, 1×10⁶ cells were collected and resuspended after adding 100 μL of binding buffer. Next, 100 μL of binding buffer containing 4 μL of annexin V-FIFC and 4 μL of propidium iodide (PI) staining solution were added. Finally, 400 μL of binding buffer was added to the culture tube, which was subsequently analyzed after 10 to 15 minutes using flow cytometry.
All the statistical analyses were conducted using GraphPad Prism 8.0 software. Significance was determined using Student’s t-test or one-way analysis of variance (ANOVA), as appropriate. Each experiment was performed in triplicate, and p< 0.05 was considered to indicate statistical significance.
Firstly, a univariate Cox regression model for TS was constructed in this study, yielding five OS-related GJPs (OR-GJPs) that were most significantly related to the patients’ OS. To prevent data overfitting, a LASSO regression model for OR-GJPs was constructed (Figures 2A, B). Ultimately, a multivariate Cox regression model was constructed based on the outcomes of the LSAAO regression analysis. This model identified two genes (Gene GJA5 and Gene GJB1) with independent prognostic impacts on ccRCC (Table 1), which were identified as GRPS genes for subsequent data examination, clinical validation, and cellular functional experiments. The univariate Cox regression analysis for all 21 GJPs and the corresponding KM survival analysis for 5 GJPs with differential survival significance can be found in Supplementary Table 2 and Supplementary Figure 1.
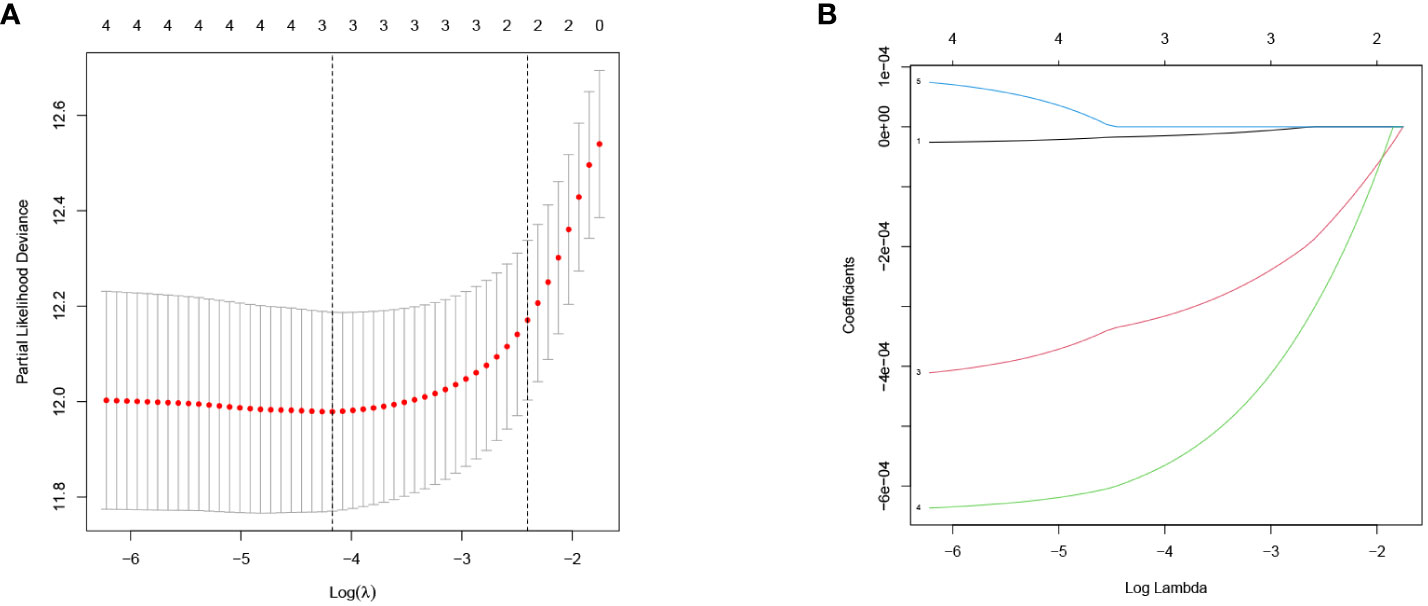
Figure 2 LASSO regression model of OR-GJPs: (A) Coefficient distribution diagram. (B) Parameter change diagram.
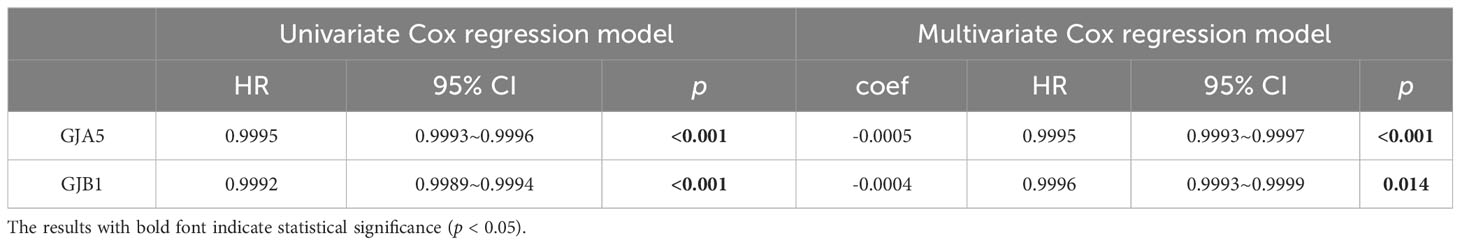
Table 1 Univariate and multivariate Cox regression models of GRPS.
The Pan-cancer analysis revealed that GJA5 exhibited the highest expression level in ccRCC, whereas GJB1 was the 12th highest in terms of expression in ccRCC (Supplementary Figures 2A, B). Notably, GJA5 and GJB1 were differentially expressed between tumor tissues and matched normal tissues in 15 distinct cancers (Supplementary Figures 2C, D), including breast invasive carcinoma, renal chromophobe cell carcinoma, renal clear cell carcinoma, renal papillary cell carcinoma, endometrial carcinoma, thyroid carcinoma, prostate cancer, hepatocellular carcinoma, and lung squamous cell carcinoma. These findings suggested that GJA5 and GJB1 might play crucial roles in the development and progression of urological tumors, as well as a variety of human malignant tumors. These findings warrant further in-depth investigation. Employing the TS dataset, a comprehensive analysis was conducted to examine the differences in gene expression between GJA5 and GJB1 in tumor tissues and normal tissues. The findings demonstrated that both GJA5 and GJB1 exhibited decreased expression in tumor tissues and elevated expression in normal tissues (p< 0.001) (Figures 3A, B). These findings suggested that the expression of GJA5 and GJB1 was repressed during the occurrence of ccRCC, a phenomenon that was consistent with that observed in additional independent cohorts (GSE73731, GSE95425) (Figures 3C, D). Finally, this study further validated the differential expression of GJA5 and GJB1 in ccRCC using the oncopression database (http://www.oncopression.com/downloads.html) (Supplementary Figure 3. The results showed that the expression of GJA5 and GJB1 in normal tissue of ccRCC was significantly higher than that in tumoral tissue. Ultimately, the prognostic significance of GJA5 and GJB1 was further assessed. In the TS dataset, KM analysis revealed a significant correlation between low expression of GJA5 and GJB1 and a shorter OS (p< 0.05) (Figures 3E, F). Patients exhibiting concurrent low expression of GJA5 and GJB1 had the shortest OS, while those with high expression of GJA5 and GJB1 had a prolonged OS (Figure 3G). Given the results of the differential expression analysis, we speculated that GJA5 and GJB1 act as tumor suppressors in ccRCC.
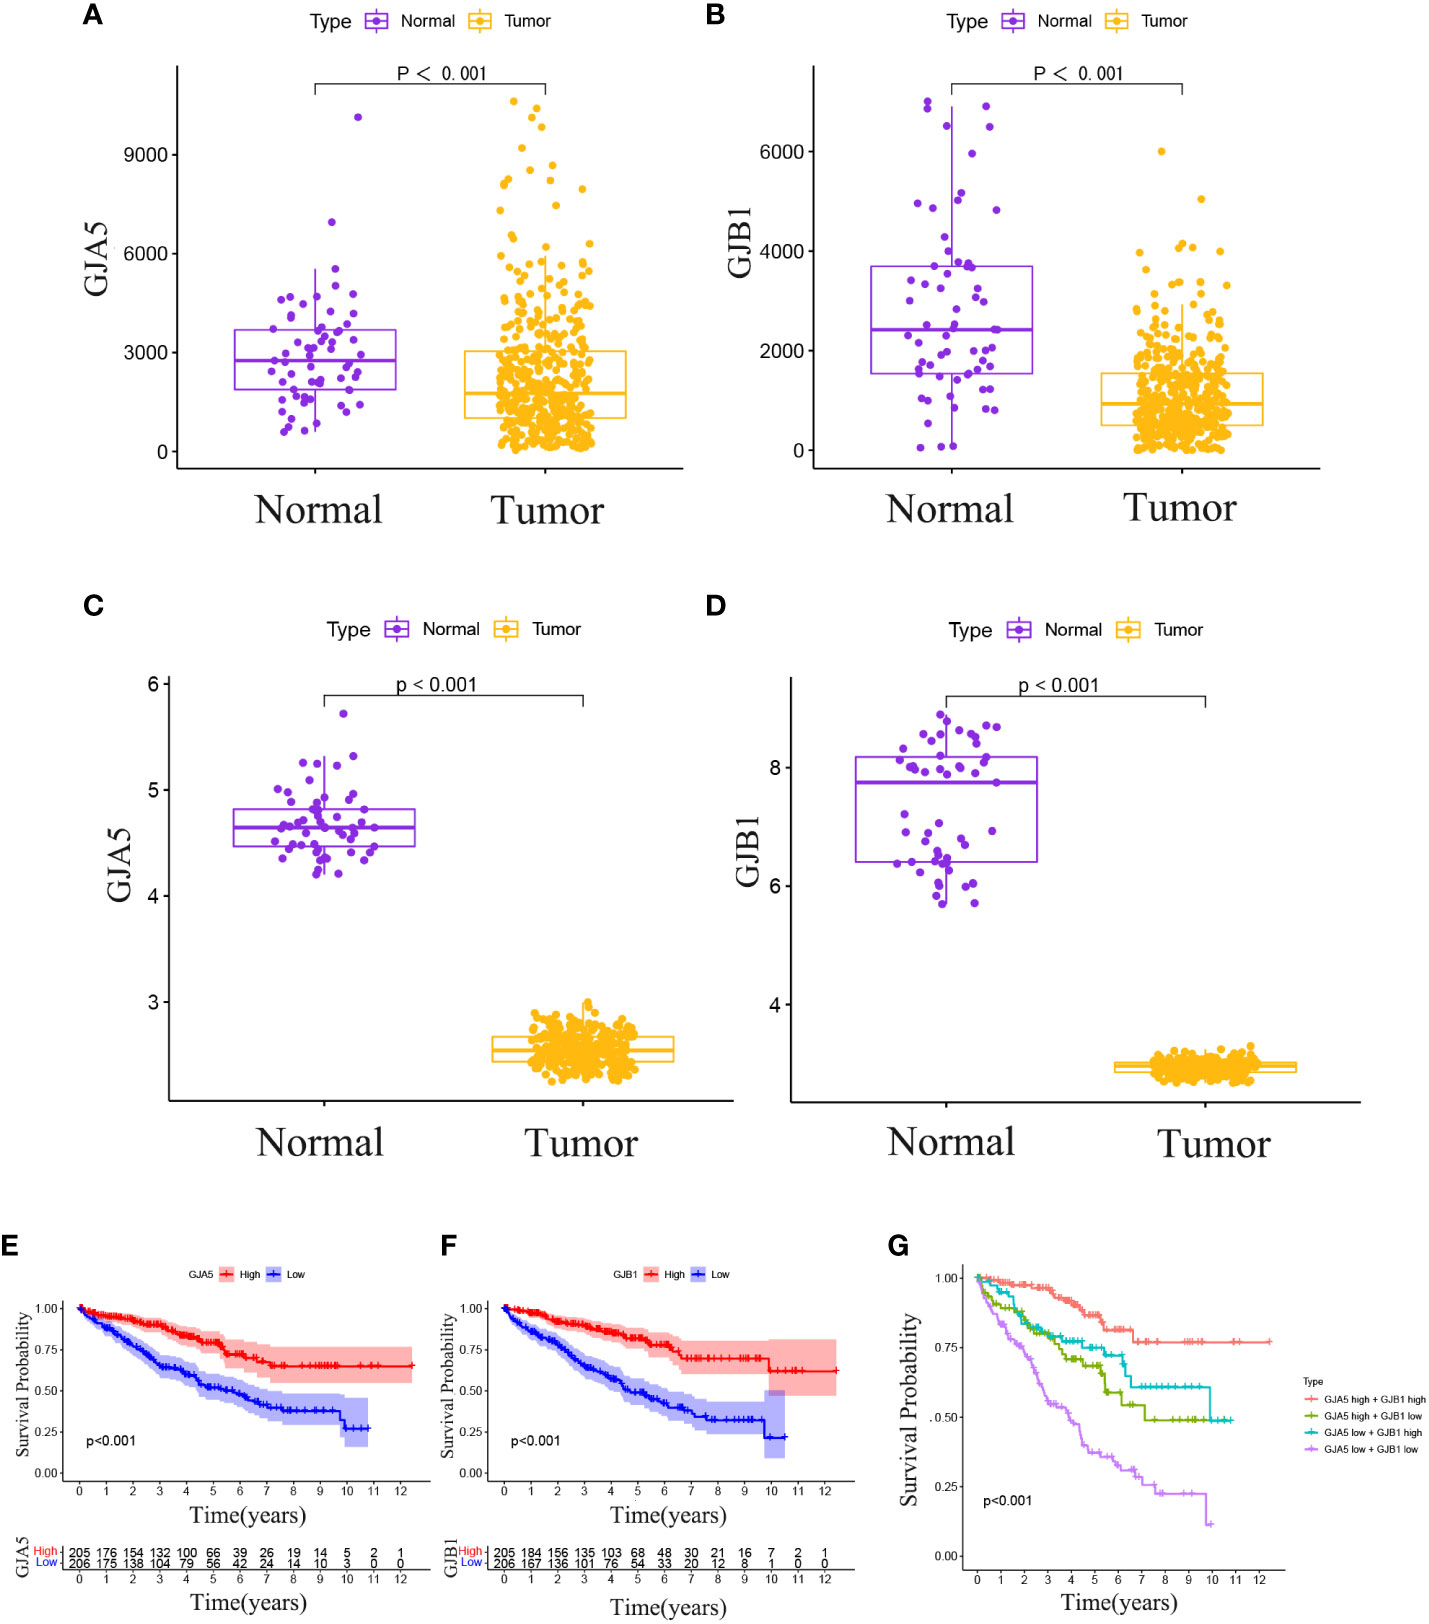
Figure 3 (A) In the TCGA database, differential expression of GJA5 in tumor tissues and paired normal tissues. (B) In the TCGA database, differential expression of GJB1 in tumor tissues and paired normal tissues. (C) Differential expression of GJA5 in ccRCC in the GEO database. (D) Differential expression of GJB1 in ccRCC in the GEO database. (E) KM analysis of GJA5 in ccRCC in the TCGA database. (F) KM analysis of GJB1 in ccRCC in the TCGA database. (G) Analysis of the combined effect of GJA5 and GJB1 in ccRCC in the TCGA database.
The RS for each patient was calculated using the following formula:
The OS and PFS of patients in the high-RS subgroup were markedly inferior to those in the low-RS subgroup (p< 0.001) (Figures 4A, B). A prognostic model for RS was developed, encompassing hazard curves, survival scatter plots, and heatmaps of GJA5 and GJB1 expression. The model revealed that patients in the high-RS subgroup exhibited shorter survival, greater mortality, and decreased GJA5 and GJB1 expression (Figure 4C). The ROC curve demonstrated that the RS prognostic model exhibited a potent ability to predict patient survival rates (the AUC for predicting 1-year, 2-year, and 3-year survival rates were 0.740, 0.781, and 0.771, respectively). In comparison with other clinical traits, the RS model exhibited strong credibility in predicting patient survival rates (Figures 4D, E). Finally, the differences in clinical characteristics between the high-RS and low-RS subgroups were verified. The findings indicated that, in the high-RS subgroup, ccRCC patients exhibited a greater malignancy grade and a greater probability of tumor metastasis, with a greater proportion of male patients than female patients (Table 2).
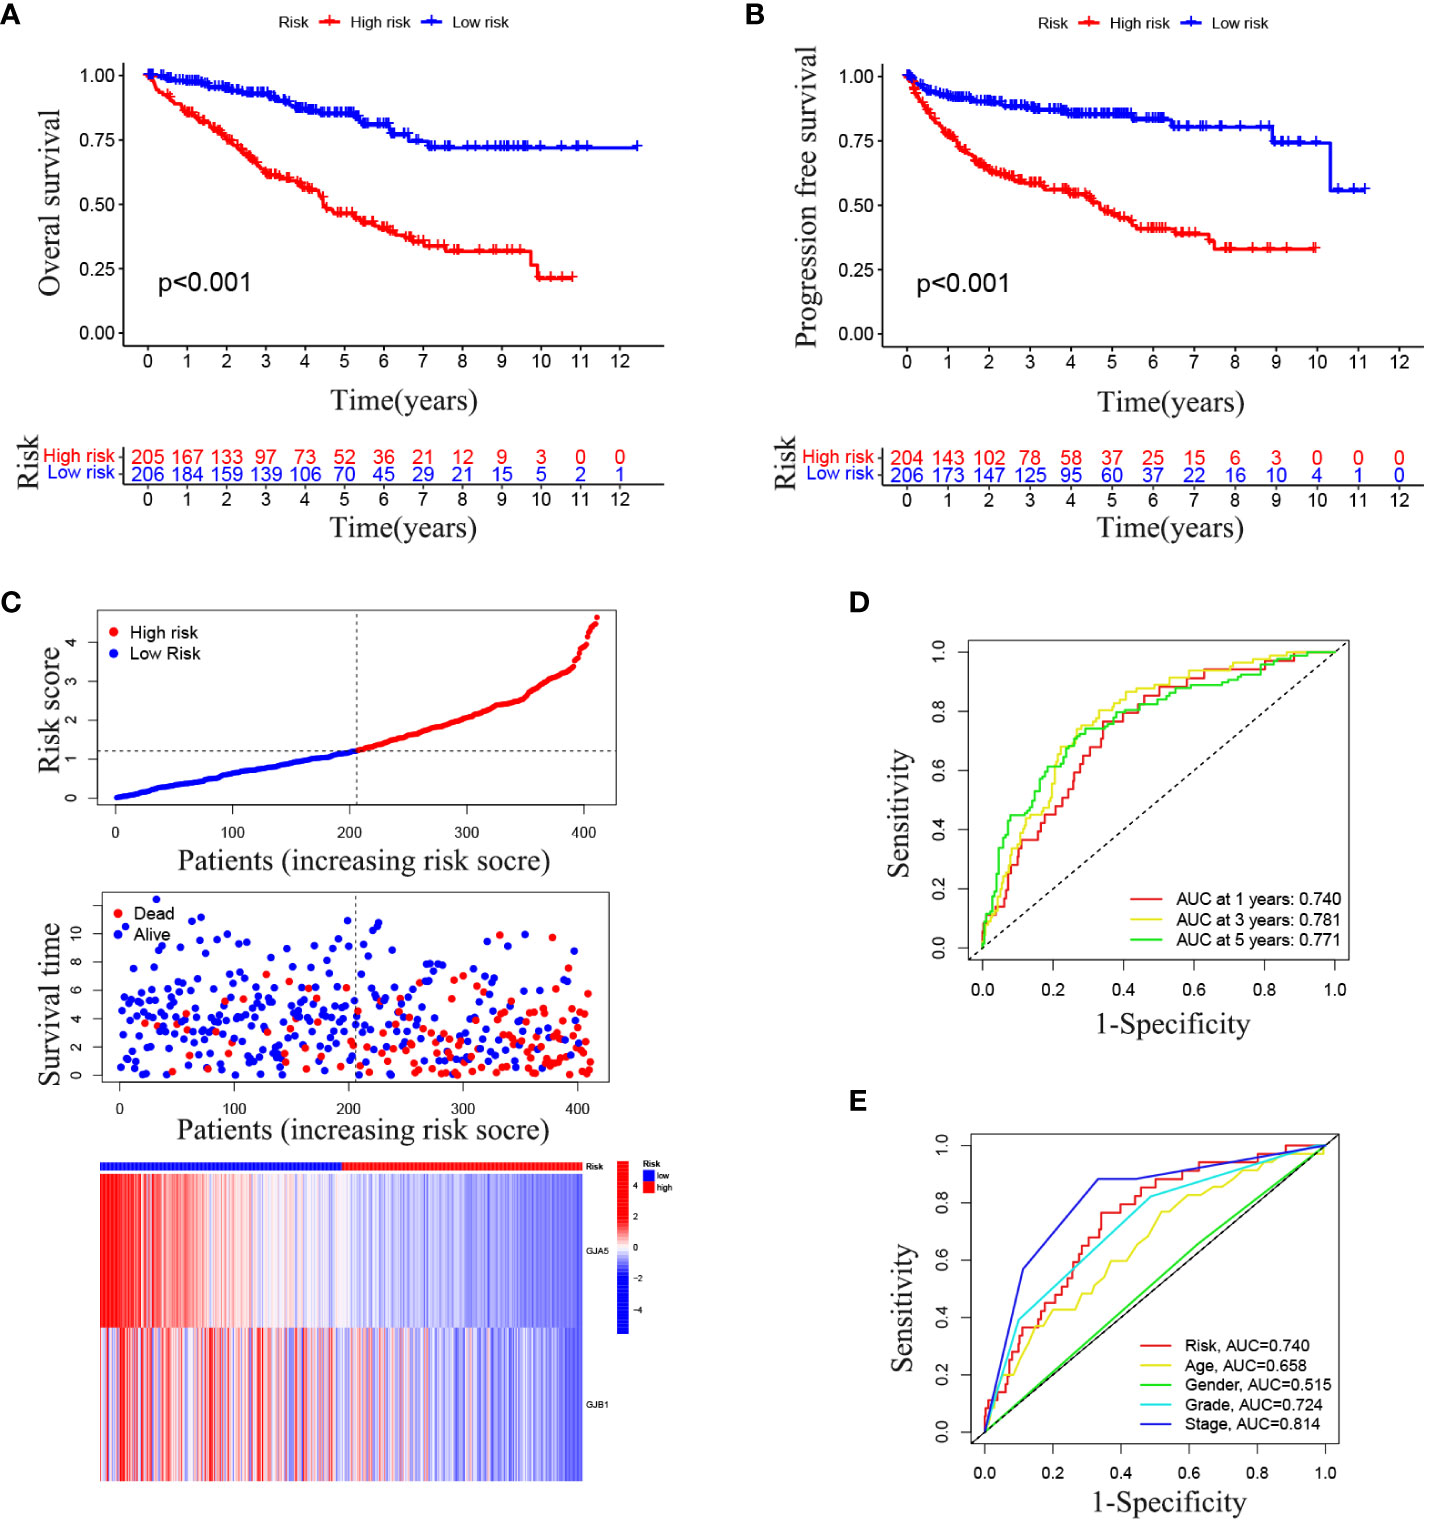
Figure 4 (A) OS analysis between the high-RS score group and low-RS score group. (B) PFS analysis between the high-RS score group and low-RS score group. (C) RS prognosis model for TS (including the RS curve, survival time and survival status of patients, and GRPS gene expression). (D, E) ROC curve of the RS prognosis model of TS.
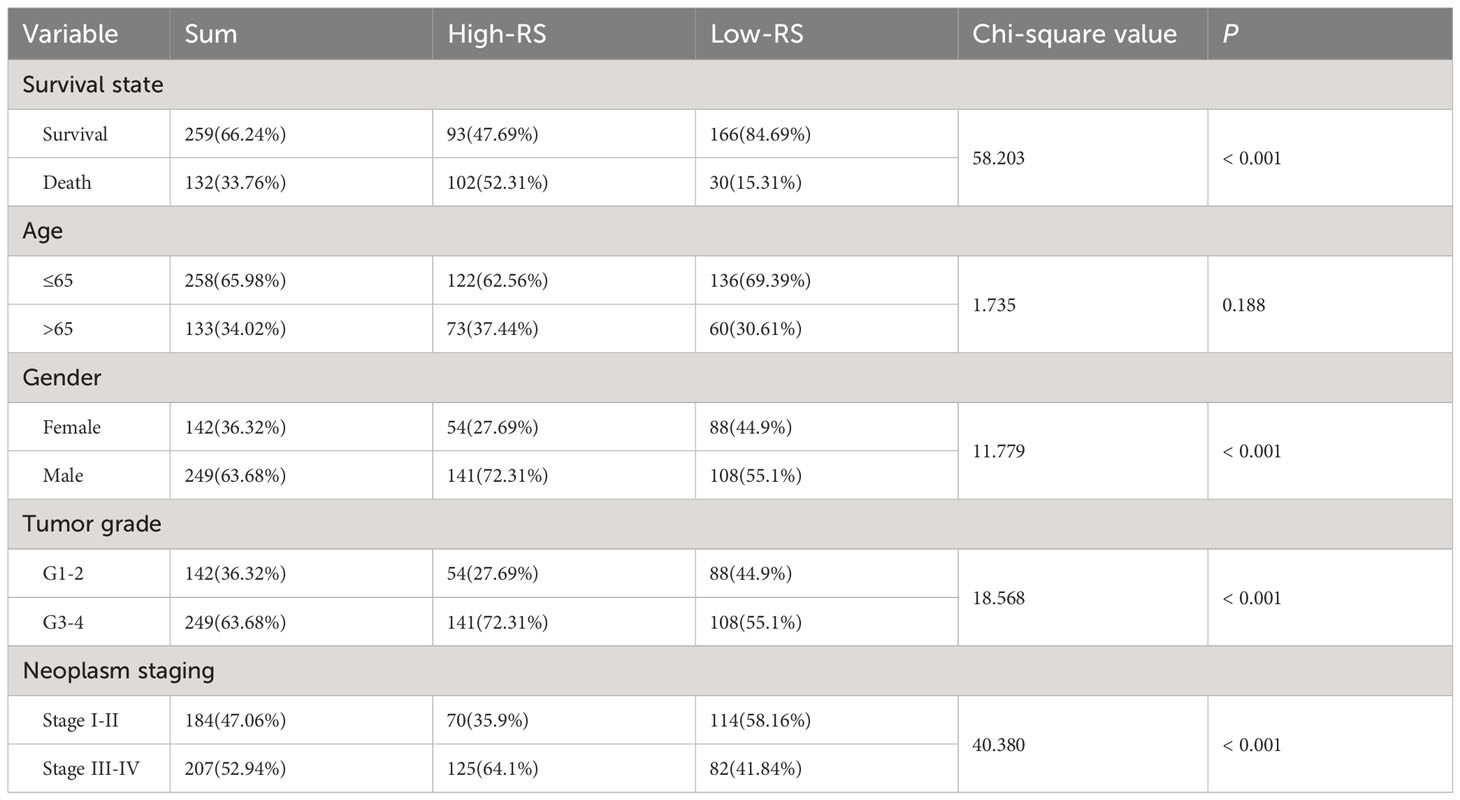
Table 2 Differential analysis of clinicopathological parameters between the high-RS subgroup and the low-RS subgroup.
Combined with the GSE29609 dataset, a training set and a testing set of TSs were constructed to assess the prognostic significance of the GRPS in ccRCC. The chi-square test revealed no significant differences in the clinicopathological traits between the training and testing sets (Table 3), indicating that the study’s grouping was random and reasonable. In both the training and testing sets, patients in the high-RS subgroup exhibited significantly poorer OS and PFS than did those in the low-RS subgroup (Figures 5A, B, E, F). Subsequently, the RS prognostic model was constructed on the training cohort and validated using ROC curve analysis (Figures 5C, D). These results align with those for TS, demonstrating that the RS prognostic model in the training cohort was also reliable at predicting the patient survival status (the AUC for predicting 1-year, 3-year, and 5-year survival rates were 0.750, 0.778 and 0.775, respectively). Finally, comparable outcomes were obtained in the testing cohort (Figure 5G). The AUC of the RS prognostic model in the testing cohort for predicting 1-year, 3-year, and 5-year survival was 0.708, 0.696, and 0.741, respectively (Figure 5H).

Table 3 Analysis of differences in clinical traits between training set and testing set n (n%).
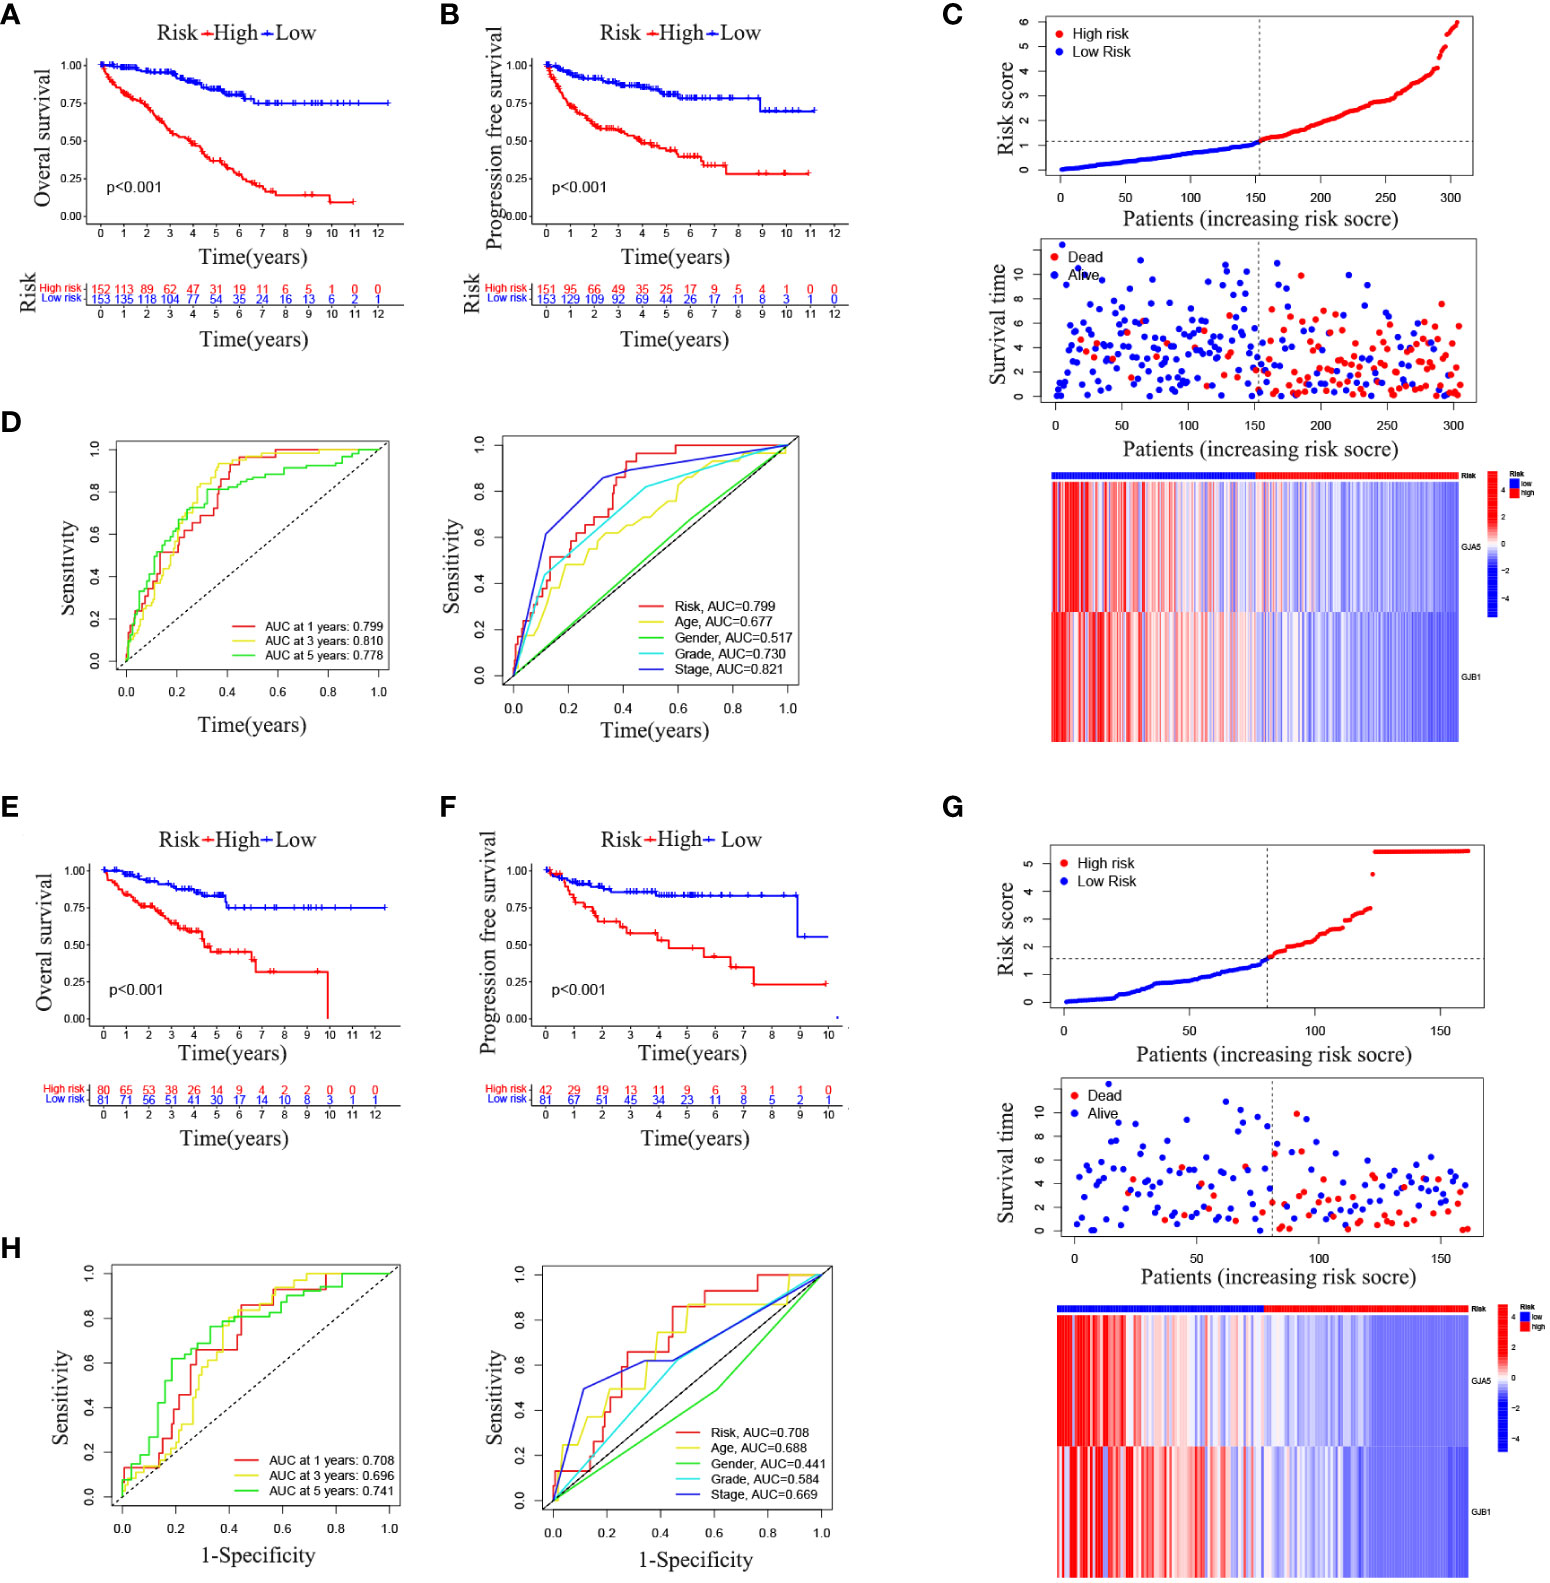
Figure 5 (A) OS analysis results in the training set. (B) PFS analysis results in the training set. (C) RS prognostic model in the training set. (D) ROC curve analysis of the RS prognostic model in the training set. (E) OS analysis results in the testing set. (F) PFS analysis results of testing set. (G) RS prognostic model of testing set. (H) ROC curve analysis of the RS Prognostic model in the testing Set.
To further explore the relationship between the RS prognostic model and clinical characteristics, univariate and multivariate stepwise Cox analysis were performed. The results showed that risk score, age, and tumor stage were closely associated with survival time and clinical outcomes of ccRCC patients, and could serve as independent prognostic factors (Table 4). The risk of death for individuals with high-RS was 1.695 times greater than that for those with low-RS (HR = 1.695, 95%CI = 1.439-1.996, p< 0.001).
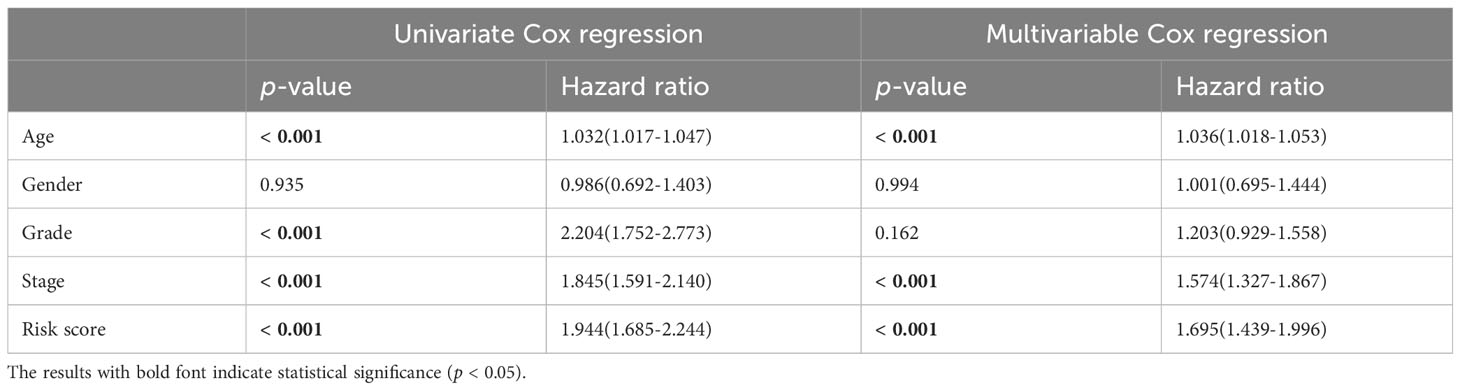
Table 4 Univariate and multivariate stepwise Cox regression analysis of RS and clinical characteristics in ccRCC.
A nomogram incorporating clinicopathological traits (tumor grade, tumor stage), the gene expression pattern of the GRPS, and risk grouping was constructed to assist clinicians in making initial predictions of OS in ccRCC patients (Figure 6A). The clinical nomogram was subsequently validated. The calibration curves demonstrated good agreement between the predicted probabilities generated by the nomogram and the actual observed OS values at 1, 2, and 3 years (Figure 6B). The results of the ROC curve and DCA analyses revealed that the nomogram exhibited excellent reliability in predicting the survival rate of ccRCC patients (the AUC of the nomogram for predicting the survival rate of patients at 1, 3 and 5 years was 0.876, 0.853 and 0.816, respectively) (Figure 6C).
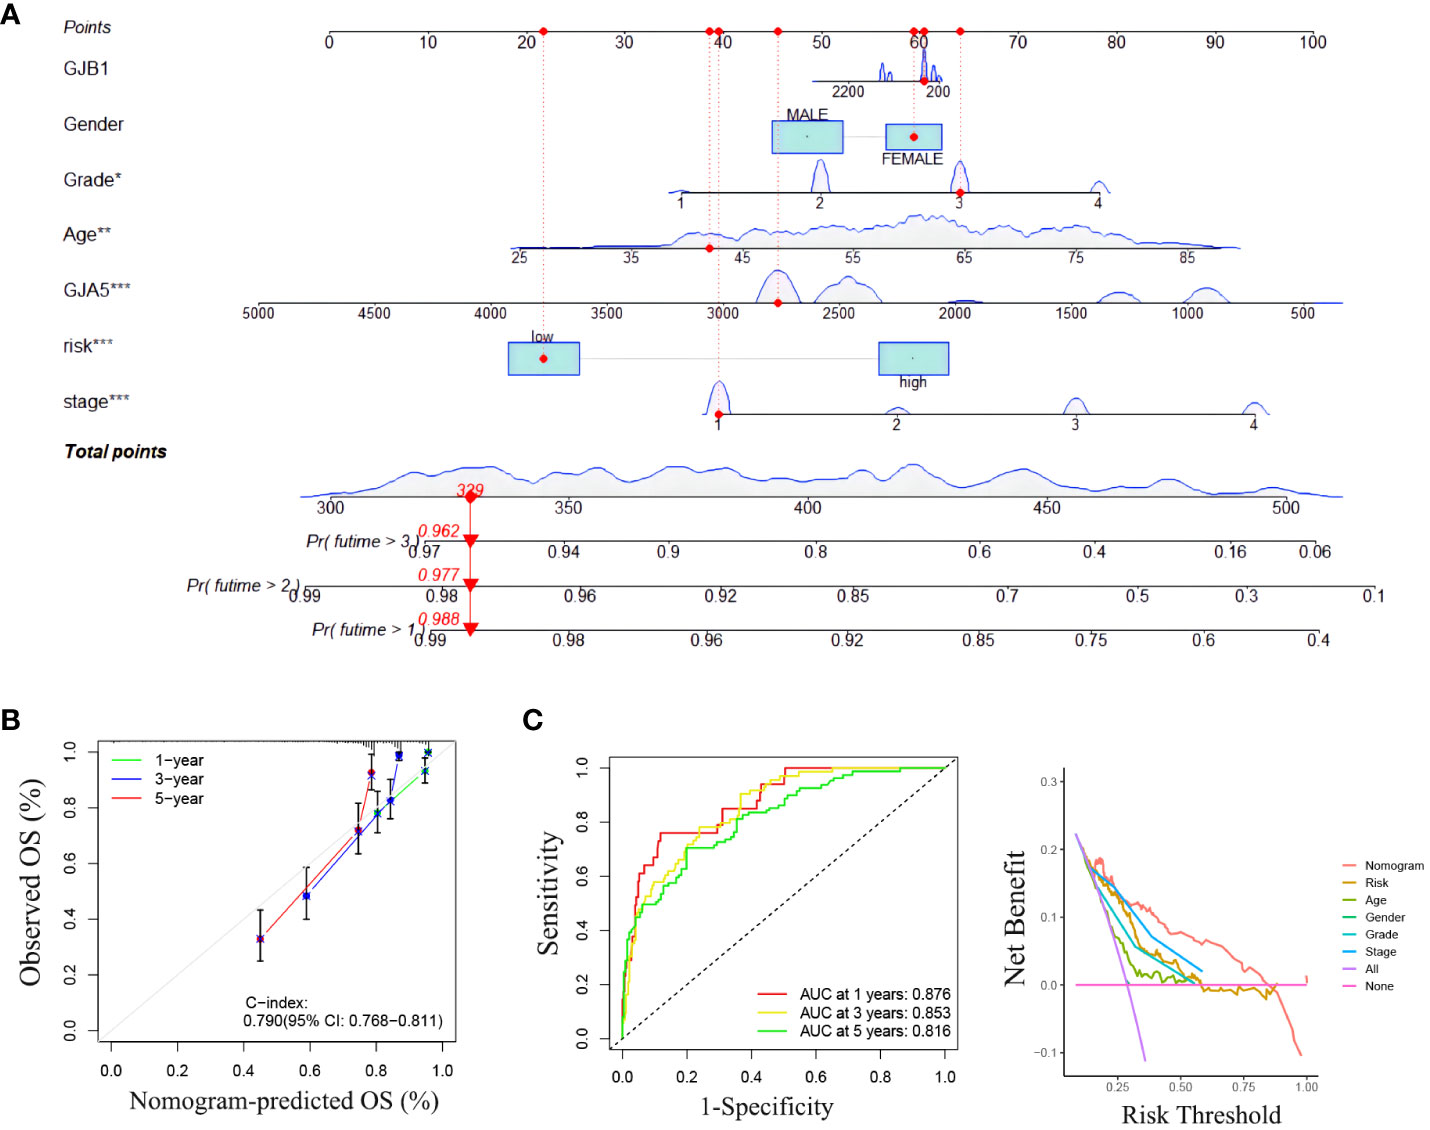
Figure 6 (A) Clinical nomogram. (B) The calibration curve for predicting 1-year, 3-year and 5-year survival rates with a nomograph. (C) ROC curve and DCA curve of the nomogram.
Among the total differential expressed 899 genes, 540 genes were highly expressed in the high-RS subgroup, while the other 359 genes exhibited high expression in the low-RS subgroup (Supplementary Figure 4). To determine the biological functions and pathways active in the high-RS subgroup, further exploration was conducted. The results of GO enrichment analysis (Figure 7A) revealed that Biological Processes such as “negative regulation of proteolysis”, Cellular Component such as “collagen-containing extracellular matrix”, and Molecular Function such as “enzyme inhibitor activity” were enriched in the high-RS population. Additionally, KEGG enrichment analysis indicated that “neuroactive ligand-receptor interaction”, “cAMP signaling pathway”, “cytokine-cytokine receptor interaction”, “adrenergic signaling pathway in cardiomyocytes”, “GnRH secretion”, and “TGF-beta signaling pathway” were enriched in high-RS population (Figure 7B).
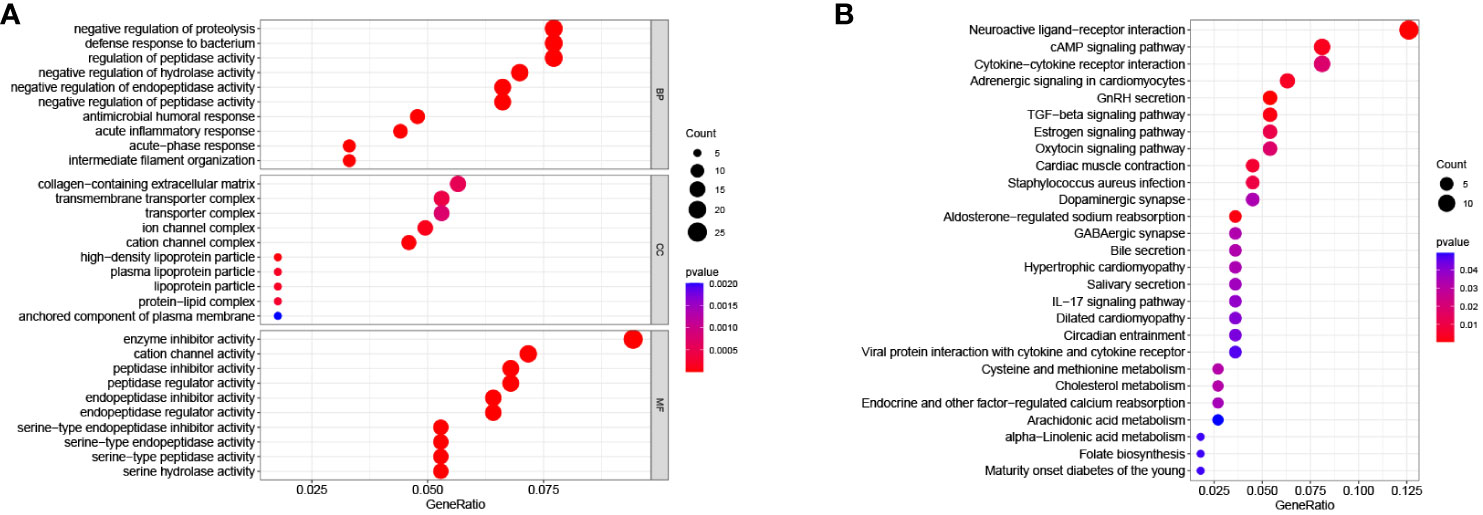
Figure 7 (A) GO enrichment analysis. (B) KEGG enrichment analysis.
Differences in 22 immune cell types and TMB in the RS group were investigated. Patients in high-RS subgroup presented with higher TMB than that in low-RS subgroup (Figure 8A). Compared to those in the low-RS subgroup, the TME in the high-RS subgroup exhibited greater immune cell infiltration and a lower stromal cell content (Figures 8B, C). As for TME-related molecular abundance, statistically significant differences were detected for naive B cells (p< 0.05), T cell follicular helper cells (p< 0.001), regulatory T cells (p< 0.05), M0 macrophages (p< 0.05), stationary dendritic cells (p< 0.01), stationary mast cells (p< 0.01), immune cell content (p< 0.05) and stromal cell content (p< 0.001)(Figure 8D). These findings offer a new perspective for exploring the mechanism of individualized immunotherapy in ccRCC patients and the role of GJPs in the occurrence and development of ccRCC. And low expression of GJA5 and GJB1 might be associated with an imbalance in immune homeostasis and compromised responses to immunotherapy in ccRCC patients.
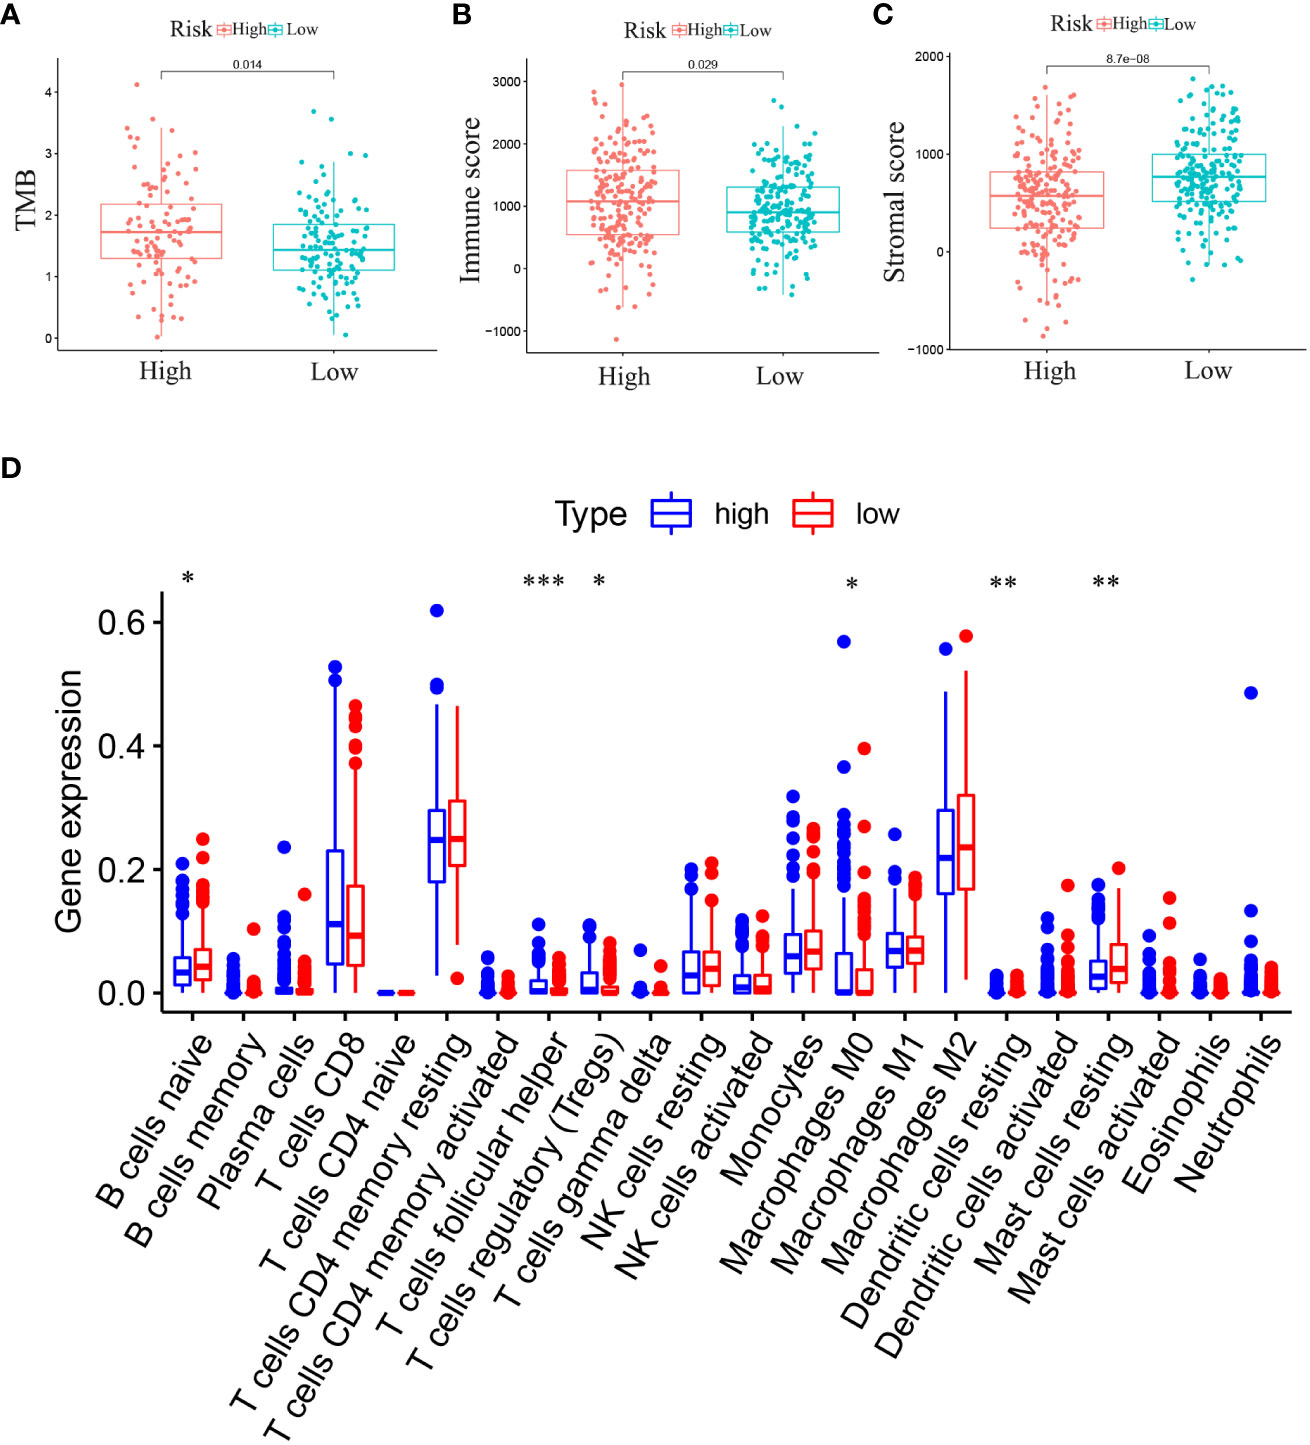
Figure 8 (A) Analysis of the difference in TMB between high-RS and low-RS groups. (B) Analysis of the Difference in Immune Score between high-RS and low-RS Groups. (C) Analysis of the Difference in Stromal Score between high-RS and low-RS Groups. (D) Differential expression of immune cells between high-RS and low-RS groups (Immune cell content in the low-RS group is represented in red, and that in the high-RS group is represented in blue. (*p< 0.05, **p< 0.01, ***p< 0.001).
Drug sensitivity analysis of commonly used chemotherapeutic drugs for ccRCC was conducted based on the RS grouping (Figures 9A-E). Among the several chemotherapy drugs used to treat advanced ccRCC, erlotinib (p< 0.001), axitinib (p = 0.0029), afatinib (p< 0.001), rapamycin (p< 0.001), and sorafenib (p< 0.001) were found to be significantly different among the risk groups. Notably, axitinib exhibited lower sensitivity in the low-RS subgroup, while afatinib, erlotinib, rapamycin, and sorafenib had lower sensitivity in the high-RS subgroup. These findings offer new insights into individualized targeted drug therapy for patients with advanced ccRCC.
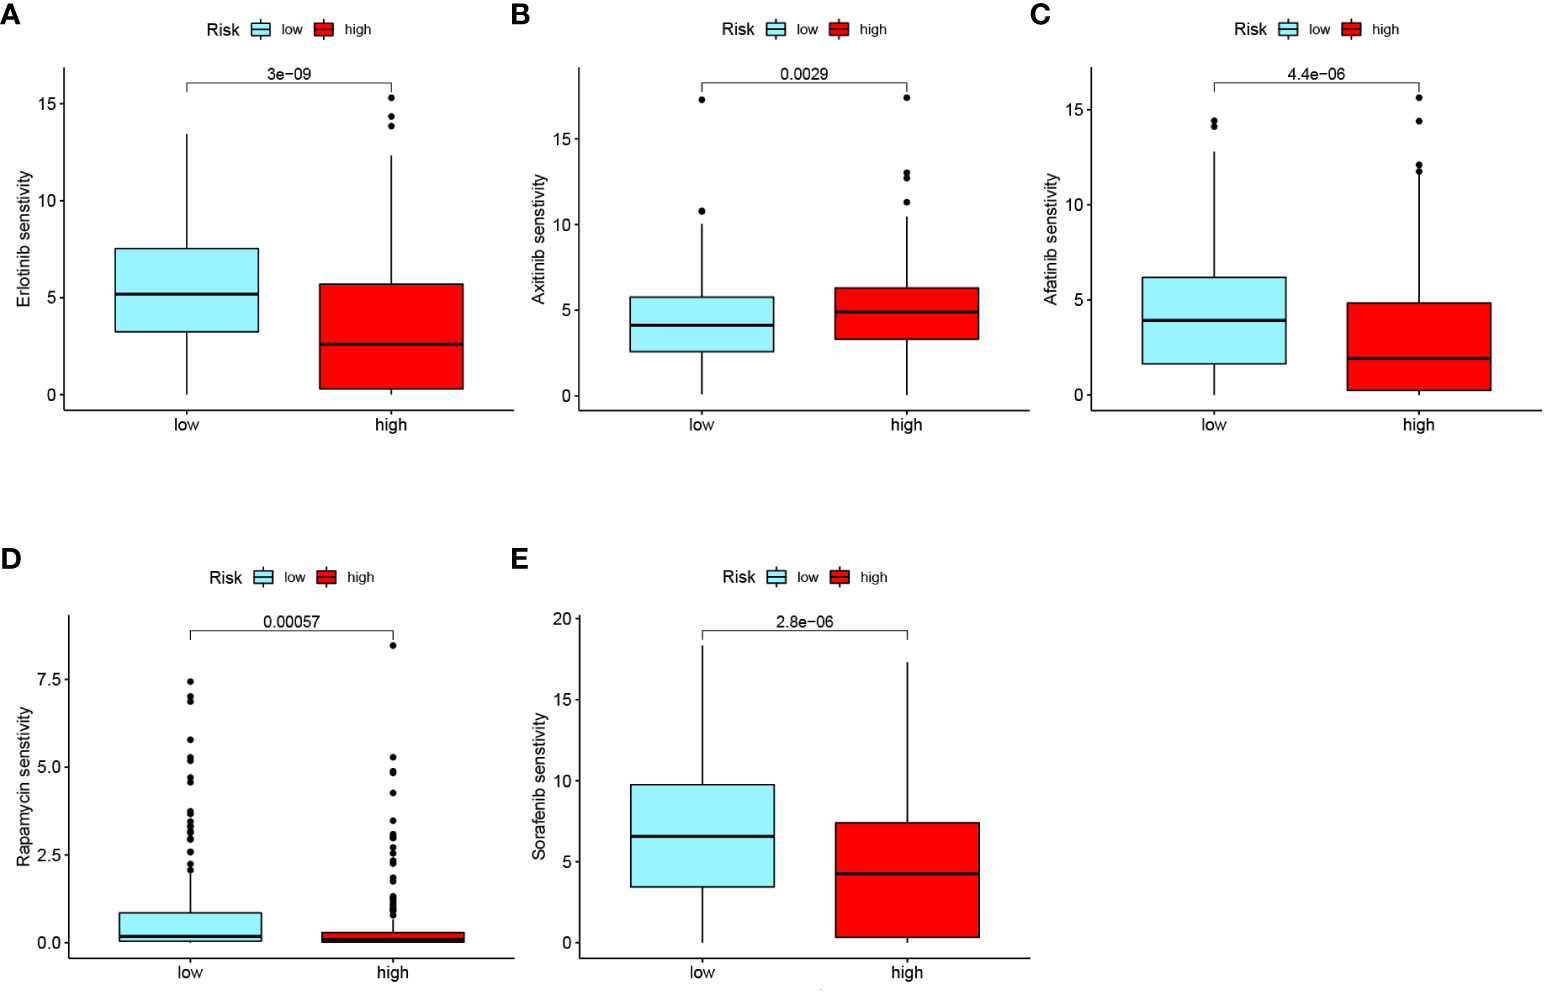
Figure 9 Drug sensitivity analysis of common chemotherapeutic drugs in ccRCC risk groups: (A) Erlotinib. (B) Axitinib. (C) Afatinib. (D) Rapamycin. (E) Sorafenib.
Furthermore, the expression of GJA5 and GJB1 at the protein level was detected via Western blot analysis, and the expression of GJA5 and GJB1 at the RNA level was detected via qRT-PCR. qRT-PCR revealed that the mRNA levels of GJA5 and GJB1 in renal tumor cells (A498 and 786-O) were lower than those in noncancerous renal cells (HK2) (Figure 10A) and this pattern was confirmed at the protein level (Figure 10B). Moreover, according to the qRT-PCR and Western blot detection results, at both the RNA and protein expression levels, GJB1 was expressed at higher levels in A498 cells, while GJA5 was expressed at higher levels in 786-O cells. Therefore, functional experiments were conducted to knock down GJB1 in the A498 cell line and GJA5 in the 786-O cell line.
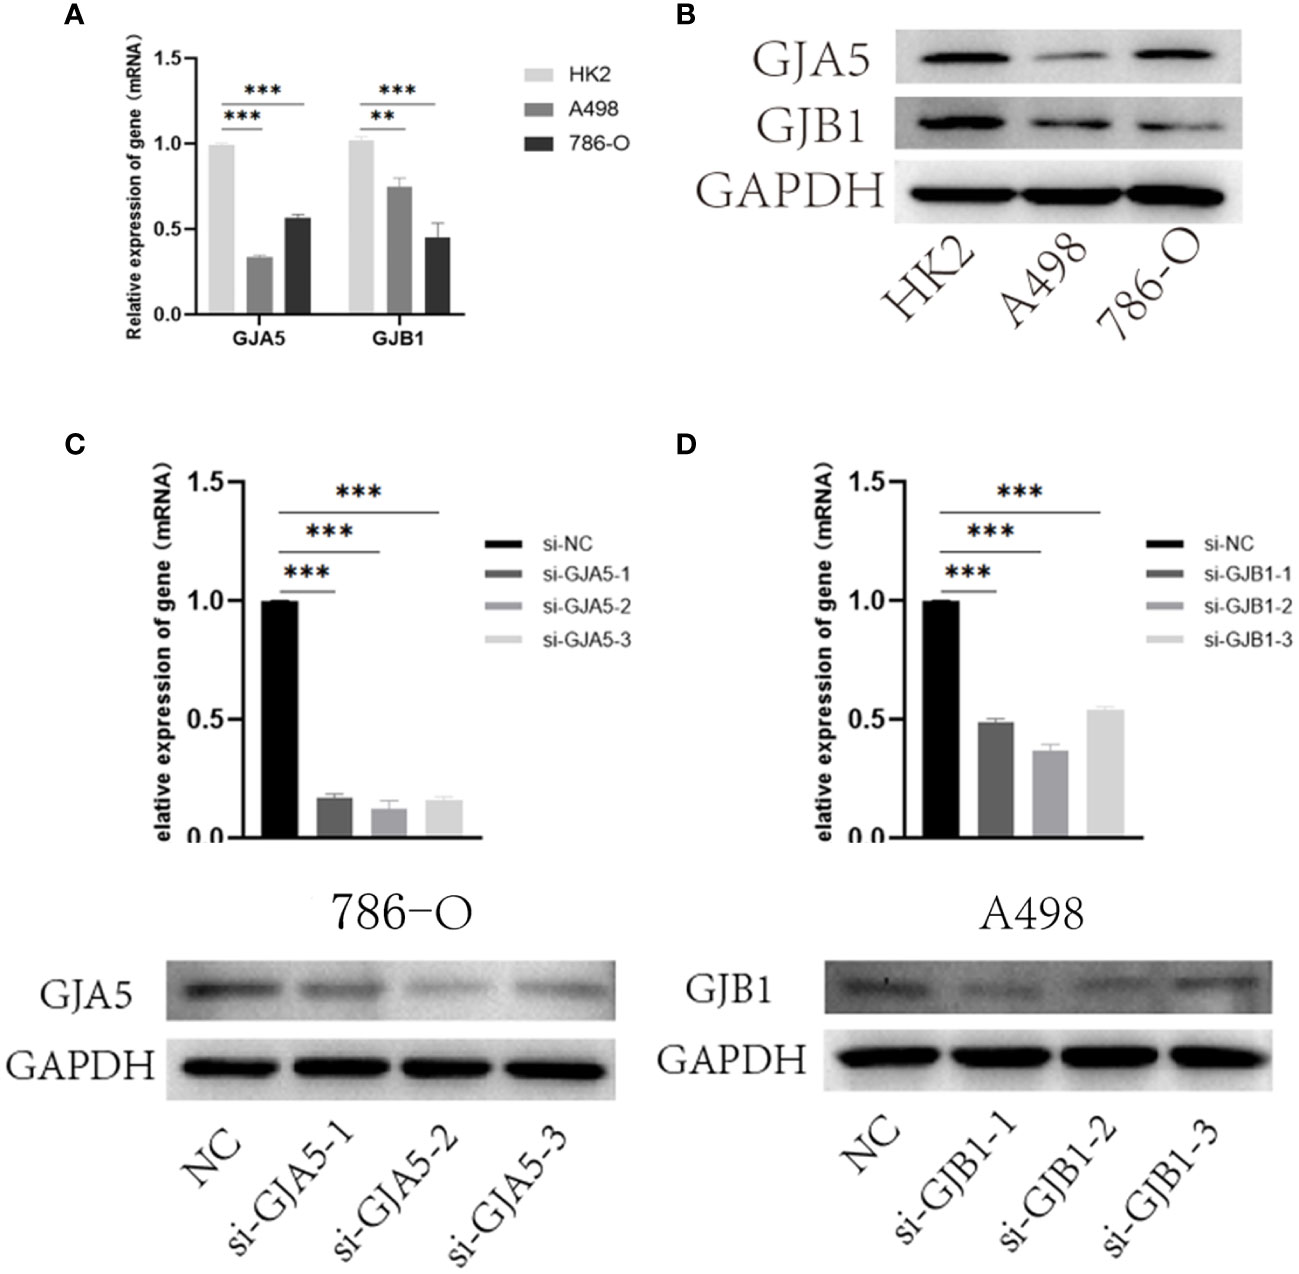
Figure 10 (A) qRT-PCR results of GJA5 and GJB1 expression at the RNA level. (B) Western blot results of GJA5 and GJB1 expression at protein level. (C) qRT-PCR and Western blot results of GJA5 in 786-O cells after transfection with three small interfering RNAs. (D) qRT-PCR and Western blot results of GJB1 in A498 cells after transfection with three small interfering RNAs. (*p< 0.05, **p< 0.01, ***p< 0.001).
Furthermore, to investigate the effects of GJA5 and GJB1 interference on the cytological behavior of ccRCC cells, at least three independent cell experiments were conducted (Figures 10C, D). The expression of GJA5 in the 786-O cell line and GJB1 in the A498 cell line were specifically targeted and knocked down by chemically synthesized siRNA. Western blot analysis revealed that si-GJA5-2, si-GJA5-3, si-GJB1-1 and si-GJB1-2 had relatively high knockdown efficiencies. Therefore, the above four kinds of siRNAs were selected for subsequent cell behavioral experiments.
CCK-8 and EdU assays demonstrated that cell viability was sharply increased in the si-GJA5 and si-GJB1 groups (Figures 11A, B). Similarly, transwell and wound healing assays demonstrated that cell migration increased significantly after GJA5 and GJB1 were knocked down (Figures 11C, D). Western blot analysis revealed that after GJA5 or GJB1 knockdown, the expression of E-cad and Bax in ccRCC cells decreased, while the expression of N-cad, VIM and Bcl-2 increased (Figures 12A, B). Flow cytometry showed that knockdown of GJA5 or GJB1 inhibited cells apoptosis (Figure 12C). Collectively, these results indicate that GJA5 and GJB1 may inhibit ccRCC development.
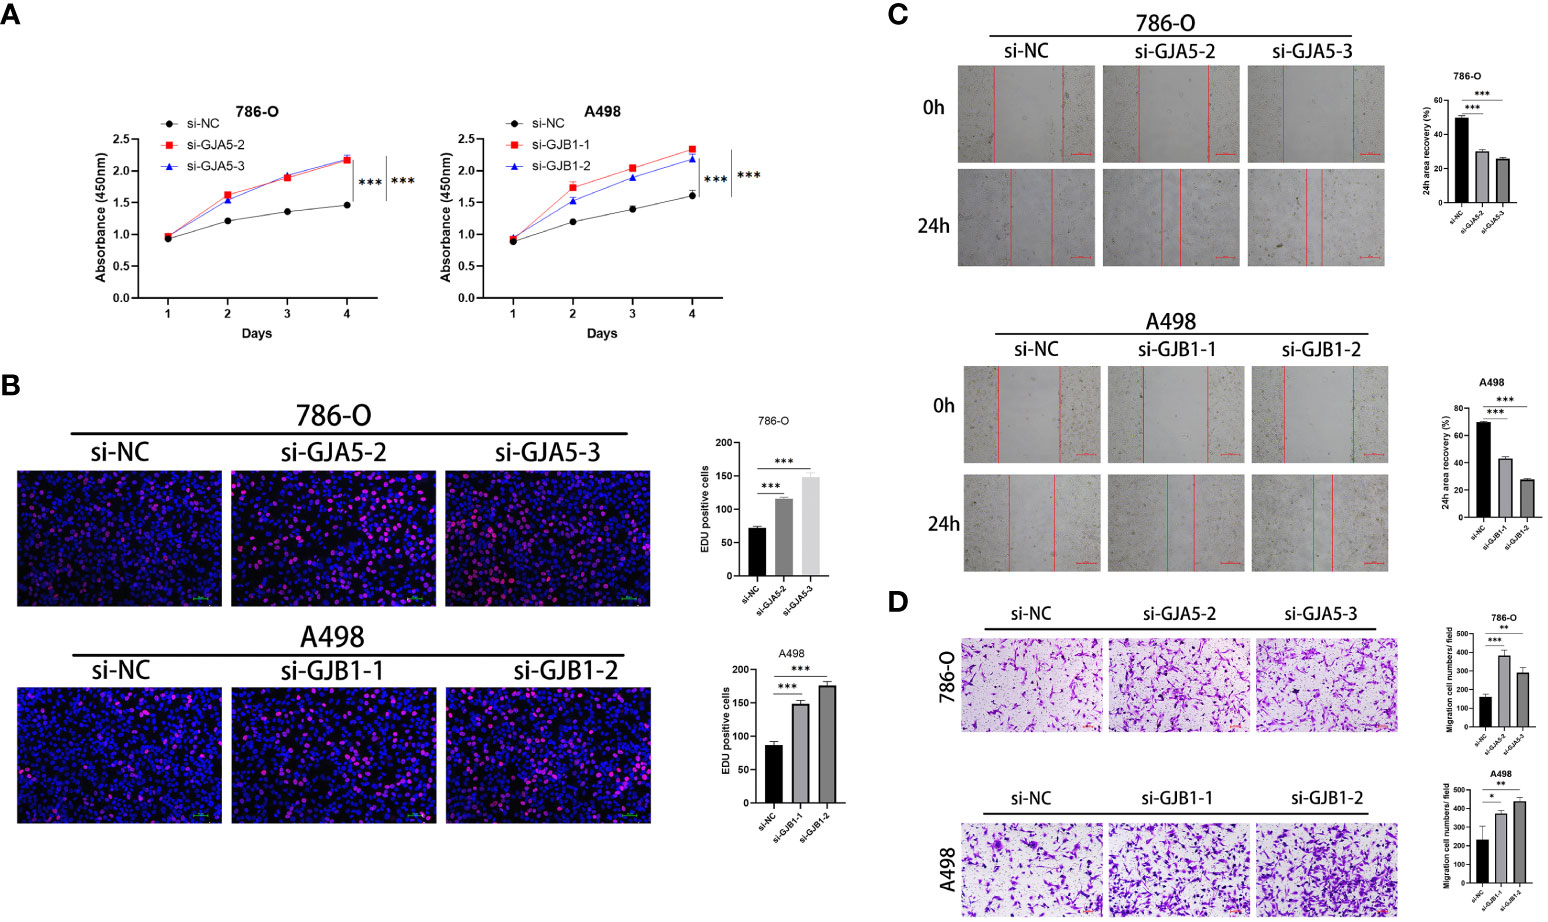
Figure 11 (A) The CCK8 experiment results of GJA5 and GJB1 knockdown on the cell proliferation in 786-O cells and A498 cells, respectively. (B) The EdU experiment results of GJA5 and GJB1 knockdown on the cell proliferation in 786-O cells and A498 cells, respectively (Error bar = 50 μm). (C) The cell scratch test results of GJA5 and GJB1 knockdown on the cell migration in 786-O cells and A498 cells, respectively (Error bar = 500 μm). (D) The Transwell experiment results of GJA5 and GJB1 knockdown on the cell migration potential in 786-O cells and A498 cells, respectively (Error bar = 100 μm). (*p < 0.05, **p < 0.001, ***p < 0.01).
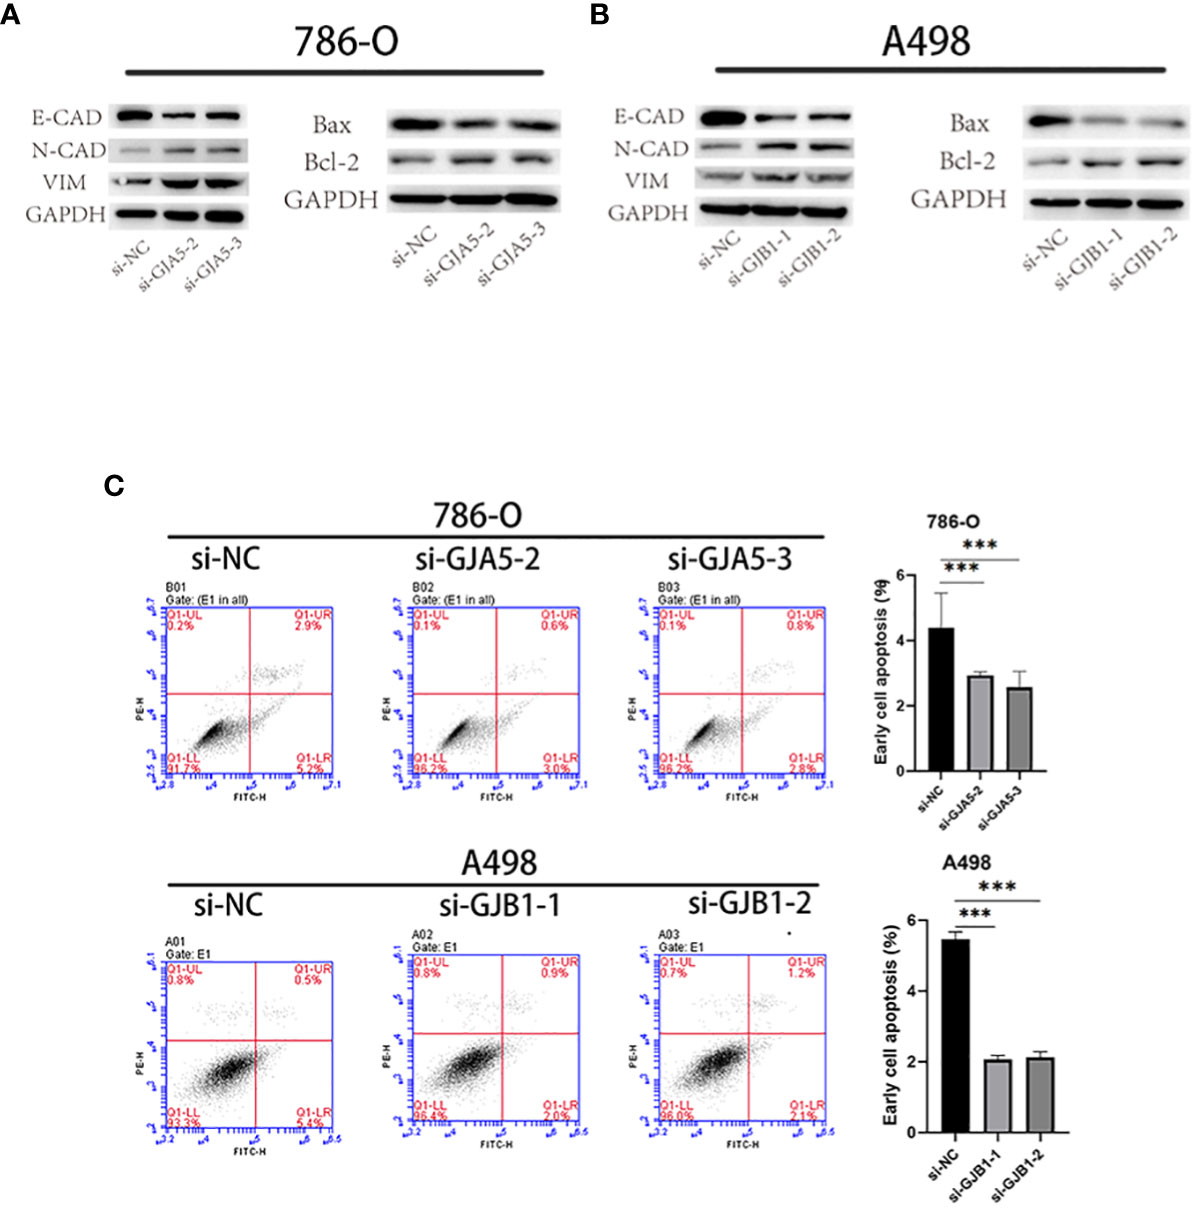
Figure 12 (A) After knocking down GJA5, the protein expression of E-cad, N-cad, VIM, Bax, and Bcl-2 was detected in the 786-O cell line. (B) After knocking down GJB1, the protein expression of E-cad, N-cad, VIM, Bax, and Bcl-2 was detected in the A-498 cell line. (C) Flow cytometry analysis of cell apoptosis after knockdown of GJA5 and GJB1 genes in 786-O and A498 cells, respectively. (*p < 0.05, **p < 0.001, ***p < 0.01).
Gap junctions are intercellular channel clusters formed on the plasma membrane by the connexin family of proteins expressed by GJPs (21, 22), which allows the diffusion of ions or small molecules and the transmission of electrical signals (23, 24). As important channels of intercellular communication, gap junction proteins provide a basis for the cooperative work and functional integrity of various systems and organs in organisms (25, 26). Genetic or acquired changes in connexin proteins are closely related to cancer (27). Abnormal GJP expression is related to the recurrence and metastasis of cancer and to increase patient mortality. This difference may be due to the loss of channel function, which leads to a decrease in tumor inhibition ability (usually called tumor dormancy) (28, 29), and this inhibition ability depends on the function of gap junction coupling among cells (30). Moreover, when the gap junction channel is damaged, the permeability and sensitivity to chemotherapy drugs are reduced (31, 32). For example, defects in GJA1 function mediate the resistance of breast cancer to tamoxifen (33). Destruction of GJB1 plays a role in promoting the occurrence and development of ovarian cancer and is not conducive to the action of chemical drugs (34). Mutations and loss of function of the GJA5 gene are closely related to the occurrence of isolated ventricular fibrillation in humans (35). Therefore, GJPs are crucial to the steady state of the human body. However, the role of GJPs in ccRCC is unclear. In our study, we comprehensively analyzed the biological function, pathway, clinical significance and prognostic value of GJPs in patients with ccRCC, which filled the gap in the study of GJPs in ccRCC.
In addition, the occurrence and development of cancer are always accompanied by changes in the tumor microenvironment and the triggering of immune escape mechanisms (36, 37). When gap junctions are blocked, humoral and CD8+ T-cell immune responses are inhibited or even eliminated (38). It has been proven that there are many gap junction channels between immune cells, such as GJA5 in T and B lymphocytes (39), and GJB1 in mast cells (40), and that communication between cardiac cells is promoted by cardiac macrophages through gap junctions (41). Therefore, the stability of GJP function is crucial for the immune system to function. However, the role of GJPs in ccRCC remains unclear. We analyzed the clinical significance and biological function of GJPs in ccRCC through a public database system. Furthermore, we developed the GRPS, a novel tumor-related prognostic feature. Low expression levels of GJA5 and GJB1 predict poor prognosis in ccRCC patients, and could be used as independent prognostic markers and drug therapeutic targets for ccRCC. Additionally, GJA5 and GJB1 were verified by cellular functional experiments, and the results showed that GJA5 and GJB1 could be used as prognostic markers for ccRCC.
In this study, LASSO and Cox regression models were developed for 21 GJPs to identify genes with independent prognostic effects, and the relationships between GRPS and tumor grade, tumor stage and survival status of patients were further explored. The results showed that GJA5 and GJB1 have independent prognostic value in ccRCC. The RS was subsequently calculated for each patient, and an RS prognostic model was constructed. Analysis of the ROC curve confirmed that the prediction model developed in this study is reliable, indicating its potential application in clinical practice for predicting the prognosis of patients with ccRCC.
Moreover, a clinical nomogram that incorporates the GPRS score, patient clinical characteristics, and the RS was developed. ROC curve and DCA analyses demonstrated that the nomogram is highly sensitive for predicting the survival status of patients (AUC values for 1-, 3-, and 5-year were 0.876, 0.853 and 0.816, respectively). To assess the generalizability of the RS prognostic model, this study combined it with external datasets, and the results were positive. Further investigations revealed correlations between the GRPS and immune cell infiltration, the TME, and the TMB. Drug sensitivity analysis indicated that the high-RS subgroup was more sensitive to afatinib, erlotinib, rapamycin, and sorafenib, while the low-RS subgroup exhibited greater sensitivity to axitinib, which is conducive to the development of individualized chemotherapy regimens for patients with advanced ccRCC.
This study has certain limitations. Firstly, the dataset examined in this analysis was merely derived from the public (TCGA and GEO) database, and has a limited sample size. The findings still need to be further confirmed by a multi-database and multi-center study. Secondly, although our constructed model obtained promising results, further clinical experiments are necessary to validate and assess the efficacy of our model.
In conclusion, this study established a more economical and personalized prognostic model that is easy to apply and could provide clinicians with new ideas for the prognosis and treatment of ccRCC patients.
Publicly available datasets were analyzed in this study. This data can be found here: TCGA database (https://portal.gdc.cancer.gov/) and GEO database (https://www.ncbi.nlm.nih.gov/geo/), Microarray data (GSE29609, GSE95425, GSE73731).
YH: Conceptualization, Data curation, Software, Visualization, Writing – original draft. WG: Formal analysis, Validation, Visualization, Writing – original draft. YuZ: Conceptualization, Investigation, Software, Writing – review & editing. XW: Conceptualization, Writing – review & editing. BF: Conceptualization, Writing – review & editing. YiZ: Conceptualization, Writing – review & editing. LY: Project administration, Supervision, Writing – review & editing. ZL: Funding acquisition, Methodology, Software, Supervision, Writing – review & editing. GG: Conceptualization, Funding acquisition, Investigation, Resources, Writing – review & editing.
The author(s) declare financial support was received for the research, authorship, and/or publication of this article. This study was financially supported by the Natural Science Foundation of Shandong Province (no. ZR2020QH068 and no. ZR2021MH049).
The authors declare that the research was conducted in the absence of any commercial or financial relationships that could be construed as a potential conflict of interest.
All claims expressed in this article are solely those of the authors and do not necessarily represent those of their affiliated organizations, or those of the publisher, the editors and the reviewers. Any product that may be evaluated in this article, or claim that may be made by its manufacturer, is not guaranteed or endorsed by the publisher.
The Supplementary Material for this article can be found online at: https://www.frontiersin.org/articles/10.3389/fonc.2024.1354049/full#supplementary-material
Supplementary Table 1 | General clinical data of ccRCC patients involved in data analysis in this study.
Supplementary Table 2 | Univariate Cox regression results for gap junction protein gene.
Supplementary Figure 1 | The Kaplan-Meier survival analysis for 5 GJPs with differential survival significance: (A) GJA1 (B) GJA4 (C) GJA5 (D) GJB1 (E) GJC1.
Supplementary Figure 2 | GJA5 and GJB1 expression and differential expression in pan-cancer: (A) Expression of GJA5 in pan-cancer (B) Expression of GJB1 in pan-cancer (C) Differential expression of GJA5 between normal and tumoral tissues in pan-cancer (D) Differential expression of GJB1 between normal and tumoral tissues in pan-cancer.
Supplementary Figure 3 | In the oncopression database, the differential expression of GJA5 and GJB1 in ccRCC tumor tissue and normal tissue: (A) Differential expression of GJA5 between normal and tumoral kidney tissues in the Oncopression database (B) Differential expression of GJB1 between normal and tumoral kidney tissues in the Oncopression database.
Supplementary Figure 4 | Visualization of differentially expressed genes (P< 0.05, logFC = 1, FDR< 1) in risk groups: (A) Heatmap (B) Volcano plot.
1. Sung H, Ferlay J, Siegel RL, Laversanne M, Soerjomataram I, Jemal A, et al. Global cancer statistics 2020: GLOBOCAN estimates of incidence and mortality worldwide for 36 cancers in 185 countries. CA Cancer J Clin. (2021) 71:209–49. doi: 10.3322/caac.21660
2. Turajlic S, Swanton C, Boshoff C. Kidney cancer: The next decade. J Exp Med. (2018) 215:2477–9. doi: 10.1084/jem.20181617
3. Wu Y, Zhang S, Chen C, Pang J. Dysregulation and implications of N6-methyladenosine modification in renal cell carcinoma. Curr Urol. (2023) 17:45–51. doi: 10.1097/CU9.0000000000000135
4. Harrison H, Thompson RE, Lin Z, Rossi SH, Stewart GD, Griffin SJ, et al. Risk prediction models for kidney cancer: A systematic review. Eur Urol Focus. (2021) 7:1380–90. doi: 10.1016/j.euf.2020.06.024
5. Motzer RJ, Bukowski RM, Figlin RA, Hutson TE, Michaelson MD, Kim ST, et al. Prognostic nomogram for sunitinib in patients with metastatic renal cell carcinoma. Cancer. (2008) 113:1552–8. doi: 10.1002/cncr.23776
6. Han W, Fan B, Huang Y, Wang X, Zhang Z, Gu G, et al. Construction and validation of a prognostic model of RNA binding proteins in clear cell renal carcinoma. BMC Nephrol. (2022) 23:172. doi: 10.1186/s12882-022-02801-y
7. Teishima J, Murata D, Inoue S, Hayashi T, Mita K, Hasegawa Y, et al. Prediction of early progression of metastatic renal cell carcinoma treated with first-line tyrosine kinase inhibitor. Curr Urol. (2021) 15:187–92. doi: 10.1097/CU9.0000000000000042
8. Linehan WM, Schmidt LS, Crooks DR, Wei D, Srinivasan R, Lang M, et al. The metabolic basis of kidney cancer. Cancer Discovery. (2019) 9:1006–21. doi: 10.1158/2159-8290.Cd-18-1354
9. Inoue T. Invited commentary: When and how to initiate systemic therapy in treating favorable risk metastatic renal cell carcinoma. Curr Urol. (2021) 15:185–6. doi: 10.1097/CU9.0000000000000052
10. Brissette JL, Kumar NM, Gilula NB, Hall JE, Dotto GP. Switch in gap junction protein expression is associated with selective changes in junctional permeability during keratinocyte differentiation. Proc Natl Acad Sci U.S.A. (1994) 91:6453–7. doi: 10.1073/pnas.91.14.6453
11. Willecke K, Eiberger J, Degen J, Eckardt D, Romualdi A, Güldenagel M, et al. Structural and functional diversity of connexin genes in the mouse and human genome. Biol Chem. (2002) 383:725–37. doi: 10.1515/bc.2002.076
12. Nielsen MS, Axelsen LN, Sorgen PL, Verma V, Delmar M, Holstein-Rathlou NH. Gap junctions. Compr Physiol. (2012) 2:1981–2035. doi: 10.1002/cphy.c110051
13. Harris AL. Emerging issues of connexin channels: biophysics fills the gap. Q Rev Biophys. (2001) 34:325–472. doi: 10.1017/s0033583501003705
14. Saez JC, Berthoud VM, Branes MC, Martinez AD, Beyer EC. Plasma membrane channels formed by connexins: their regulation and functions. Physiol Rev. (2003) 83:1359–400. doi: 10.1152/physrev.00007.2003
15. Maeda S, Tsukihara T. Structure of the gap junction channel and its implications for its biological functions. Cell Mol Life Sci. (2011) 68:1115–29. doi: 10.1007/s00018-010-0551-z
16. Peracchia C. Gap junction channelopathies and calmodulinopathies. Do disease-causing calmodulin mutants affect direct cell-cell communication? Int J Mol Sci. (2021) 22:17. doi: 10.3390/ijms22179169
17. Laird DW. The gap junction proteome and its relationship to disease. Trends Cell Biol. (2010) 20:92–101. doi: 10.1016/j.tcb.2009.11.001
18. Liu Q, Wang Y, Gao H, Sun F, Wang X, Zhang H, et al. An individualized prognostic signature for clinically predicting the survival of patients with bladder cancer. Front Genet. (2022) 13:837301. doi: 10.3389/fgene.2022.837301
19. Addeo A, Friedlaender A, Banna GL, Weiss GJ. TMB or not TMB as a biomarker: That is the question. Crit Rev Oncol Hematol. (2021) 163:103374. doi: 10.1016/j.critrevonc.2021.103374
20. Bravaccini S, Bronte G, Ulivi P. TMB in NSCLC: A broken dream? Int J Mol Sci. (2021) 22:12. doi: 10.3390/ijms22126536
21. Dhein S, Salameh A. Remodeling of cardiac gap junctional cell-cell coupling. Cells. (2021) 10:9. doi: 10.3390/cells10092422
22. Kumar NM, Gilula NB. The gap junction communication channel. Cell. (1996) 84:381–8. doi: 10.1016/s0092-8674(00)81282-9
23. Martínez AD, Acuña R, Figueroa V, Maripillan J, Nicholson B. Gap-junction channels dysfunction in deafness and hearing loss. Antioxid Redox Signal. (2009) 11:309–22. doi: 10.1089/ars.2008.2138
24. Simon AM, Goodenough DA. Diverse functions of vertebrate gap junctions. Trends Cell Biol. (1998) 8:477–83. doi: 10.1016/s0962-8924(98)01372-5
25. Dhein S. Gap junction channels in the cardiovascular system: pharmacological and physiological modulation. Trends Pharmacol Sci. (1998) 19:229–41. doi: 10.1016/s0165-6147(98)01192-4
26. Grek CL, Rhett JM, Bruce JS, Ghatnekar GS, Yeh ES. Connexin 43, breast cancer tumor suppressor: Missed connections? Cancer Lett. (2016) 374:117–26. doi: 10.1016/j.canlet.2016.02.008
27. Totland MZ, Rasmussen NL, Knudsen LM, Leithe E. Regulation of gap junction intercellular communication by connexin ubiquitination: physiological and pathophysiological implications. Cell Mol Life Sci. (2020) 77:4–573-591. doi: 10.1007/s00018-019-03285-0
28. Sinha G, Ferrer AI, Moore CA, Naaldijk Y, Rameshwar P. Gap junctions and breast cancer dormancy. Trends Cancer. (2020) 6:348–57. doi: 10.1016/j.trecan.2020.01.013
29. King TJ, Lampe PD. The gap junction protein connexin32 is a mouse lung tumor suppressor. Cancer Res. (2004) 64:7191–6. doi: 10.1158/0008-5472.Can-04-0624
30. Krutovskikh VA, Troyanovsky SM, Piccoli C, Tsuda H, Asamoto M, Yamasaki H. Differential effect of subcellular localization of communication impairing gap junction protein connexin43 on tumor cell growth in vivo. Oncogene. (2000) 19:505–13. doi: 10.1038/sj.onc.1203340
31. Bonacquisti EE, Nguyen J. Connexin 43 (Cx43) in cancer: Implications for therapeutic approaches via gap junctions. Cancer Lett. (2019) 442:439–44. doi: 10.1016/j.canlet.2018.10.043
32. Chen Q, Boire A, Jin X, Valiente M, Er EE, Lopez-Soto A, et al. Carcinoma-astrocyte gap junctions promote brain metastasis by cGAMP transfer. Nature. (2016) 533:493–8. doi: 10.1038/nature18268
33. Wu DP, Zhou Y, Hou LX, Zhu XX, Yi W, Yang SM, et al. Cx43 deficiency confers EMT-mediated tamoxifen resistance to breast cancer via c-Src/PI3K/Akt pathway. Int J Biol Sci. (2021) 17:2380–98. doi: 10.7150/ijbs.55453
34. Yang J, Fan Y, Xie B, Yang D. A combination of RNA-seq analysis and use of TCGA database for determining the molecular mechanism and identifying potential drugs for GJB1 in ovarian cancer. Onco Targets Ther. (2021) 14:2623–33. doi: 10.2147/ott.S303589
35. Gollob MH, Jones DL, Krahn AD, Danis L, Gong XQ, Shao Q, et al. Somatic mutations in the connexin 40 gene (GJA5) in atrial fibrillation. N Engl J Med. (2006) 354:2677–88. doi: 10.1056/NEJMoa052800
36. Efimova I, Catanzaro E, van der Meeren L, Turubanova VD, Hammad H, Mishchenko TA, et al. Vaccination with early ferroptotic cancer cells induces efficient antitumor immunity. J Immunother Cancer. (2020) 8:2. doi: 10.1136/jitc-2020-001369
37. Li B, Severson E, Pignon JC, Zhao H, Li T, Novak J, et al. Comprehensive analyses of tumor immunity: implications for cancer immunotherapy. Genome Biol. (2016) 17:1–174. doi: 10.1186/s13059-016-1028-7
38. Wang J, Li P, Yu Y, Fu Y, Jiang H, Lu M, et al. Pulmonary surfactant-biomimetic nanoparticles potentiate heterosubtypic influenza immunity. Science. (2020) 367:6480. doi: 10.1126/science.aau0810
39. Oviedo-Orta E, Hoy T, Evans WH. Intercellular communication in the immune system: differential expression of connexin40 and 43, and perturbation of gap junction channel functions in peripheral blood and tonsil human lymphocyte subpopulations. Immunology. (2000) 99:578–90. doi: 10.1046/j.1365-2567.2000.00991.x
40. Vliagoftis H, Hutson AM, Mahmudi-Azer S, Kim H, Rumsaeng V, Oh CK, et al. Mast cells express connexins on their cytoplasmic membrane. J Allergy Clin Immunol. (1999) 103:656–62. doi: 10.1016/s0091-6749(99)70239-3
Keywords: gap junction protein, clear cell renal cell carcinoma, biomarkers, prognostic model, cellular verification
Citation: Huang Y, Guo W, Zeng Y, Wang X, Fan B, Zhang Y, Yan L, Gu G and Liu Z (2024) Identification and validation of a gap junction protein related signature for predicting the prognosis of renal clear cell carcinoma. Front. Oncol. 14:1354049. doi: 10.3389/fonc.2024.1354049
Received: 11 December 2023; Accepted: 31 January 2024;
Published: 22 February 2024.
Edited by:
Huan Yang, Huazhong University of Science and Technology, ChinaCopyright © 2024 Huang, Guo, Zeng, Wang, Fan, Zhang, Yan, Gu and Liu. This is an open-access article distributed under the terms of the Creative Commons Attribution License (CC BY). The use, distribution or reproduction in other forums is permitted, provided the original author(s) and the copyright owner(s) are credited and that the original publication in this journal is cited, in accordance with accepted academic practice. No use, distribution or reproduction is permitted which does not comply with these terms.
*Correspondence: Gangli Gu, Z2dsMDEyNkAxMjYuY29t; Zhao Liu, emhhby5saXVAc2R1LmVkdS5jbg==
†These authors have contributed equally to this work and share first authorship
Disclaimer: All claims expressed in this article are solely those of the authors and do not necessarily represent those of their affiliated organizations, or those of the publisher, the editors and the reviewers. Any product that may be evaluated in this article or claim that may be made by its manufacturer is not guaranteed or endorsed by the publisher.
Research integrity at Frontiers
Learn more about the work of our research integrity team to safeguard the quality of each article we publish.