
95% of researchers rate our articles as excellent or good
Learn more about the work of our research integrity team to safeguard the quality of each article we publish.
Find out more
ORIGINAL RESEARCH article
Front. Oncol. , 24 April 2024
Sec. Pediatric Oncology
Volume 14 - 2024 | https://doi.org/10.3389/fonc.2024.1340909
 Sonia Ahmed1,2†
 Mariam Elsherif2*†
 Dina Yassin3,4
 Nahla Elsharkawy3,4
 Ayman S. Mohamed3
 Nouran Yasser5
 Amr Elnashar5
 Hanafy Hafez1,2‡
 Edward A. Kolb6,7‡
 Alaa Elhaddad1,2‡
Background: Molecular testing plays a pivotal role in monitoring measurable residual disease (MRD) in acute myeloid leukemia (AML), aiding in the refinement of risk stratification and treatment guidance. Wilms tumor gene 1 (WT1) is frequently upregulated in pediatric AML and serves as a potential molecular marker for MRD. This study aimed to evaluate WT1 predictive value as an MRD marker and its impact on disease prognosis.
Methods: Quantification of WT1 expression levels was analyzed using the standardized European Leukemia Network real-time quantitative polymerase chain reaction assay (qRT-PCR) among a cohort of 146 pediatric AML patients. Post-induction I and intensification I, MRD response by WT1 was assessed. Patients achieving a ≥2 log reduction in WT1MRD were categorized as good responders, while those failing to reach this threshold were classified as poor responders.
Results: At diagnosis, WT1 overexpression was observed in 112 out of 146 (76.7%) patients. Significantly high levels were found in patients with M4- FAB subtype (p=0.018) and core binding fusion transcript (CBF) (RUNX1::RUNX1T1, p=0.018, CBFB::MYH11, p=0.016). Following induction treatment, good responders exhibited a reduced risk of relapse (2-year cumulative incidence of relapse [CIR] 7.9% vs 33.2%, p=0.008). Conversely, poor responders’ post-intensification I showed significantly lower overall survival (OS) (51% vs 93.2%, p<0.001), event-free survival (EFS) (33.3% vs 82.6%, p<0.001), and higher CIR (66.6% vs 10.6%, p<0.001) at 24 months compared to good responders. Even after adjusting for potential confounders, it remained an independent adverse prognostic factor for OS (p=0.04) and EFS (p=0.008). High concordance rates between WT1-based MRD response and molecular MRD were observed in CBF patients. Furthermore, failure to achieve either a 3-log reduction by RT-PCR or a 2-log reduction by WT1 indicated a high risk of relapse. Combining MFC-based and WT1-based MRD results among the intermediate-risk group identified patients with unfavorable prognosis (positive predictive value [PPV] 100%, negative predictive value [NPV] 85%, and accuracy 87.5%).
Conclusion: WT1MRD response post-intensification I serves as an independent prognostic factor for survival in pediatric AML. Integration of WT1 and MFC-based MRD results enhances the reliability of MRD-based prognostic stratification, particularly in patients lacking specific leukemic markers, thereby influencing treatment strategies.
The survival rate of pediatric patients with acute myeloid leukemia (AML) approached 70%, with approximately 30% experiencing relapse, which is the main cause of treatment failure (1). Measurable residual disease (MRD) is an important biomarker in AML patients used for prognosis and response assessments (2).
The prognostic value of MRD detected by real-time quantitative polymerase chain reaction (RT-qPCR) or multiparametric flow cytometry (MFC) is well established, and relapse occurs more likely in patients with detectable MRD (3). Previously published data suggested that patients with one positive and one negative MRD results performed by two different techniques have higher relapse risk than patients with two negative MRD results, but lower relapse risk than patients with two positive MRD (2, 4, 5).
Specific genetic aberrations, such as RUNX1::RUNX1T1, CBFB::MYH11, and nucleophosmin 1 (NPM1) mutations, constitute markers of MRD but about 40% of children with AML harbor leukemia-specific targets, which makes these genetic targets clinically applicable in only minor fraction of children (6, 7). Therefore, it was crucial to identify other molecular targets applicable to the majority of patients.
Wilms tumor gene 1 (WT1) is overexpressed in approximately 80% of children with AML. Previous cohort studies in children and adults evaluated WT1 gene overexpression at diagnosis, during treatment, and pre-, and post-hematopoietic stem cell transplantation (HSCT) to provide a target for novel immunotherapeutic approaches and to advocate it as a universal marker for MRD assessment.
The European Leukemia Network researchers (ELN) validated a quantitative WT1 assay and established reference ranges for WT1 expression in peripheral blood (PB) and bone marrow (BM) by analyzing a large number of control samples. This study showed that (≥2 log) reduction in WT1 transcript after induction predicted reduced relapse risk, also failure to reduce WT1 transcripts below this threshold limits after intensification predicted increased risk of relapse (p=.004) (8). For pediatric AML, Lapillonne et al. observed that WT1 level higher than 50 × 104 after induction was an independent prognostic risk factor of relapse (p=.002) and death (p=.02) (9).
A recent consensus from the ELN MRD working group recommends WT1 as an important tool in monitoring MRD and stratifying patients with AML especially those who lack a more sensitive marker and thus could influence treatment strategy (2).
The objective of this study was to assess the prevalence of WT1 gene overexpression in pediatric patients with AML treated at Children’s Cancer Hospital Egypt (CCHE-57357) on AML protocol adopted from the Children Oncology Group (COG) (NCT01371981) (10) and to evaluate the prognostic significance of WT1 as an MRD marker on survival and disease outcome.
This study comprised 163 pediatric patients with De novo AML diagnoses who received therapy at CCHE-57357 between January 2019 and May 2020. A minimum follow-up period of one year from the completion of treatment was ensured for all participants. The study was approved by the Institutional Review Board (IRB), and informed consent was secured prior to the start of therapy.
Patients with conditions including acute promyelocytic leukemia (APL), Down syndrome myeloid neoplasm, myelodysplastic syndrome (MDS), therapy-related AML (t-AML), and myeloid sarcoma were excluded from the study. Data related to the patients were gathered from their electronic medical records and initial disease assessments included morphology, immune-phenotyping, cytogenetics, and molecular studies. For disease evaluation bone marrow aspirate (BMA) was done after each cycle and MRD was monitored by MFC based on the ELN proposed consensus using 8-10 colors monoclonal antibody (mAbs) panels. We adopted two methodologies: the Leukemia Associated Immunophenotype (LAIP) approach and the Different from Normal (DFN) approach. MRD is detected based on LAIP’s present on any population and any deviation seen from normal patterns (7, 11). For patients with core binding fusion transcript (CBF), molecular MRD assessment by PCR was done post-intensification I.
Patients were enrolled on the CCHE 57357 AML protocol, which was adapted from the modified COG protocol (NCT01371981) (10) and based on their cytogenetics and molecular abnormalities, patients were categorized into Low risk (LR) groups: Patients with favorable cytogenetics, including. CBF (t(8;21) (q22;q22.1); RUNX1::RUNX1T1, inv (16) (p13.1;q22) or t (16;16) (p13.1;q22); CBFB::MYH11), Nucleophosmin 1 (NPM1), and CEBPA abnormalities. Intermediate risk (IR): Patients without either favorable or unfavorable criteria. High risk (HR): Patients with unfavorable cytogenetics, such as monosomy 7, monosomy 5, complex karyotype (more than three chromosomal aberrations), and FLT3 internal tandem duplications (FLT3/ITD) with a high allelic ratio (> 0.4, FLT3/ITD positive). Additionally, IR patients were further classified into HR and LR categories based on MRD response measured by MFC after the first induction. LR was defined as MRD <0.1% (10).
All patients received 4 cycles of chemotherapy and only high-risk were offered allogeneic hematopoietic stem cell transplantation (Allo-HSCT) in complete remission (CR) if a matched sibling donor is available. The chemotherapy regimen details and dosages are given in “Supplementary Table 1”.
Complete remission (CR) was defined as bone marrow (BM) blasts <5%. Refractory disease was defined as the persistence of blasts ≥ 5% at the end of induction II. Relapse was defined as the reappearance of leukemic blasts in the peripheral blood or >5% blasts in the bone marrow after achieving CR. Disease-Related Mortality (DRM): Death within the first 14 days of induction I (early deaths) or with evidence of disease in the last evaluation. Treatment-Related Mortality (TRM): Death beyond the first 14 days of induction I or death from any cause other than disease in subsequent cycles (without evidence of morphological disease).
Since WT1 is normally expressed in hematopoietic cells it is critical to establish the level of expression seen in normal control samples so that a threshold can be defined that distinguishes between residual leukemia and background amplification. We used the ELN assay incorporated in the ipsogen® WT1 ProfileQuant® Kit (CE-approved kit, Ref 676923, QIAGEN GmbH). The median WT1 expression level was 19.8 copies/104 ABL copies (with a range of 0–213 copies) in normal bone marrow samples. The upper limit of normal as 250 normalized WT1 copies (NCN) for bone marrow samples was established. This threshold was selected for its optimal sensitivity and specificity ensuring accurate discrimination between normal and abnormal WT1 expression levels (8). Pure RNA was extracted using a total RNA Purification Kit following the manufacturer protocol (QIAamp RNA Blood Mini Kit). Thermo Scientific NanoDrop 2000 was used to quantify and assess the purity of all RNA samples to be sure that the concentrations were pure enough to conduct RT-PCR. RNA input for all samples was adjusted (1 μg) and cDNA was synthesized using a Reverse transcription kit (Thermo Fisher Scientific, High-Capacity cDNA Reverse Transcription Kit). Quantitative mRNA expression study of the WT1 gene was carried out relative to the expression of a housekeeping gene ABL by QuantStudio™ 5 RT-PCR System (Applied Biosystems™) using Thermo Fisher Scientific, TaqMan™ Universal PCR Master Mix. cDNA input for all samples was adjusted (100 ng/μl), the threshold value was adjusted to 0.1, and the expression was measured using absolute quantification (standard curve). Bone marrow samples with WT1 expression > 250 × 104 ABL copies at diagnosis were considered to have overexpression and designated as WT1+ve while the remaining samples were referred to as WT1-ve. The Magnitude of log reduction in WT1 transcripts level after induction I and Intensification I was measured by RT-qPCR using ELN (8). Patients with WT1 MRD ≥2 log reduction were considered good responders (WT1 MRD-ve) and those with WT1 MRD <2 log were poor responders (WT1 MRD+ve). Supplementary Table 2 displays the primers and probes used for ABL and WT1.
The patients’ characteristics were compared using the chi-square test and Mann-Whitney test with Bonferroni multiple hypothesis P-value adjustment. Overall, event-free, and relapse-free survival probabilities (OS, EFS, RFS) were calculated using Kaplan-Meier analysis, and comparisons between patients were performed using the log-rank test. OS was defined as the interval from the date of diagnosis until the date of death or last contact date. EFS was delineated as the interval from the date of diagnosis until the occurrence of an event, which could be relapse, refractory, or death. RFS was defined as the period from the date of achieving complete remission to the date of relapse or death. The impact of various risk factors on both death and events was assessed through univariate Cox regression. A deliberate selection process was employed to choose variables for reevaluation using a multivariate Cox regression model. The gray test was utilized to estimate and compare the cumulative incidence of relapse (CIR).
Out of the 146 eligible patients, 112 (76.7%) exhibited WT1 overexpression (refer to Figure 1). The median age for the entire cohort was 8.8 years (range, 0.3–17.9 years). Patients with WT1 overexpression at diagnosis had higher median age (range, 0.3–17.9 years) (55% of WT1+ve >8.8 years, p=0.014). Levels were significantly higher in the M4 FAB AML subtype (n= 32/35 (91.4%) p=0.018), and patients with CBF (t (8:21) n= 32/35 (91.4%), p=0.018; inv 16, n= 17/17 (100%) p=0.016). The rate of KMT2A gene rearrangements was lower in patients with WT1 overexpression (4/14 (28.5%), p<0.001). No significant association was found between unfavorable cytogenetics (FLT3/ITD, complex karyotype, monosomy 7 and monosomy 5), Trisomy 8 or Trisomy 21, and WT1 overexpression. According to the COG initial risk classification, High WT1 levels were more prevalent in the LR compared to IR and HR groups (52% of WT1+ve were LR vs. 36% were IR and 15% were HR, p<0.001) (Table 1).
With a median follow-up of 21 months, the overall survival (OS) and the event-free survival (EFS) of the entire cohort at 2 years were 64.5% and 55.3% respectively. HR patients had significantly lower OS, EFS, and higher cumulative incidence of relapse at 2- year (OS; 35.7%, EFS; 12.5% and CIR; 29.4%) than patients in the IR (OS; 51%, EFS; 43.4%, CIR; 21.8%) and LR groups (OS; 85.2%, EFS; 75.2%, CIR; 11%, p<0.001) (Figures 2A–C). There was no significant impact for WT1 overexpression at diagnosis on survival and relapse at 2 years when compared to patients with low WT1 expression level (OS; WT+ve; 61.2% vs WT-ve; 57.7%, p= 0.9), (EFS; WT+ve; 52.4% vs. WT-ve; 55%, p=0.621) (CIR; WT+ve; 19% vs. WT-ve; 18.9%, p=0.82) (Figures 3A–C).
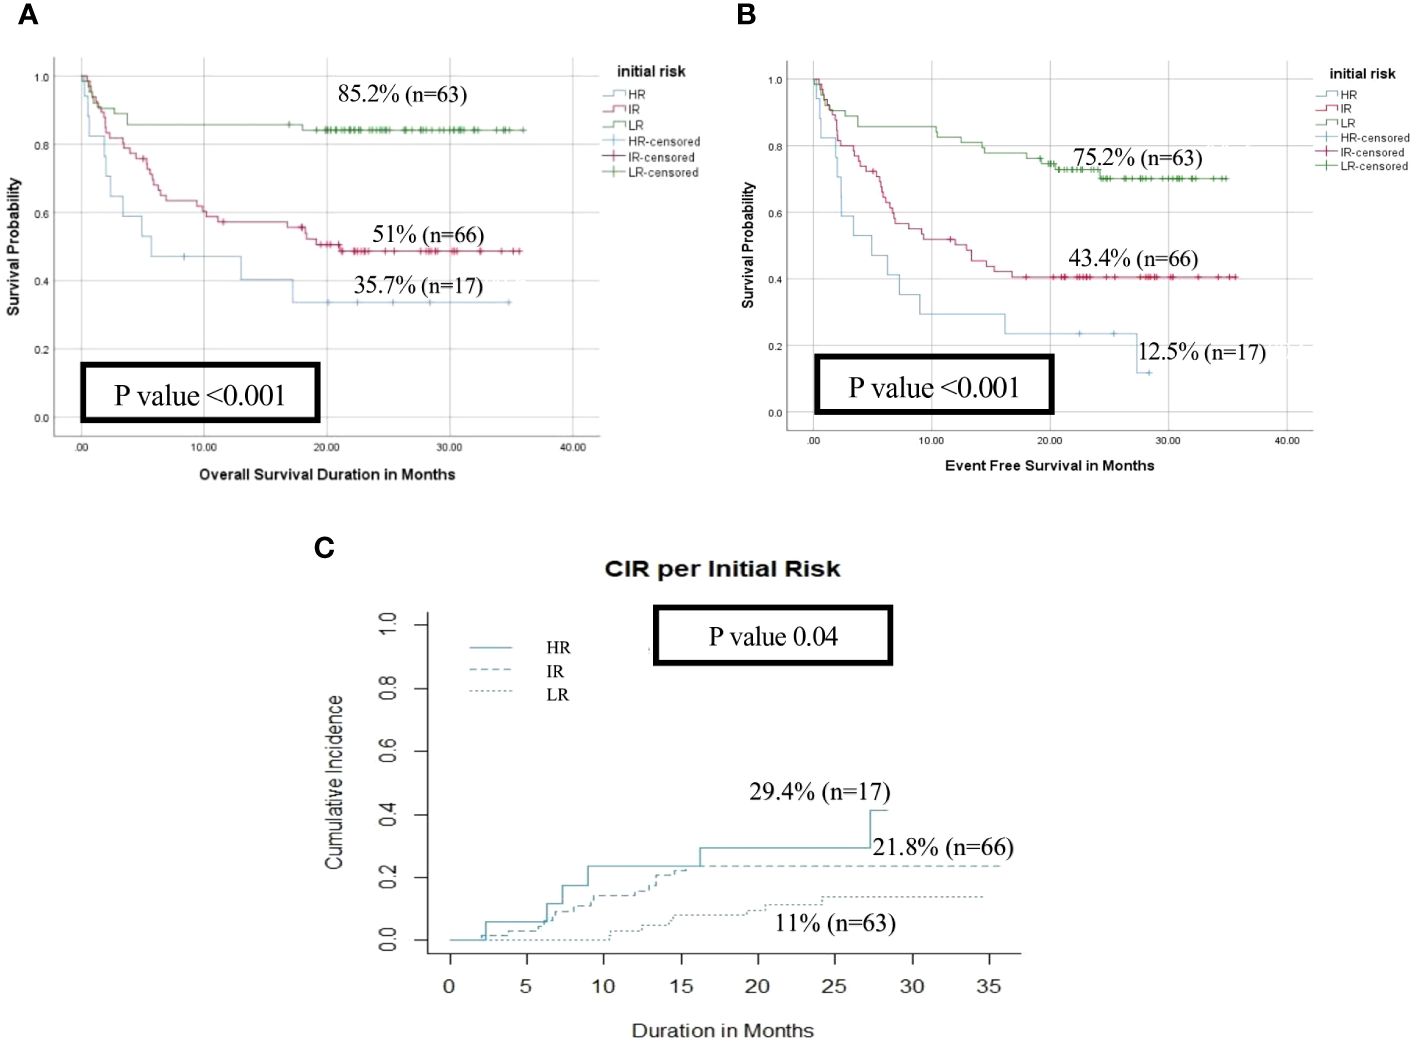
Figure 2 Impact of initial risk stratification on the disease outcome of pediatric patients with AML (HR n=17 vs IR n=66 vs LR n=63). (A) Overall survival, (B) Event-free survival, (C) Cumulative incidence of relapse (CIR).
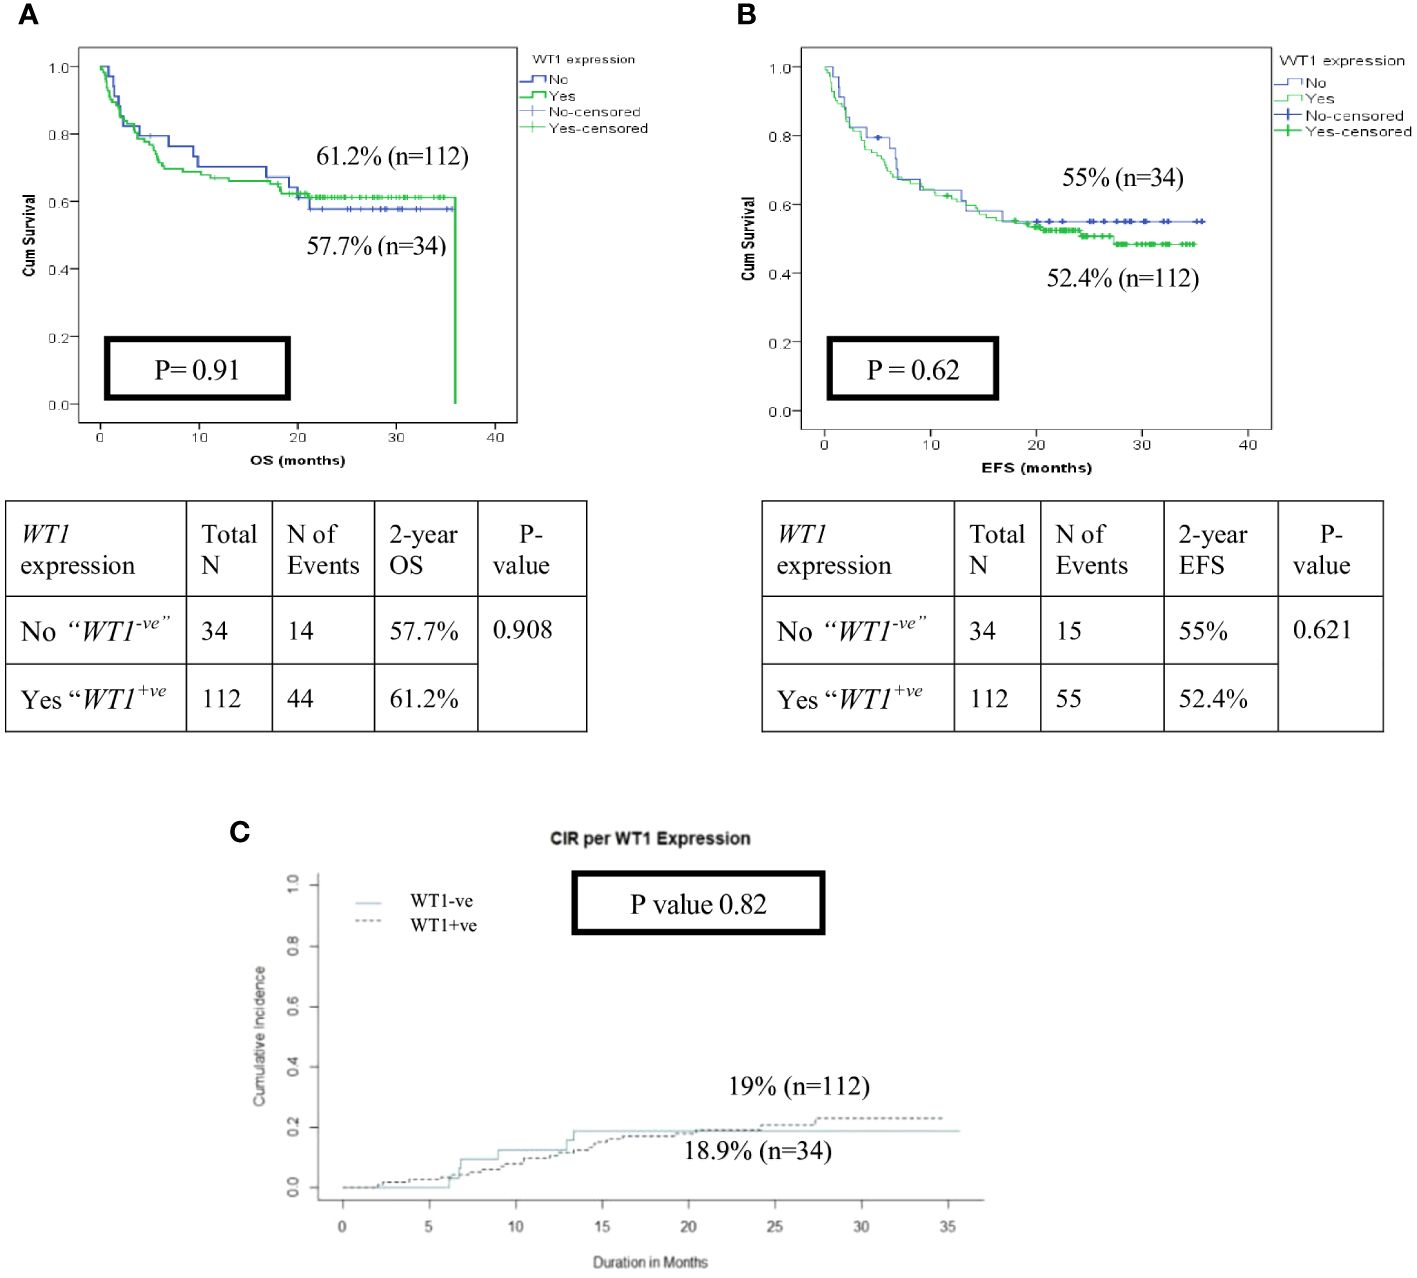
Figure 3 Impact of WT1 overexpression (WT1+ ve vs WT1-ve) at diagnosis on the disease outcome of pediatric patients with AML (A) Overall survival of patients with WT1+vevs WT1-ve, (B) Event-free survival of patients with WT1+vevs WT1-ve, (C) Cumulative incidence of relapse (CIR).
After exclusion of induction deaths (n=18) and patients without available MRD data (n=7), patients with WT1 MRD ≥2 log reduction (WT1 MRD-ve) after induction I showed a significant decrease in the risk of relapse when compared to those with WT1 MRD <2 log reduction (WT1 MRD+ve) (2-year CIR was 7.9% for WT1 MRD-ve vs. 33.2% for WT1 MRD+ve, p=0.008), however there was no difference in OS and EFS among each group (Figures 4A–C, Supplementary Table 3). Additionally, poor responders by WT1 MRD (<2 log reduction) after intensification I had significantly lower 2 years OS (47.6% vs. 93.2%, p<0.001) and EFS (33.3% vs. 82.6%, p<0.001), and significantly higher CIR at 2 years (66.6% vs. 10.6%, p<0.001) (Figures 5A–C, Supplementary Table 3) .
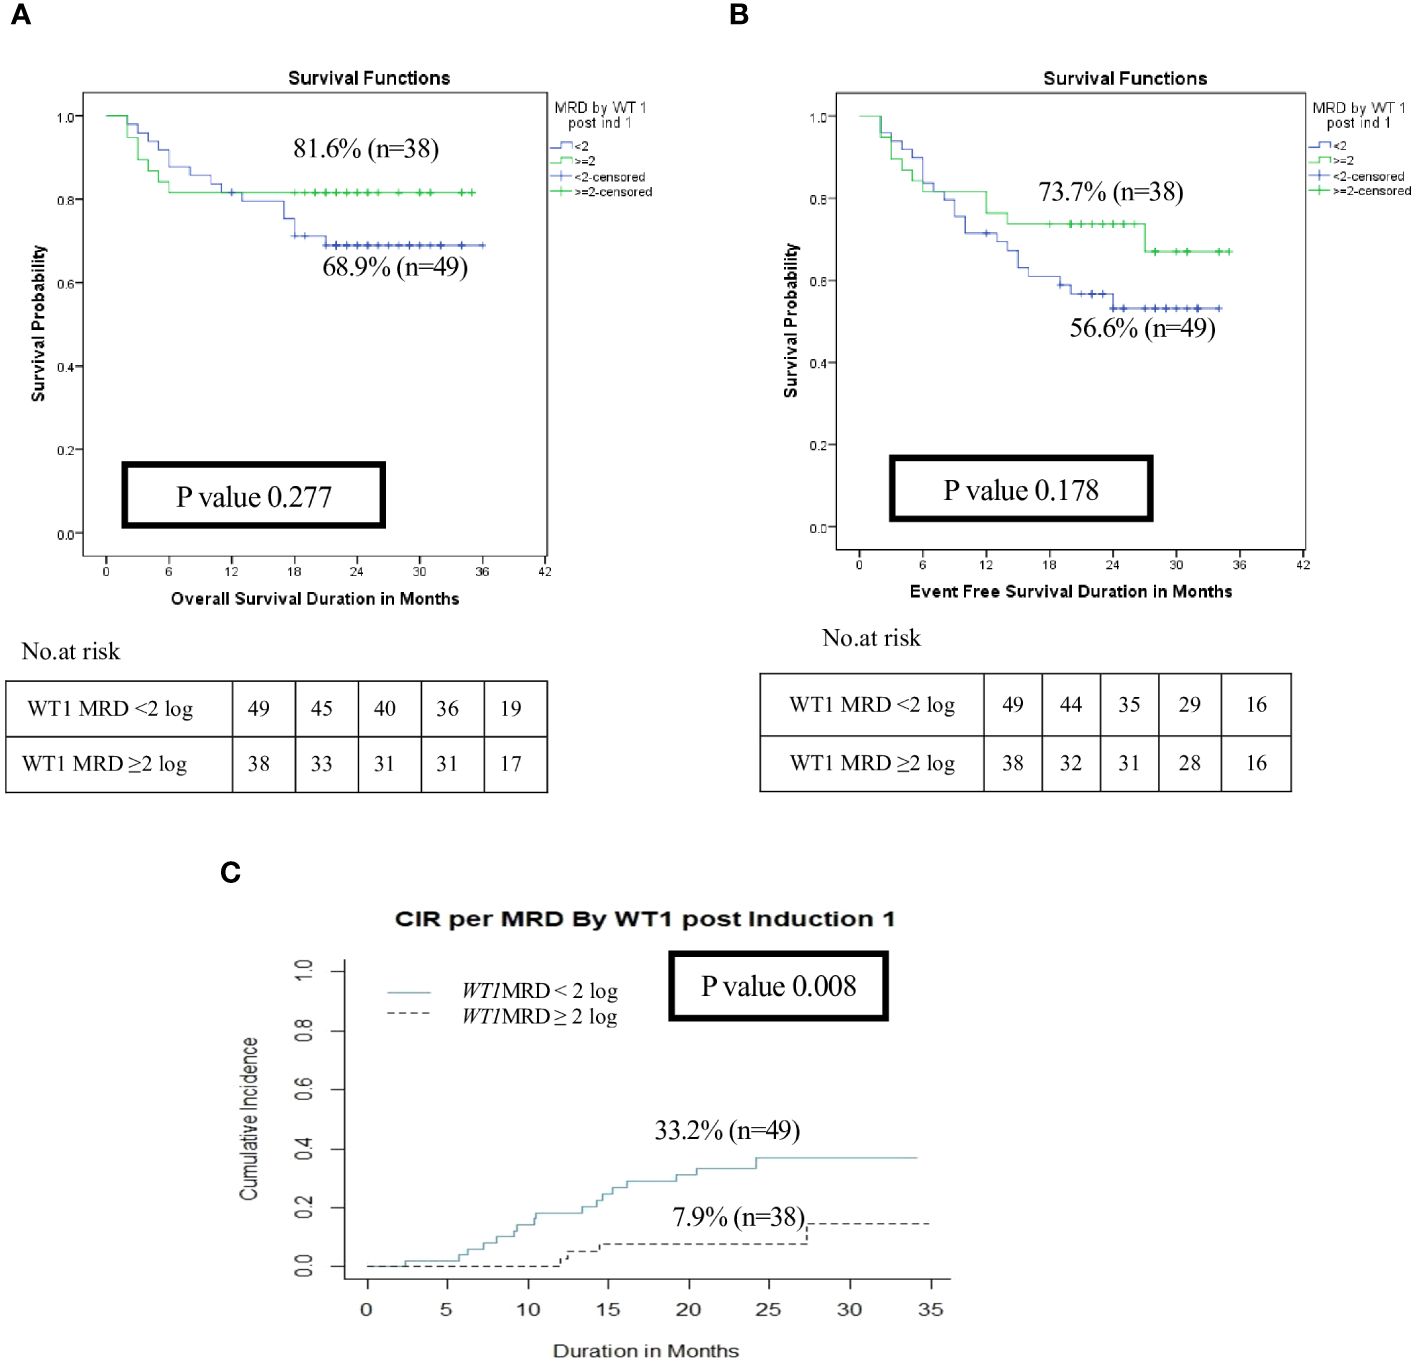
Figure 4 Impact of MRD response by WT1 on the disease outcome of pediatric patients with AML pediatric patients with AML post Induction I (WT1 MRD response <2 log reduction vs ≥ 2log reduction). (A) Overall survival, (B) Event-free survival, (C) Cumulative incidence of relapse (CIR).
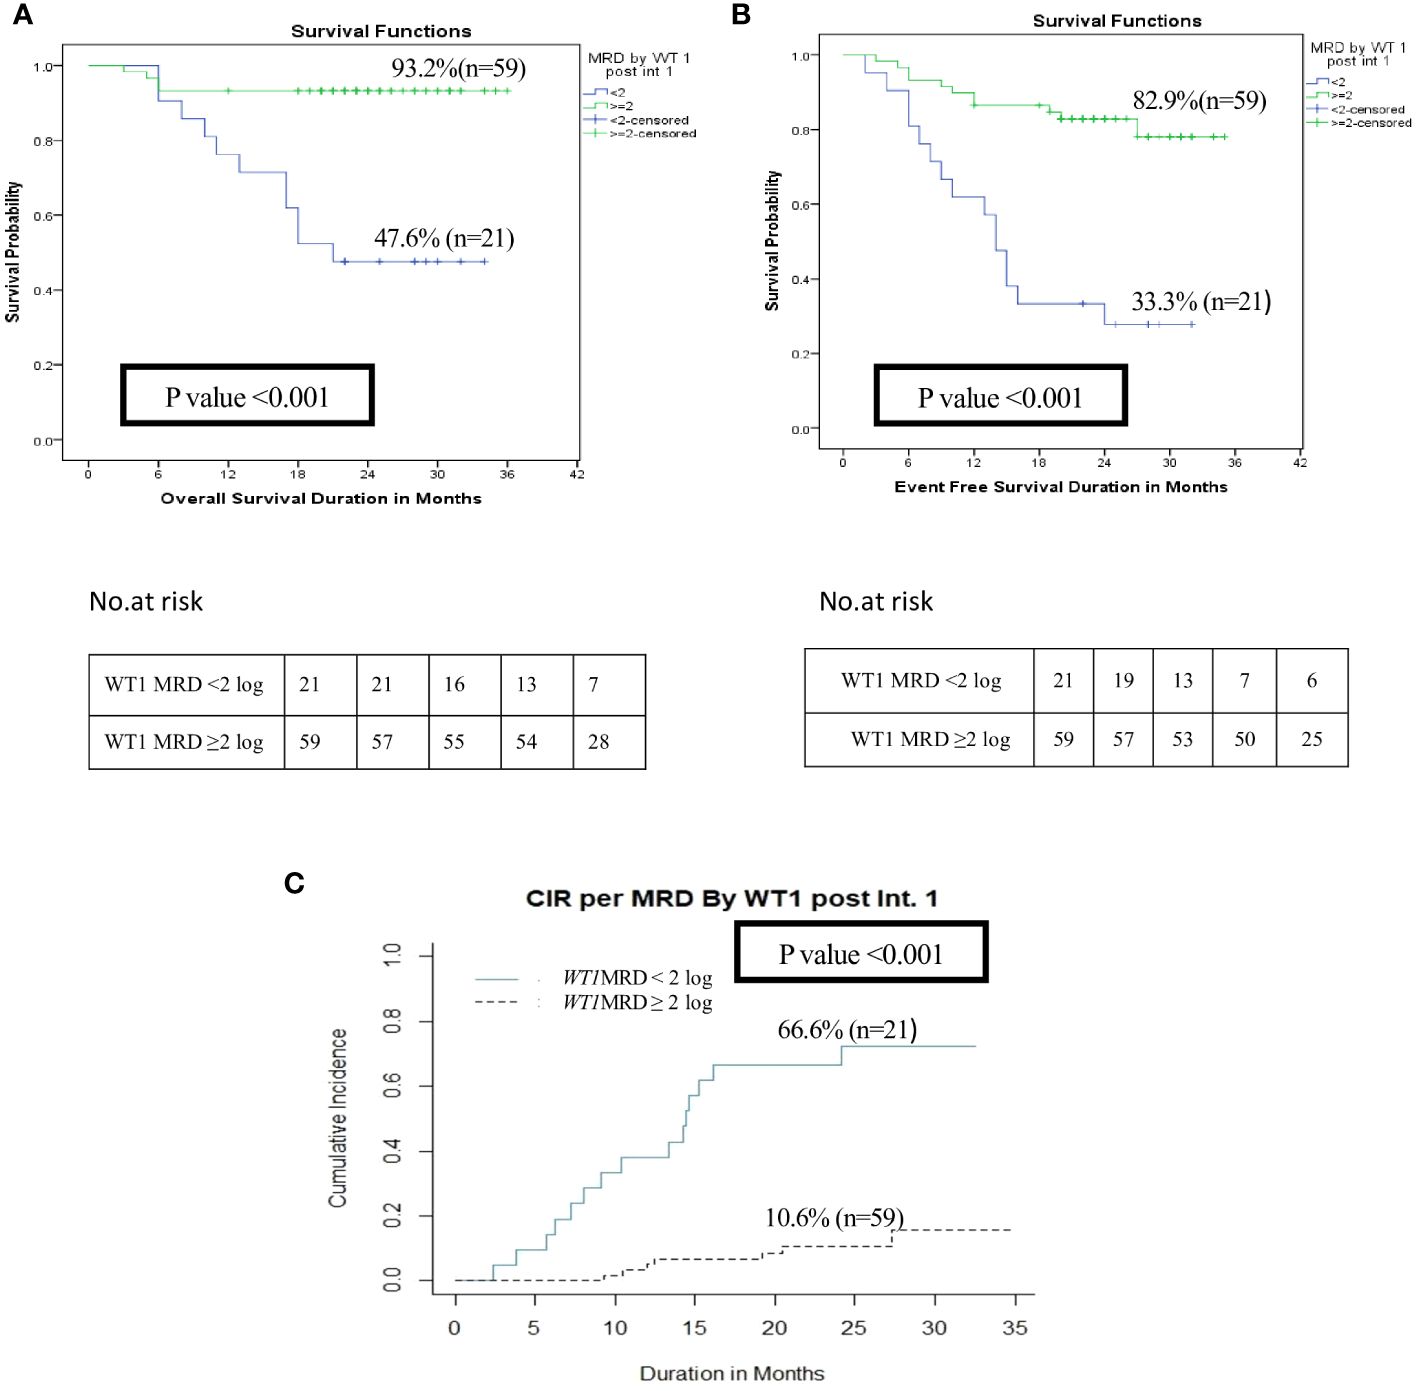
Figure 5 Impact of MRD response by WT1 on the disease outcome of pediatric patients with AML pediatric patients with AML post-intensification I (WT1 MRD response <2 log reduction vs ≥2 log reduction). (A) Overall survival, (B) Event-free survival, (C) Cumulative incidence of relapse (CIR).
WT1 MRD post intensification I, FAB M7, favorable cytogenetics, unfavorable cytogenetics, and risk stratification post induction 1 were identified as significant predictors for survival rates in univariate analysis. Regression multivariate analysis demonstrated that post intensification I, poor response by WT1 MRD (<2 log reduction) was an independent poor prognostic marker on survival (OS Hazards ratio (HR), 3; Confidence Interval (CI), 0.9 –10.6; p=0.04 and EFS HR, 3.115; CI range, 1.35—7.19, p= 0.008). Also risk stratification post induction I based on MRD response by MFC had a significant impact on survival (OS HR, 18.05; CI range, 2.22-146.6; p=0.007) and EFS (EFS HR, 2.83; CI range, 1.1.7—6.82, p=0.02) (Supplementary Tables 4A, B). Regarding the relapse free survival (RFS), in univariate and multivariate analysis, WT1MRD response post intensification I and initial risk group remained as a significant prognostic factor (p=0.01, p=0.02 respectively) (Table 2).

Table 2 Cox regression for univariate and multivariate analyses of MRD by WT1 post intensification 1, MFC MRD post intensification 1, and Initial risk.
The role of WT1 as an MRD marker and its influence on relapse among LR and IR patients (n=98) was evaluated, 77 patients had available MRD results by both MFC and WT1. The current results revealed that good responders (WT1MRD-ve) post-induction I had a significantly better RFS compared to poor responders (WT1MRD+ve) at 2 years (90% vs. 64.4%, p=0.024) (Figure 6). Moreover, within patients with MRD by MFC post-induction I >0.1, WT1MRD-ve patients were associated with a significantly lower incidence of relapse compared to those with WT1MRD+ve (8.5% vs. 30%, p=0.021) (Supplementary Table 5).
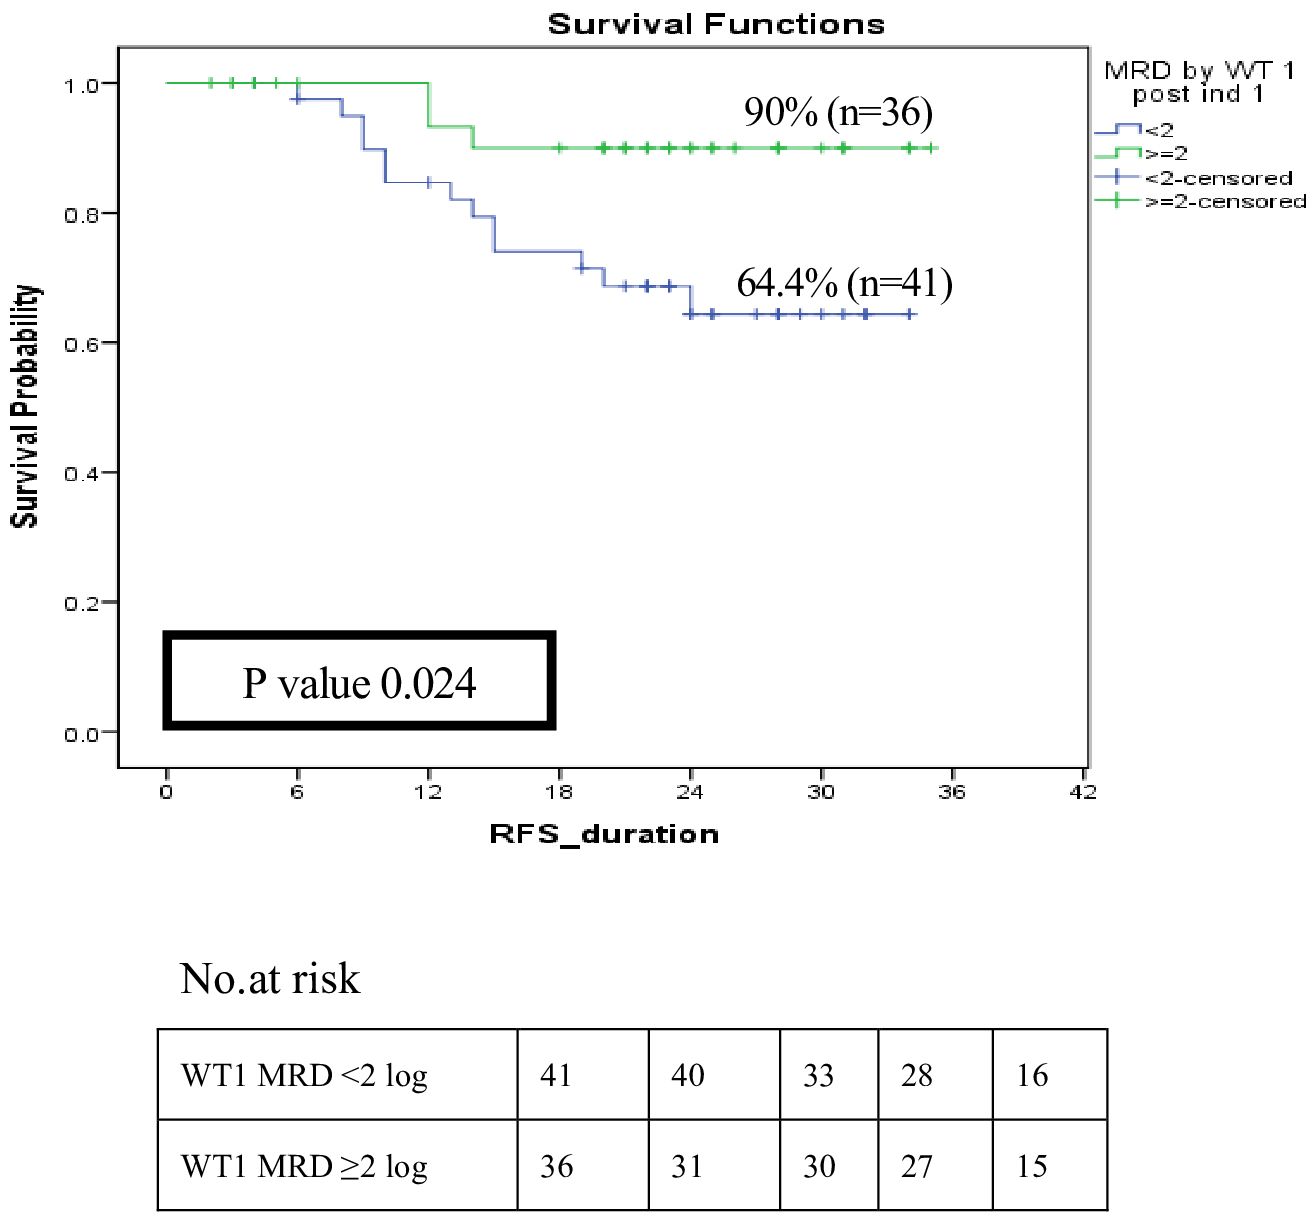
Figure 6 Impact of MRD response by WT1 on relapse-free survival among low and intermediate risk groups post induction I (WT1 MRD response < 2 log reduction vs WT1 MRD ≥ 2log reduction).
Further analysis to assess the impact of MRD response by WT1 post intensification I was investigated. WT1MRD+ve patients demonstrated a significant decrease in RFS at 2-year 34.3% compared to 88.5% for WT1MRD-ve patients (p<0.001) (Figure 7A). Moreover, failure to achieve a 2-log reduction by WT1 MRD post-intensification I identified patients at a higher risk of relapse, despite having negative MRD by MFC, with rates of 60% compared to 9.8% (p<0.001) (Supplementary Table 6). Furthermore, these patients had significantly lower RFS (38.9% compared to 87.5%, p<0.001) (Figure 7B).
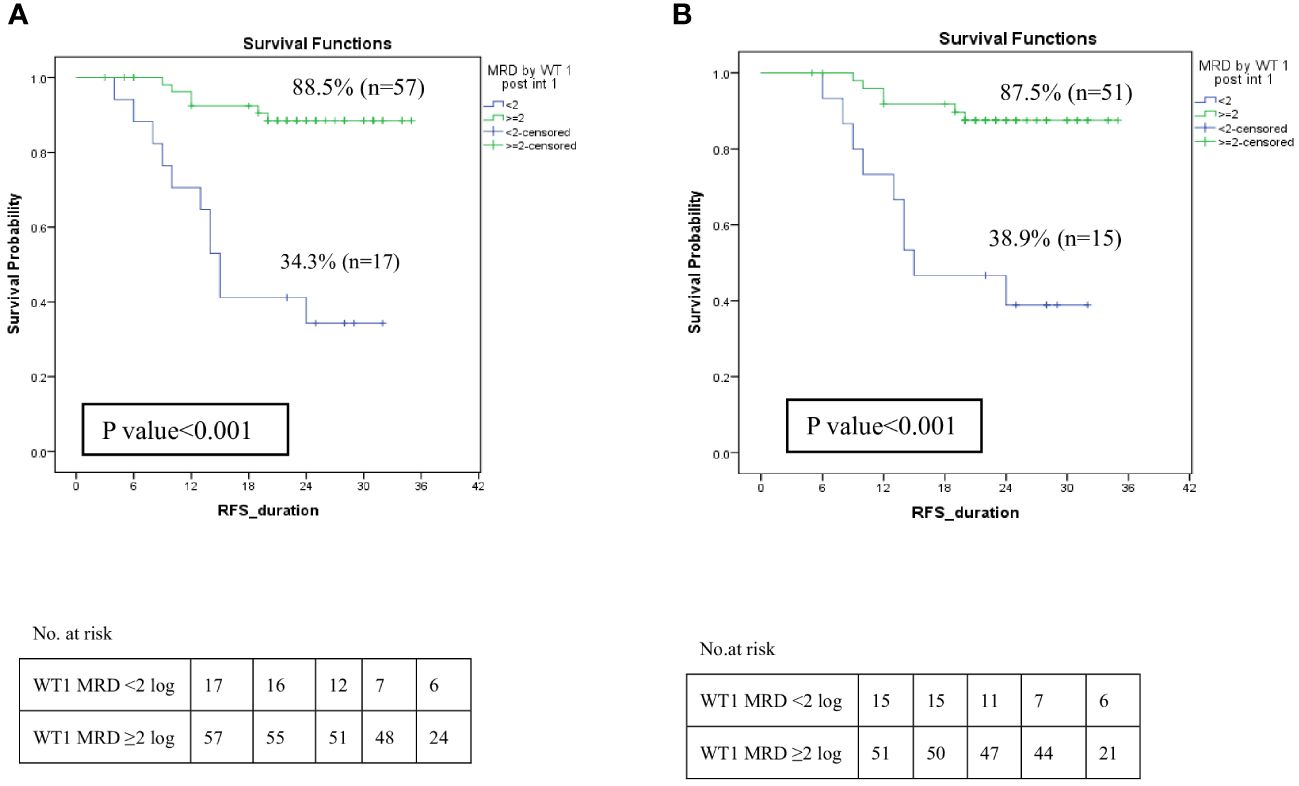
Figure 7 Impact of MRD response by WT1 on relapse-free survival among LR and IR groups post Intensification I. (A) Relapse-free survival of patients with WT1MRD response <2 log reduction vs WT1MRD ≥2 log reduction, (B) Relapse-free survival among patients with negative MRD by MFC (<0.1%) post intensification I (WT1MRD response <2 log reduction vs WT1MRD ≥2 log reduction).
Descriptive analysis for patients with CBF and WT1 was done (n=40). Post intensification, 34 patients achieved MRD negativity by both WT1 and PCR and none of them relapsed. While among the remaining 6 patients with MRD by WT1 (<2 log reduction) and PCR (<3 log reduction), 50% relapsed. Despite the small number of patients precluded detailed statistical analysis, the high concordance rate confirmed that MRD evaluation by molecular testing at this time point is crucial as it predicts relapse and failure to achieve either 3 log by PCR or 2 log by WT1 carries a high incidence of relapse (Supplementary Table 7).
In terms of intermediate-risk patients, WT1MRD showed greater sensitivity compared to MFC (77.8% vs. 22.2%). Notably, patients with WT1MRD positivity had the highest risk of relapse, with a Positive Predictive Value (PPV) of 63.6% and a Negative Predictive Value (NPV) of 87.5%. Contrarily, patients with undetectable MRD by MFC experienced a reduced risk of relapse, with a NPV of 72% and a specificity of 90%. The combination of both MRD assessments enabled patients to capitalize on the high sensitivity of WT1MRD and the high specificity of MFC MRD, effectively stratifying patients into three distinct risk group: negative MRD by both WT1 and MFC, WT1 MRD-ve but MFC MRD+ve, and positive MRD by both WT1 and MFC (Table 3).
The MRD response assessed by WT1 can serve as a valuable tool to pinpoint patients at a high risk of relapse, particularly among pediatric patients lacking identified markers for monitoring. Additionally, it effectively identifies patients within the intermediate-risk (IR) group with a reduced incidence of relapse, thereby influencing treatment strategies. However, to validate these findings and ensure their reliability in clinical decision-making, a larger cohort of patients should be examined.
Measurable residual disease (MRD) by MFC is a strong and independent prognostic marker of relapse in pediatric AML, yet they are still not sensitive enough, since relapse still occurs in a minority of MRD-negative patients and the opposite is true, not all patients with MRD-positive will relapse (12). Therefore, searching for more sensitive molecular markers is of great importance and molecular evidence of residual leukemia cells can predict relapse several months before clinical emergence (13, 14).
The incidence of WT1 gene overexpression in pediatric AML, as reported in previous studies, ranges from 76% to 83% (9, 15–17), which aligns with the current results. However, Juul-Dal et al. showed a much lower incidence of WT1 overexpression (45%) (1). Previous pediatric studies showed that WT1 gene overexpression was significantly associated with M4 FAB subtype, this goes in agreement with our results (91.4% of M4 cases had high WT1 levels, p=0.018) (9, 18, 19). A high incidence of WT1 overexpression in CBF AML was reported, ranging from 87% up to 100% (p<0.001), while a strong inverse correlation with the presence of KMT2A gene rearrangement (p<0.001) suggesting downregulation of WT1 activating pathway in this leukemia subset, as demonstrated in the present study (1, 9, 20).
The ELN in 2021 recommended WT1 gene expression as a marker for MRD assessment especially in patients without identified markers to follow (2, 7). The current results suggested that failure to achieve 2 log reduction by WT1 MRD post induction I predict relapse (2-year CIR was 33.2% vs 7.9%, p=0.008), but this wasn’t reflected on survival analysis which may be explained by treatment-related mortalities during induction. Previous data published by Lapillonne et al. demonstrated that WT1 levels higher than 50 × 104 ABL copies after induction was an independent prognostic risk factor of relapse (p = 0.002) and death (p = 0.02) in pediatric AML (9). While Shimada et al. reported that high WT1 expression after 1st induction chemotherapy would be associated with poor outcomes in pediatric AML patients, (5-year OS for WT1+ve was 54.5% vs 79.4% for WT1-ve patients, p=0.036), but multivariate analyses did not confirm it as an independent poor prognostic factor on the outcome of AML patients (OS, p=0.87 and EFS, p=0.92) (21).
In this study, poor responders (WT1 MRD < 2log reduction) post intensification I exhibited notably reduced OS and EFS compared to those with WT1MRD-ve mostly attributed to a higher cumulative incidence of relapse, which retained its significance as a predictive factor for inferior survival even after accounting for other variables, including initial risk stratification.
These findings align with Cilloni et al. who reported that patients who failed to achieve 2 log reduction by WT1 MRD after intensification therapy were associated with a significant increase in relapse risk (67% vs 42% at 5 years, p= 0.004) (8). Additionally, Nomdedéu et al. analyzed 584 patients under the CETLAM protocol, categorizing them into three groups based on post-intensification WT1 levels (<10, 10.1 to 100, and >100/104 ABL), the OS and LFS were significantly lower among patients with WT1 >100 copies (OS 30%, LFS 24% and CIR 25%, p<0.001) (22).
Furthermore, Candoni et al. reported the impact of MRD negativity before allo-SCT (post intensification I) on the outcome and found that patients with WT1 MRD+ve (WT1 > 250 copies/104 ABL) had significantly lower OS (HR: 3.9, p<0.0001), DFS (HR: 3.73, p<0.0001) and higher cumulative incidence of relapse (HR 5.06, p< 0.0001) compared to MRD negative patients (23).
One of the main objectives of our study was to pinpoint a subset of patients, especially within the intermediate-risk (IR) group who are at a higher risk of relapse and poorer outcomes. Additionally, we aimed to investigate the concordance between MRD results by MFC and WT1MRD to set the stage for different approaches to upfront therapy for this group. We observed that patients with positive MRD by MFC (≥ 0.1%) after induction I but achieved favorable response by WT1MRD had a significantly lower incidence of relapse. Similarly, Marani et al. demonstrated that flow MRD post-induction did not predict DFS. Approximately 40% of flow-MRD+ve patients-maintained CR (p=0.41). In contrast, the response by WT1 MRD response was predictive (DFS 46% for WT1MRD-ve vs 0% for WT1MRD +ve, p<0.001) (24). After intensification I, failure to reduce WT1 transcript level identifies a group of patients at significantly increased risk of relapse despite having negative MRD by MFC (RR 60% vs 9.8% with p<0.001; (RFS 38.9% vs 87.5%, p<0.001).
When comparing WT1 as an MRD marker with other monitoring techniques such as PCR for fusion gene transcripts (RUNX1::RUNX1T1, and CBFB::MYH11), similar sensitivities were observed in predicting the relapse among CBF pediatric patients with AML and failure to achieve either 3 log by PCR or 2 log by WT1 post intensification I carry a higher incidence of relapse regardless response by MFC. Similarly, ELN 2021 stated the importance of molecular monitoring of MRD in CBF patients especially at this time point (2).
The current study demonstrates that combined assessment of MRD by WT1 and MFC ably detected patients at a higher risk of relapse (PPV 100%) and identified patients with low relapse risk (NPV 85.7%) as WT1MRD had higher sensitivity while MFC had better specificity among intermediate risk group even with the small number of patients. The same was reported by Guolo et al, where patients with WT1 MRD positive after consolidation therapy had the highest risk of relapse (negative predictive value (NPV): 79%; positive predictive value (PPV): 62%) whereas patients with undetected MFC MRD had a very low relapse risk (NPV: 92%, PPV: 30%) and combination allowed patients to benefit from both the high PPV of WT1 MRD and the high NPV of MFC MRD (25).
Carlo Marani et al. concluded that integrating cytogenetic risk at diagnosis with MRD assessment using both flow cytometry and WT1 allowed for better classification of AML patients: into three prognostic groups: good (no-high risk features “HR” and flow-MRD-ve), intermediate (no-HR, flow-MRD+ve and WT1 ≥2 log) and adverse prognosis (HR or WT1 < 2 log) with a 3-year DFS of 78.8%, 51.6% and 0%, respectively, p<.001) (24).
In Conclusion, monitoring measurable residual disease by WT1 expression level either alone (especially in pediatric AML patients without other biological markers) or in combination with other MRD markers may improve the reliability of MRD-based prognostic stratification and thus enable the tailoring of treatment intensity. In addition, suboptimal molecular MRD response (defined as <3 log reduction by qPCR or <2 log reduction by WT1) in AML pediatric patients with CBF may influence frontline therapy decisions due to the increased risk of relapse. Therefore, all study groups now apply extensive biological characterization of the AML cells and response based on MRD assessments by both MFC and molecular technique for better risk-group adapted treatment (26).
The original contributions presented in the study are included in the article/Supplementary Material. Further inquiries can be directed to the corresponding author.
The studies involving humans were approved by Children’s Cancer Hospital Egypt Scientific Advisory Committee (SMAC) and the Institutional Review Board (IRB). The studies were conducted in accordance with the local legislation and institutional requirements. Written informed consent for participation in this study was provided by the participants’ legal guardians.
SA: Conceptualization, Writing – original draft. ME: Conceptualization, Data curation, Writing – original draft. DY: Methodology, Validation, Writing – original draft. NE: Methodology, Writing – original draft. AM: Methodology, Writing – original draft. NY: Formal analysis, Writing – original draft. AmE: Formal analysis, Writing – original draft. HH: Supervision, Writing – review & editing. EK: Writing – review & editing. AlE: Supervision, Writing – review & editing.
The author(s) declare that no financial support was received for the research, authorship, and/or publication of this article.
The abstract has been accepted for Poster Presentation at the 28th Congress of the European Hematology Association (EHA) 2023 was held in Frankfurt, Germany, from June 8-11, 2023, and continued virtually on June 14-15, 2023.
The authors declare that the research was conducted in the absence of any commercial or financial relationships that could be construed as a potential conflict of interest.
All claims expressed in this article are solely those of the authors and do not necessarily represent those of their affiliated organizations, or those of the publisher, the editors and the reviewers. Any product that may be evaluated in this article, or claim that may be made by its manufacturer, is not guaranteed or endorsed by the publisher.
The Supplementary Material for this article can be found online at: https://www.frontiersin.org/articles/10.3389/fonc.2024.1340909/full#supplementary-material
AML, Acute myeloid leukemia; APL, Acute promyelocytic leukemia; Allo-HSCT, Allogenic hematopoietic stem cell transplantation; BM, Bone marrow; BMA, Bone marrow aspiration; COG, Children Oncology group; CCHE-57357, Children’s Cancer Hospital Egypt; 57357; CR, Complete remission; CI, Confidence interval; CIR, Cumulative incidence of relapse; DRM, Disease Related Mortality; ELN, European Leukemia Network researchers; EFS, Event-free survival; FLT3/ITD, FLT3 internal tandem duplications; FAB, French British American; HR, Hazards ratio; HR, High risk; IR, Intermediate risk; Ind I, Induction I; Int I, Intensification I; LR, Low risk; MRD, Measurable residual disease; mAbs, Monoclonal antibody; MFC, Multiparametric flow-cytometry; MDS, Myelodysplastic syndrome; NPV, Negative predictive value; NPM1, Nucleophosmin 1; OS, Overall survival; PB, peripheral blood; PCR, Polymerase chain reaction; PPV, Positive predictive value; RT-qPCR, Real-time quantitative polymerase chain reaction; T-AML, Therapy-related AML; TRM, Treatment Related Mortality; WT1, Wilms tumor gene 1.
1. Løvvik Juul-Dam K, Guldborg Nyvold C, Vålerhaugen H, Zeller B, Lausen B, Hasle H, et al. Measurable residual disease monitoring using Wilms tumor gene 1 expression in childhood acute myeloid leukemia based on child-specific reference values. Pediatr Blood Cancer. (2019) 66:e27671. doi: 10.1002/pbc.27671
2. Heuser M, Freeman SD, Ossenkoppele GJ, Buccisano F, Hourigan CS, Ngai LL, et al. 2021 Update on MRD in acute myeloid leukemia: a consensus document from the European LeukemiaNet MRD Working Party. Blood. (2021) 138:2753–67. doi: 10.1182/blood.2021013626
3. Lambert J, Lambert J, Thomas X, Marceau-Renaut A, Micol JB, Renneville A, et al. Early detection of WT1 measurable residual disease identifies high-risk patients, independent of transplantation in AML. Blood Adv. (2021) 5:5258–68. doi: 10.1182/BLOODADVANCES.2021004322
4. Patkar N, Kakirde C, Shaikh AF, Salve R, Bhanshe P, Chatterjee G, et al. Clinical impact of panel-based error-corrected next generation sequencing versus flow cytometry to detect measurable residual disease (MRD) in acute myeloid leukemia (AML). Leukemia. (2021) 35:1392–404. doi: 10.1038/s41375-021-01131-6
5. Jongen-Lavrencic M, Grob T, Hanekamp D, Kavelaars FG, Al Hinai A, Zeilemaker A, et al. Molecular minimal residual disease in acute myeloid leukemia. N Engl J Med. (2018) 378:1189–99. doi: 10.1056/NEJMoa1716863
6. Creutzig U, Zimmermann M, Reinhardt D, Rasche M, von Neuhoff C, Alpermann T, et al. Changes in cytogenetics and molecular genetics in acute myeloid leukemia from childhood to adult age groups. Cancer. (2016) 122:3821–30. doi: 10.1002/cncr.30220
7. Schuurhuis GJ, Heuser M, Freeman S, Béné MC, Buccisano F, Cloos J, et al. Minimal/measurable residual disease in AML: a consensus document from the European LeukemiaNet MRD Working Party. Blood. (2018) 131:1275–91. doi: 10.1182/blood-2017-09-801498
8. Cilloni D, Renneville A, Hermitte F, Hills RK, Daly S, Jovanovic JV, et al. Real-time quantitative polymerase chain reaction detection of minimal residual disease by standardized WT1 assay to enhance risk stratification in acute myeloid leukemia: a European LeukemiaNet study. J Clin Oncol. (2009) 27:5195–201. doi: 10.1200/JCO.2009.22.4865
9. Lapillonne H, Renneville A, Auvrignon A, Flamant C, Blaise A, Perot C, et al. High WT1 expression after induction therapy predicts high risk of relapse and death in pediatric acute myeloid leukemia. J Clin Oncol. (2006) 24:1507–15. doi: 10.1200/JCO.2005.03.5303
10. Getz KD, Alonzo TA, Sung L, Meshinchi S, Gerbing RB, Raimondi S, et al. Four versus five chemotherapy courses in patients with low risk acute myeloid leukemia: A Children’s Oncology Group report. J Clin Oncol. (2017) 35 15_suppl:10515–5. doi: 10.1200/JCO.2017.35.15_suppl.10515
11. Tettero JM, Freeman S, Buecklein V, Venditti A, Maurillo L, Kern W, et al. Technical aspects of flow cytometry-based measurable residual disease quantification in acute myeloid leukemia: experience of the european leukemiaNet MRD working party. HemaSphere. (2021) 6:e676. doi: 10.1097/HS9.0000000000000676
12. Döhner H, Wei AH, Appelbaum FR, Craddock C, DiNardo CD, Dombret H, et al. Diagnosis and management of AML in adults: 2022 recommendations from an international expert panel on behalf of the ELN. Blood. (2022) 140:1345–77. doi: 10.1182/blood.2022016867
13. Yin JAL, O'Brien MA, Hills RK, Daly SB, Wheatley K, Burnett AK. Minimal residual disease monitoring by quantitative RT-PCR in core binding factor AML allows risk stratification and predicts relapse: results of the United Kingdom MRC AML-15 trial. Blood. (2012) 120:2826–35. doi: 10.1182/BLOOD-2012-06-435669
14. Willekens C, Blanchet O, Renneville A, Cornillet-Lefebvre P, Pautas C, Guieze R, et al. Prospective long-term minimal residual disease monitoring using RQ-PCR in RUNX1-RUNX1T1-positive acute myeloid leukemia: results of the French CBF-2006 trial. Haematologica. (2016) 101:328–35. doi: 10.3324/haematol.2015.131946
15. Willasch AM, Gruhn B, Coliva T, Kalinova M, Schneider G, Kreyenberg H, et al. Standardization of WT1 mRNA quantitation for minimal residual disease monitoring in childhood AML and implications of WT1 gene mutations: a European multicenter study. Leukemia. (2009) 23:1472–9. doi: 10.1038/leu.2009.51
16. Trka J, Kalinová M, Hrusák O, Zuna J, Krejcí O, Madzo J, et al. Real-time quantitative PCR detection of WT1 gene expression in children with AML: prognostic significance, correlation with disease status and residual disease detection by flow cytometry. Leukemia. (2002) 16:1381–9. doi: 10.1038/sj.leu.2402512
17. Kramarzova K, Boublikova L, Stary J, Trka J. Evaluation of WT1 expression in bone marrow vs peripheral blood samples of children with acute myeloid leukemia-impact on minimal residual disease detection. Leukemia. (2013) 27:1194–6. doi: 10.1038/leu.2012.291
18. Jacobsohn DA, Tse WT, Chaleff S, Rademaker A, Duerst R, Olszewski M, et al. High WT1 gene expression before hematopoietic stem cell transplant in children with acute myeloid leukemia predicts poor event-free survival. Br J Haematol. (2009) 146:669–74. doi: 10.1111/j.1365-2141.2009.07770.x
19. Deng DX, Wen JJ, Cheng YF, Zhang XH, Xu LP, Wang Y, et al. Wilms' tumor gene 1 is an independent prognostic factor for pediatric acute myeloid leukemia following allogeneic hematopoietic stem cell transplantation. BMC Cancer. (2021) 21:292. doi: 10.1186/s12885-021-08022-0
20. Rodrigues PC, Oliveira SN, Viana MB, Matsuda EI, Nowill AE, Brandalise SR, et al. Prognostic significance of WT1 gene expression in pediatric acute myeloid leukemia. Pediatr Blood Cancer. (2007) 49:133–8. doi: 10.1002/pbc.20953
21. Shimada A, Taki T, Koga D, Tabuchi K, Tawa A, Hanada R, et al. High WT1 mRNA expression after induction chemotherapy and FLT3-ITD have prognostic impact in pediatric acute myeloid leukemia: a study of the Japanese Childhood AML Cooperative Study Group. Int J Hematol. (2012) 96:469–76. doi: 10.1007/s12185-012-1163-1
22. Nomdedéu JF, Hoyos M, Carricondo M, Bussaglia E, Estivill C, Esteve J, et al. Bone marrow WT1 levels at diagnosis, post-induction, and post-intensification in adult de novo AML. Leukemia. (2013) 27:2157–64. doi: 10.1038/leu.2013.111
23. Candoni A, De Marchi F, Zannier ME, Lazzarotto D, Filì C, Dubbini MV, et al. High prognostic value of pre-allogeneic stem cell transplantation minimal residual disease detection by WT1 gene expression in AML transplanted in cytologic complete remission. Leuk Res. (2017) 63:22–7. doi: 10.1016/j.leukres.2017.10.010
24. Marani C, Clavio M, Grasso R, Colombo N, Guolo F, Kunkel A, et al. Integrating post induction WT1 quantification and flow-cytometry results improve minimal residual disease stratification in acute myeloid leukemia. Leuk Res. (2013) 37:1606–11. doi: 10.1016/j.leukres.2013.07.005
25. Guolo F, Minetto P, Clavio M, Miglino M, Galaverna F, Raiola AM, et al. Combining flow cytometry and WT1 assessment improves the prognostic value of pre-transplant minimal residual disease in acute myeloid leukemia. Haematologica. (2017) 102:e348–51. doi: 10.3324/haematol.2017.167254
Keywords: WT1 gene overexpression, measurable residual disease, pediatric AML, outcome, flow cytometry
Citation: Ahmed S, Elsherif M, Yassin D, Elsharkawy N, Mohamed AS, Yasser N, Elnashar A, Hafez H, Kolb EA and Elhaddad A (2024) Integration of measurable residual disease by WT1 gene expression and flow cytometry identifies pediatric patients with high risk of relapse in acute myeloid leukemia. Front. Oncol. 14:1340909. doi: 10.3389/fonc.2024.1340909
Received: 19 November 2023; Accepted: 26 March 2024;
Published: 24 April 2024.
Edited by:
Chihaya Imai, University of Toyama, JapanReviewed by:
Concetta Micalizzi, Giannina Gaslini Institute (IRCCS), ItalyCopyright © 2024 Ahmed, Elsherif, Yassin, Elsharkawy, Mohamed, Yasser, Elnashar, Hafez, Kolb and Elhaddad. This is an open-access article distributed under the terms of the Creative Commons Attribution License (CC BY). The use, distribution or reproduction in other forums is permitted, provided the original author(s) and the copyright owner(s) are credited and that the original publication in this journal is cited, in accordance with accepted academic practice. No use, distribution or reproduction is permitted which does not comply with these terms.
*Correspondence: Mariam Elsherif, TWFyaWFtLmVsc2hlcmlmMjAxM0BnbWFpbC5jb20=; bWFyaWFtLm1vaGFtZWRANTczNTcub3Jn
†These authors have contributed equally to this work and share first authorship
‡These authors have contributed equally to this work and share last authorship
Disclaimer: All claims expressed in this article are solely those of the authors and do not necessarily represent those of their affiliated organizations, or those of the publisher, the editors and the reviewers. Any product that may be evaluated in this article or claim that may be made by its manufacturer is not guaranteed or endorsed by the publisher.
Research integrity at Frontiers

Learn more about the work of our research integrity team to safeguard the quality of each article we publish.