 Salem Saeed Saad Khamis
 Jianhua Lu
 Yongdong Yi1†
 Weijian Sun
- 1The Second Affiliated Hospital and Yuying Children's Hospital of Wenzhou Medical University, Wenzhou, Zhejiang, China
- 2Department of General Surgery, Wenzhou Medical University First Affiliated Hospital, Wenzhou, Zhejiang, China
Gastric cancer (GC) is a prevalent form of malignancy characterized by significant heterogeneity. The development of a specific prediction model is of utmost importance to improve therapy alternatives. The presence of H. pylori can elicit pyroptosis, a notable carcinogenic process. Furthermore, the administration of chemotherapeutic drugs is often employed as a therapeutic approach to addressing this condition. In the present investigation, it was observed that there were variations in the production of 17 pyroptosis-regulating proteins between stomach tissue with tumor development and GC cells. The predictive relevance of each gene associated with pyroptosis was assessed using the cohort from the cancer genome atlas (TCGA). The least absolute shrinkage and selection operator (LASSO) was utilized to enhance the outcomes of the regression approach. Patients with gastric cancer GC in the cohort from the TCGA were categorized into low-risk or high-risk groups based on their gene expression profiles. Patients with a low risk of gastric cancer had a higher likelihood of survival compared to persons classified as high risk (P<0.0001). A subset of patients diagnosed with GC from a Genes Expression Omnibus (GEO) cohort was stratified according to their overall survival (OS) duration. The statistical analysis revealed a higher significance level (P=0.0063) regarding OS time among low-risk individuals. The study revealed that the GC risk score emerged as a significant independent prognostic factor for OS in patients diagnosed with GC. The results of Gene Ontology (GO) and Kyoto Encyclopaedia of Genes and Genomes (KEGG) research revealed that genes associated with a high-risk group had significantly elevated levels of immune system-related activity. Furthermore, it was found that the state of immunity was diminished within this particular group. The relationship between the immune response to cancer and pyroptosis genes is highly interconnected, suggesting that these genes have the potential to serve as prognostic indicators for GC.
Background
Gastric cancer ranks as the third leading cause of cancer-related mortalities globally (1). Approximately one million novel cases of GC are reported annually basis (2) The disease frequently only becomes apparent in its advanced stages when the Tumor microenvironment (TME), which contributes to its diversity has changed. The responses to treatments among GC patients vary significantly, resulting in a poor prognosis (3). Restoring GSDME expression in gastric cancer cells was shown to enhance their sensitivity to chemotherapy and promote tumor shrinkage. Therefore, GSDME is considered a promising therapeutic target in GC. Moreover, its participation in pyroptosis presents an opportunity for the development of novel therapeutic strategies that use the immunogenic cell death process to tackle this dissease (4). Pyroptosis, an atypical form of programmed cell death distinguished by cell inflammation and necrosis. However, skin bulge stem cells have been notably observed in mice with Gsdma3 mutations (5). Abnormal DNA methylation was linked to colorectal cancer in the genome-wide profiling investigation. The study used regression analysis to examine GSDME methylation and expression, finding that CpG methylation affects expression differently. The study also found CpGs that predict tumor and non-tumor tissue states. The data show that GSDME methylation analysis may be a promising colorectal cancer biomarker for clinical practice (6). Pyroptotic cells exhibit bubble-like extensions and undergo expansion, with electron microscopy revealing the creation of numerous vesicles before the cell membrane breaks down and releases cellular matter (7). Cardiolipin, a member of the gasdermin protein family, has structural domains and phosphatidylinositol. Its N-terminal activating domain becomes inactive upon attachment to the membrane and localization at cell membrane holes (8, 9). Members of the gasdermin family promote the formation of pores in the cell membrane, allowing cellular content to leak out and triggering a mild inflammatory response (10, 11). Considering the link between pyroptosis genes and the immune response to cancer, these genes could serve as prognostic indicators for GC.
Both infection and tumorigenesis have been associated with pyroptosis, involving gasdermin proteins, proinflammatory cytokines, and inflammatory vesicles (12). Studies have shown that transgenic mice are at higher susceptibility to colon cancer in comparison to their wild-type counterparts. Unlike apoptosis, which triggers a passive immune response (13). pyroptosis activates and releases signaling molecules and cytokines associated with danger. The objective of this study is to ascertain the specific genes implicated in pyroptosis and assess their expression levels and predictive significance in both healthy gastric tissues and GC tissues.
Additionally, we aim to investigate how pyroptosis relates to the immune microenvironment of tumors. Previous studies have shown that pyroptosis changes the immune environment around a tumor. For example, the population and functional engagement of CD8+ T lymphocytes lacking GSDMD are decreased (14). fatty acid adipocyte migration and triacylglycerol production. PolyclonC3a and C5a, immune-related complement proteins, are downregulated by ASP (15). Complement system effector C3a activates and survives T lymphocytes and stimulates angiogenesis, chemotaxis, mast cell degranulation, and macrophages. It neutralises the proinflammatory effects of C5a and produces pro- and anti-inflammatory responses. C3a controls leukocyte growth in adaptive immunity. Human C3a impacts B cell and monocyte IL-6 and TNF-α production, lowering polyclonal immune response via dose-dependent B cell molecule synthesis (16). C3aR signaling on CD28 and CD40L pathways, antigen-presenting cells, affects T cell proliferation and differentiation. Regulatory T cell synthesis is increased by dendritic cell C3aR loss, but TH1 cell creation and IL-10 expression rely on it (17). while an absence of active C3aR on dendritic cells upregulates the production of T cells. C3a counteracts C5a, leading to diminished inflammation. C3a also blocks neutrophil migration and degranulation. C3a anaphylatoxins contain C-terminal arginine. Serum carboxypeptidase B cleaves the arginine residue of C3a to create desArg, an acylation-stimulating protein (17). Recent research has emphasized the significance of pyroptosis in the anti-tumor function of natural killer (NK) cells (18). Despite its acknowledged role in tumor growth and chemotherapy, the precise impact of pyroptosis in gastric cancer GC has not been thoroughly examined, thus requiring additional research in the present study.
Methods and processes
Datasets
We utilized TCGA data (https://portal.gdc.cancer.gov/) which comprised (RNA-seq) results and related clinical features for 375 GC patients. The RNA-seq data are available through Xenabrowser (https://xenabrowser.net/datapages/). Additionally, we used the GEO database (GSE62254) for data derived from RNA-seq experiments and corroborated clinical data from other sources. The follow-up duration for the GSE62254 cohort spanned up to 6 years, whereas the TCGA cohort had a minimum follow-up duration of 2 years.
Genes differentially expressed in pyroptosis
We gathered data on 17 pyroptosis-related genes and compared their expression between tumors and normal tissues in the TCGA dataset, which comprises 32 normal gastric samples. For comparison, “limma” software identified genes with a P 0.05 significance level after normalizing FPKM data. The levels of significance were indicated as follows: *P < 0.05; **P < 0.01; ***P < 0.001. PPI networks were built using STRING Version 11.0, an interactive tool for retrieving interacting genes, accessible at https://string-db.org/.
Gene prediction model development and validation for pyroptosis
In these experiments, we examined if pyroptotic-related genes could predict survival outcomes. We carried out a Cox regression analysis on the TCGA cohort, setting a cut-off of 0.2 for excluding. The aforementioned procedure resulted in the discovery of seven genes associated with survival. We used the LASSO Cox regression model from the R package ‘glmnet’ to refine our gene selection and build the prognostic model. Even after removing six genes and their coefficients, we kept the penalty parameter (λ) below the lowest qualification. To assess the TCGA dataset’s expression information, we utilized the R language’s scale function. Then, we calculated risk by multiplying each gene’s coefficient by its expression level. After analyzing the median risk score, we classified the TCGA cohort as either low-risk or high-risk. Using the Kaplan-Meier method, we evaluated the median duration of OS for each subgroup. We conducted PCA using the ‘prcomp’ function from the ‘stats’ package in the R programming language. Our analysis specifically focused on a six-gene signature.
In addition, we used the R packages’survminer,’’ survival,’ and ‘time ROC’ to conduct a six-year ROC curve analysis. To corroborate our research, we referred to the GEO database and employed the GC cohort (GSE62254). Consistent with the TCGA cohort, each gene involved in pyroptosis has its expression level standardized using the scale’ command. Following that, the risk score was computed using the same methodology. Participants from the GSE62254 cohort the individuals comprising the GSE62254 cohort were classified into two discrete groups based on their level of risk: low-risk and high-risk. A comparison investigation was undertaken to validate the accuracy and efficacy of the gene model.
Independent predictive risk analysis
The TCGA and GEO cohorts were used for an independent predictive risk study.
The present research included an investigation into the relationship between patients’ ages and phases, revealing a collective impact on the risk score. This study made use of a variety of regression techniques, including multivariate and univariate analyses.
DEG study for improved understanding of low- and high-risk genetic associations
To augment our comprehension of the genetic connections present in both low- and high-risk groups, research was done on DEG. Patients from the TCGA cohort with GC were divided into “low risk” or “high risk. We then identified DEGs in each group using additional criteria, including a mean log2FC of 1 and an FDR of 0.05 or lower. The DEGs were analyzed for GO and KEGG using the ‘cluster profile’ software. To assess the scores of invading immune cells and investigate the activation of immune pathways, we used the ‘give’ method to perform single-sample gene set enrichment analysis (GSA).
Statistical analysis
Here, Gene expression was measured in normal and gastric cancer GC tissues. The overall survival was compared among subgroups using the Kaplan-Meier analysis with a log-rank test to determine significance. We performed univariate and multivariate Cox regression studies to gauge the risk model’s predictive power. The Mann-Whitney test was used to assess the degree of immune cell infiltration and activation of the immune system in both cohorts. R (v4.0.2), a free and open-source statistical analysis program, was used for all studies.
Results
We conducted an analysis of differential gene expression in both normal and cancerous tissues. Seventeen genes associated with pyroptosis were identified in this study with significantly different expressions (P < 0.01) in the TCGA dataset, which comprises 375 tumors and 32 normal tissues. The genes showing decreased expression included NOD1, PLCG1, ELANE, IL18, SCAF11, NLRC4, AIM2, TNF, and GSDMC. On the other hand, there were more PRKACA, PYCARD, GSDMB, GSDMD, CASP3, CASP6, CASP5, and CASP8 in the tumor group (Figure 1A). To visualize these RNA levels, we created gene expression heatmaps, using green to indicate low expression and red for high expression. Our study of how proteins interact with each other showed that genes related to pyroptosis, such as GSDMC, NLRC4, SCAF11, CASP8, ELANE, PLCG1, and NOD1, are involved in many biological processes. The present investigation utilized a particular input parameter to ascertain the minimum permissible interaction score which we set at 0.9 for the PPI analysis (Figure 1B). This analysis included all genes associated with pyroptotic, forming a network of associations (Figure 1C). We denoted positive correlations with the color red and negative correlations with the color blue.
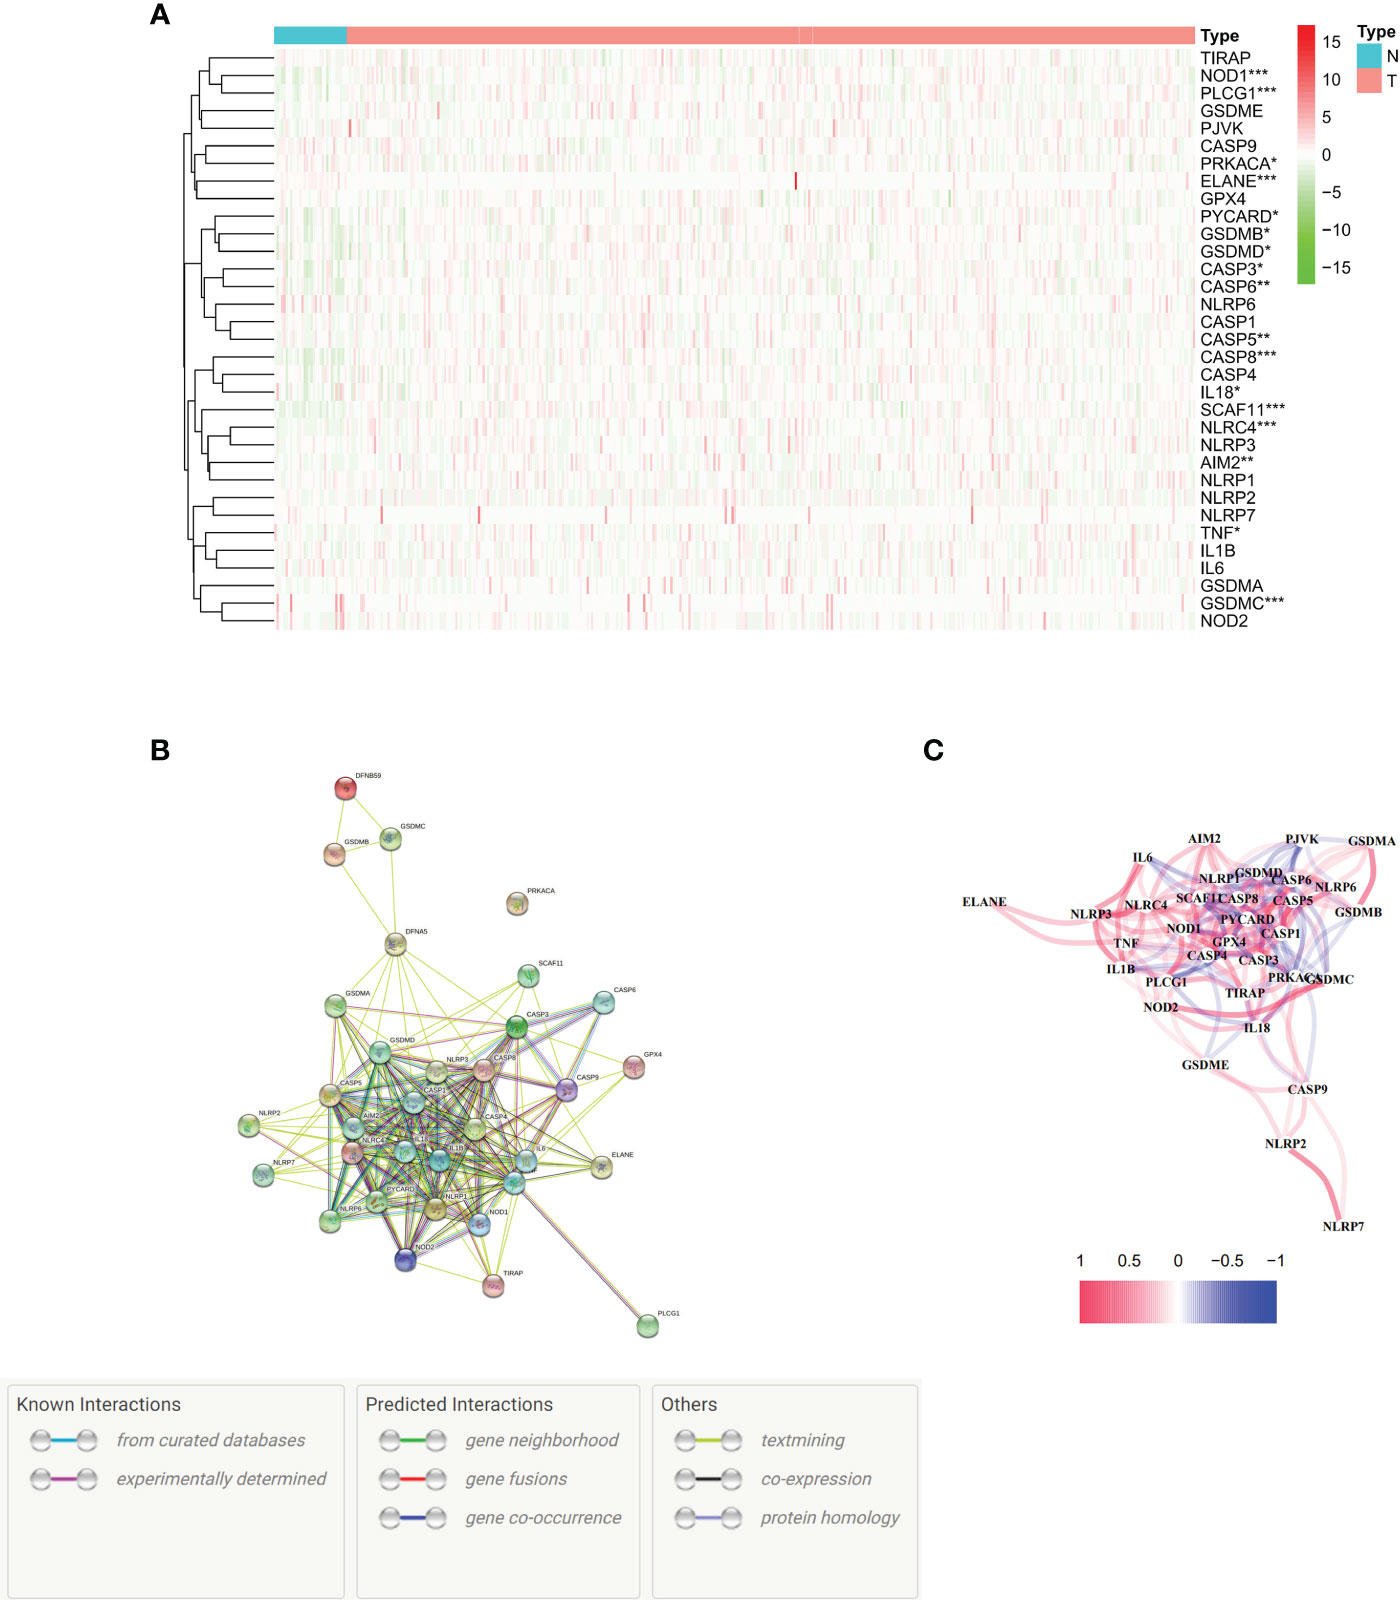
Figure 1 Expression and interactions of 33 pyroptosis-related genes. (A) Heat map illustrating the expression levels of pyroptosis-related genes in normal tissues (N, brilliant blue) and tumor tissues (T, red). The colors represent expression levels, with green indicating low expression and red indicating high expression (*P < 0.01; **P < 0.001; ***P < 0.0001). (B) Protein-Protein Interaction (PPI) network showcasing connections between pyroptosis-related genes with an interaction score of 0.9. (C). Graph depicting the expression of genes positively (red line) and negatively (blue line) associated with pyroptosis. The intensity of the color reflects the strength of the association.
Categorization of tumors using DEGs
This study examined the relationship between pyroptosis-related DEGs and gastric cancer varieties. analysis was conducted on a dataset comprising 375 members from the TCGA, utilizing consensus clustering for comparison. From the 31 identified DEGs, the 375 GC patients were effectively segregated into two unique groups (Figure 2A). A heatmap showed patient gene expression and clinical features. The variables incorporated in this study were tumor differentiation (graded as G1–G3), age (divided into either 67 years old or >67 years old), and the status of survival (categorized as being alive or dying). There were no statistically significant variations in clinical characteristics between the two groups (Figure 2B). The OS time showed no statistically significant difference between the two groups (P = 0.41) (Figure 2C).
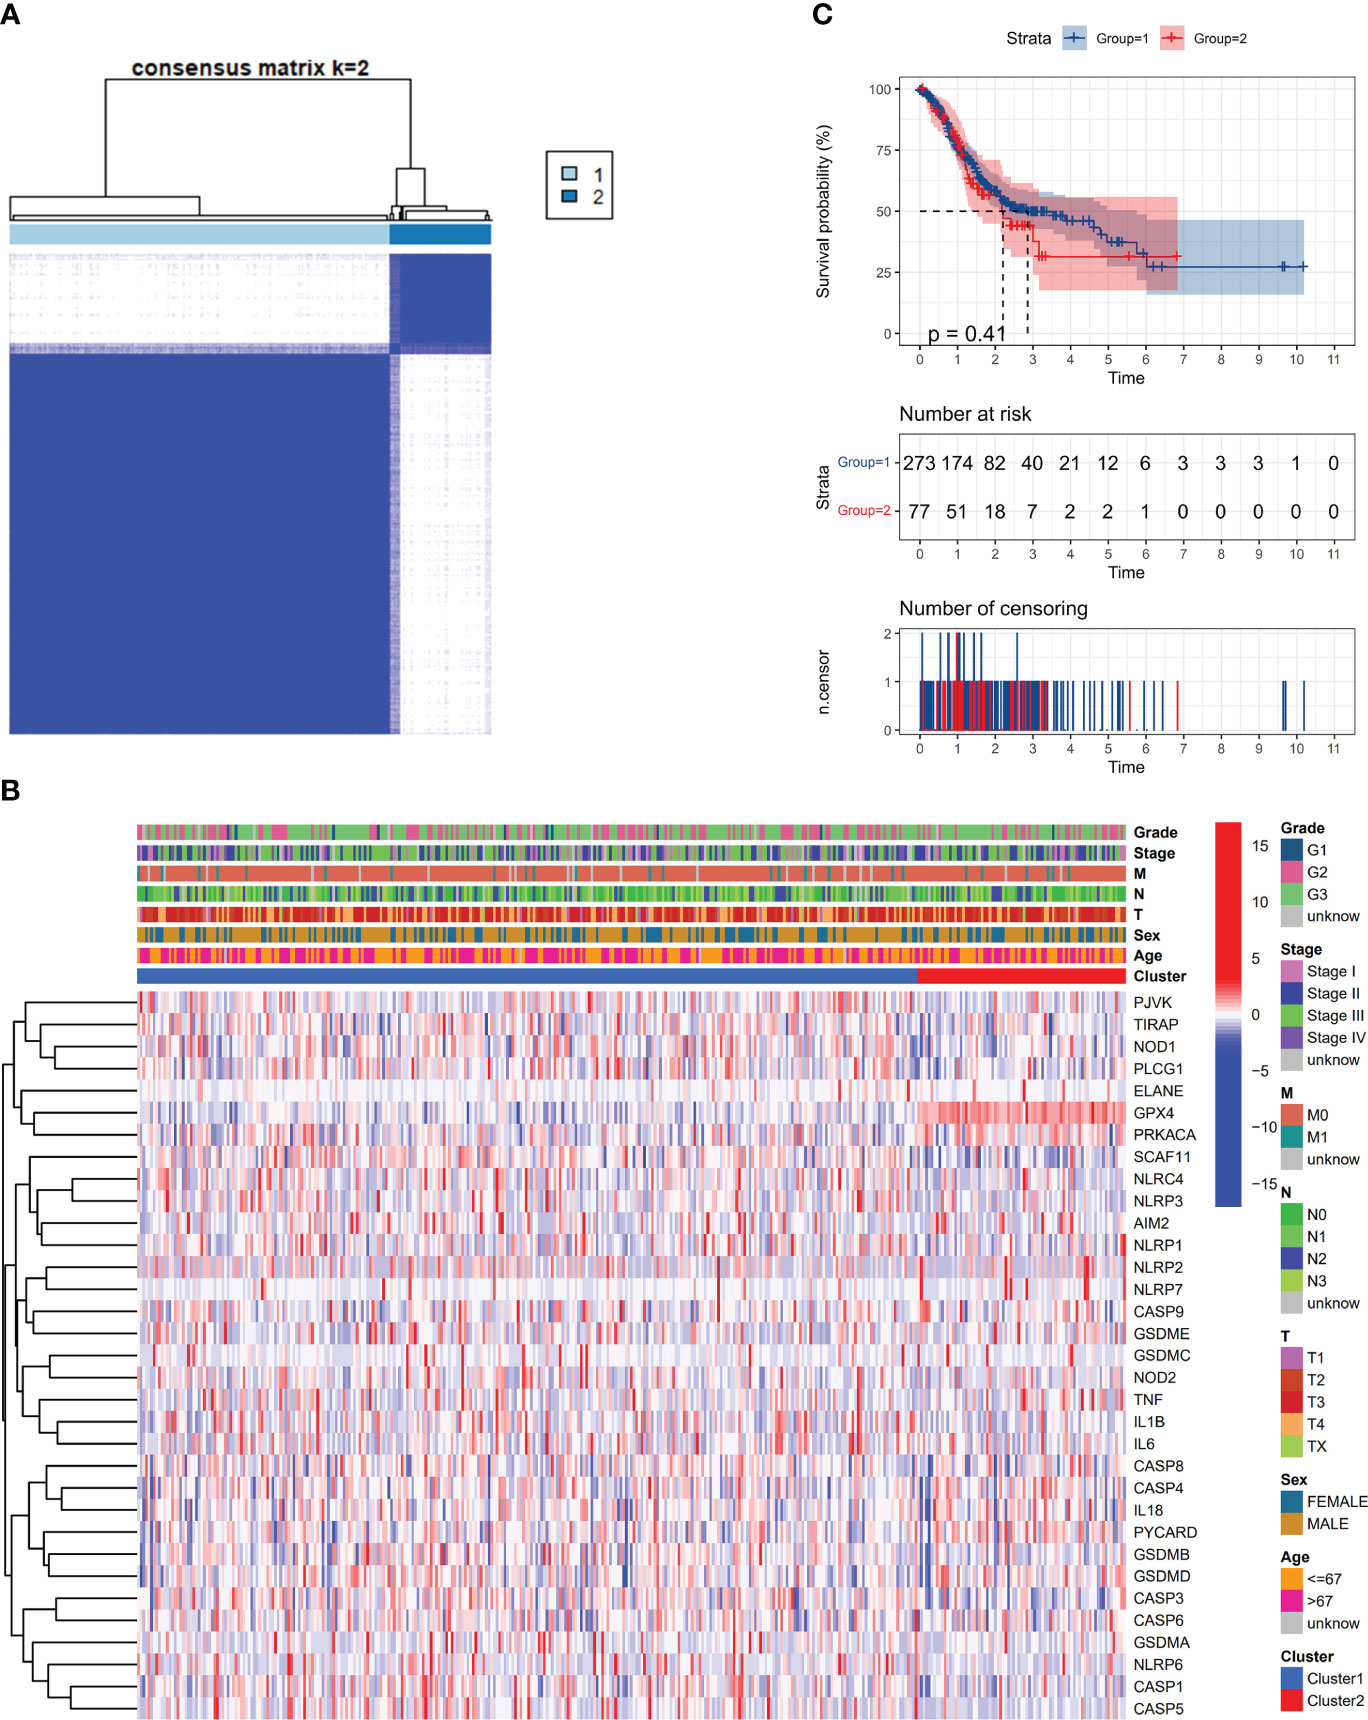
Figure 2 Apoptosis-related DEGs classify tumors. (A) An analysis classified 375 patients with gastric cancer (GC) into two groups using a consensus clustering matrix. (B) Heatmap of DEGs and clinicopathological characteristics of the clusters (G1, G2, and G3 represent tumor differentiation levels: G1 for highly differentiated, G2 for moderately differentiated, and G3 for poorly differentiated). (C) Kaplan-Meier plot illustrating overall survival (OS) development in the clusters.
Gene prognostic model analysis of the TCGA cohort
We conducted an analysis of 375 genotyped gastric cancer samples, along with the corresponding patient survival data. The initial screening for genes associated with survival was carried out using univariate Cox regression analysis. A total of six genes, namely IL6, ELANE, GSDME, TIRAP, PYCARD, and CASP3, were selected for further investigation as they met the criterion of P < 0.01.
There was a significant association between IL6, ELANE, and GSDME and an increased chance of developing GC (HR > 1), while TIRAP, PYCARD, and CASP3 were shown to be associated with a reduced risk (HR < 1) (Figure 3A). To determine the best parameters with which to build a 6-gene signature (Figures 3B, C), we utilized LASSO Cox regression analysis. The risk score was computed via the subsequent mathematical expression: The expression may be written as follows: (0.060 multiplied by the exponential of IL6) + (0.018 multiplied by the exponential of ELANE) + (0.122 multiplied by the exponential of GSDME) + (0.015 multiplied by the exponential of TIRAP) + (0.175 multiplied by the exponential of PYCARD) + (-0.126 multiplied by the exponential of CASP3).
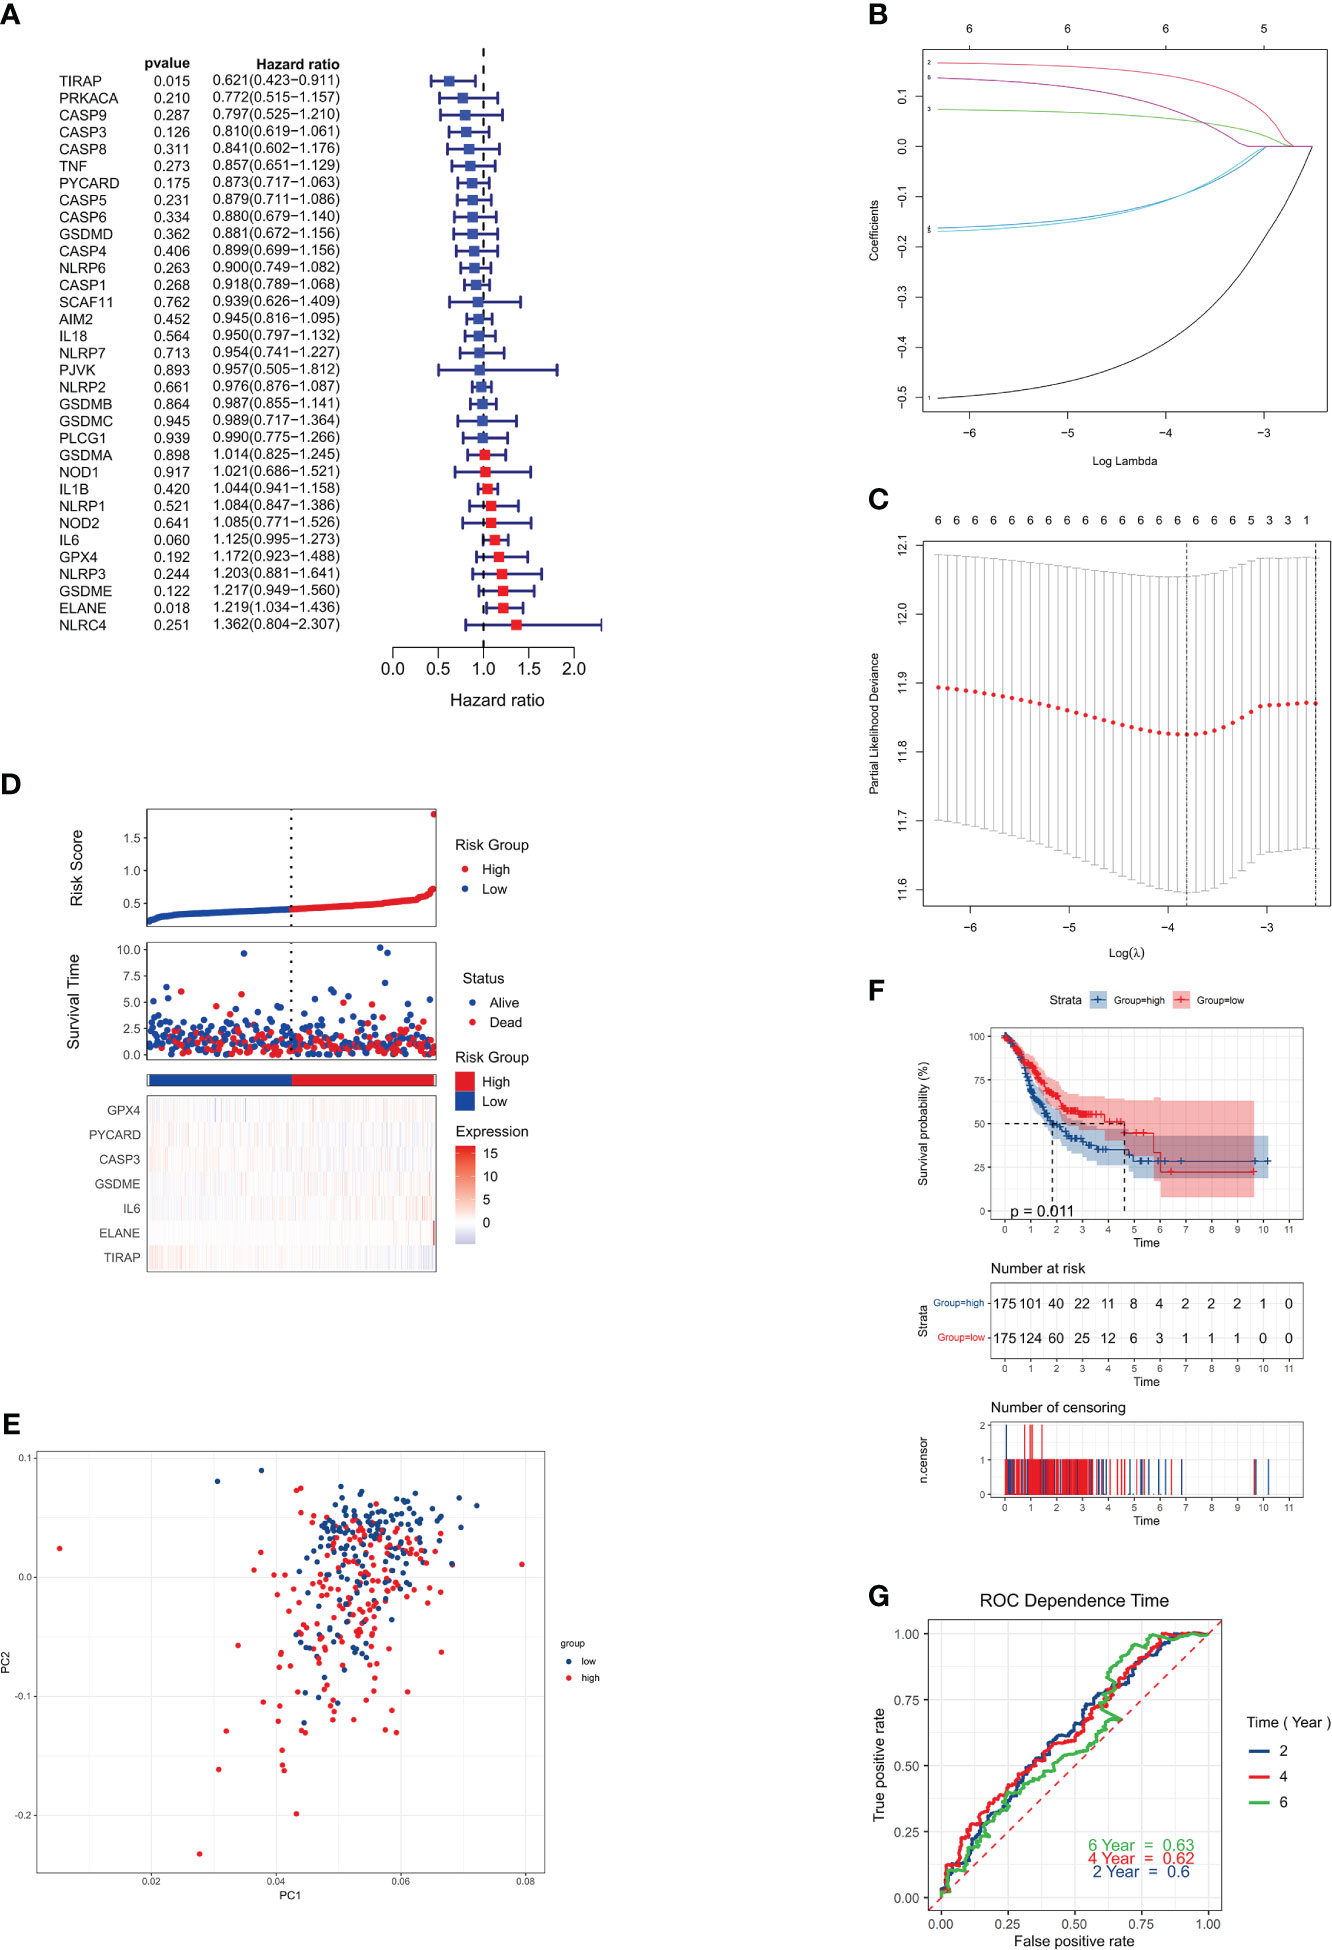
Figure 3 Risk signature for the TCGA cohort. (A) Univariate Cox regression analysis was performed on each pyroptosis-related gene and six other genes, with a P-value cutoff of 0.2. (B) LASSO regression was used to analyze the six genes associated with overall survival (OS). (C) LASSO regression parameters were adjusted through cross-validation. (D) Risk scores for the low-risk group are displayed on the left side of the dotted line, while those for the high-risk group are on the right side. (E) PCA plot for GCs based on the risk score. (F) Kaplan-Meier curves illustrate the risk categories and overall survival (OS) of patients (P = 0.0063). (G) ROC curve demonstrates the predictive ability of the risk score.
The 375 patients were classified into low-risk and high-risk categories, respectively, based on their median risk score (Figure 3D). The use of PCA. successfully classified patients with varying risk levels into these two categories (Figure 3E). Statistically significant disparities were seen in the overall survival durations between the low-risk and high-risk cohorts (P = 0.0063, Figure 3F). Finally, we used time-dependent ROC analysis to assess the prognostic model’s sensitivity and specificity. The ROC curves AUCs indicated 2-, 4-, and 6-year survival rates of 0.58, 0.61, and 0.63, respectively (Figure 3G).
The risk signature’s independent verification
The risk signature was verified externally using the Genes and Expression Omnibus cohort, specifically applying the GSE62254 dataset. The ‘Scale’ tool was used to normalize the gene expression data before further investigation. Based on the median risk score of the TCGA cohort, the mean risk score was determined.
Out of the individuals in the validation cohort, 273 were categorized as low risk while 77 surpassed the threshold, resulting in a high-risk classification. As seen by the solid line on the graph’s left, the low-risk category, demonstrated longer survival spans and decreased mortality rates compared to the high-risk group (Figure 4A). Principal Component Analysis showcased a distinct division between the two risk categories (Figure 4B). The low-risk and high-risk groups had significantly different survival rates (P = 0.011, HR = 1.63; 95% CI (1.16-2.27) (Figure 4C). AUC values of 0.62, 0.63, and 0.63 for 2-year, 4-year, and 6-year survival indicated strong prediction accuracy for the risk signature (Figure 4D).
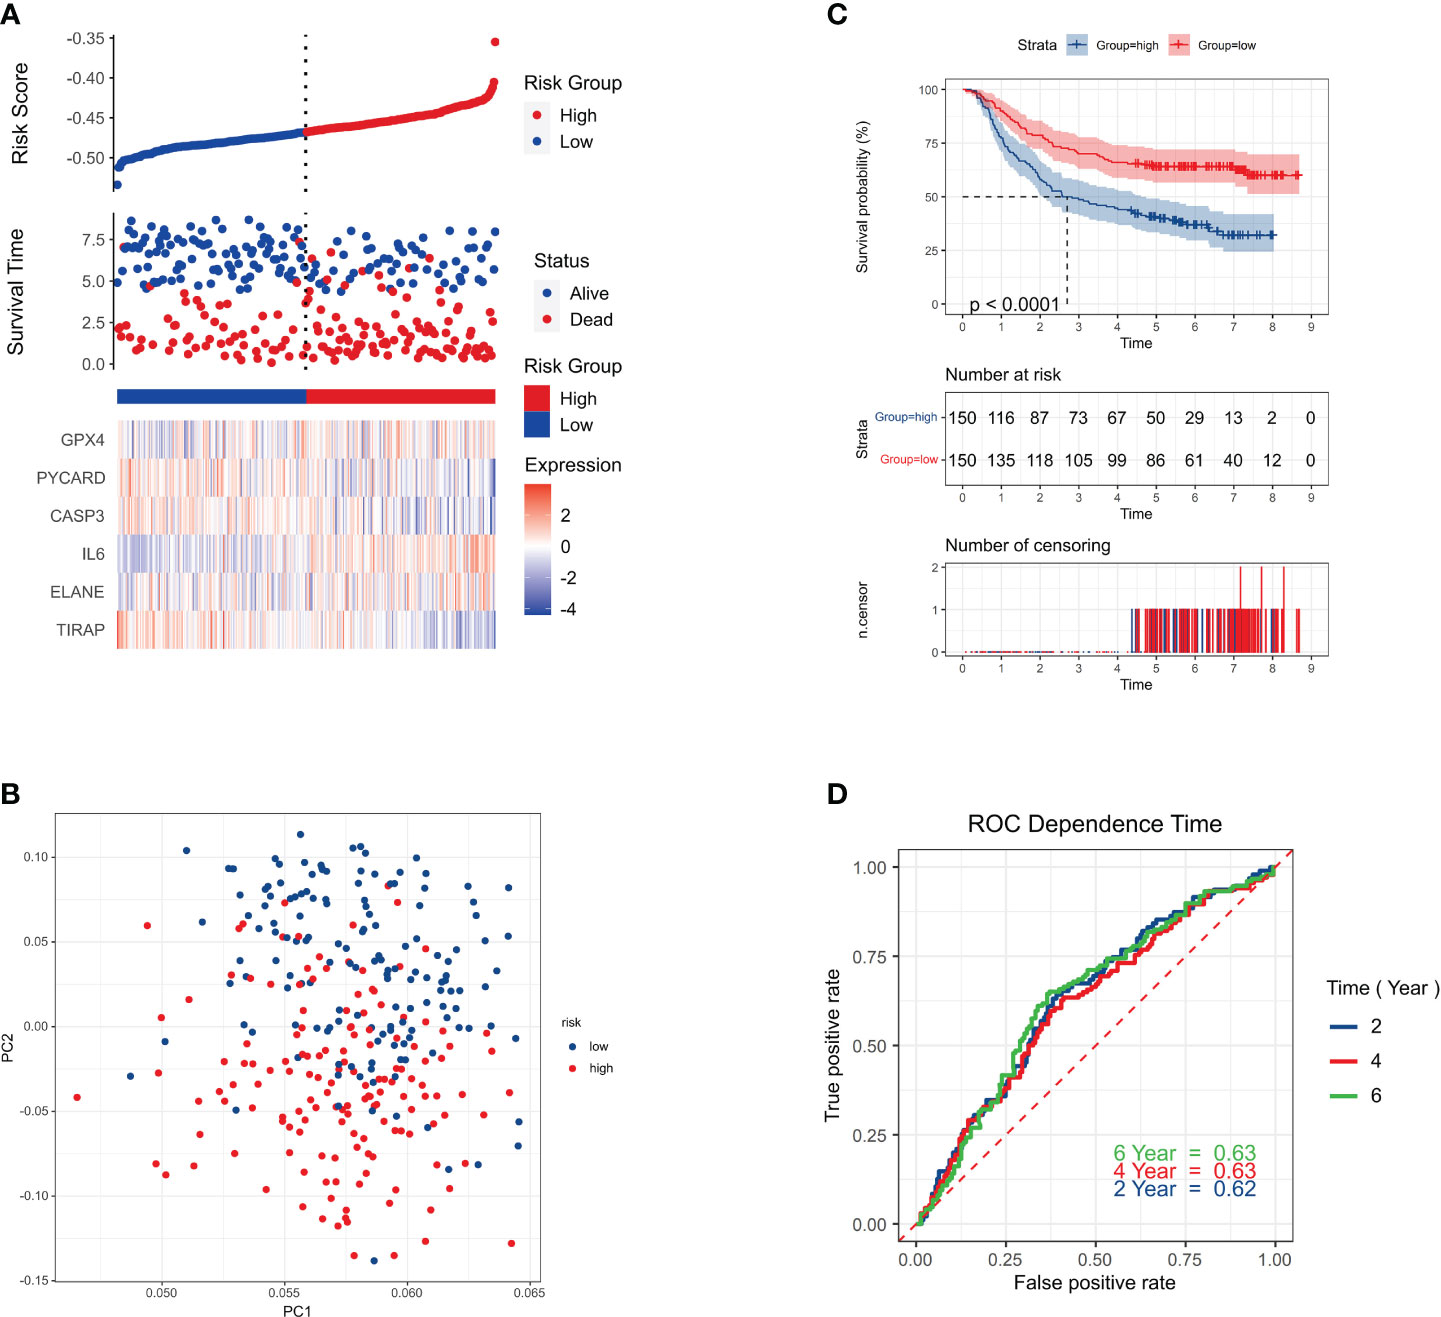
Figure 4 Survival status. (A) Survival status of each patient (low-risk population: left side of the dotted line; high-risk population: right side of the dotted line). (B) PCA plot of GC. (C) Kaplan–Meier curves for the comparison of the OS of low- and high-risk groups. P < 0.011. HR=1.63;95%CI(1.16-2.27) (D) Time-dependent ROC curves of GC.
Risk model indicates independent prognostic value
We performed univariate and multivariate Cox regression analyses to determine the utility of the risk score generated by the gene signature model. The independent variable in the univariate Cox regression analysis was the recognized risk score. Low survival rates were expected in the TCGA and GEO cohorts (HR = 4.520, 95% CI: 1.7873-11.432 and HR: 6.000, 95% CI: 2.316-15.544, (Figures 5A, B). Our multivariate analysis demonstrated that the risk score has prognostic predictive value after controlling for other confounding factors (HR = 2.213, 95% CI: 1.589-3.083 and HR = 1.947, 95% CI: 1.391-2.726, (Figures 5C, D). for patients diagnosed with gastric cancer in both study groups. Additionally, A heatmap was developed to visually represent the clinical features of the TCGA cohort, as shown in (Figure 5E). Notable differences in age and survival status were apparent between patients categorized in the low- and high-risk groups (P < 0.05).
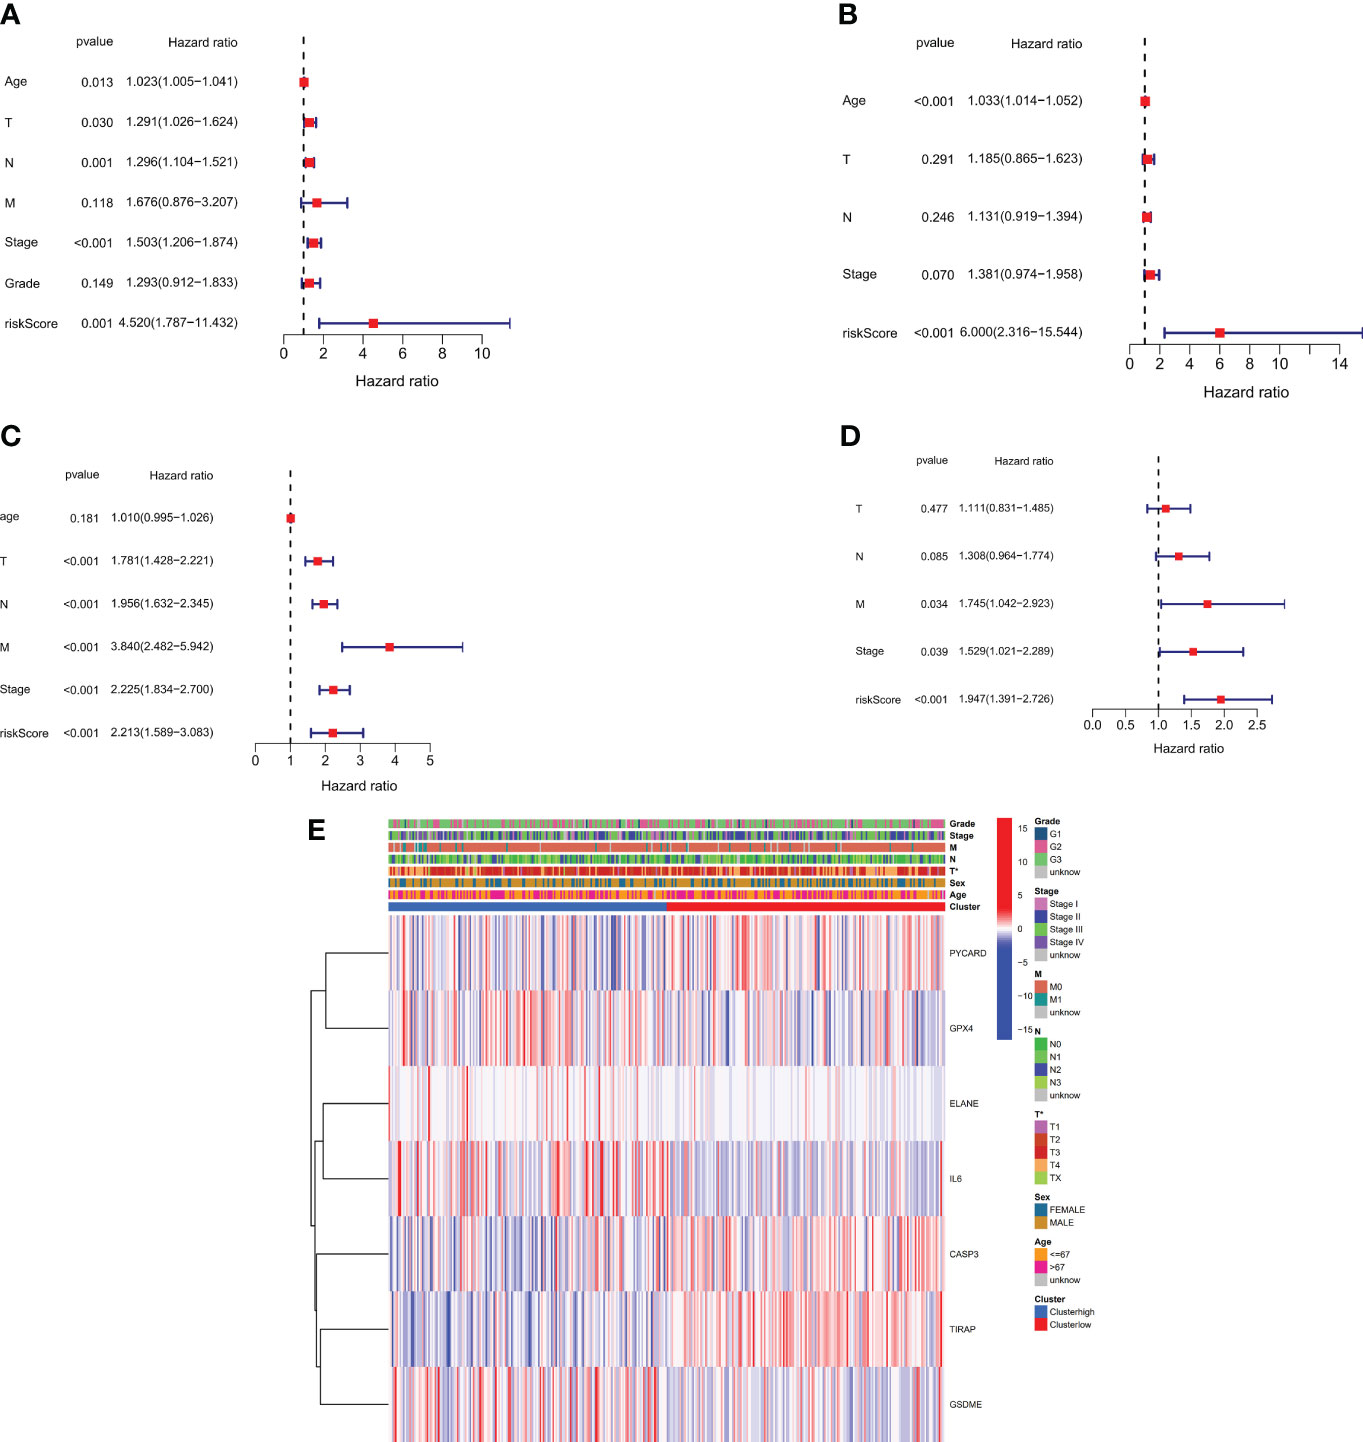
Figure 5 Risk score for univariate and multivariate Cox regression. (A) Univariate analysis of the TCGA cohort (tumor differentiation grade stages: G1 to G3). (B) Multivariate analysis of the TCGA cohort. (C) Univariate analysis of the GEO cohort (FIGO stage: I to IV). (D) Multivariate analysis of the GEO cohort. (E) Heatmap (green: low expression; red: high expression) showing the connections between clinicopathological features and risk grouping (*P < 0.05).
Functional risk assessments
To investigate how risk model subgroups might differ in gene function and pathway, we identified DEGs using the ‘limma’ package in R, setting the FDR at 0.05 and the log2FC at 1. We performed GO enrichment analysis and KEGG pathway analysis based on the identified DEGs. Our research revealed that these DEGs primarily contribute to immune system signaling pathways, inflammatory cells, and chemokines (Figures 6A–D).
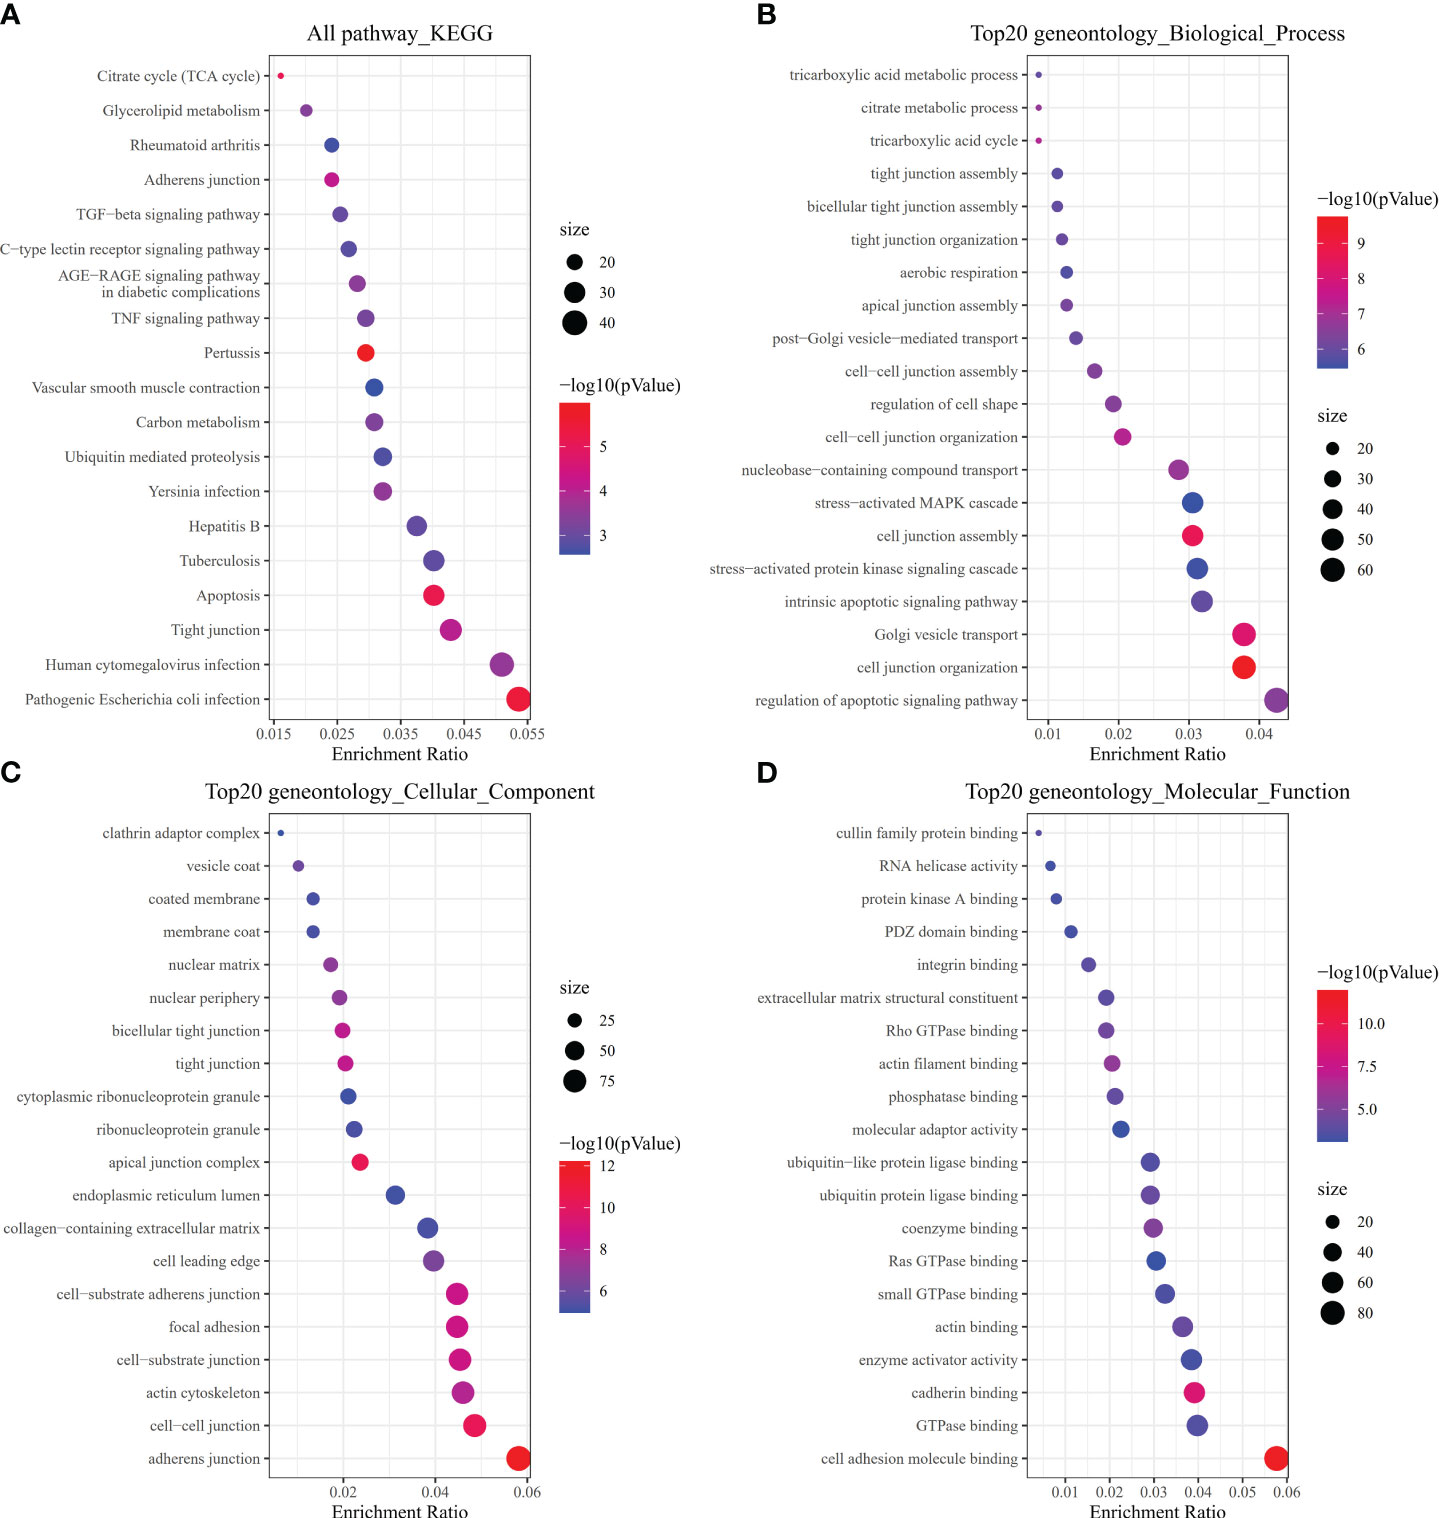
Figure 6 Pathway, biological, and molecular function analyses. (A) All KEGG pathways. (B) Top 20 GO biological processes. (C) Top 20 GO cellular components. (D) Top 20 GO molecular functions.
Levels of immune activity in different subgroups
Using the TCGA and GEO cohorts, Using the ssGSEA, we analyzed the variance in array scores for immune cells (19–23). Thirteen immune-related pathways were activated in the low-risk and high-risk TCGA cohort groups, as shown by the ssGSEA technique (Figure 7A). High-risk individuals had fewer infiltrating immune cells such as CD8+ T cells, neutrophils, (NK) cells, and T helper cells (Tfh, Th1, and Th2 cells), In addition, the analysis of the TCGA cohort demonstrated that the high-risk group had decreased activity levels in 12 immune pathways, except the type-2 IFN response pathway, in comparison to the low-risk group (Figure 7B). Similar findings were seen during the evaluation of the immunological state of the GEO cohort. Notably, the low-risk group showed an abundance of IDCs and macrophages, while the expression of type-2 interferon (IFN) responses was significantly reduced (Figures 7C, D).
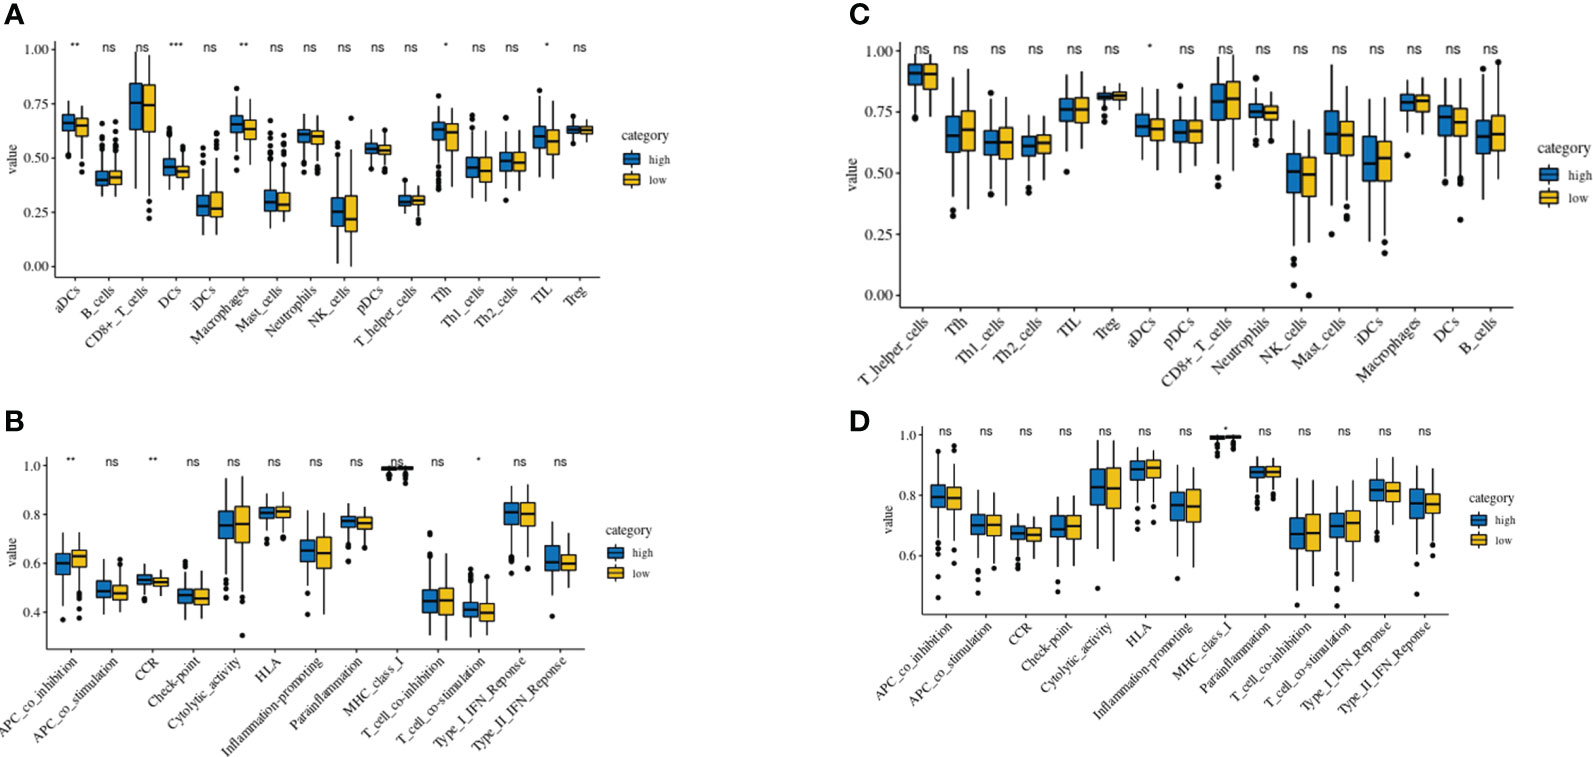
Figure 7 Comparison of the ssGSEA scores of immune cells and immune pathways. (A, B) Low-risk participants in the TCGA cohort had greater enrichment scores than those in the high-risk group based on the analysis of the 16 types of immune cells and 13 immune-related pathways. (C, D) Tumor immunity of the low-risk group (blue box) compared with that of the high-risk group (yellow box) in the GEO cohort. Results are represented by P values indicating that the data are nonsignificant; *P < 0.05; **P < 0.01; ***P < 0.001.
Discussion
The present investigation revealed substantial disparities in the levels of expression of 33 genes related to pyroptosis in GC cells compared to normal tissues. Nevertheless, the consensus clustering analysis conducted on the DEGs did not reveal any statistically significant distinctions in the clinical features between the two groups. To evaluate the predictive value of these findings, we created a set of six regulators consisting of pyroptosis-related regulating genes. We utilized LASSO Cox regression analysis to gather the necessary data for this study, and an external dataset was further subjected to Cox univariate analysis.
The results of the functional analyses revealed statistically significant disparities in DEGs linked to immune-related pathways when comparing the low-risk and high-risk groups. Despite comparable levels of immune cell infiltration, Immune system activation was much lower in the high-risk group than in the low-risk group. Pyroptosis, an exceptional kind of controlled cellular demise, has garnered recent attention due to its pivotal involvement in both neoplastic proliferation and therapeutic interventions. The initiation of this process is prompted by heightened concentrations of inflammatory chemicals, hence potentially resulting in the genesis of malignant cells (24). As a result, focusing on tumor cell pyroptosis might pave the way for novel cancer treatments (25). However, the relationship between genes related to pyroptosis and patient survival in GC is still ambiguous. In this study, we constructed a pyroptosis signature composed of six genes including IL6, ELANE, GSDME, TIRAP, PYCARD, and CASP3 to predict the overall survival rate of GC patients. IL-6, a kind of cytokine recognized for its ability to induce inflammatory responses, is synthesized by several cell types, such as lymphocytes and monocytes. Autoimmune disorders have been shown to correlate with heightened levels of IL-6 and its corresponding receptor (26). Research has indicated that IL-6 can foster the growth of T-helper type 17 cells (25).
Recent research has provided valuable insights into the prominent involvement of IL-6 in several physiological mechanisms. These include cell proliferation, programmed cell death apoptosis, EMT, invasion, and cell migration. Collectively, these actions contribute to the progression and evolution of cancer.
IL-6 plays a key role in numerous protein kinase signaling pathways, the specifics of which depend on the cell type involved. CAR-T treatment can cause toxicities such cytokine release syndrome (CRS) and neurotoxicity due to increased immunological activation and inflammatory cytokines such as IL-6 and IL-1β from monocytes/macrophages. Pyroptotic cells also release DAMPs, which activate macrophages and produce cytokines, activating endothelial cells and CARTOX. The results emphasized the role of monocyte/macrophage in CARTOX and the relevance of pyroptotic cell-generated DAMPs as key contributors and therapeutic targets (27). The effects of chemokines on T cell trafficking and tumor cell metastasis, TLR-DAMP interactions in macrophages and dendritic cells, and cancer treatment targeting the DAMP-TLR-cytokine axis are discussed (28).
The protein ELANE, sometimes referred to as eosinophil cationic protein, is a crucial serine protease involved in the synthesis of tumor necrosis factor-alpha, interleukin 1 beta, and interleukin 18 (29, 30). The extensively established activation of pyroptosis-inducing pathways by these cytokines underscores the significance of ELANE (31). The cleavage and activation of GSDMD by this protein triggers pyroptosis in neutrophils. Despite the high-risk group having a high neutrophil infiltration score, the low-risk group has a much greater expression of ELANE, potentially due to the role of ELANE in stimulating pyroptosis in neutrophils.
GSDME/DFNA5, a member of the gasdermin superfamily (32, 33), is specifically expressed in various tissues such as skin and gastrointestinal tract epithelium (34). GSDME has been shown to serve as a tumor suppressor gene in several cases of stomach, colorectal, and breast malignancies.
It undergoes cleavage and caspase-3 activation in response to both intrinsic and extrinsic apoptotic therapies, leading to pyroptosis, similar to the membrane perforation effects induced by GSDMD (35, 36).
However, the role of GSDME in GC cells has yet to be fully elucidated. GC cells have shown susceptibility to pyroptosis induced by gastrin E GSDME under certain treatment circumstances (37). The notable expression of GSDME could suggest its involvement in widespread pyroptosis (38).
The adapter protein known as MyD88 adapter-like (MAL), or TIRAP (38, 39), is associated with the activation of the host immune response through receptor-mediated mechanisms. It is involved in the innate immune system’s detection of microbial infections via toll-like receptors (40, 41). The PIP2-binding domain (PBD) of MAL allows it to interact with the plasma membrane. This process entails the translocation of MAL to distinct regions on the cellular membrane after the production of PIP2 mediated by PIP5Ka (42–45). The protein known as MAL is comprised of two discrete domains, namely the N-terminal PYD domain and the C-terminal CARD domain, Extrinsic and intrinsic cell death processes depend on these domains (46, 47). PYCARD, also known as ASC, regulates inflammatory and apoptotic signaling pathways. The PYCARD domain of the protein facilitates the assembly of inflammasome complexes by interacting with sensor proteins AIM2, NLRP3 and Caspase-1 (48).
The interaction between PYD and sensor proteins, as well as between ASC and caspase-1, involves the binding of CARD domains. The assembly of inflammasome complexes triggers neutrophil inflammation, resulting in the cleavage, maturation, and subsequent release of IL-1 via the activation of pro-caspase-1, ultimately inducing inflammation (38, 49). Caspase 3, a regulatory protein for cellular apoptosis, is typically dormant. However, the initiation of apoptosis occurs through the activation of Caspase-3, which leads to the cleavage of several structural and regulatory proteins in both the nuclear and cytoplasmic compartments, thus inducing apoptosis (50).
GSDME-N, preferentially cleaved by caspase 3, penetrates membranes, thereby triggering pyroptosis (51). Patients with longer survival periods have been found to have increased levels of Caspase 3, indicating it may have a function in increasing sensitivity to the pyroptosis generated by chemotherapeutic drugs. In addition to boosting NLRP3, ASC, and Caspase 1 inflammasome activation, Caspase 6 has been shown to induce GSDMD-induced pyroptosis (52).
In our model, TIRAP, Caspase 3, and PYCARD were identified as genes promoting pyroptosis, while IL6, GSDME, and ELANE were identified as genes executing pyroptosis. However, it is important to note that modulating these genes did not improve the condition of gastric cancer in our study. Further investigation is required to have a comprehensive understanding of the molecular interactions among these genes in the context of pyroptosis. Biological process GO (BP, MF, and CC) annotations are shown in Figure 6. while Figure D displays the KEGG pathway analysis of the 20 most significant GO enrichment keywords for immune-related DEGs between thoracic aortic aneurysm and dissection (TAAD) and normal tissues.
While pyroptosis shares considerable similarities with apoptosis, our understanding of the former remains limited. Throughout the progression of a tumor, various cell death mechanisms can concurrently exist. Our model includes TIRAP, Casp3, and PYCARD, all of which play regulatory roles in apoptotic pathways. Unlike apoptotic cells that maintain intact membranes and don’t trigger inflammatory responses, pyroptotic cells rupture their membranes and release their contents. The genes identified as differentially expressed primarily contribute to the chemotaxis of inflammatory cells and immune response, suggesting their possible role in triggering cell death.
Given the limited research on pyroptosis, our investigation primarily focused on its mechanism in GC. The three gastrin family genes identified, which potentially induce pyroptosis in GC, along with the other three regulatory genes, could also impact other disorders.
We performed an initial evaluation of these pyroptosis-related genes’ predictive value, aiming to lay the groundwork for future research. However, we have not yet confirmed the role of these regulators in the pyroptosis pathways in GC, underscoring the need for further investigation. Our research has shown a strong correlation between pyroptosis and GCAs is apparent from the observed variations in the expression of genes associated with pyroptosis between normal and gastric cancer tissues. The risk signature based on our six-gene pyroptosis-related panel accurately predicted OS across multiple trials, with significant results.
Conclusions
We observed a notable correlation between tumor immunity and DEGs in both low- and high-risk groups. To investigate GC immunity and pyroptosis-related genes, we created a gene profile for people who might react well to therapy. Our theory suggests that pyroptosis influences tumor composition by triggering severe inflammatory responses within an antibody and phagocyte-dependent microenvironment. In the TCGA and GEO cohorts with high cancer recurrence risks, immune systems appeared compromised.
Our findings revealed a higher prevalence of Treg cells in the low-risk group than in the high-risk group. This discrepancy could be due to the regulatory effect of Treg cells on the inflammatory responses incited by pyroptosis within the TME. We identified Treg cells with divergent functions in TME regulation and found two main subtypes with contrasting regulatory activities. Therefore, insight into the various subtypes of Treg cells in GC is essential for understanding their role in modulating the TME. Moreover, immune pathways in the high-risk groups of both cohorts demonstrated reduced activity. In conclusion, patients with high-risk GCs are more likely to have a poor prognosis because of diminished antitumor immunity.
Data availability statement
The macrophage and gastric datasets can be downloaded at https://www.ncbi.nlm.nih.gov/geo/ the accession number GSE62254 and the RNA-seq data are available at https://xenabrowser.net/datapages/.
Author contributions
KS: Formal analysis, Investigation, Resources, Visualization, Writing – original draft, Writing – review & editing. JL: Investigation, Resources, Validation, Visualization, Writing – review & editing. YY: Writing – review & editing. SR: Project administration, Supervision, Writing – review & editing. WS: Conceptualization, Formal analysis, Funding acquisition, Investigation, Resources, Supervision, Validation, Visualization, Writing – review & editing.
Funding
The author(s) declare financial support was received for the research, authorship, and/or publication of this article. This work was supported by the National Natural Science Foundation of China (Grant Number 81972261), the Major Research Projects of Wenzhou Science and Technology Plan Project (Grant Numbers ZY2020007, Y20210189, ZY2021003 and 2020154), the Key Project Cultivation Project of Wenzhou Medical University (Grant Number KYYW202006), the Key Laboratory of Minimally Invasive Techniques & Rapid Rehabilitation of Digestive System Tumor of Zhejiang Province (Grant Number 21SZDSYS04), Lin He’s New Medicine and Clinical Translation Academician Workstation Research Fund (Grant Numbers 18331202, and 19331104), the Natural Science Foundation of Zhejiang Province (Grant Number LY18H030009) and the Project of Medical Technology and Education of Zhejiang Province of China (Grant Number 202045547).
Conflict of interest
The authors declare that the research was conducted in the absence of any commercial or financial relationships that could be construed as a potential conflict of interest.
Publisher’s note
All claims expressed in this article are solely those of the authors and do not necessarily represent those of their affiliated organizations, or those of the publisher, the editors and the reviewers. Any product that may be evaluated in this article, or claim that may be made by its manufacturer, is not guaranteed or endorsed by the publisher.
Supplementary material
The Supplementary Material for this article can be found online at: https://www.frontiersin.org/articles/10.3389/fonc.2024.1336734/full#supplementary-material
Abbreviations
GC, Gastric cancer; TCGA, The Cancer Genome Atlas; OS, Overall survival; KEGG, Kyoto Encyclopaedia of Genes and Genomes; GO, Gene Ontology; ssGSEA, Single-sample gene set enrichment approach; TME, Tumor microenvironment; RNA-seq, RNA sequencing; DEG, Differentially expressed Gene; FDR, False discovery rate; IL-6, Interleukin-6; LASSO, Least absolute shrinkage and selection operator; PCA, Principal component analysis; ROC, Receiver operating characteristic; GEO, Genes and Expression Omnibus; Treg, Regulatory T cell; PYD, N-terminal PYD domain; CARD,C-terminal CARD domain; PIP2, Phosphatidylinositol 4,5-bisphosphate; GEO,Genes Expression Omnibus; NK, Natural Killer; MAL, MyD88 Adapter-Like; (PBD), Binding domain; CARD, C-terminal CARD domain.
References
1. Smyth EC, Nilsson M, Grabsch HI, van Grieken NC, Lordick F. Gastric cancer. Lancet. (2020) 396:635–48. doi: 10.1016/S0140-6736(20)31288-5
2. Thrift AP, El-Serag HB. Burden of gastric cancer. Clin Gastroenterol Hepatol. (2020) 18:534–42. doi: 10.1016/j.cgh.2019.07.045
3. Bray F, Ferlay J, Soerjomataram I, Siegel RL, Torre LA, Jemal A. Global cancer statistics 2018: GLOBOCAN estimates of incidence and mortality worldwide for 36 cancers in 185 countries. CA Cancer J Clin. (2018) 68:394–424. doi: 10.3322/caac.21492
4. Xia Y, Jin Y, Cui D, Wu X, Song C, Jin W, et al. Antitumor effect of simvastatin in combination with DNA methyltransferase inhibitor on gastric cancer via GSDME-Mediated Pyroptosis. Front Pharmacol. (2022) 13:860546 From NLM PubMed-not-MEDLINE. doi: 10.3389/fphar.2022.860546
5. Kovacs SB, Miao EA. Gasdermins: effectors of pyroptosis. Trends Cell Biol. (2017) 27:673–84. doi: 10.1016/j.tcb.2017.05.005
6. Ibrahim J, Op de Beeck K, Fransen E, Croes L, Beyens M, Suls A, et al. Methylation analysis of Gasdermin E shows great promise as a biomarker for colorectal cancer. Cancer Med. (2019) 8:2133–45. doi: 10.1002/cam4.2103
7. Miao EA, Rajan JV, Aderem A. Caspase-1-induced pyroptotic cell death. Immunol Rev. (2011) 243:206–14. doi: 10.1111/j.1600-065X.2011.01044.x
8. Ding J, Wang K, Liu W, She Y, Sun Q, Shi J, et al. Pore-forming activity and structural autoinhibition of the gasdermin family. Nature. (2016) 535:111–6. doi: 10.1038/nature18590
9. Feng S, Fox D, Man SM. Mechanisms of gasdermin family members in inflammasome signaling and cell death. J Mol Biol. (2018) 430:3068–80. doi: 10.1016/j.jmb.2018.07.002
10. Zhang Y, Chen X, Gueydan C, Han J. Plasma membrane changes during programmed cell deaths. Cell Res. (2018) 28:9–21. doi: 10.1038/cr.2017.133
11. Frank D, Vince JE. Pyroptosis versus necroptosis: similarities, differences, and crosstalk. Cell Death Differ. (2019) 26:99–114. doi: 10.1038/s41418-018-0212-6
12. Kolb R, Liu GH, Janowski AM, Sutterwala FS, Zhang W. Inflammasomes in cancer: a double-edged sword. Protein Cell. (2014) 5:12–20. doi: 10.1007/s13238-013-0001-4
13. Tang R, Xu J, Zhang B, Liu J, Liang C, Hua J, et al. Ferroptosis, necroptosis, and pyroptosis in anticancer immunity. J Hematol Oncol. (2020) 13:110. doi: 10.1186/s13045-020-00946-7
14. Xi G, Gao J, Wan B, Zhan P, Xu W, Lv T, et al. GSDMD is required for effector CD8(+) T cell responses to lung cancer cells. Int Immunopharmacol. (2019) 74:105713. doi: 10.1016/j.intimp.2019.105713
15. Wang Y, Yin B, Li D, Wang G, Han X, Sun X. GSDME mediates caspase-3-dependent pyroptosis in gastric cancer. Biochem Biophys Res Commun. (2018) 495:1418–25. doi: 10.1016/j.bbrc.2017.11.156
16. Chen W, Ye X, Chen Y, Zhao T, Zhou H. M6A methylation of FKFB3 reduced pyroptosis of gastric cancer by NLRP3. Anticancer Drugs. (2024). doi: 10.1097/CAD.0000000000001574
17. Chen J, Li GQ, Zhang L, Tang M, Cao X, Xu GL, et al. Complement C5a/C5aR pathway potentiates the pathogenesis of gastric cancer by down-regulating p21 expression. Cancer Lett. (2018) 412:30–6. doi: 10.1016/j.canlet.2017.10.003
18. Zhang Y, Bai Y, Ma XX, Song JK, Luo Y, Fei XY, et al. Clinical-mediated discovery of pyroptosis in CD8(+) T cell and NK cell reveals melanoma heterogeneity by single-cell and bulk sequence. Cell Death Dis. (2023) 14:553. doi: 10.1038/s41419-023-06068-5
19. Charoentong P, Finotello F, Angelova M, Mayer C, Efremova M, Rieder D, et al. Pan-cancer immunogenomic analyses reveal genotype-immunophenotype relationships and predictors of response to checkpoint blockade. Cell Rep. (2017) 18:248–62. doi: 10.1016/j.celrep.2016.12.019
20. Liu Z, Lu T, Li J, Wang L, Xu K, Dang Q, et al. Clinical significance and inflammatory landscape of aNovel recurrence-associated immune signature in stage II/III colorectal cancer. Front Immunol. (2021) 12:702594 From NLM. doi: 10.3389/fimmu.2021.702594
21. Xing Z, Liu Z, Fu X, Zhou S, Liu L, Dang Q, et al. Clinical significance and immune landscape of a pyroptosis-derived lncRNA signature for glioblastoma. Front Cell Dev Biol. (2022) 10:805291 From NLM. doi: 10.3389/fcell.2022.805291
22. Guo C, Liu Z, Yu Y, Liu S, Ma K, Ge X, et al. Integrated analysis of multi-omics alteration, immune profile, and pharmacological landscape of pyroptosis-derived lncRNA pairs in gastric cancer. Front Cell Dev Biol. (2022) 10:816153 From NLM. doi: 10.3389/fcell.2022.816153
23. Liu Z, Liu L, Weng S, Guo C, Dang Q, Xu H, et al. Machine learning-based integration develops an immune-derived lncRNA signature for improving outcomes in colorectal cancer. Nat Commun. (2022) 13:816. doi: 10.1038/s41467-022-28421-6
24. Zhang Z, Zhang Y, Xia S, Kong Q, Li S, Liu X, et al. Gasdermin E suppresses tumour growth by activating anti-tumour immunity. Nature. (2020) 579:415–20. doi: 10.1038/s41586-020-2071-9
25. Volpe E, Servant N, Zollinger R, Bogiatzi SI, Hupé P, Barillot E, et al. A critical function for transforming growth factor-beta, interleukin 23 and proinflammatory cytokines in driving and modulating human T(H)-17 responses. Nat Immunol. (2008) 9:650–7. doi: 10.1038/ni.1613
26. Xia X, Wang X, Cheng Z, Qin W, Lei L, Jiang J, et al. The role of pyroptosis in cancer: pro-cancer or pro-"host"? Cell Death Dis. (2019) 10:650. doi: 10.1038/s41419-019-1883-8
27. Deng T, Tang C, Zhang G, Wan X. DAMPs released by pyroptotic cells as major contributors and therapeutic targets for CAR-T-related toxicities. Cell Death Dis. (2021) 12:129. doi: 10.1038/s41419-021-03428-x
28. Patidar A, Selvaraj S, Sarode A, Chauhan P, Chattopadhyay D, Saha B. DAMP-TLR-cytokine axis dictates the fate of tumor. Cytokine. (2018) 104:114–23. doi: 10.1016/j.cyto.2017.10.004
29. Kallen KJ. The role of transsignalling via the agonistic soluble IL-6 receptor in human diseases. Biochim Biophys Acta. (2002) 1592:323–43. doi: 10.1016/S0167-4889(02)00325-7
30. Mirea AM, Stienstra R, Kanneganti TD, Tack CJ, Chavakis T, Toonen EJM, et al. Mice deficient in the IL-1β Activation genes prtn3, elane, and casp1 are protected against the development of obesity-induced NAFLD. Inflammation. (2020) 43:1054–64. doi: 10.1007/s10753-020-01190-4
31. Fu Z, Akula S, Thorpe M, Hellman L. Potent and Broad but not Unselective Cleavage of Cytokines and Chemokines by Human Neutrophil Elastase and Proteinase 3. Int J Mol Sci. (2020) 21(2):651. doi: 10.3390/ijms21020651
32. Kambara H, Liu F, Zhang X, Liu P, Bajrami B, Teng Y, et al. Gasdermin D exerts anti-inflammatory effects by promoting neutrophil death. Cell Rep. (2018) 22:2924–36. doi: 10.1016/j.celrep.2018.02.067
33. Hilgert N, Smith RJH, Van Camp G. Forty-six genes causing nonsyndromic hearing impairment: which ones should be analyzed in DNA diagnostics? Mutat Res. (2009) 681:189–96. doi: 10.1016/j.mrrev.2008.08.002
34. Van Laer L, Huizing EH, Verstreken M, van Zuijlen D, Wauters JG, Bossuyt PJ, et al. Nonsyndromic hearing impairment is associated with a mutation in DFNA5. Nat Genet. (1998) 20:194–7. doi: 10.1038/2503
35. Tamura M, Tanaka S, Fujii T, Aoki A, Komiyama H, Ezawa K, et al. Members of a novel gene family, Gsdm, are expressed exclusively in the epithelium of the skin and gastrointestinal tract in a highly tissue-specific manner. Genomics. (2007) 89:618–29. doi: 10.1016/j.ygeno.2007.01.003
36. Op de Beeck K, Van Camp G, Thys S, Cools N, Callebaut I, Vrijens K, et al. The DFNA5 gene, responsible for hearing loss and involved in cancer, encodes a novel apoptosis-inducing protein. Eur J Hum Genet. (2011) 19:965–73. doi: 10.1038/ejhg.2011.63
37. Rogers C, Fernandes-Alnemri T, Mayes L, Alnemri D, Cingolani G, Alnemri ES. Cleavage of DFNA5 by caspase-3 during apoptosis mediates progression to secondary necrotic/pyroptotic cell death. Nat Commun. (2017) 8:14128. doi: 10.1038/ncomms14128
38. Wang Y, Gao W, Shi X, Ding J, Liu W, He H, et al. Chemotherapy drugs induce pyroptosis through caspase-3 cleavage of a gasdermin. Nature. (2017) 547:99–103. doi: 10.1038/nature22393
39. Deng BB, Jiao BP, Liu YJ, Li YR, Wang GJ. BIX-01294 enhanced chemotherapy effect in gastric cancer by inducing GSDME-mediated pyroptosis. Cell Biol Int. (2020) 44:1890–9. doi: 10.1002/cbin.11395
40. O’Neill LA, Bowie AG. The family of five: TIR-domain-containing adaptors in Toll-like receptor signalling. Nat Rev Immunol. (2007) 7:353–64. doi: 10.1038/nri2079
41. Fitzgerald KA, Palsson-McDermott EM, Bowie AG, Jefferies CA, Mansell AS, Brady G, et al. Mal (MyD88-adapter-like) is required for Toll-like receptor-4 signal transduction. Nature. (2001) 413:78–83. doi: 10.1038/35092578
42. Kawai T, Akira S. The role of pattern-recognition receptors in innate immunity: update on Toll-like receptors. Nat Immunol. (2010) 11:373–84. doi: 10.1038/ni.1863
43. Kawasaki T, Kawai T. Toll-like receptor signaling pathways. Front Immunol. (2014) 5:461 From NLM. doi: 10.3389/fimmu.2014.00461
44. Ohtsuka T, Ryu H, Minamishima YA, Macip S, Sagara J, Nakayama KI, et al. ASC is a Bax adaptor and regulates the p53-Bax mitochondrial apoptosis pathway. Nat Cell Biol. (2004) 6:121–8. doi: 10.1038/ncb1087
45. Lu A, Magupalli VG, Ruan J, Yin Q, Atianand MK, Vos MR, et al. Unified polymerization mechanism for the assembly of ASC-dependent inflammasomes. Cell. (2014) 156:1193–206. doi: 10.1016/j.cell.2014.02.008
46. Dowds TA, Masumoto J, Zhu L, Inohara N, Núñez G. Cryopyrin-induced interleukin 1beta secretion in monocytic cells: enhanced activity of disease-associated mutants and requirement for ASC. J Biol Chem. (2004) 279:21924–8. doi: 10.1074/jbc.M401178200
47. Satoh T, Kambe N, Matsue H. NLRP3 activation induces ASC-dependent programmed necrotic cell death, which leads to neutrophilic inflammation. Cell Death Dis. (2013) 4:e644. doi: 10.1038/cddis.2013.169
48. Jiang M, Qi L, Li L, Li Y. The caspase-3/GSDME signal pathway as a switch between apoptosis and pyroptosis in cancer. Cell Death Discov.. (2020) 6:112. doi: 10.1038/s41420-020-00349-0
49. Zheng M, Karki R, Vogel P, Kanneganti TD. Caspase-6 is a key regulator of innate immunity, inflammasome activation, and host defense. Cell. (2020) 181:674–687.e613. doi: 10.1016/j.cell.2020.03.040
50. Wolf D, Wolf AM, Rumpold H, Fiegl H, Zeimet AG, Muller-Holzner E, et al. The expression of the regulatory T cell-specific forkhead box transcription factor FoxP3 is associated with poor prognosis in ovarian cancer. Clin Cancer Res. (2005) 11:8326–31. doi: 10.1158/1078-0432.CCR-05-1244
51. Toker A, Nguyen LT, Stone SC, Yang SYC, Katz SR, Shaw PA, et al. Regulatory T cells in ovarian cancer are characterized by a highly activated phenotype distinct from that in melanoma. Clin Cancer Res. (2018) 24:5685–96. doi: 10.1158/1078-0432.CCR-18-0554
Keywords: pyroptosis, gene signature, gastric cancer, prognosis, inflammation
Citation: Khamis SSS, Lu J, Yi Y, Rao S and Sun W (2024) Pyroptosis-related gene signature for predicting gastric cancer prognosis. Front. Oncol. 14:1336734. doi: 10.3389/fonc.2024.1336734
Received: 11 November 2023; Accepted: 14 February 2024;
Published: 20 March 2024.
Edited by:
Avtar Singh Meena, All India Institute of Medical Sciences, IndiaReviewed by:
Aditya Yashwant Sarode, Columbia University, United StatesJohid Malik, University of Nebraska Medical Center, United States
Copyright © 2024 Khamis, Lu, Yi, Rao and Sun. This is an open-access article distributed under the terms of the Creative Commons Attribution License (CC BY). The use, distribution or reproduction in other forums is permitted, provided the original author(s) and the copyright owner(s) are credited and that the original publication in this journal is cited, in accordance with accepted academic practice. No use, distribution or reproduction is permitted which does not comply with these terms.
*Correspondence: Weijian Sun, ZmFtZTE5ODI4OEAxMjYuY29t; Shangrui Rao, cnNyMTIwQDEyNi5jb20=
†These authors have contributed equally to this work