 Yuhan Hu1†
 Qiang Zhu1†Xuan Dai1Mengni Zhang2Nanxiao Chen3Haoyu Wang1Yuting Wang1Yueyan Cao1Yufang Wang1*Ji Zhang1*
- 1Department of Forensic Genetics, West China School of Basic Medical Sciences and Forensic Medicine, Sichuan University, Chengdu, China
- 2Department of Pathology, West China Hospital, Sichuan University, Chengdu, China
- 3College of Computer Science, Sichuan University, Chengdu, China
Variations in the tumor genome can result in allelic changes compared to the reference profile of its homogenous body source on genetic markers. This brings a challenge to source identification of tumor samples, such as clinically collected pathological paraffin-embedded tissue and sections. In this study, a probabilistic model was developed for calculating likelihood ratio (LR) to tackle this issue, which utilizes short tandem repeat (STR) genotyping data. The core of the model is to consider tumor tissue as a mixture of normal and tumor cells and introduce the incidence of STR variants (φ) and the percentage of normal cells (Mxn) as a priori parameters when performing calculations. The relationship between LR values and φ or Mxn was also investigated. Analysis of tumor samples and reference blood samples from 17 colorectal cancer patients showed that all samples had Log10(LR) values greater than 1014. In the non-contributor test, 99.9% of the quartiles had Log10(LR) values less than 0. When the defense’s hypothesis took into account the possibility that the tumor samples came from the patient’s relatives, LR greater than 0 was still obtained. Furthermore, this study revealed that LR values increased with decreasing φ and increasing Mxn. Finally, LR interval value was provided for each tumor sample by considering the confidence interval of Mxn. The probabilistic model proposed in this paper could deal with the possibility of tumor allele variability and offers an evaluation of the strength of evidence for determining tumor origin in clinical practice and forensic identification.
1 Introduction
Tumor tissue, especially formalin-fixed and paraffin-embedded (FFPE) samples, may be the only source of biological material available for individual identification or kinship analysis (1–6). During tumorigenesis, variations are constantly occurring and accumulating in the cell genome (7). Variants, such as deletions and increases of alleles associated with multiple genetic markers, have been observed in tumor tissues. These result in inconsistent genotyping results compared to normal tissue or blood samples from the same individual. In addition, the allele frequencies used in identification statistical analysis typically do not take into account the effects of disease states such as tumors. This poses a significant obstacle in tumor source identification.
Several retrospective studies have examined the variation pattern and rate of short tandem repeat (STR), a highly polymorphic, easily detectable, and commonly utilized genetic marker (8), and selected specific loci with low variation rates for individual identification of tumor tissue (9–12). Poetsch et al. classified the STR variants observed in tumor tissue into three categories as follows: 1. the additional alleles (Aadd), 2. the new alleles instead of somatic-derived alleles (Anew), and 3. partial or complete loss of heterozygosity (pLOH/LOH), and provided criteria to distinguish LOH from pLOH (13). The possibility of using nuclear genomic SNPs (14, 15) and indels (16), along with mitochondrial SNPs (5, 17) has also been investigated for tumor source identification. However, the aforementioned retrospective study analyzed the existing experimental data empirically. It exclusively selected non-mutated loci for individual identification. Nevertheless, this approach was constrained by the sample size and lacked a statistical metric to quantify the strength of the evidence, i.e., the genotyping profile makes the tumor sample originating from the person of interest more or less probable. Furthermore, the genetic marker indel, which is more significant in mutations, cannot be used to identify the body origin of tumor tissue (16). This is also the case for mitochondrial SNPs due to their heterogeneity.
In research focused on statistical methodologies for discerning the individual origin of tumors, one strategy is to consider tumors as a mixture of tumor cells and normal cells, and treat the two components as independent individuals with a certain level of “genetic relationship.” Based on this assumption, identity by state (IBS) analysis was applied to perform body source identification of tumor samples (18–20). However, these studies did not consider the causes and patterns of STR variation in tumor cells and only provided a conclusion that “cannot be excluded.” Additionally, this approach was insufficient for assessing the strength of evidence for DNA analysis of tumor samples.
It has been shown that the DNA of tumor tissue exhibits a mixed composition, which contains the normal cell population and abnormal cellular subclones arising from the branching evolutionary growth pattern of the tumor (21). Alterations in chromosome number and structure, as well as numerous changes at the genomic level, can be observed in these abnormal cells (7, 22) so that the different STR variants described above were observed when these variations were reflected on the STR profiles. In this case, the frequency of the tumor-derived alleles is no longer equal to the generally used population allele frequency, and this change is associated with the incidence of STR variants. The goal of this study was to develop a probabilistic model for tumor source identification that incorporates the incidence of STR variants and provides a measure of the evidence strength.
The likelihood ratio (LR) provides a numerical value that indicates the relative strength of the evidence for the prosecution’s hypothesis (typically that the evidence came from the person of interest) compared to the defense’s hypothesis (that the evidence is from an unrelated source) (23). In the present study, we attempted to apply a probabilistic modeling strategy for traditional STR profile to tackle the challenge of genomic variation in tumor identification and provide metrics for evaluating the strength of evidence. We innovatively introduce the incidence of STR variants (φ) and the percentage of normal cells (Mxn) as the a priori parameters into the tumor source identification pipeline, which leads to a reasonable and effective LR calculation.
2 Materials and methods
2.1 Sample collection
Colorectal tumor tissue from 17 patients were collected and fixed in 10% neutral-buffered formalin solution for 48–72 h. The tumor samples were treated routinely with xylene transparency following progressive ethanol dehydration, then paraffin embedding to make FFPE samples. Hematoxylin- and eosin-stained slides were reviewed. A pathological diagnosis and the percentage of tumor cells Mxt (24) for each slide were provided. The percentage represented the proportion of tumor cells to the total cell area observed under the microscope. Determination was reached through a consensus of two pathologists with over a decade of experience in molecular pathology (25). Based on this, the percentage of normal cells Mxn was calculated as 1-Mxt. Peripheral blood from the corresponding patients was collected as reference samples. The tumor samples were designated as “HTFD”, while the blood samples were labeled as “HBD”.
2.2 DNA extraction, PCR amplification, and STR typing
Five 10-µm serial sections were obtained for all FFPE samples with the first two to three sections discarded. DNA extraction for both FFPE sections and blood samples was performed using the QIAamp® DNA Mini Kit (QIAGEN, Germany) according to the manufacturer’s instructions. All samples were quantified fluorescently using the Qubit® dsDNA HS Assay kit (Invitrogen, USA). A total of 34 DNA samples were diluted to 1 ng/μl with nuclease-free water as templates. STR-targeted amplification was performed in a total volume of 5 μl using the GlobalFiler™ PCR Amplification Kit (Applied Biosystems, USA). The standard protocol of 29 cycles was used on a Veriti™ 96-Well thermal cycler (Applied Biosystems, USA). Negative controls were always included in the same batch for amplification.
Then, 1 μl of PCR products was mixed with 8.9 μl of Hi-Di formamide (Applied Biosystems, USA) and 0.1 μl of SIZ-500 (AGCU, China) DNA-size standard. Amplicon separation and peak height signal acquisition were carried out on a 3500 Genetic Analyzer (Applied Biosystems, USA) using a 36-cm capillary and POP-4 polymer (Applied Biosystems, USA) with an injection voltage of 1.2 kV and an injection time of 5 s. Data analysis was conducted using GeneMapper ID-X 1.5 software (Applied Biosystems, USA). The AT value was 175 RFU, and locus-specific stutter filtering was performed according to the manufacturer’s instructions, while all other analysis methods were set by default. The data were exported in text format and contained details regarding allele typing and peak height.
To ensure reproducible and credible results, STR typing would be repeated if the genotyping results between the reference sample and the tumor tissue are inconsistent.
2.3 Theoretical considerations
DNA profiles generated from tumor tissue were always DNA mixture profiles because solid tumor tissue is composed of not only tumor cells but also tumor-associated normal epithelial and stromal cells, immune cells, and vascular cells (26). The following mutually exclusive assumptions was made to assess the strength of the evidence that the tumor tissue came from a potentially known individual:
Hp.: The tumor tissue is composed of normal cells and their tumor cells from a known individual.
Hd : The tumor tissue is composed of normal cells and their tumor cells from a random unrelated individual.
The LR was determined by:
2.3.1 Basic assumption
Assumption 1. The STR-CE peak height data generated from tumor samples, which was the object of modeling in this research, also follow the gamma distribution.
During the PCR procedure for DNA, the copy number of the targeted fragment increased with the number of cycles in a binomial distribution (27). Since the peak height detected by the Genetic Analyzer is a measure of the copy number of the PCR end product, it is also subject to stochastic effects throughout the PCR process. Therefore, the peak height data generated from the tumor tissue complies with this principle and follow the gamma distribution (28).
where μ is the peak height expectation, and ω is the coefficient of variation of the peak height (29). The sum of peak heights for each autosomal locus of individual plots was fitted to gamma using maximum likelihood estimation, and quantile–quantile (Q-Q) plots were drawn to confirm the fit of the data to the gamma distribution.
Assumption 2. The height contributions of different cell populations are independent.
Tumor cells are derived from normal cells by mutation, which could generate endogenous mitogenic signals resulting in independent proliferation (30). As a result of ongoing genetic mutations that occurred in tumor cell populations derived from a founder cell, intratumor heterogeneity and different subclones, each of which is a rather stable, homologous cell population with identical genetic composition and independent of each other, are produced according to the clonal evolution model (21).
Assumption 3. STR locus M was independent of each other and in a state of linkage disequilibrium (31).
Assumption 4. Alleles of the specific locus are independent of each other.
The allele frequencies in this research were derived from a population survey of Southwest Han Chinese individuals (32). Therefore, given the assumptions H and the parameters μ ω, the probability of observing the profile E can be written as:
where is the set of genotypes for different cell populations and one of the different genotype combinations at locus m.
2.3.2 Number of contributors
Usually, normal cells are in genomic concordance and can be considered as a homogeneous cell population. However, there may be two or more subclones of abnormal cells. Due to variations in the tumor genome, an STR genetic marker may be present in these subclones with different alleles. Thus, a tumor tissue sample may have a mixed genotype from two or more different cell populations, i.e., a normal cell population and tumor subclones, where K is the total number of cell populations. In this study, the maximum allele count (MAC) method was used to estimate the minimum number of the cell populations corresponding to the number of contributors in tumor tissue. The formula used to determine the minimum number of contributors was as follows:
where ceiling x denoted rounding up by x and Lmax denotes the maximum number of alleles among loci. Based on the above, the two hypothetical propositions could be expressed as follows:
Hp : The tumor tissue is composed of normal cells and their K–1 tumor subclonal cell populations from known individuals.
Hd : The tumor tissue is composed of normal cells and their K–1 tumor subclonal cell populations from random, unrelated individual.
2.3.3 STR variation model
Assumption 5. Genotypes among cell populations are independent given the incidence of STR variants (φ).
In previous research, STR variants in tumor tissue showed the emergence of new alleles and the loss of alleles compared to normal reference samples. In the present study, the incidence of STR variants was assumed to be φ. When the tumor-derived allele was inconsistent with the allele of normal cell after genotype combination at locus m, the frequency of the tumor allele was determined by multiplying the population frequency of the somatic allele by the φm value. The calculation formula was as follows:
where gn is the genotype of the normal cell population, and gt,k is the genotype of the k-th tumor subclones. The origin of variation in each allele of the gt,k, as well as all possible scenarios, were considered. More details can be found in Supplementary Tables 1–3.
The φ value varied across different loci within the same type of tumor. In colorectal cancer, the range of φ for 19 STR loci is [7.75%, 43.41%] (9). To evaluate the effect of φ and Mxn as a priori parameters on the calculated values of LR, the following two experiments were set up:
Experiment 1. The maximum likelihood values were obtained by taking 21 values each in the confidence interval of [Mxn ± 10%] and the range of φ to form a 21 × 21 combination of a priori parameter matrix under Hp and Hd, and then LR was calculated.
Experiment 2. The maximum likelihood values were obtained by taking 21 values each in the confidence interval of [Mxn ± 10%] while φ took the incidence of variants at the corresponding loci. If the locus was not included in the reference (9), the value was substituted with the average value.
2.3.4 Degradation model
Tumor tissue was fixed with formaldehyde during FFPE sample preparation. Formaldehyde-mediated hydroxymethylation of the imino and amino groups of the DNA molecule would result in irreversible denaturation of the DNA molecule and cross-linking of DNA and proteins to prevent protease digestion of the tissue and obstructing nucleic acid extraction. Due to methylene cross-linked bridges between biomolecules, DNA would become more brittle and prone to random breaks when subjected to shear force (33). DNA enzymes also play a role in this process (34). Consequently, the STR profile of FFPE samples showed a “ski-slope-like” profile where the peak height declined with increasing molecular fragment size (35), thus FFPE samples were considered as one of the typical DNA degradation samples in the forensic field (36).
In this study, a degradation model was employed, which was developed based on the research of Tvedebrink et al. (37): the probability of breakage between any two bases in a sequence was uniform. Subsequently, a log-linear model was employed to describe the correlation between the average peak height H and the average fragment size bp at the locus M. After this, the initially estimated degradation coefficients could be obtain using the least squares method. An assessment can then be conducted to determine whether to incorporate degradation parameters in the model. Finally, the parameter of the gamma model could be scaled with the expression for allele at maker m to account for degradation if needed (38).
2.3.5 Other parameters
Because the sample source was tissue cells and the PCR input template amount was 1 ng/μl, the total peak height of each allele in different profiles, including Aadd, was much higher than the analysis threshold. However, most of the drop-in events had lower peak heights. This meant that the probability of high peaks being drop-in events was significantly reduced (39). At the same time, the negative control of the same batch without allelic calling could indicate a minimal probability of drop-in and contamination (40). Stutter was filtered by the appropriate locus threshold according to the kit protocol. Therefore, to avoid making the model more complex, neither the drop-in parameter nor the stutter parameter was introduced in this study. Furthermore, when the value of K exceeded 2, indicating the presence of more than one subclone of tumor cells, it became necessary to estimate the proportion of the tumor cell population (), and the variable satisfied the following formula:
Thus, the probability of observing the profile E can be written as follows:
where φm and Mxn are a priori parameters that are derived without optimization parameter search.
2.4 Hd true test
The non-contributor test was performed to verify the specificity of the LR results (41). The profiles of 1,000 unrelated individuals were randomly generated according to the above frequency table (32), which included 21 autosomal STR loci in the Globalfiler™ kit, and then was adopted as person of interest to calculate LR. The a priori parameter Mxn was divided into five groups, which were the maximum, minimum, and quartile values in the range of the Mxn interval, and each group included 200 unrelated individuals for the non-contributor test.
2.5 Relatedness consideration
As mentioned above, there is a kinship-like genetic relationship between normal cells and tumor cells. To validate whether the model can distinguish the origin of tumor tissue between a true contributor or a close relative of the contributor, this study also performed the analysis of simulated related individuals, including the parent–offspring (PO) and the full-sibling (FS) relationships, while keeping the rest of the model constant.
Here, the following two Hd propositions have been implemented:
HdPO : The tumor tissue is composed of normal cells and their K-1 tumor subclonal cell populations from a known individual’s PO.
HdFS : The tumor tissue is composed of normal cells and their K-1 tumor subclonal cell populations from a known individual’s FS.
The above pipeline was implemented using a Python script that is publicly available on GitHub (https://github.com/HYH-yuhan/TumorID). Through this pipeline, LR could be calculated for each tumor tissue STR profile and the corresponding reference.
3 Result
3.1 Sample overview
The pathological type of all tumor samples was adenocarcinoma. As shown in Table 1, the percentage of tumor cells under HE staining was >30% in each of them. The highest incidence of Aadd was observed among the three mutation types that would result in STR genotype alteration, while no Anew was observed. Specifically, the sample HTFD5719 showed heterozygosity at five loci, whereas its reference HBD5719 was originally homozygous. Five loci displayed three alleles, and two loci exhibited five alleles. The maximum number of alleles for the remaining samples with Aadd was three.
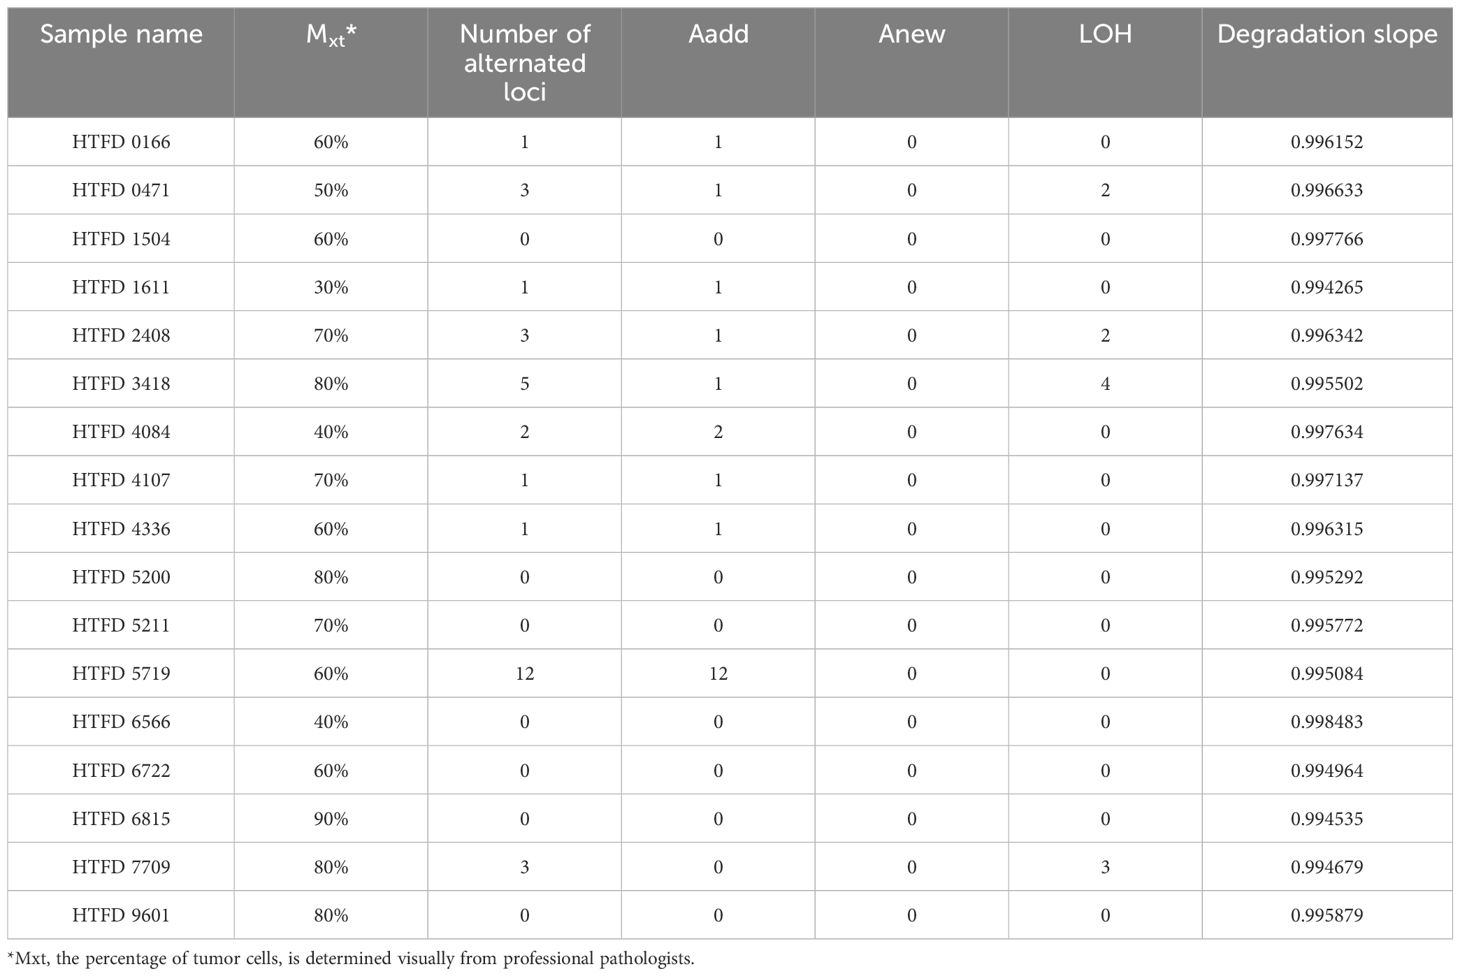
Table 1 Microscopic details and STR profile information of all 17 tumor tissue samples.
3.2 Fitting results of peak height and degradation
In the Q-Q plot of the peak height for the sample HTFD0166 (Figure 1), the scatter was basically distributed along the y = x line indicating that the observed peak height exhibited a strong correspondence with the gamma distribution. The Q-Q plots of the other samples are shown in Supplementary Figure 1, and displayed similar distribution characteristics are as depicted in Figure 1.
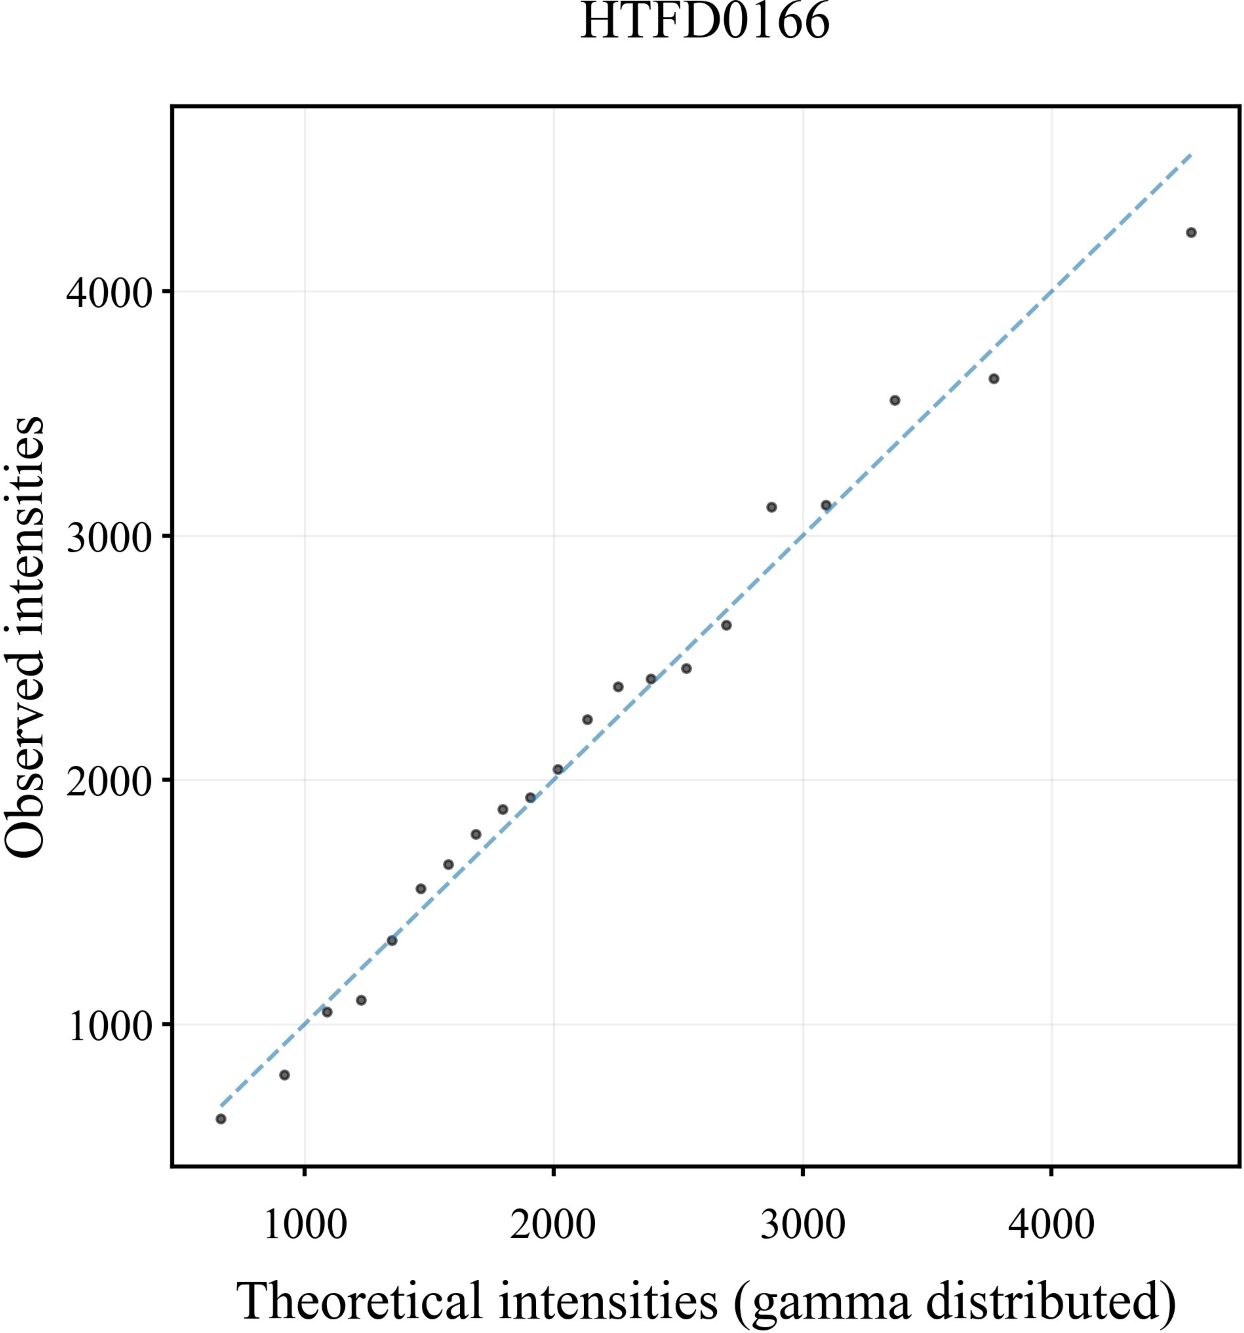
Figure 1 Q-Q plot of peak height derived from the DNA profile of sample HTFD0166.
The degradation slope, representing , of 17 profiles was initially fitted with a log-linear model. The probability of degradation per base pair, denoted by , was equal to (). The for 17 profiles ranged from 0.001517 to 0.005735 according to Table 1. As described in (42), the probability of intact fragments available for amplification is approximately 25%–75% at 200 bp. Therefore, the incorporation of the degradation parameter ε is needed to be considered in subsequent studies.
3.3 LR results
3.3.1 Experiment 1
A total of 441 LR values were calculated for each DNA profile of the FFPE sample. The dependence of LR values on the a priori parameters Mxn and φ in HTFD0166 was analyzed (Figure 2A). The maximum value of LR could be calculated when Mxn was the smallest and φ was the largest. Conversely, the minimum value of LR could be obtained when Mxn was the largest and φ was the smallest. Log10 (LR) increased with increased Mxn or decreased φ, and there exists a linear correlation between the variables. A linear fit through R showed that, for example, when , , Pearson’s r was 0.99201, and adjusted R2 was 0.98325 (Figure 2B). In another situation, when , , Pearson’s r was −0.99967, and adjusted R2 was 0.99931 (Figure 2C). Among all 17 profiles, adjusted R2 and Pearson’s r for the linear fits of to φ were between [0.9003, 0.9999] and [0.9513, 0.9999], respectively. For the same fits to Mxn, they were between [0.9674, 1.000] and [−1.000, −0.9844], respectively. Both showed a strong linear correlation (43). For more details, refer to Supplementary Figure 2 and Supplementary Tables 4–20.
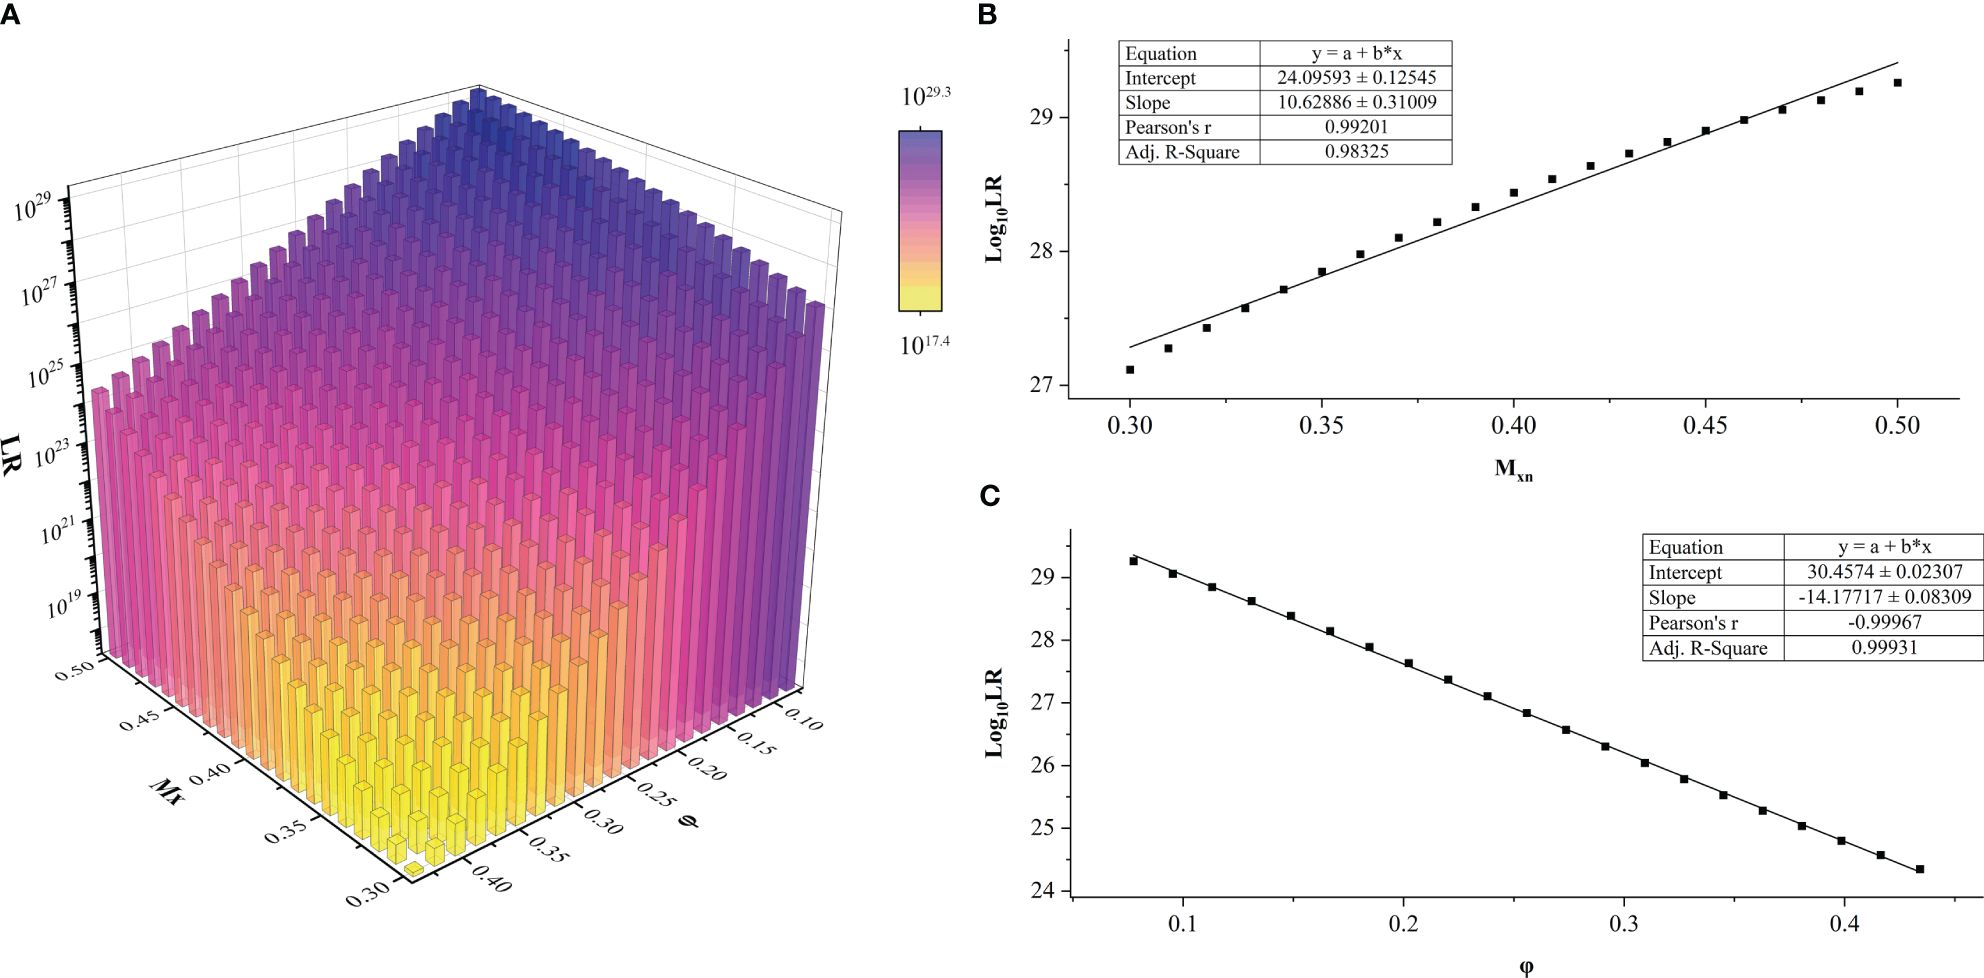
Figure 2 LR values of sample HTFD0166 from Experiment 1. (A) LR results obtained within the parameters of gradient φ and Mxn, LRmax = 1029.3; LRmin = 1017.4. (B) When φ was fixed, Log10 (LR) varied linearly with Mxn. This graph was illustrated with φ = 0.0775. (C) When Mxn was fixed, Log10 (LR) varied linearly with φ. This graph was illustrated with Mxn = 0.5 as an example.
3.3.2 Experiment 2
The value was linearly increased with Mxn in each of the samples (Figure 3). The maximum average of was 27.6370 with sample HTFD1611, which had the largest Mxn in Table 1; the minimum average of was 17.2624 belonging to HTFD6815, which had the smallest Mxn. All values were much larger than 1, which significantly supported the prosecution’s hypothesis that the tumor tissue was composed of normal cells and their tumor subclonal cell populations from known individuals.
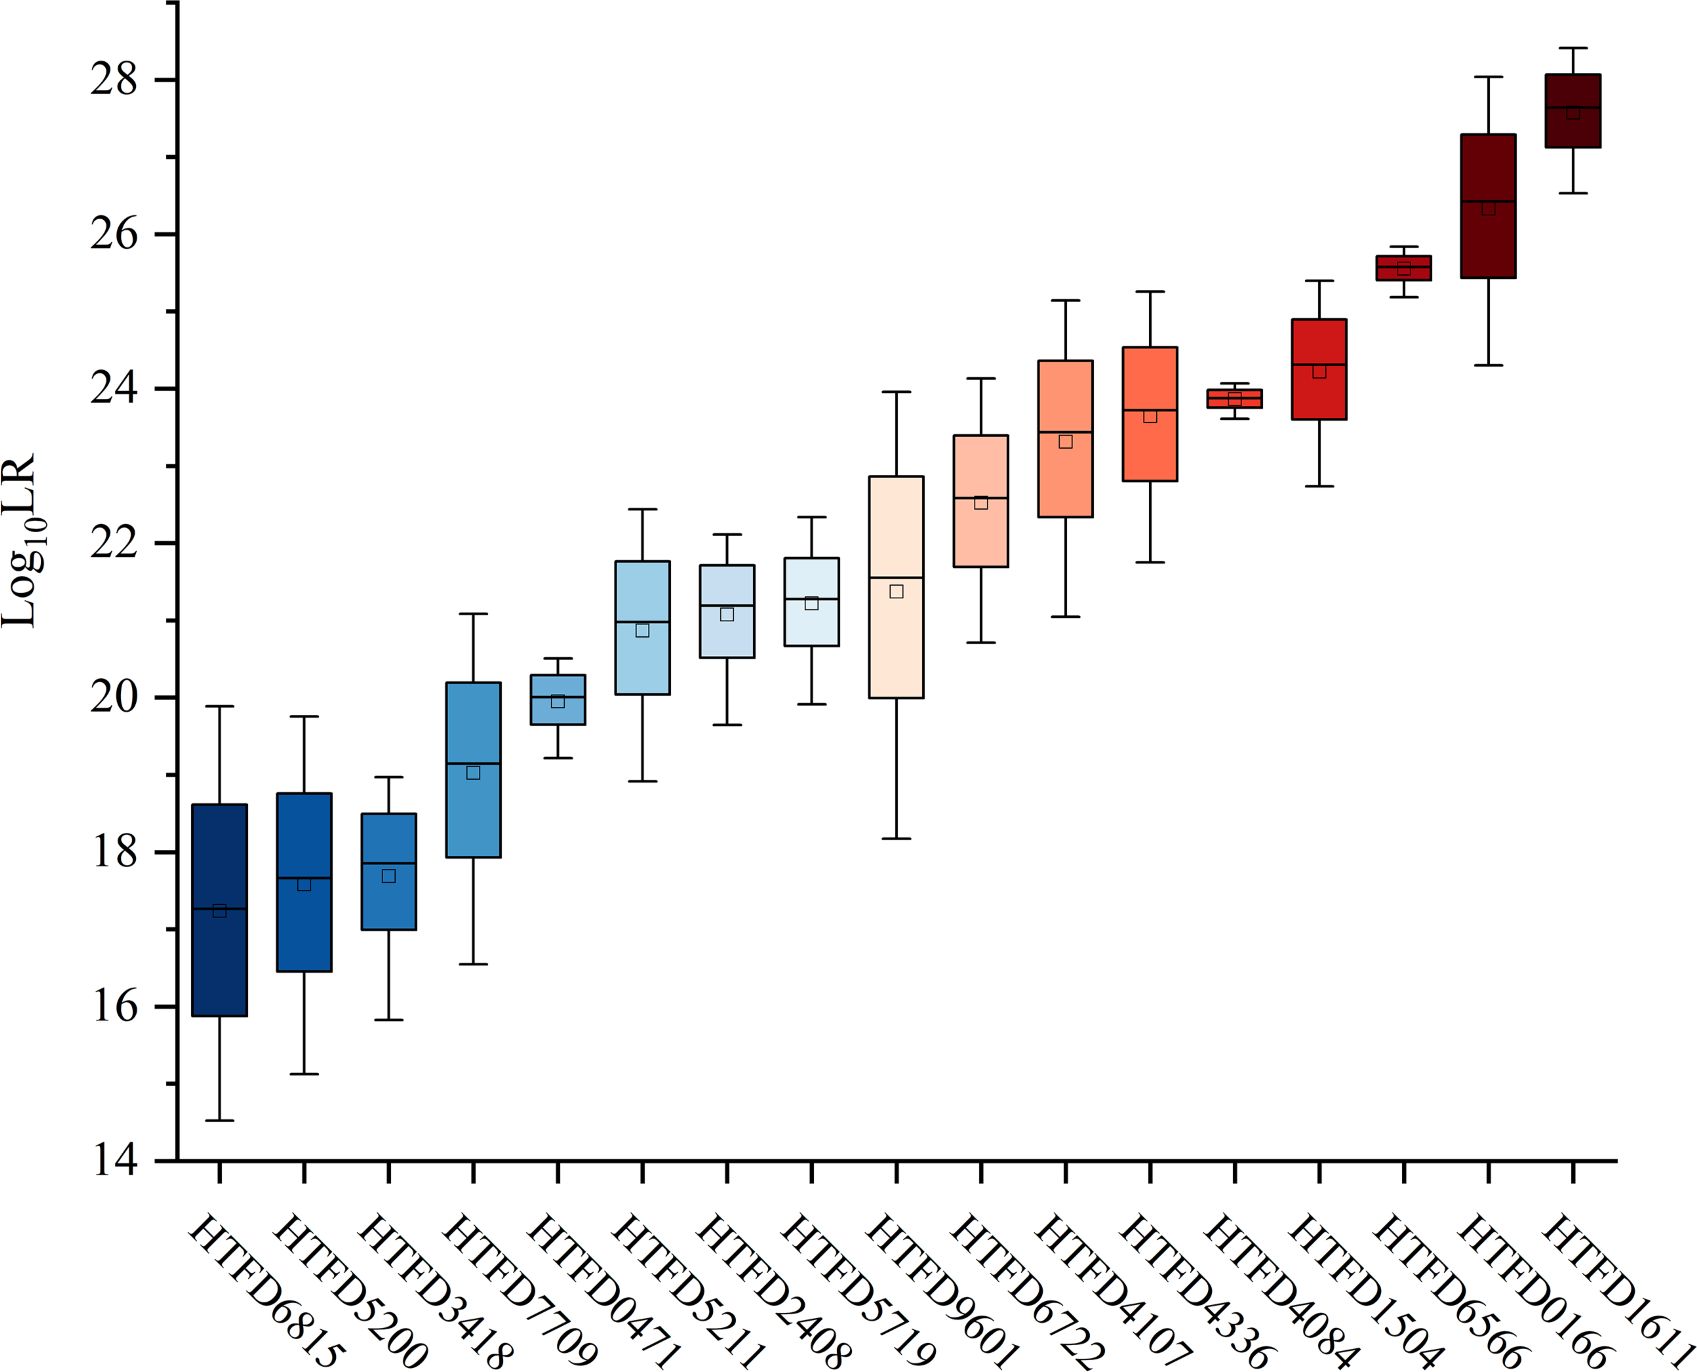
Figure 3 Log10 (LR) values of all 17 tumor tissue samples.
3.4 Hd true test results
The 99.9% of the values for the non-contributor tests of all samples was less than 0 (Figure 4A), which did not support the prosecution’s hypothesis. In addition, the LR values of the non-contributor test tended to decline as Mxn increased, as illustrated in Figure 4B for sample HTFD0166. The Hd true test results for all samples are shown in Supplementary Figure 3, where the four nonoutlier data points in the box plot were above 0. That is, for sample HTFD6816 when , and for sample HTFD5200 when . In Experiment 2, these two samples had the lowest among all results.
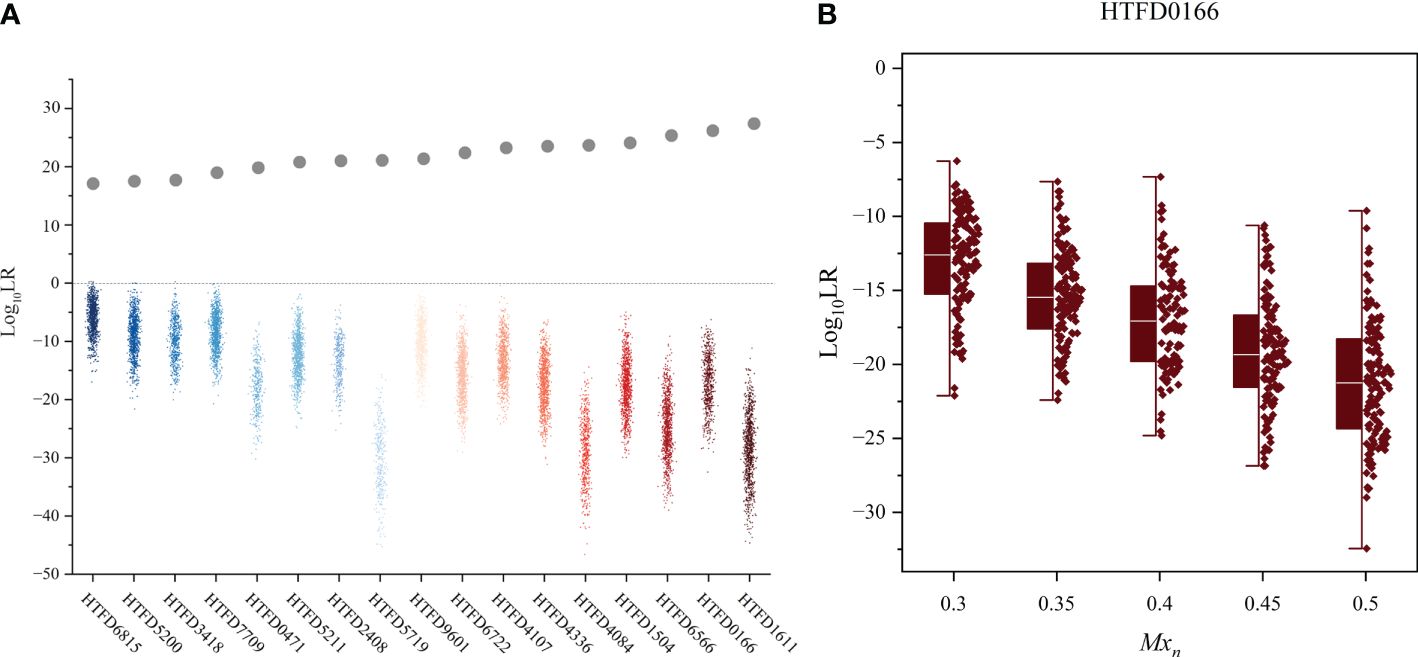
Figure 4 Hd true test results. (A) Log10 (LR) value of the non-contributor test for all 17 samples, while the gray dots indicate the mean Log10 (LR) values for the true contributor in Experiment 2. (B) Distribution of Log10 (LR) values for the non-contributor test of sample HTFD0166 separated by the percentage of normal cells (Mxn).
3.5 LR results considering kinships
When relatedness to known individuals was considered under Hd, LR became smaller in different degrees, but still greater than 1, which did not support the hypothesis that the individual related to the true contributor was a contributor. The calculated for the true contributor > > . Meanwhile, as the increased and of the corresponding groups showed an increasing trend (Figure 5).
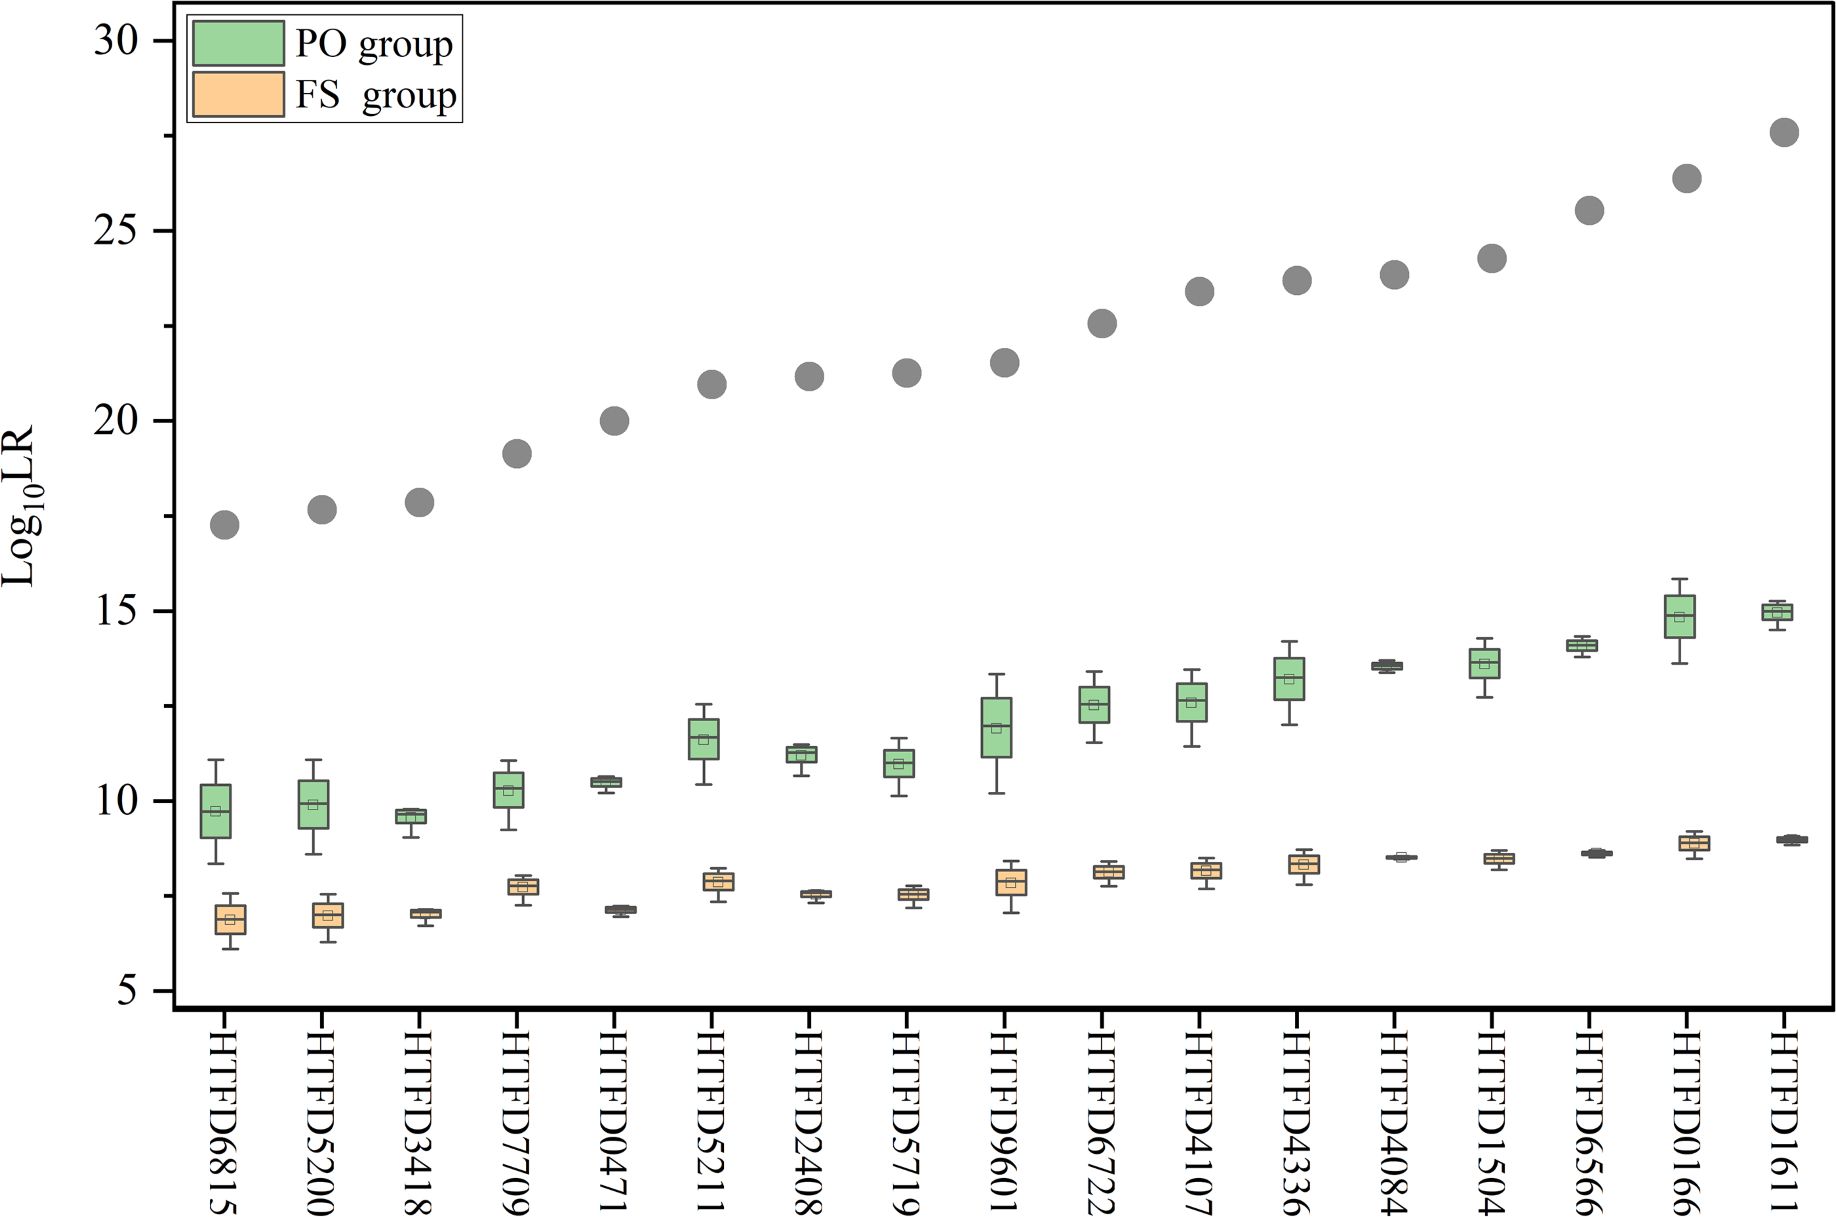
Figure 5 Log10 (LR) value while accounting for kinship between contributors. The gray dots indicate the mean Log10 (LR) values for true contributors in Experiment 2, and the green box plot represents the results of Log10 (LR) for the PO group and the yellow for the FS group.
4 Discussion
In the current study, we constructed a probabilistic method based on the gamma model and an LR computational framework that takes into account STR variants in tumor cells. To the best of our knowledge, this is the first study to introduce a mixed DNA and probabilistic approach for tumor source identification. High LRs greater than 1014 were obtained for all samples distinguishing the true contributor from random unrelated individuals and potential relatives of contributors. In addition, the quantitative strength-of-evidence indicator provided a more scientific solution for tumor source identification. Adopting the confidence interval of Mxn could result in the calculation of a conservative statistic. However, the following issues need to be considered.
4.1 Effect of tumor genomic variants on the STR profile
Cancer cells undergo multiple genetic hits during tumorigenesis, including somatic point mutations, copy number variants, gene deletions, gene rearrangements, and translocations (7). These variants are the source of the abnormal STR profiles observed in tumor tissue. First, point mutations in the primer binding region can result in null alleles of the STR. Second, gene deletions or loss of heterozygosity (LOH) can cause somatic loss of wild-type alleles in many hereditary cancer syndromes. Knudson’s two-hit hypothesis for LOH suggests that one copy of the tumor-suppressor gene is inactivated by mutation, and the other copy undergoes mitotic recombination/gene conversion or deletion, the former leading to copy number losses (CNL-LOH) and the latter to copy number neutral losses (CNN-LOH) (44). In addition, the chromosomal region of LOH contains the location of some loci in commercial STR kits (45), which is reflected by the loss of alleles in the STR profile, and the precise mechanism of the allele loss is unknown.
Furthermore, as a type of microsatellite, the tandem repeat structure of STR also has the potential to generate new alleles due to the strand-slippage replication in tumor cells with vigorous growth and defective DNA repair mechanisms (22, 46). This phenomenon is also used to detect microsatellite instability (MSI) to evaluate tumor hypermutability (9).
4.2 Reasonableness of the STR variation model
In addition to the diversity of mutations that occur in the genomes of tumor cells, neoplasms arise from a single somatic cell of origin (47) and undergo a clonal evolution to form distinct subclones (21). The genomes of these subclones will possess the same or different variants, but still have regions identical to the genome of the original normal cells. This underlying theory provides a theoretical foundation for using the probabilistic strategy in this study to deal with the variation or invariance of tumor alleles.
As tumors develop, the genome becomes increasingly unstable, and the likelihood of mutations during cell proliferation and differentiation increases significantly with each generation. Thus, the developmental expansion of tumors is a branching clonal structure rather than a linear clonal evolution (21, 48). According to computer simulations, each subclone represents a relatively stable, homologous population of cells (49). Such subclonal characteristics of tumor tissue implies that a tumor cell subclone may be represented by an unknown contributor in the probabilistic model. It also implicates that dynamics of each stage of tumor evolution cannot be accurately predicted, i.e., the probability that a particular allele will be altered and the type of mutation that will occur. Therefore, the cumulative mutations in a cell’s genome as an overall probability was considered to describe the likelihood of allelic variants as well as the potential for all alleles in tumor cells to mutate. That is, the probability of gain or loss of an allele depends on the corresponding STR variant, which is derived from empirical statistics of the incidence of STR variations (φ).
Another consideration for using the empirical variant incidence is that new or missing alleles arising from tumor mutations are usually associated with the source allele. Furthermore, the variant rate is a conditional probability based on the assumption that the origin of the tumor-derived alleles is determined, and it serves as a substitute for the frequency of the tumor allele in the population within our model. Given the inability to ascertain the specific subclone in which the variant allele is present, the possibility of each allele being variant at all loci was taken into account.
4.3 Consideration of φ and Mxn
Specifically, two types of variations in the STR profile were observed. One is the loss of alleles, which can result from the dropout of normal cells in a trace state or from the loss of heterozygous of tumor cells. Any allele dropout occurring in normal cells was considered for conservativeness because if the sensitivity of the detection platform was insufficient, normal cellular alleles in trace amounts would not be detected (19). Heterozygous loss of every tumor cell alleles at all loci was also taken into account, as the region of LOH has been continuously discovered with advances in detection technology and bioinformatics (50). In this model, the probability of LOH was considered within a given genotype combination. The other situation is the presence of additional alleles, which is the appearance of abnormally long or short microsatellites on the profile. The possibility for simultaneous variation arising from a pair of alleles was taken into account when examining the inconsistency between tumor cell and normal cell genotypes during the process of genotypic permutations. As a result, the result tends to be conservative. In short, the incidence of STR variants (φ) was considered for each allele at all loci for conservation.
The genetic alterations in carcinomas are chromosome specific (51), and previous studies have found that these loci had different degrees of mutation. For example, TPOX had a low mutation rate in a wide range of tumors (9–11). Therefore, different STR variation probabilities were assigned to each locus based on the population survey results. However, it has been observed that certain loci exhibited varying rates of mutation across different types of cancer. The mutation rates tend to rise in more aggressive forms of cancer (10) and has been shown to be associated with the population average heterozygosity and variability of the repeat number of microsatellite loci (52). The samples and model parameters utilized in this study were limited to primary colorectal cancer tumors, whereas further research is required to validate the findings on tumors of various types and from diverse population backgrounds.
Estimating the percentage of cancer cells in a solid tumor sample, denoted by “tumor purity,” which is the same as Mxt, has been an active research topic. Published studies have evaluated tumor purity assays using complex and expensive genome-wide (53), exome (54), or transcriptome data (55). Patel et al. reviewed several algorithms for estimating tumor purity. However, none of the computational approaches for estimating tumor purity achieved the status of being universally accepted as the “gold standard.” The most consistent analysis was between two pathologists using light microscopy (24). In this study, the microscopic analysis for tumor cell proportion is utilized for convenience. Given the inherent bias associated with manual estimation, LR interval values were calculated within the dynamic range of Mxn. This approach enhances the credibility and validity of the obtained results. In the future, there is potential for the concurrent estimation of tumor purity and individual identification using large-scale sequencing data, which remains to be explored.
It should be noted that we attempt to use the k-value to describe copy number variation for simplicity. However, the current k-value estimation relies solely on qualitative information and cannot use the peak height influenced by copy number. This results in an underestimation of the k value, and further investigation is required to determine its impact on LR results.
4.4 The robustness of the model
The results of Experiment 1 showed that there was a significant liner correlation between and Mxn/φ among 17 tumor samples. When the reference was the true contributor, the model observed an increase in LR as the proportion of normal cells grew larger. This can be attributed to the gradual increase of the genotyping weight associated with normal cells. Conversely, in the non-contributor test, LR increased with increasing Mxn as the weighting of the false contributor genotype decreased. Additionally, LR increased with increasing φ due to the sum of all genotype combination probabilities under Hd becoming larger than the genotype probability under Hp. The above results demonstrate the rationality of the model.
The efficacy of the model was evidenced by the results obtained from Experiment 2. LR calculation for 17 samples was much higher than 1, strongly supporting tumor samples derived from known individuals. Moreover, remained linearly related to Mxn for each sample. The LR appeared to decrease as the percentage of normal cells decreased. However, the correlation still needs to be verified with a large number of samples.
The 99.9% of the was less than 0 for the non-contributor tests. Although there were some results that were slightly greater than zero, as observed when Mxn reached its minimum value, this outcome is acceptable given the comparatively small LR of the corresponding sample for true contributor and the randomness of generating individual non-contributor. This manifests the specificity of the model to exclude irrelevant individuals through quantitative measurements.
Alleles of tumor cells are mutated from the somatic cell. The number of alleles shared with the latter should be greater than that of parent–offspring pairs or full-sibling pairs and equal to or slightly less than that of monozygotic twins (18). Relatedness was evaluated under Hd to investigate whether individuals sharing some alleles with true contributors would be identified as contributors after model calculations. The result implies that the genotype probability is limited due to the additional information that the unknown individual is related to a specific known individual, which leads to the reduction of the LR while maintaining all values greater than 1. As a result, the LR value supports that the tumor tissue originated from a true contributor. In summary, the model rejects the hypothesis that the sample originates from individuals who are unrelated, parent–offspring pairs, or full-sibling pairs. Instead, it supports the hypothesis that the true contributor is the source of the sample.
Furthermore, the precision of the calculations was confirmed through the repetition of the analysis on both true contributors and non-contributors yielding consistent results (data not shown). The accuracy of the optimizer employed in this study was validated, and the consistent LR was obtained by comparing the outcomes of a two-person DNA mixture profile generated in vitro using our scripts and the Euroformix software. See Supplementary Table 21 for details.
5 Conclusion
When comparing the STR profile of a tumor sample with a reference sample from the same individual, the genetic markers were no longer consistent. Using a probabilistic model to deal with the possibility of such alterations can provide a quantitative solution for their homology determination in clinical practice or forensic filed. In the present study, we attempt to provide a strength of evidence value that can be used for comparison and open up the prospect of using tumor samples for personal identification.
Data availability statement
The datasets presented in this study can be found in online repositories. The names of the repository/repositories and accession number(s) can be found below: https://github.com/HYH-yuhan/TumorID, example.
Ethics statement
The studies involving humans were approved by Ethics Review Board of Sichuan University. The studies were conducted in accordance with the local legislation and institutional requirements. The participants provided their written informed consent to participate in this study. Written informed consent was obtained from the individual(s) for the publication of any potentially identifiable images or data included in this article.
Author contributions
YH: Conceptualization, Data curation, Formal analysis, Investigation, Methodology, Software, Validation, Visualization, Writing – original draft, Writing – review & editing. QZ: Conceptualization, Project administration, Supervision, Writing – review & editing. XD: Data curation, Methodology, Writing – review & editing. MZ: Resources, Supervision, Writing – review & editing. NC: Software, Validation, Writing – review & editing. HW: Software, Validation, Writing – review & editing. YTW: Conceptualization, Formal analysis, Writing – review & editing. YC: Conceptualization, Formal analysis, Writing – review & editing. YFW: Project administration, Resources, Supervision, Writing – review & editing. JZ: Funding acquisition, Project administration, Supervision, Writing – review & editing.
Funding
The author(s) declare financial support was received for the research, authorship, and/or publication of this article. This work was supported by grants from the National Natural Science Foundation of China (82230064, 82072120, 82173104, 81871233).
Conflict of interest
The authors declare that the research was conducted in the absence of any commercial or financial relationships that could be construed as a potential conflict of interest.
Publisher’s note
All claims expressed in this article are solely those of the authors and do not necessarily represent those of their affiliated organizations, or those of the publisher, the editors and the reviewers. Any product that may be evaluated in this article, or claim that may be made by its manufacturer, is not guaranteed or endorsed by the publisher.
Supplementary material
The Supplementary Material for this article can be found online at: https://www.frontiersin.org/articles/10.3389/fonc.2024.1297135/full#supplementary-material
References
1. Canan H, Serin A. Is it reliable to use paraffin embedded tumor tissues as biological evidence in parentage cases? Forensic Sci International: Genet Supplement Ser. (2019) 7:318–9. doi: 10.1016/j.fsigss.2019.09.121
2. Rubocki RJ, Duffy KJ, Shepard KL, McCue B, Shepherd SJ, Wisecarver JL. Loss of heterozygosity detected in a short tandem repeat (Str) locus commonly used for human DNA identification. J forensic Sci. (2000) 45:1087–9. doi: 10.1520/JFS14834J
3. Banaschak S, Du Chesne A, Brinkmann B. Multiple interchanging of tissue samples in cases of breast cancer. Forensic Sci Int. (2000) 113:3–7. doi: 10.1016/s0379-0738(00)00241-3
4. Pontes ML AO, Fondevila M, Porto MJ, Medeiros R. Analysis of autosomal Snps in paraffin-embedded tissue samples: two cases. J Forensic Invest. (2015) 3:4. doi: 10.13188/2330-0396
5. Alonso A, Alves C, Suárez-Mier MP, Albarrán C, Pereira L, LFd Simón, et al. Mitochondrial DNA haplotyping revealed the presence of mixed up benign and neoplastic tissue sections from two individuals on the same prostatic biopsy slide. J Clin Pathol. (2005) 58:83. doi: 10.1136/jcp.2004.017673
6. Liu Y, Li L, Li C, Zhao Z. Allelic alterations of Strs in archival paraffin embedded tissue as DNA source for paternity testing. Forensic Sci International: Genet Supplement Ser. (2009) 2:12–3. doi: 10.1016/j.fsigss.2009.08.019
7. Vogelstein B, Papadopoulos N, Velculescu VE, Zhou S, Diaz LA Jr., Kinzler KW. Cancer genome landscapes. Science. (2013) 339:1546–58. doi: 10.1126/science.1235122
8. Gill P, Haned H, Bleka O, Hansson O, Dørum G, Egeland T. Genotyping and interpretation of Str-DNA: low-template, mixtures and database matches-twenty years of research and development. Forensic Sci Int Genet. (2015) 18:100–17. doi: 10.1016/j.fsigen.2015.03.014
9. Chen A, Zhang S, Xiong L, Xi S, Tao R, Chen C, et al. Investigation of an alternative marker for hypermutability evaluation in different tumors. Genes. (Basel). (2021) 12(2):197. doi: 10.3390/genes12020197
10. Pai CY, Hsieh LL, Tsai CW, Chiou FS, Yang CH, Hsu BD. Allelic alterations at the Str markers in the Buccal tissue cells of oral cancer patients and the oral epithelial cells of healthy betel quid-chewers: an evaluation of forensic applicability. Forensic Sci Int. (2002) 129:158–67. doi: 10.1016/s0379-0738(02)00205-0
11. Vauhkonen H, Hedman M, Vauhkonen M, Kataja M, Sipponen P, Sajantila A. Evaluation of gastrointestinal cancer tissues as a source of genetic information for forensic investigations by using Strs. Forensic Sci Int. (2004) 139:159–67. doi: 10.1016/j.forsciint.2003.10.016
12. Dang Z, Li L, Kong X, Zhang G, Liu Q, Li H, et al. Evaluation of allelic alterations in short tandem repeats in papillary thyroid cancer. Mol Genet Genomic Med. (2020) 8:e1164. doi: 10.1002/mgg3.1164
13. Poetsch M, Petersmann A, Woenckhaus C, Protzel C, Dittberner T, Lignitz E, et al. Evaluation of allelic alterations in short tandem repeats in different kinds of solid tumors–possible pitfalls in forensic casework. Forensic Sci Int. (2004) 145 1:1–6. doi: 10.1016/j.forsciint.2004.03.006
14. Miller JK, Buchner N, Timms L, Tam S, Luo X, Brown AM, et al. Use of sequenom sample id plus® Snp genotyping in identification of ffpe tumor samples. PLoS One. (2014) 9:e88163. doi: 10.1371/journal.pone.0088163
15. Huijsmans R, Damen J, van der Linden H, Hermans M. Single nucleotide polymorphism profiling assay to confirm the identity of human tissues. J Mol Diagn. (2007) 9:205–13. doi: 10.2353/jmoldx.2007.060059
16. Tozzo P, Delicati A, Frigo AC, Caenazzo L. Comparison of the allelic alterations between indel and Str markers in tumoral tissues used for forensic purposes. Medicina. (Kaunas). (2021) 57(3):226. doi: 10.3390/medicina57030226
17. Chen X, Lu D, Zhang J, Song F, Luo H, Ren Z, et al. Identification of the mislabeled breast cancer samples by mitochondrial DNA haplotyping. J Forensic Sci Med. (2015) 1:133. doi: 10.4103/2349-5014.170603
18. Zhao S, Zhang S, Zhang N, Sun K, Que T, Zhao Z, et al. A new strategy for body source identification of tumor sample. Forensic Sci International: Genet Supplement Ser. (2013) 4:e346–e7. doi: 10.1016/j.fsigss.2013.10.176
19. Chen A, Xiong L, Qu Y, Xi S, Tao R, Li C, et al. Opportunity of next-generation sequencing-based short tandem repeat system for tumor source identification. Front Oncol. (2022) 12:800028. doi: 10.3389/fonc.2022.800028
20. Sun L, Liu Q, Li S, Ma G, Wang Z, Ma C, et al. A new strategy to confirm the identity of tumour tissues using single-nucleotide polymorphisms and next-generation sequencing. Int J Legal Med. (2020) 134:399–409. doi: 10.1007/s00414-019-02216-9
21. Gerlinger M, Rowan AJ, Horswell S, Larkin J, Endesfelder D, Gronroos E, et al. Intratumor heterogeneity and branched evolution revealed by multiregion sequencing. N Engl J OF Med. (2012) 366:883–92. doi: 10.1056/NEJMoa1113205
22. Boland CR, Goel A. Microsatellite instability in colorectal cancer. Gastroenterology. (2010) 138:2073–87.e3. doi: 10.1053/j.gastro.2009.12.064
23. Buckleton J, Robertson B, Curran J, Berger C, Taylor D, Bright JA, et al. A review of likelihood ratios in forensic science based on a critique of Stiffelman "No longer the gold standard: probabilistic genotyping is changing the nature of DNA evidence in criminal trials". Forensic Sci Int. (2020) 310:110251. doi: 10.1016/j.forsciint.2020.110251
24. Patel NM, Jo H, Eberhard DA, Yin X, Hayward MC, Stein MK, et al. Improved tumor purity metrics in next-generation sequencing for clinical practice: the integrated interpretation of neoplastic cellularity and sequencing results (Iincase) approach. Appl Immunohistochem Mol Morphol. (2019) 27:764–72. doi: 10.1097/pai.0000000000000684
25. Devereaux KA, Souers RJ, Graham RP, Portier BP, Surrey LF, Yemelyanova A, et al. Neoplastic cellularity assessment in molecular testing: A multi-institutional practice survey and performance challenge identifies a need for standardization. Arch Pathol Lab Med. (2022) 146:1062–71. doi: 10.5858/arpa.2021-0166-CP
26. Henke E, Nandigama R, Ergün S. Extracellular matrix in the tumor microenvironment and its impact on cancer therapy. Front Mol Biosci. (2019) 6:160. doi: 10.3389/fmolb.2019.00160
27. Gill P, Curran J, Elliot K. A graphical simulation model of the entire DNA process associated with the analysis of short tandem repeat loci. Nucleic Acids Res. (2005) 33:632–43. doi: 10.1093/nar/gki205
28. Cowell RG, Graversen T, Lauritzen SL, Mortera J. Analysis of forensic DNA mixtures with artefacts. J R Stat Soc. (2015) 64:1–48. doi: 10.1111/rssc.12071
29. Gill P, Bleka Ø, Hansson O, Benschop C, Haned H. Forensic Practitioner’s Guide to the Interpretation of Complex DNA Profiles. Cambridge, MA, USA: Academic Press (2020).
30. Hanahan D, Weinberg Robert A. Hallmarks of cancer: the next generation. Cell. (2011) 144:646–74. doi: 10.1016/j.cell.2011.02.013
31. Adnan A, Zhan X, Kasim K, Rakha A, Xin XJ. Population data and phylogenetic structure of Han population from Jiangsu province of China on globalfiler Str loci. Int J Legal Med. (2018) 132:1301–4. doi: 10.1007/s00414-018-1815-7
32. Wu W, Chen D, Fu Y, Hao H, Nan H, Lu D. Population structure of Han population in China revealed by 41 Str loci. Ann Hum Biol. (2020) 47:65–9. doi: 10.1080/03014460.2019.1705391
33. Feldman MY. Reactions of nucleic acids and nucleoproteins with formaldehyde. Prog Nucleic Acid Res Mol Biol. (1973) 13:1–49. doi: 10.1016/s0079-6603(08)60099-9
34. Yagi N, Satonaka K, Horio M, Shimogaki H, Tokuda Y, Maeda S. The role of Dnase and Edta on DNA degradation in formaldehyde fixed tissues. Biotech Histochem. (1996) 71:123–9. doi: 10.3109/10520299609117148
35. Legrand B, Mazancourt P, Durigon M, Khalifat V, Crainic K. DNA genotyping of unbuffered formalin fixed paraffin embedded tissues. Forensic Sci Int. (2002) 125:205–11. doi: 10.1016/s0379-0738(01)00641-7
36. Alaeddini R, Walsh SJ, Abbas A. Forensic implications of genetic analyses from degraded DNA–a review. Forensic Sci Int Genet. (2010) 4:148–57. doi: 10.1016/j.fsigen.2009.09.007
37. Tvedebrink T, Eriksen PS, Mogensen HS, Morling N. Statistical model for degraded DNA samples and adjusted probabilities for allelic drop-out. Forensic Sci Int Genet. (2012) 6:97–101. doi: 10.1016/j.fsigen.2011.03.001
38. Bleka Ø, Storvik G, Gill P. Euroformix: an open source software based on a continuous model to evaluate str DNA profiles from a mixture of contributors with artefacts. Forensic Sci International: Genet. (2016) 21:35–44. doi: 10.1016/j.fsigen.2015.11.008
39. Puch-Solis R. A dropin peak height model. Forensic Sci Int Genet. (2014) 11:80–4. doi: 10.1016/j.fsigen.2014.02.005
40. Moore D, Clayton T, Thomson J. A comprehensive study of allele drop-in over an extended period of time. Forensic Sci Int Genet. (2020) 48:102332. doi: 10.1016/j.fsigen.2020.102332
41. Recommendations of the Swgdam Ad Hoc Working Group on Genotyping Results Reported as Likelihood Ratios (2015). Available online at: https://www.swgdam.org/_files/ugd/4344b0_22776006b67c4a32a5ffc04fe3b56515.pdf.
42. Hansson O, Egeland T, Gill P. Characterization of degradation and heterozygote balance by simulation of the forensic DNA analysis process. Int J Legal Med. (2017) 131:303–17. doi: 10.1007/s00414-016-1453-x
43. Casella G, Berger RL. Statistical Inference Second Edition. Pacific Grove, CA, USA: Thomson Learning (2001).
44. Ryland GL, Doyle MA, Goode D, Boyle SE, Choong DYH, Rowley SM, et al. Loss of heterozygosity: what is it good for? BMC Med Genomics. (2015) 8:45. doi: 10.1186/s12920-015-0123-z
45. Page K, Graham EAM. Cancer and forensic microsatellites. Forensic Science Medicine Pathol. (2008) 4:60–6. doi: 10.1007/s12024-008-9027-y
46. Vilar E, Gruber SB. Microsatellite instability in colorectal cancer—the stable evidence. Nat Rev Clin Oncol. (2010) 7:153–62. doi: 10.1038/nrclinonc.2009.237
47. Nowell PC. The clonal evolution of tumor cell populations. Science. (1976) 194:23–8. doi: 10.1126/science.959840
48. Marusyk A, Polyak K. Tumor heterogeneity: causes and consequences. Biochim ET Biophys ACTA-REVIEWS ON Cancer. (2010) 1805:105–17. doi: 10.1016/j.bbcan.2009.11.002
49. Miller CA, White BS, Dees ND, Griffith M, Welch JS, Griffith OL, et al. Sciclone: inferring clonal architecture and tracking the spatial and temporal patterns of tumor evolution. PloS Comput Biol. (2014) 10:e1003665. doi: 10.1371/journal.pcbi.1003665
50. Nichols CA, Gibson WJ, Brown MS, Kosmicki JA, Busanovich JP, Wei H, et al. Loss of heterozygosity of essential genes represents a widespread class of potential cancer vulnerabilities. Nat Commun. (2020) 11:2517. doi: 10.1038/s41467-020-16399-y
51. Thiagalingam S, Laken S, Willson JKV, Markowitz SD, Kinzler KW, Vogelstein B, et al. Mechanisms underlying losses of heterozygosity in human colorectal cancers. Proc Natl Acad Sci. (2001) 98:2698–702. doi: 10.1073/pnas.051625398
52. Sturzeneker R, Bevilacqua RAU, Haddad LA, Simpson AJG, Pena SDJ. Microsatellite instability in tumors as a model to study the process of microsatellite mutations. Hum Mol Genet. (2000) 9:347–52. doi: 10.1093/hmg/9.3.347
53. Zheng X, Zhang N, Wu H-J, Wu H. Estimating and accounting for tumor purity in the analysis of DNA methylation data from cancer studies. Genome Biol. (2017) 18:17. doi: 10.1186/s13059-016-1143-5
54. Locallo A, Prandi D, Fedrizzi T, Demichelis F. Tpes: tumor purity estimation from Snvs. Bioinf (Oxford England). (2019) 35:4433–5. doi: 10.1093/bioinformatics/btz406
Keywords: probabilistic model, likelihood ratio (LR), tumor source identification, short tandem repeat (STR), forensic genetics
Citation: Hu Y, Zhu Q, Dai X, Zhang M, Chen N, Wang H, Wang Y, Cao Y, Wang Y and Zhang J (2024) Exploration of identifying individual tumor tissue based on probabilistic model. Front. Oncol. 14:1297135. doi: 10.3389/fonc.2024.1297135
Received: 19 September 2023; Accepted: 01 April 2024;
Published: 23 April 2024.
Edited by:
Yadong Zhang, Boston Children’s Hospital and Harvard Medical School, United StatesReviewed by:
Xue-Ling Ou, Sun Yat-sen University, ChinaFlorica Sandru, Carol Davila University of Medicine and Pharmacy, Romania
Copyright © 2024 Hu, Zhu, Dai, Zhang, Chen, Wang, Wang, Cao, Wang and Zhang. This is an open-access article distributed under the terms of the Creative Commons Attribution License (CC BY). The use, distribution or reproduction in other forums is permitted, provided the original author(s) and the copyright owner(s) are credited and that the original publication in this journal is cited, in accordance with accepted academic practice. No use, distribution or reproduction is permitted which does not comply with these terms.
*Correspondence: Yufang Wang, d2FuZ3l1ZmFuZ0BzY3UuZWR1LmNu; Ji Zhang, emhhbmdqQHNjdS5lZHUuY24=
†These authors have contributed equally to this work