 Alexandru Garaba1*†
 Nummra Aslam1Francesco Ponzio2
 Pier Paolo Panciani1
 Waleed Brinjikji3
 Marco Fontanella1
 Lucio De Maria1,4
- 1Department of Surgical Specialties, Radiological Sciences, and Public Health, University of Brescia, Brescia, Italy
- 2Interuniversity Department of Regional and Urban Studies and Planning, Politecnico di Torino, Torino, Italy
- 3Department of Neurosurgery and Interventional Neuroradiology, Mayo Clinic, Rochester, MN, United States
- 4Department of Clinical Neuroscience, Geneva University Hospitals (HUG), Geneva, Switzerland
Background and objective: Numerous radiomics-based models have been proposed to discriminate between central nervous system (CNS) gliomas and primary central nervous system lymphomas (PCNSLs). Given the heterogeneity of the existing models, we aimed to define their overall performance and identify the most critical variables to pilot future algorithms.
Methods: A systematic review of the literature and a meta-analysis were conducted, encompassing 12 studies and a total of 1779 patients, focusing on radiomics to differentiate gliomas from PCNSLs. A comprehensive literature search was performed through PubMed, Ovid MEDLINE, Ovid EMBASE, Web of Science, and Scopus databases. Overall sensitivity (SEN) and specificity (SPE) were estimated. Event rates were pooled using a random-effects meta-analysis, and the heterogeneity was assessed using the χ2 test.
Results: The overall SEN and SPE for differentiation between CNS gliomas and PCNSLs were 88% (95% CI = 0.83 – 0.91) and 87% (95% CI = 0.83 – 0.91), respectively. The best-performing features were the ones extracted from the Gray Level Run Length Matrix (GLRLM; ACC 97%), followed by those obtained from the Neighboring Gray Tone Difference Matrix (NGTDM; ACC 93%), and shape-based features (ACC 91%). The 18F-FDG-PET/CT was the best-performing imaging modality (ACC 97%), followed by the MRI CE-T1W (ACC 87% - 95%). Most studies applied a cross-validation analysis (92%).
Conclusion: The current SEN and SPE of radiomics to discriminate CNS gliomas from PCNSLs are high, making radiomics a helpful method to differentiate these tumor types. The best-performing features are the GLRLM, NGTDM, and shape-based features. The 18F-FDG-PET/CT imaging modality is the best-performing, while the MRI CE-T1W is the most used.
1 Introduction
Radiomics is a rapidly expanding field that extracts quantitative information from medical images that is then analyzed using artificial intelligence (AI) techniques such as machine learning (ML) and its subcategory, deep learning (DL) to define radiomics features, which may include tissue heterogeneity, texture, shape, and gray intensity (1, 2). These features can help distinguish between tumor types, thus aiding in proper diagnosis and treatment planning.
Distinguishing between central nervous system (CNS) gliomas and primary central nervous system lymphomas (PCNSLs) can be difficult due to their similar radiological appearance. Both tumors can exhibit imaging features such as heterogeneity, necrosis, and contrast enhancement (3). Current clinical standards involve a multifaceted approach, combining imaging studies, such MRI, and histopathological analysis through biopsy. Despite advancements in conventional diagnostic methods, there are several challenges. Biopsy procedures, while informative, may not always be feasible or carry inherent risks. Additionally, the reliance on imaging studies may lead to overlapping features, complicating the interpretation and contributing to misdiagnoses. Accurate diagnosis is essential for patient care, as it drives different treatment approaches (4, 5). Radiomics has shown promising results in distinguishing between them, potentially improving patient outcomes (6).
Despite the promising results, a meta-analysis of the current literature is required to determine the effectiveness of radiomics in distinguishing gliomas from PCNSLs. We conducted a systematic review and meta-analysis of studies that used radiomics to differentiate between these tumors. We aimed to evaluate the overall diagnostic performance of radiomics in differentiating these two tumor types and identify the most effective radiomics variables to pilot future models.
The findings of this study may be employed in clinical practice and can potentially improve patient outcomes allowing accurate diagnosis and treatment planning.
2 Materials and methods
2.1 Literature search
The systematic review was performed according to the Preferred Reporting Items for Systematic Reviews and Meta-Analysis (PRISMA) guidelines (7). A comprehensive literature search of the databases PubMed, Ovid MEDLINE, Ovid EMBASE, Web of Science, and Scopus was designed and conducted by an experienced librarian with input from the authors. These databases were selected for their extensive coverage of relevant medical literature, ensuring a thorough retrieval of studies related to radiomics in the context of CNS gliomas and PCNSLs. The following research string was used: “radiomics AND glioma AND lymphoma”. The studies were found using the Medical Subject Heading (MeSH) terms and Boolean operators. A search filter was set to show only publications over the designated period. The search was limited to articles published between 2012 and 2022. The first literature search was performed on June 2, 2023, and the search was updated on July 20, 2023.
Two Authors (L.D.M. and F.P.) determined the inclusion criteria for the studies in the literature search process. The following inclusion criteria were used: 1) case series including at least 10 patients, 2) studies reporting on radiomics for the differential diagnosis of CNS gliomas and PCNSLs, 3) availability of performance data for differentiation of these tumors, 4) studies reporting exclusively histologically proven CNS gliomas and PCNSLs, and 5) inclusion of both multi-center and single-center studies. Exclusion criteria were: 1) case reports or review studies, 2) studies reporting on AI-based models other than radiomics, 3) studies on radiomics differentiation of other tumor types, and 4) studies not reporting performance data of the radiomics model.
The list of identified studies was imported into Endnote X9, and duplicates were removed. The search results were checked by two independent researchers (F.P. and W.B.) with experience according to the inclusion and exclusion criteria. A third blinded reviewer (L.D.M.) resolved all disagreements. Then, eligible articles were subject to full-text screening. Reference lists of selected studies were also reviewed to identify additional relevant studies.
2.2 Data extraction
For each study, we abstracted the following baseline information: year of publication, total number of patients, distribution of patients per tumor type, and magnetic resonance imaging (MRI) protocol. As for the radiomics models, we collected information about the AI sub-category [i.e. ML or DL], classification algorithms [i.e. logistic regression (LR), support vector machine (SVM), naïve bayes (NB), k-nearest neighbor (kNN), multilayer perceptron (MLP), random forest (RF), adaptive boosting (AdaBoost), elastic net regression (ENR), linear discriminant analysis (LDA), convolutional neural network (CNN), least absolute shrinkage and selection operator regression (LASSO regression), others], best-performing classifiers, best-performing features [i.e. textural, geometrical or morphological, voxel intensities-based, others], best-performing MRI sequences [i.e. T1-weighted (T1W), contrast-enhanced T1 weighted image (CE-T1W), T2-weighted (T2W), T2 weighted fluid-attenuated inversion recovery (T2-FLAIR), diffusion-weighted imaging (DWI), dynamic susceptibility contrast (DSC), perfusion-weighted imaging (PWI), T1-weighted fast field echo (T1-FFE), fluorine-18 fluorodeoxyglucose positron emission tomography/computed tomography (18F-FDG-PET/CT), computed tomography (CT) scans], and application of cross-validation analysis [i.e. yes or no]. Regarding the performance of the models, we extracted data on the resultant sensitivity (SEN) and specificity (SPE), accuracy (ACC), positive predictive value (PPV), and negative predictive value (NPV).
In studies with overlapping patient populations written by the same Authors or Institution, we only included the largest or most complete dataset. In cases where outcomes were separated by study cohorts, we abstracted performance outcomes of validation or test cohorts to perform our meta-analysis.
2.3 Outcomes
Our primary outcomes were the overall SEN, SPE, and summary receiver operating characteristics (SROC) curve of radiomics for the differentiation of CNS gliomas from PCNSLs. Bivariate analyses by discrimination task between CNS gliomas and PCNSLs were conducted. In terms of the performance of the models, we also looked at the ACC, PPV, and NPV.
As secondary outcomes, we performed a moderator analysis to provide a thorough explanation of the possible sources of heterogeneity in observed effect sizes. In this regard, we analyzed the impact of the following variables on the performance of the proposed radiomics models: year of development, cohort size, AI sub-category, best-performing classifiers, features, MRI sequences, the presence or absence of external test sets in the studies, and application of cross-validation. These variables were also studied quantitatively to picture the current trends of radiomics models for differentiating these tumor types.
2.4 Study risk of bias assessment
We modified the Newcastle-Ottawa Scale (NOS) to assess the methodologic quality of the studies included in our meta-analysis (8). This tool, originally designed for use in comparative studies with a control group, was adapted to our study. As there was no control group in our studies, we assessed their methodologic quality based on selected items from the scale, focusing on the following questions: 1) Was the study retrospective or prospective? 2) Were there clearly defined inclusion and exclusion criteria? 3) Did the study include all patients or consecutive patients vs. a selected sample? 4) Were outcomes reported? 5) Was clinical follow-up satisfactory, thus allowing ascertainment of all outcomes? (9).
2.5 Statistical analysis
For the purpose of the meta-analysis, we considered the total number of patients included in each study’s test or validation dataset. Data from primary studies were reported in a 2×2 contingency table consisting of true positive (TP), false positive (FP), false negative (FN), and true negative (TN) based on the concordance between biopsy results and the radiomics tool predictions. Such a table served as input for the R-package mada (10), used for modeling the joint estimates of SEN and SPE and their 95% confidence intervals (CIs). Event rates were pooled across studies using a random-effects meta-analysis, and the χ2 test was performed to assess the heterogeneity of SEN and SPE, considering the null hypothesis as equality in each case.
SEN and SPE depend on each other via a cut-off value: as the cut-off is varied to, say, increase the sensitivity, the specificity often decreases. Hence, the two quantities are negatively correlated. Thus, we opted for the bivariate meta-analytic strategy via mada routines, which leverage a linear mixed model derived from the approach described by Ardens et al. (11).
To better show the diagnostic performance of AI-based radiomics tools, we made the following further figures of merit: 1) univariate graphics in the form of forest plots for both SEN and SPE; 2) endpoints of interest with individual confidence regions; 3) SROC curve seeking to combine ROC curves of primary studies. In these last two graphical outcomes, the coordinates of the endpoints of interest are in the form of [SEN] and [1 – SPE], the latter better known as the false positive rate (FPR).
3 Results
3.1 Literature review
A total of 37 papers were identified after duplicate removal. After title and abstract analysis, 21 articles were identified for full-text analysis. Eligibility was ascertained for 12 articles (12–23) The remaining 9 articles were excluded for the following reasons: 1) studies not reporting data on radiomics performance for differentiation of gliomas from PCNSLs (4 articles), 2) studies reporting on AI-based models other than radiomics (3 articles), 3) improper study design (2 articles). All studies included in the analysis had at least one or more outcome measures available for one or more of the patient groups analyzed. Figure 1 shows the flow chart according to the PRISMA statement (7).
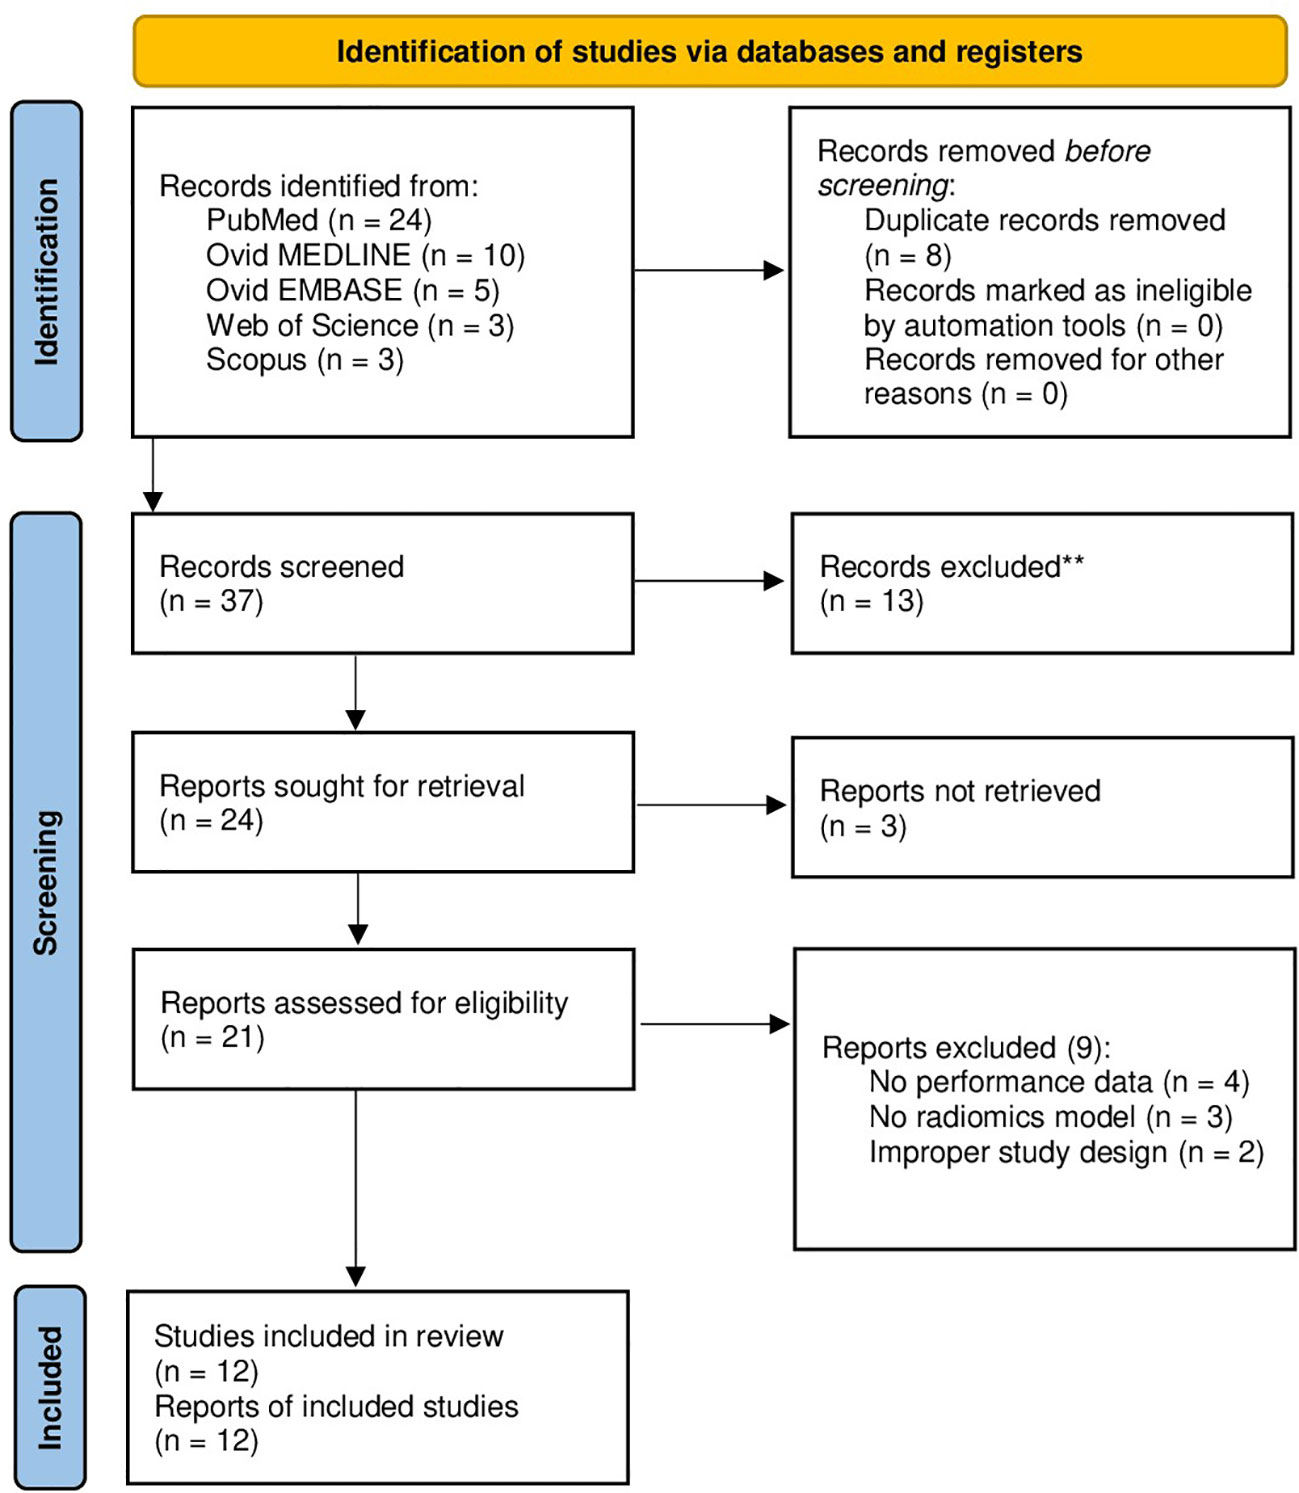
Figure 1 PRISMA flow diagram depicting the literature search process. PRISMA, preferred reporting items for systematic reviews and meta-analysis.
3.2 Baseline and radiomics data
A total of 1779 patients were included in the meta-analysis. Most studies were published in 2018 (4), followed by 2021 (3), 2022 (2), 2019 (2), and 2020 (1). The smallest study included 77 patients (16), while the largest included 289 patients (22). Differentiation between CNS gliomas and PCNSLs was reported for 1779 patients, of which 1063 had gliomas (59,75%), and 716 had PCNSLs (40,25%). A number of 10 studies included different MRI sequences and the most common was the CE-T1W (24,24%), followed by DWI (21,21%), T2-FLAIR (18,18%), and T2W (15,15%). Other MRI modalities were T1W (12,12%), PWI (3,03%), DSC (3,03%), and T1-FFE (3,03%). In addition to the MRI studies, there was also one study conducted using 18F-FDG-PET/CT, and one study using CT.
A number of 8 studies reported on ML (66,67%), three articles reported on DL (25%), and there was 1 hybrid study (8,33%).
When it comes to studies utilizing DL, one employed a well-defined CNN model, specifically DenseNet-121 (22), while the remaining studies utilized custom-designed CNN architectures that were described within their respective articles (13, 20). Notably, one of these studies did not specify the architecture used (23).
As for the classifiers, SVM was the most adopted (13,20%), followed by RF (9,43%), LR (9,43%), AdaBoost (7,54%), and others. A summary of the included studies is provided in Table 1.
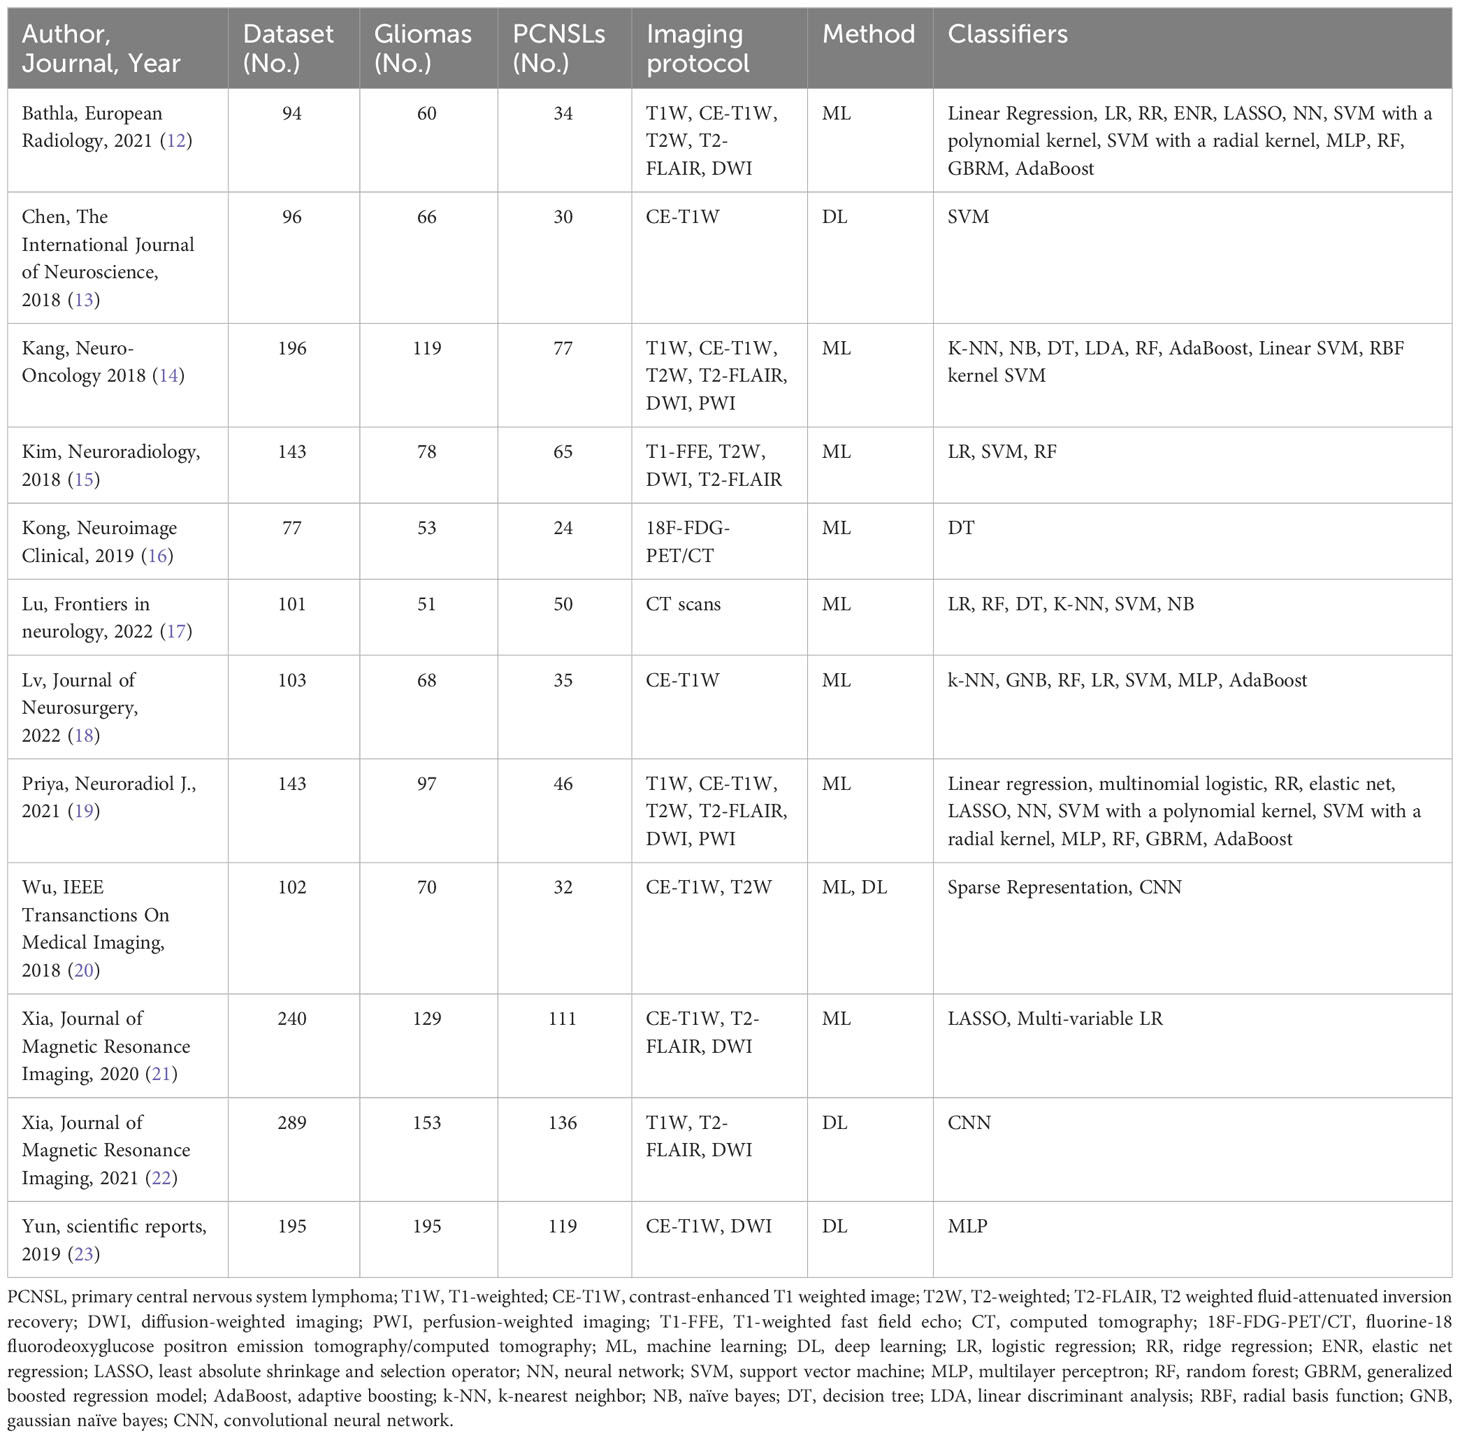
Table 1 Summary of studies.
3.3 Primary outcomes
The performance of radiomics to discriminate between CNS gliomas and PCNSLs was reported for a total of 993 patients composing the validation or test datasets of the studies included in our meta-analysis. The Overall SEN and SPE were 88% (95% CI = 0.83 – 0.91) and 87% (95% CI = 0.83 – 0.91). Figure 2 shows the SEN and SPE forest plots of the bivariate analyses for discrimination between CNS gliomas and PCNSLs. Figure 3 provides the individual confidence regions and Figure 4 the corresponding SROC curve for the differentiation task. Specifically, the summary estimate coordinates of the SROC curve for CNS gliomas vs. PCNSLs were [0.87; 0.14]. The ACC of the included studies ranged from 83% (14) to 97% (16), the PPV from 85% (15) to 100% (16), and the NPV from 74% (14) to 100% (15). Table 2 summarizes the performance data of the radiomics models analyzed.
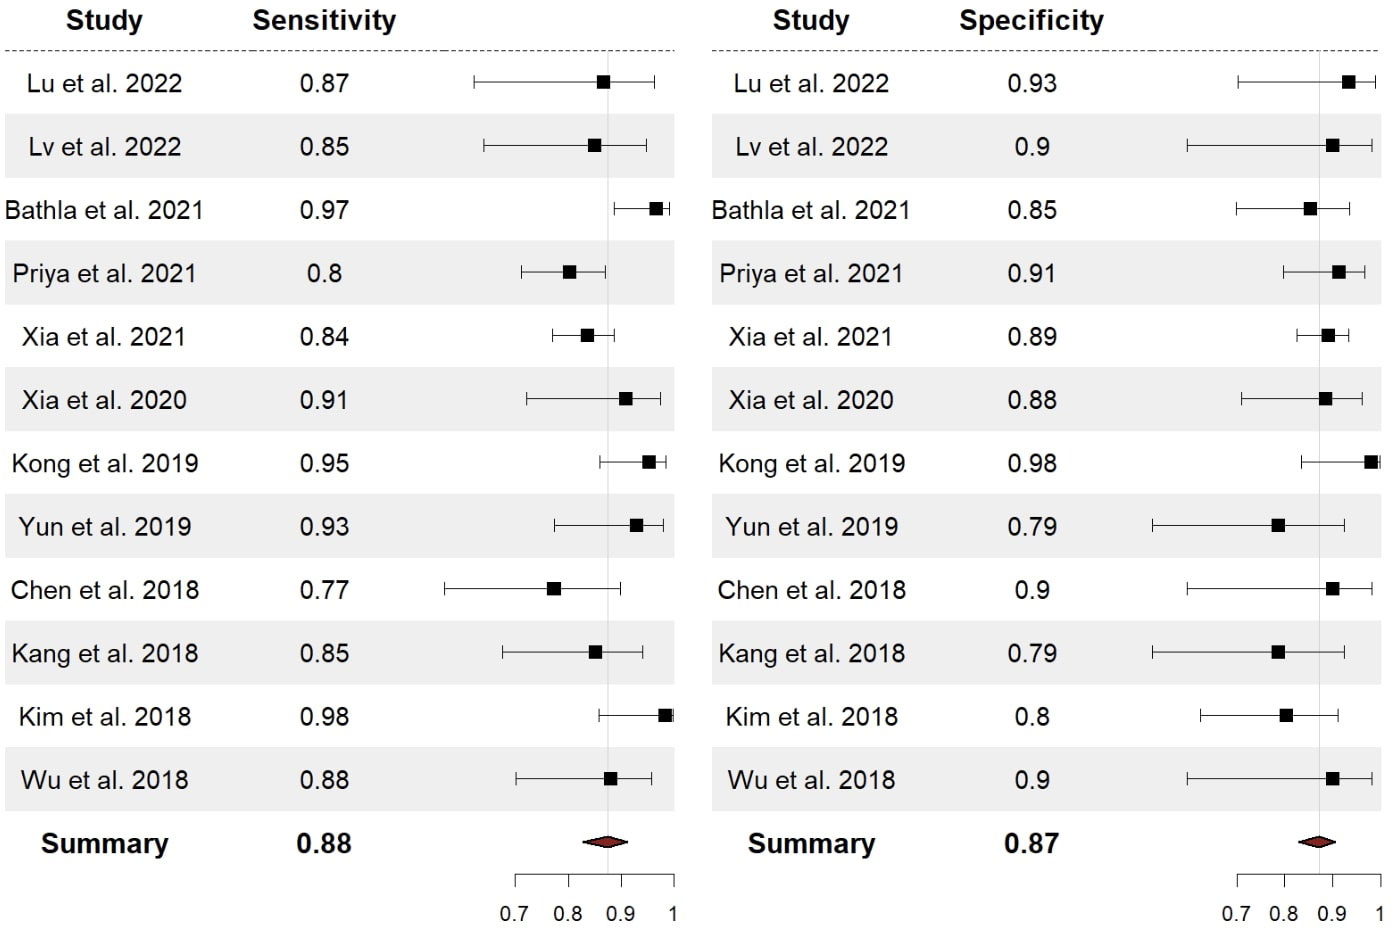
Figure 2 Forest plots with overall SEN and SPE for discrimination between CNS gliomas and PCNSLs. SEN, sensitivity; SPE, specificity; CNS, central nervous system; PCNSL, primary central nervous system lymphoma.
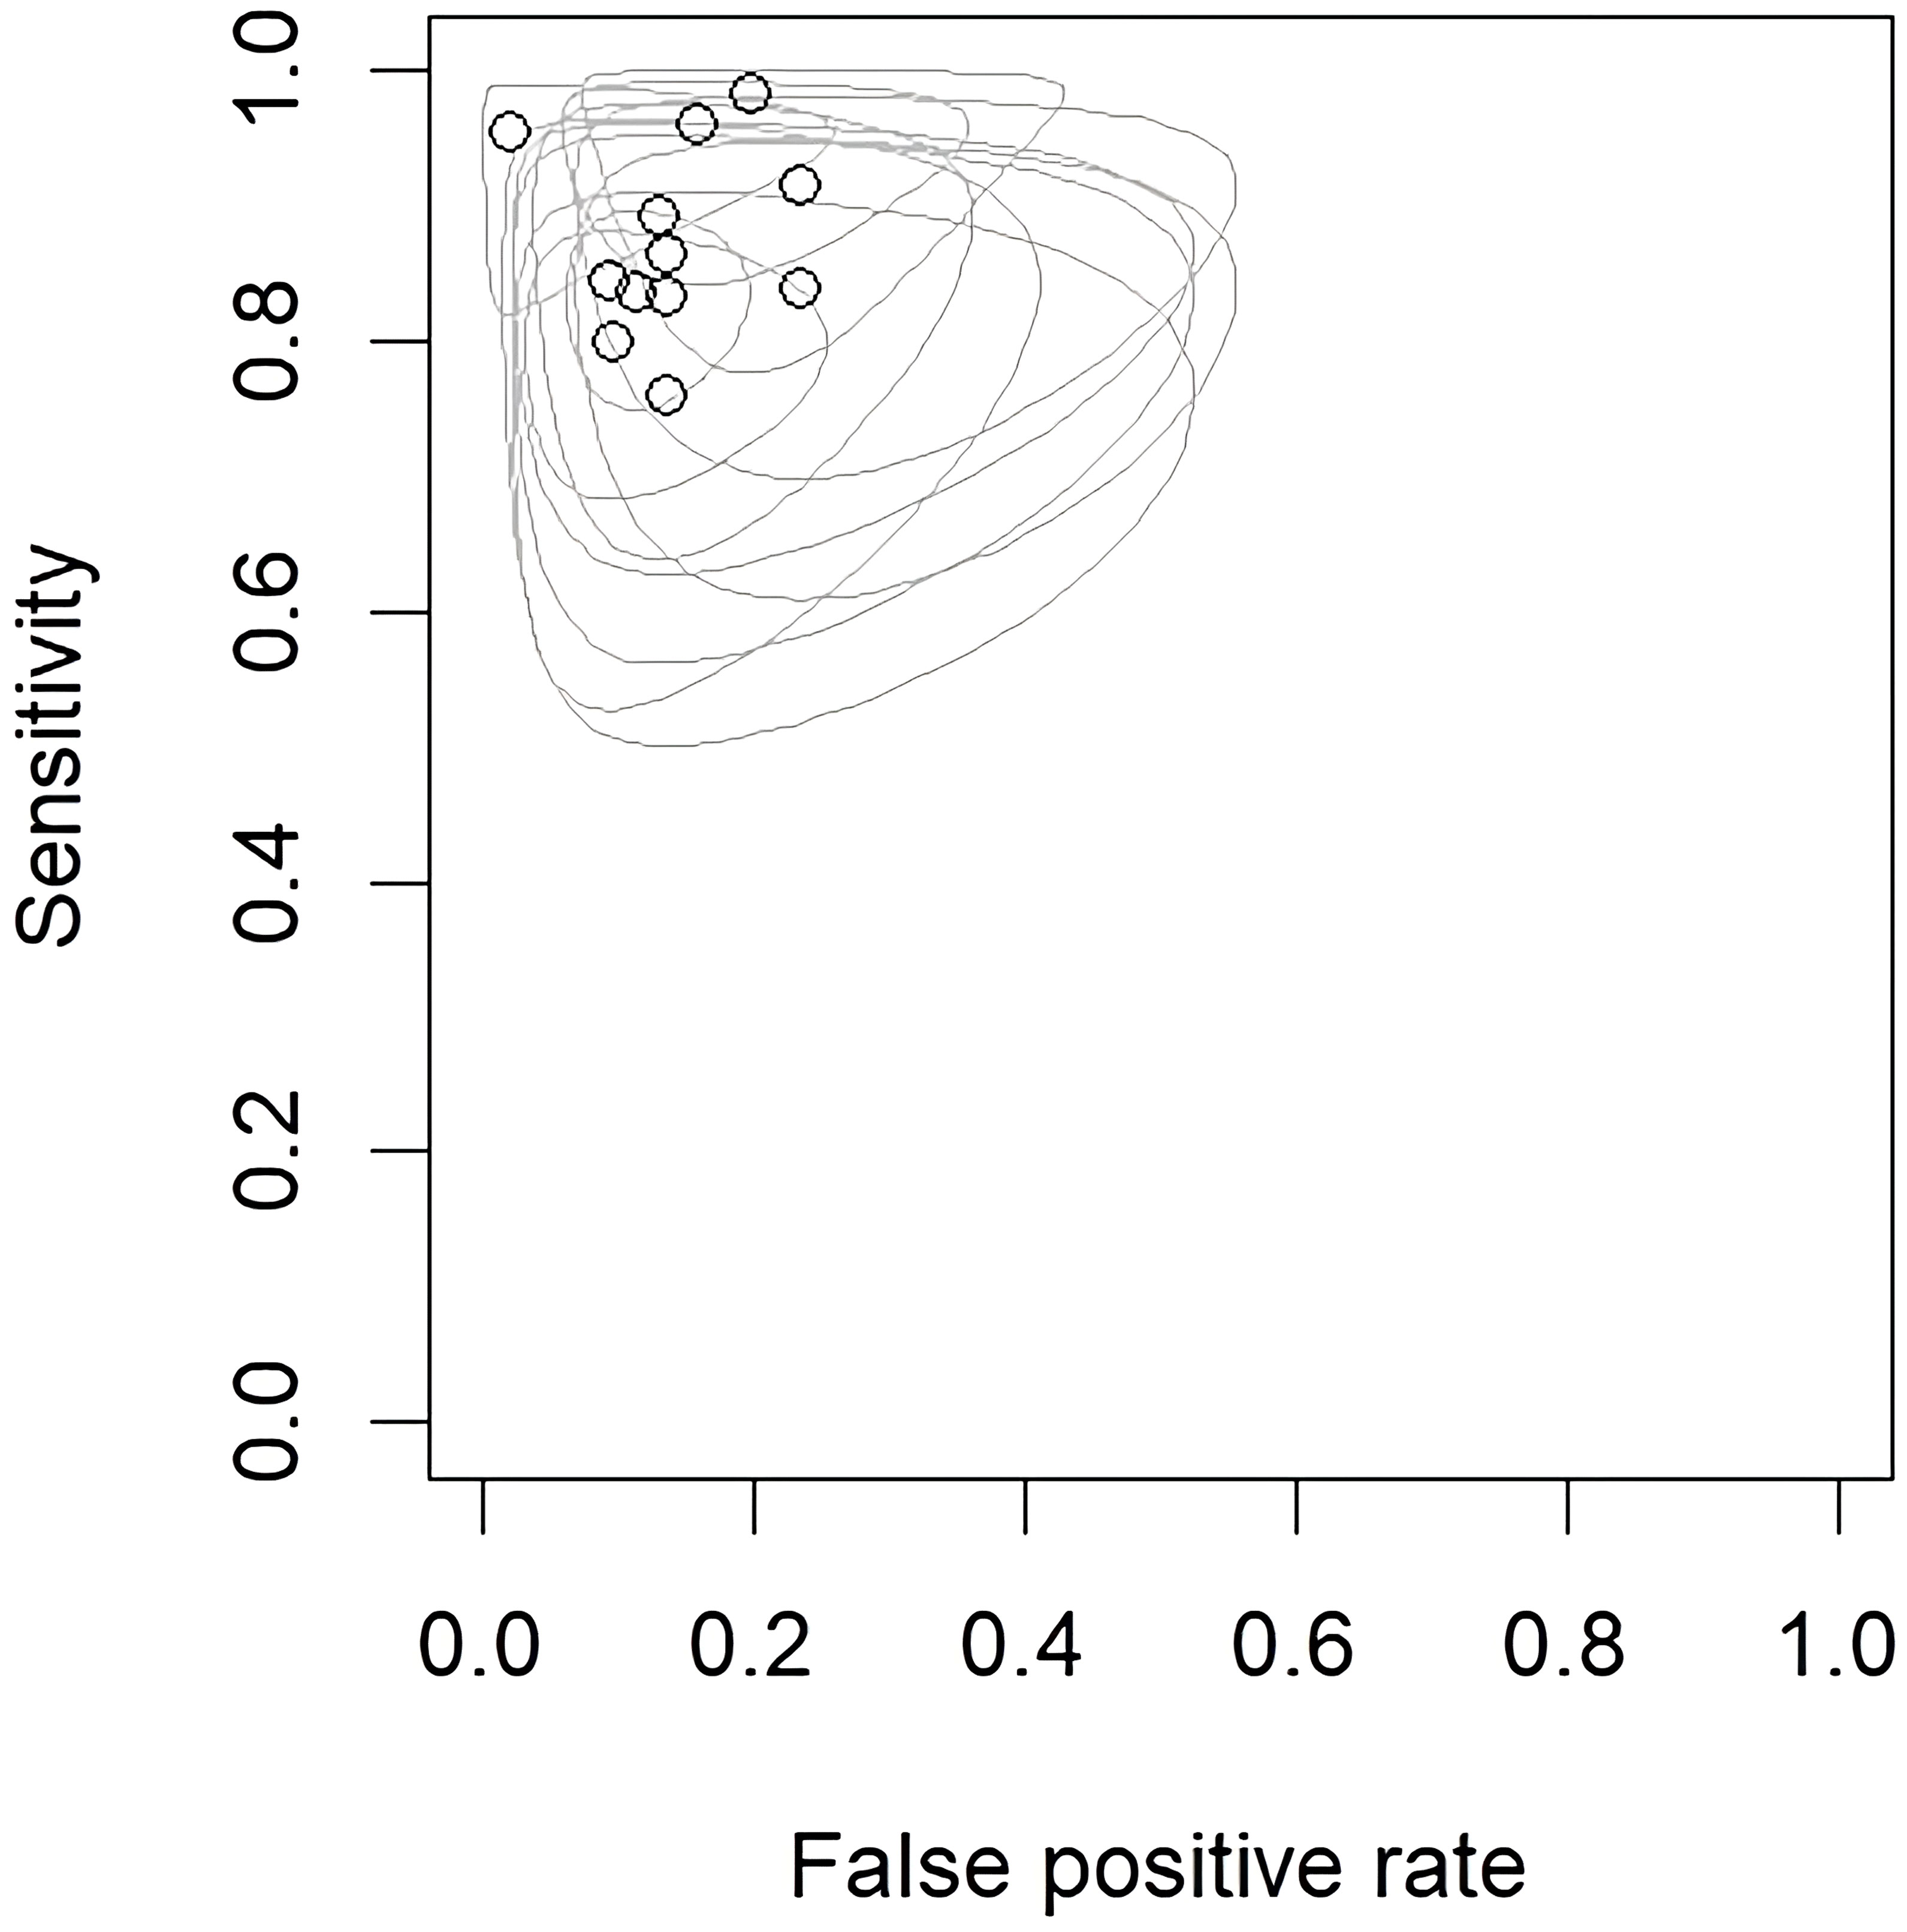
Figure 3 Endpoints of interest with individual confidence regions for differentiation between CNS gliomas and PCNSLs. CNS, central nervous system; PCNSL, primary central nervous system lymphoma.
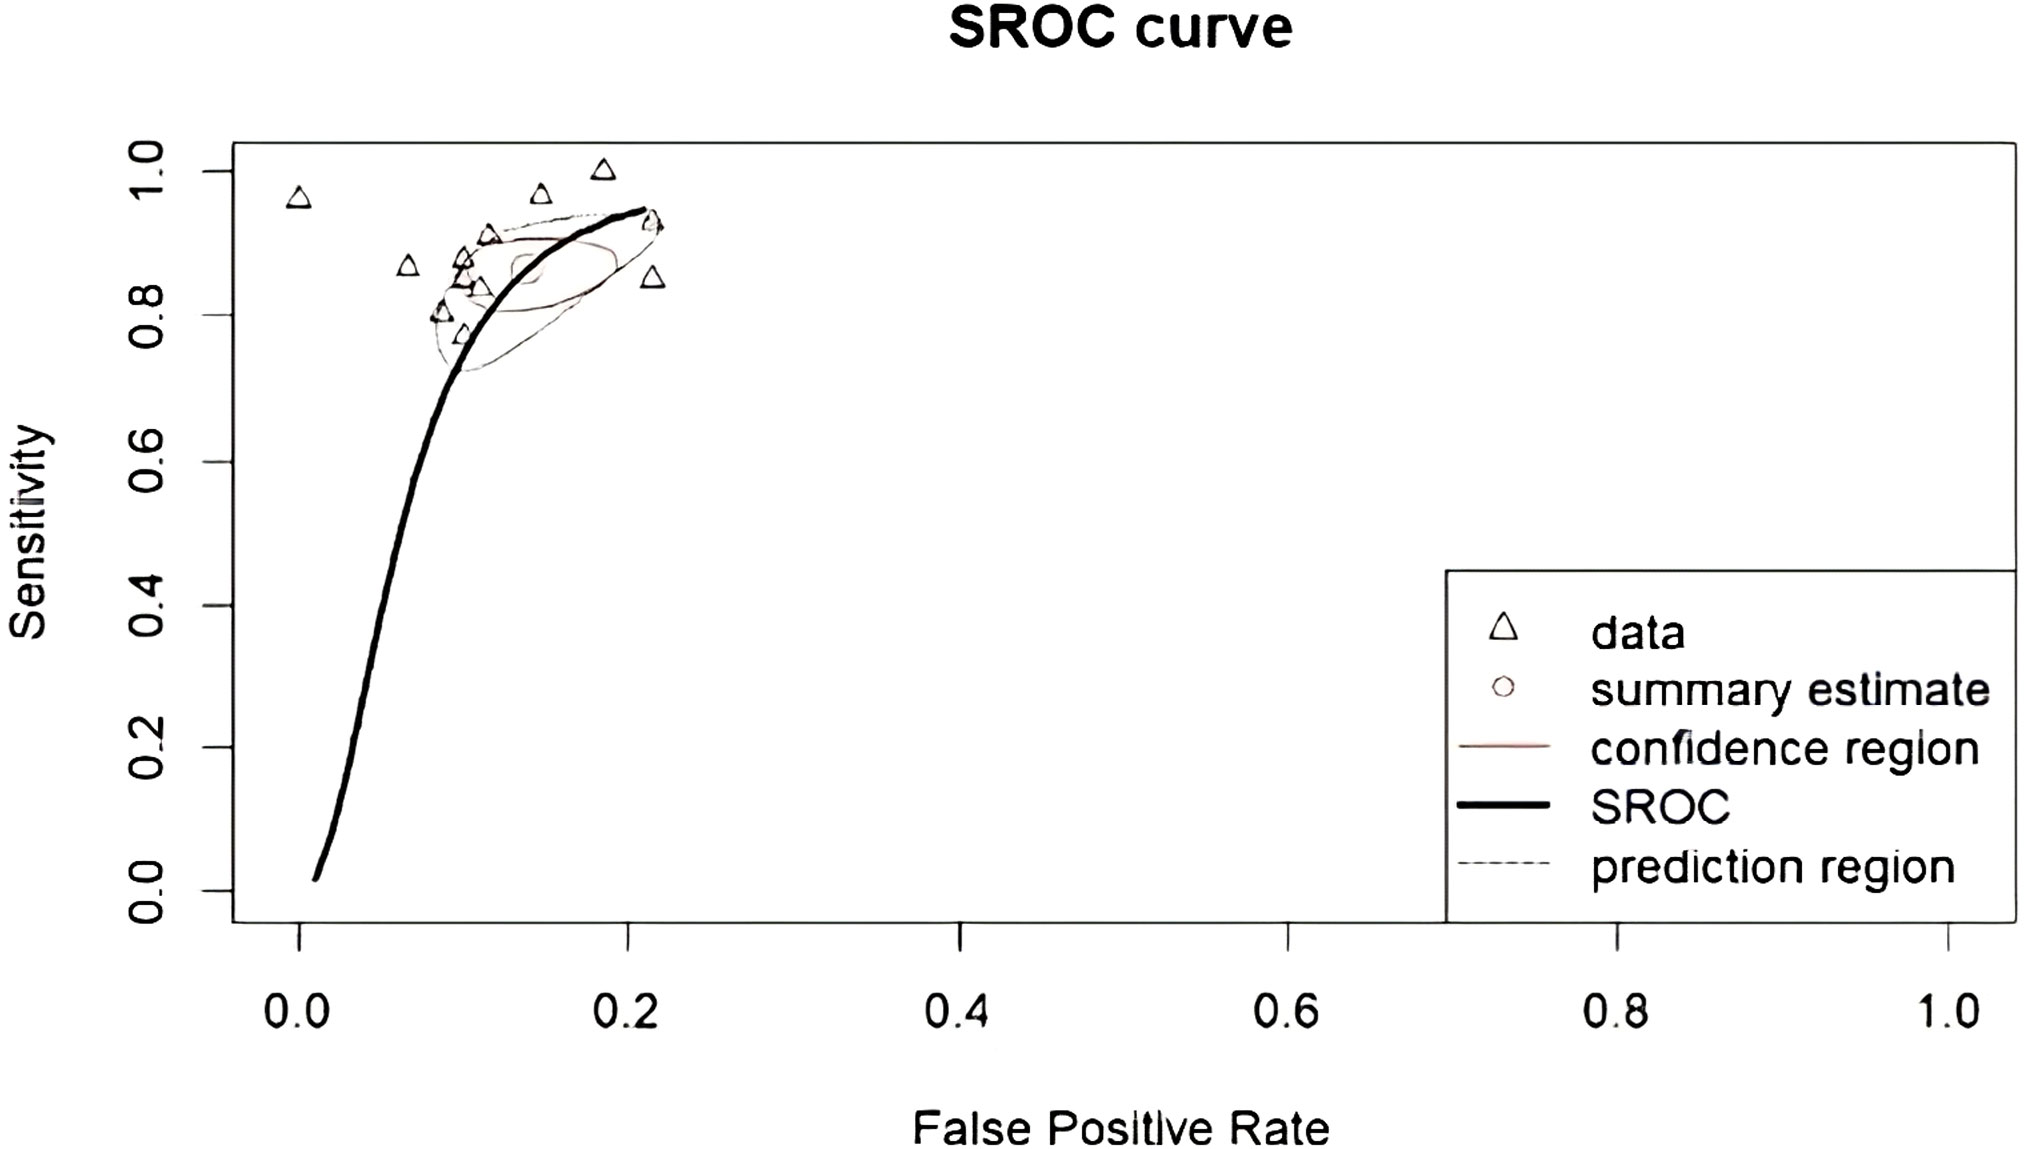
Figure 4 Corresponding SROC curve for differentiation between CNS gliomas and PCNSLs. SROC, summary receiver operating characteristic; CNS, central nervous system; PCNSL, primary central nervous system lymphoma.
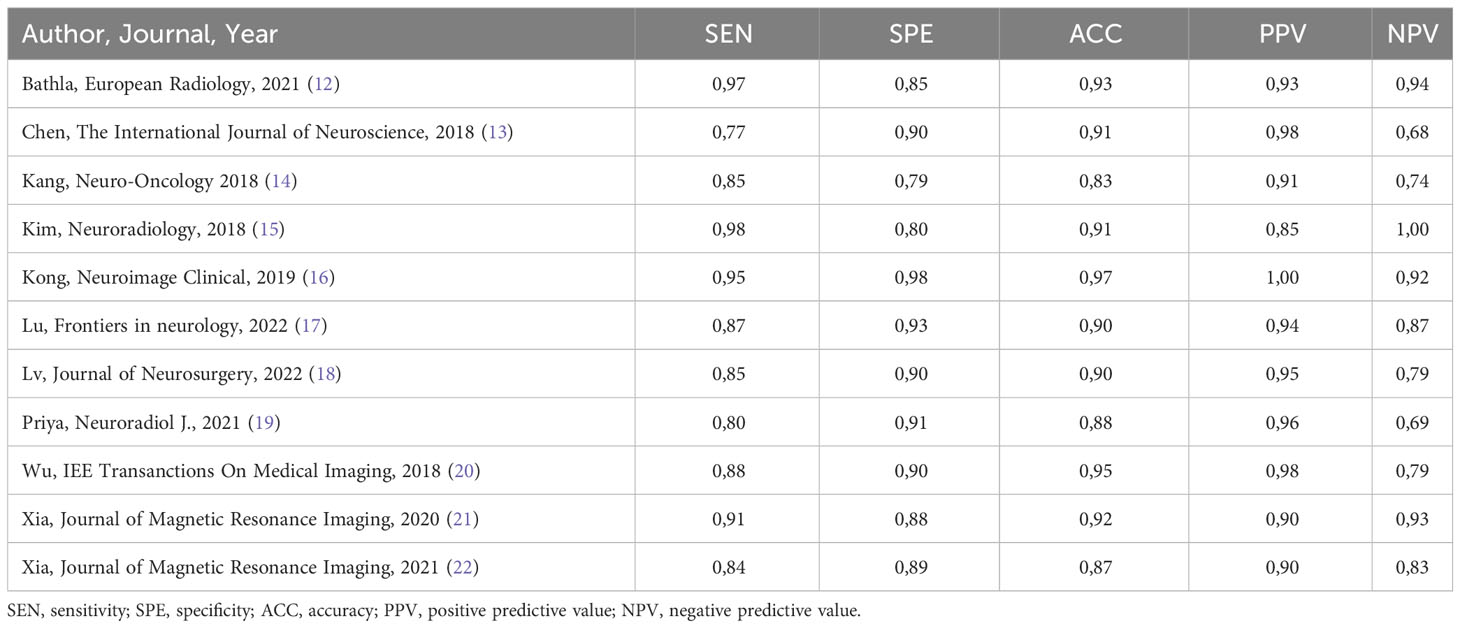
Table 2 Summary of performance data of the radiomics models.
3.4 Secondary outcomes
Our subgroup analysis could not evidence variables that significantly impact the performance of the models. Nonetheless, the best-performing features were those extracted from the Gray Level Run Length Matrix (GLRLM; ACC 97%) (16), followed by the ones provided by the Neighboring Gray Tone Difference Matrix (NGTDM; ACC 93%) (12) and then shape-based features (ACC 91%). As for the imaging modalities, the best-performing was the 18F-FDG-PET/CT (ACC 97%) (16), followed by the MRI CE-T1W reported in another 7 studies (ACC 87% (22) - 95% (20)). It’s worth mentioning that half of the included studies incorporated external test sets for evaluation (13–15, 18, 21, 23), while the remaining half solely relied on their internal datasets (12, 16, 17, 19, 20, 22). Additionally, most studies applied a cross-validation analysis (92%). Table 3 summarizes the secondary outcomes.
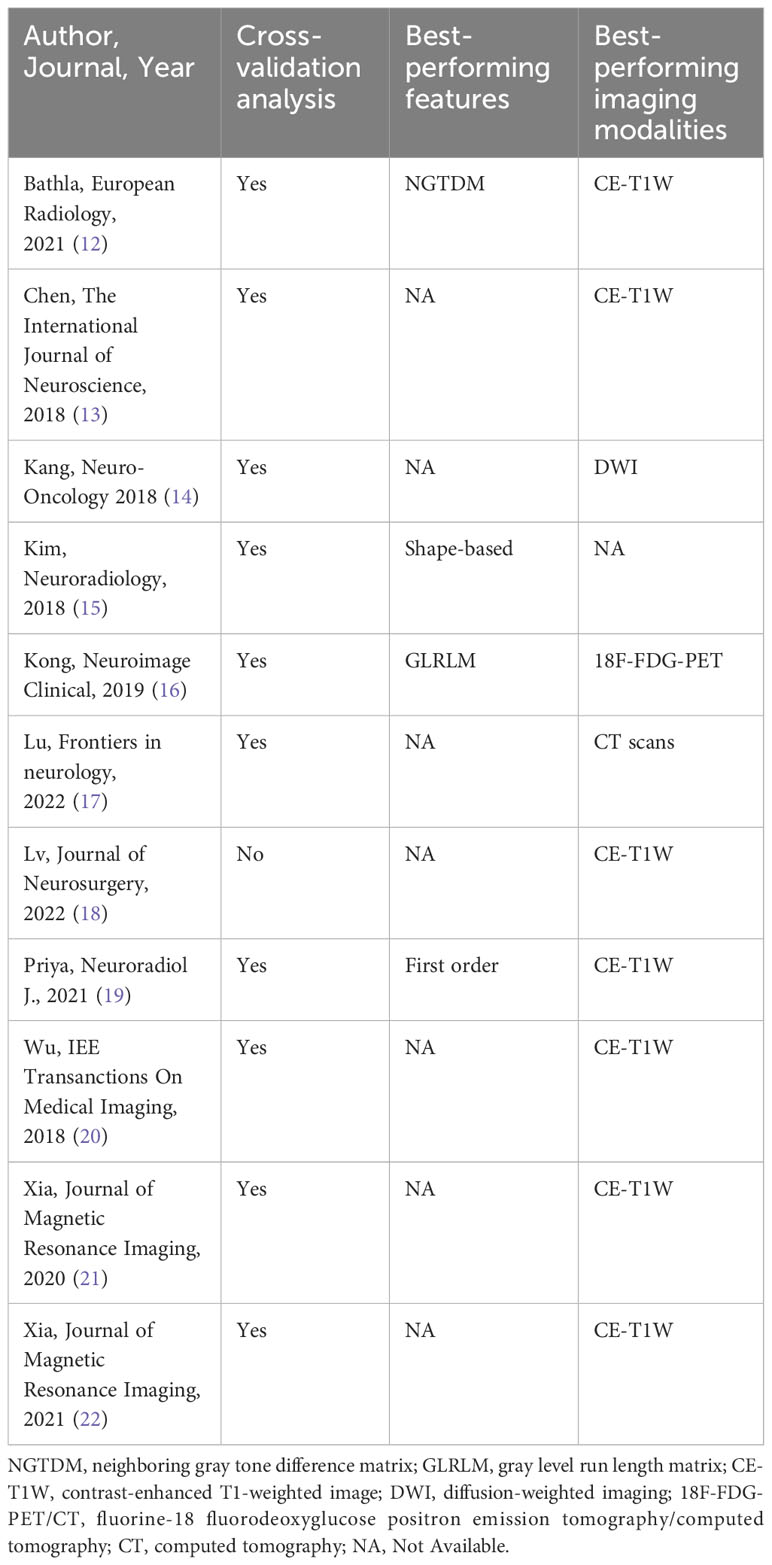
Table 3 Cross-validation analysis, best-performing features, and best-performing imaging modalities per each study.
We furthermore investigated the presence of potential publication bias, as well as small study effect, conducting the generalized Egger’s test, which can incorporate the correlation information intrinsic in the diagnostic test accuracy meta-analysis (24). The outcome of the test was not significant (p=0.052), indicating no asymmetry into the funnel plot. This aspect can be also gathered from Figure 5 providing the Funnel plots for the bivariate outcomes of our diagnostic meta-analysis, namely the logit of the SEN and of the FPR (see Figure 5 left and right respectively).
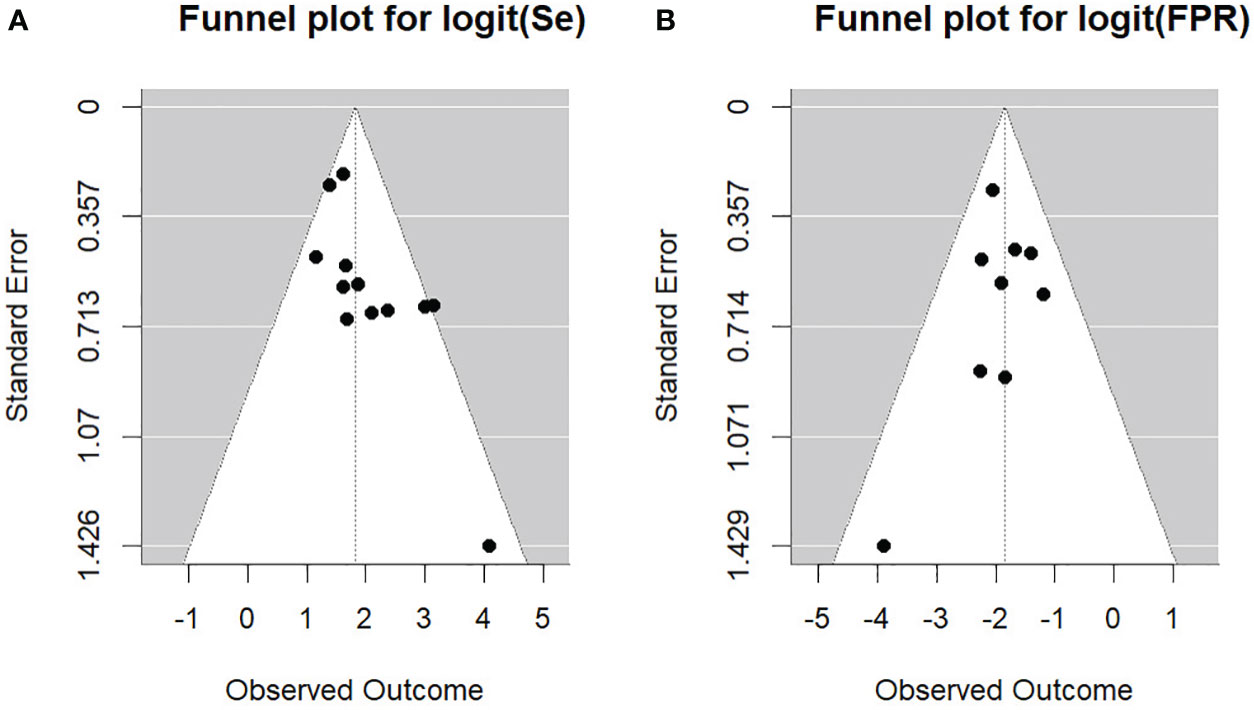
Figure 5 Funnel plots for the bivariate outcomes. (A) Se, sensitivity; (B) FPR, false positive rate.
3.5 Study heterogeneity
The χ2 test suggested substantial heterogeneity of SEN (χ2 = 20.5, df=11, P=0.04) and SPE (χ2 = 21.3, df=11, P=0.03) for the CNS gliomas vs. PNCSLs differentiation task.
4 Discussion
In this study, we conducted a comprehensive meta-analysis to assess the performance of radiomics in discriminating between CNS gliomas and PCNSLs. A total of 12 eligible articles were included in the analysis, encompassing a dataset of 1779 patients. Most studies employed ML techniques, with SVM being the most used classifier.
Overall, radiomics demonstrated promising performance in discriminating between these two tumor types, with certain texture matrices, such as GLRLM and NGTDM, providing valuable information for the extraction of diverse radiomic features and showing higher accuracy in this discrimination process. Additionally, the utilization of 18F-FDG-PET/CT and CE-T1W MRI modalities yielded the most promising results.
4.1 Radiomics models
The studies included in the meta-analysis used two different AI techniques in the context of radiomics, namely ML and its subcategory, DL. These advanced computational techniques allowed researchers to extract high-dimensional imaging features from different modalities, including MRI and PET/CT scans, enabling a more comprehensive characterization of these tumors.
Among the AI models employed, ML was the most used approach, reflecting its well-established presence in medical imaging research. SVM emerged as the most adopted classifier, equipped with radial basis function or polynomial kernel in most of the cases. RF and LR were also frequently employed.
Furthermore, a noteworthy percentage of studies (25%) incorporated DL techniques, which indicates the growing interest and exploration of neural networks for radiomics analysis. DL models have demonstrated their potential to automatically learn and identify intricate patterns in medical images, potentially leading to more accurate and efficient tumor classification (25).
Interestingly, a hybrid study combined both ML and DL techniques, leveraging the complementary strengths of these approaches (20). Such integration of diverse AI methodologies may offer synergistic advantages in capturing complex imaging patterns and enhancing the overall predictive power of radiomics models (26).
The imaging modalities used in the included studies were primarily MRI-based, with the CE-T1W being the most common sequence. This preference can be attributed to the valuable contrast enhancement information provided by CE-T1W, which aids in identifying regions of abnormal vascularity and enhancing tumor boundaries. The DWI, T2-FLAIR, and T2W sequences were also frequently employed, each contributing unique information about the tumor’s cellular density, edema, and structural characteristics.
Additionally, two studies utilized alternative imaging techniques, namely 18F-FDG-PET/CT (16) and CT (17). These studies represent a broader exploration of radiomics beyond traditional MRI-based approaches, and they may offer unique insights into tumor metabolism and density, respectively.
The radiomics models developed in these studies showed promising results in differentiating CNS gliomas from PCNSLs and have the potential to contribute significantly to improved patient outcomes, aiding in accurate and timely diagnoses, as well as personalized treatment strategies.
4.2 Radiomics performance
In this meta-analysis, we evaluated the performance of radiomics in discriminating between CNS gliomas and PCNSLs using data from a total of 993 patients from various validation or test datasets included in the selected studies. The bivariate analyses yielded an overall SEN and SPE of 88% and 87%, respectively. The SROC curve further illustrated the differentiation task with summary estimate coordinates of [0.87; 0.14].
When comparing our radiomics-based results to other non-radiomic studies mentioned in the literature, we observed competitive performance. While it is essential to note that the studies included in our meta-analysis varied in terms of population size, methodology, and the specific radiomics features used, our overall SEN and SPE surpassed the reported diagnostic accuracy of some non-radiomic approaches.
For instance, a study used DWI in association with ADC to differentiate between CNS gliomas and PCNSLs, but the findings indicated a slightly lower diagnostic performance, with a SEN of 82% (95% CI 0.75-0.88) and a SPE of 87% (95% CI 0.84-0.90) (27). Similarly, in another study, the diagnostic efficacy of DWI was investigated for the same discrimination task, but it also exhibited lower performance, with SEN at 82% (95% CI 0.70-0.90) and SPE at 84% (95% CI 0.75-0.90) (28). DWI provides valuable insights into tissue microstructure by measuring the random motion of water molecules, offering a direct examination of cellular density and tissue organization. This information can be particularly useful for distinguishing between different tissue types and detecting subtle alterations in cellularity. However, DWI has its limitations, primarily related to its sensitivity to motion artifacts and challenges in accurately quantifying certain tissue characteristics. Additionally, DWI may be influenced by factors such as perfusion and inflammation, potentially affecting the reliability of the obtained images (29). Radiomic-based models, on the other hand, leverage a comprehensive set of quantitative features extracted from medical images, including texture, shape, and intensity patterns. The advantages of radiomics include its ability to capture complex spatial relationships within the tumor, potentially revealing subtle patterns that are not easily discernible through visual inspection. Radiomic features can provide a more holistic characterization of the tumor’s heterogeneity, offering a broader perspective for discrimination tasks. However, radiomic analysis requires careful standardization of imaging protocols and segmentation methods to ensure reproducibility and generalizability of results (30). Our radiomics analysis showed promising results, demonstrating a diagnostic differentiation performance that surpassed these non-radiomic approaches.
4.3 Determinants of performance
The identification of the most influential texture matrices, namely GLRLM and NGTDM, provides valuable insights for future radiomics model development. Both these entities provide features based on texture analysis, quantifying the spatial distribution of voxel intensities in medical images and providing information about image coarseness and homogeneity. More specifically, GLRLM focuses on the lengths of homogeneous runs of pixels with the same gray-level value (31), while, NGTDM focuses more on the local intensity differences without considering specific patterns (32). By incorporating these features into radiomics models, researchers can potentially identify specific imaging patterns associated with disease characteristics, leading to more accurate diagnoses and personalized treatment approaches.
The choice of imaging modality also plays a critical role in the performance of radiomics models. While 18F-FDG-PET/CT demonstrated the highest accuracy of 97%, its practicality and accessibility may be limited in some clinical settings (16). The 18F-FDG-PET/CT provides valuable metabolic information, making it highly effective in identifying active tumor regions. However, the need for specific on-site equipment and specialized facilities to produce the radiotracer and ensure radiation safety could restrict its accessibility in certain medical centers or regions. In contrast, MRI is more widely available and does not involve ionizing radiation, making it a safer and more convenient option for many patients.
Within the MRI techniques, the CE-T1W sequence stands out as the best-performing modality, with reported accuracies ranging from 87% to 95%. This enhanced contrast imaging modality allows for better visualization and characterization of lesions and tumor boundaries. Furthermore, the CE-T1W sequence is commonly used in clinical practice for the diagnosis and monitoring of most tumors, making it a familiar and easily interpretable imaging modality.
Cross-validation analyses were widely used in the majority (92%) of the included studies, demonstrating a rigorous approach to validating radiomics models. By dividing the dataset into multiple subsets (folds) and training the model on one subset while testing it on the remaining, cross-validation helps to simulate the model’s performance on new data. This process helps in estimating the generalization capabilities of the model and provides insights into potential overfitting issues. Its widespread use indicates a commitment to producing reliable and reproducible radiomics results, which is crucial for successful implementation in clinical settings (33). Furthermore, 33% of the studies employed also an external validation fold, pursuing further the generalization capabilities of the model.
4.4 Limitations
Despite the number of patients included in our study, this meta-analysis was based on retrospective cohort studies, and thus, it has limitations inherent to retrospective studies. Given the bivariate model of the meta-analysis, we did not calculate the overall ACC for the differentiation task. Moreover, our subgroup analysis was limited by the number of studies identified. It is important to acknowledge the inherent risk of selection bias, information bias, and potential confounding variables that are typical in such studies. While retrospective analyses provide valuable insights, the inability to control certain variables poses challenges in establishing causal relationships.
Nonetheless, to the best of our knowledge, this meta-analysis represents the first comprehensive synthesis of the current performance of radiomics for discriminating between CNS gliomas and PCNSLs. The findings provide cutting-edge insights to guide the development of future models.
Additionally, it is essential to recognize that remains a limitation regarding the assessment of 18F-FDG-PET/CT. We acknowledge that only one study contributed to the evaluation of this modality. Therefore, while our results suggest a high performance for 18F-FDG-PET/CT, it is crucial to interpret this with caution due to the limited data available for this modality. The systematic review also included a risk of bias assessment using the NOS. The NOS allowed for the evaluation of the quality of the included studies based on selection criteria, comparability of the study, and outcome assessment. This assessment ensured that the included studies were reliable.
5 Conclusions
The current SEN and SPE of radiomics to discriminate CNS gliomas from PCNSLs are high, making radiomics a helpful method to differentiate these tumor types. The best-performing texture matrices are the GLRLM, NGTDM, and the best performing features are shape-based. The 18F-FDG-PET/CT imaging modality was the best-performing, while the MRI CE-T1W was the most used and the second best-performing. There is significant heterogeneity among the current models that underscores the need for a focused developmental phase. Radiomics laboratories should be oriented towards more defined and shared algorithms that will possibly be implemented in clinical practice. Our findings suggest that integrating radiomics into diagnostic workflows may contribute to improved accuracy in distinguishing between CNS gliomas and PCNSLs.
Data availability statement
The original contributions presented in the study are included in the article/supplementary material. Further inquiries can be directed to the corresponding author.
Author contributions
AG: Data curation, Investigation, Writing – original draft, Writing – review & editing. NA: Data curation, Investigation, Writing – original draft. FP: Data curation, Formal analysis, Writing – original draft. PP: Supervision, Validation, Writing – review & editing. WB: Supervision, Validation, Writing – review & editing. MF: Conceptualization, Project administration, Supervision, Validation, Visualization, Writing – review & editing. LM: Conceptualization, Methodology, Project administration, Supervision, Validation, Visualization, Writing – original draft, Writing – review & editing.
Funding
The author(s) declare that no financial support was received for the research, authorship, and/or publication of this article.
Acknowledgments
We thank Prof. Waleed Brinjikji for his supervision and Prof. Marco Fontanella for his support and guidance.
Conflict of interest
The authors declare that the research was conducted in the absence of any commercial or financial relationships that could be construed as a potential conflict of interest.
The author(s) declared that they were an editorial board member of Frontiers, at the time of submission. This had no impact on the peer review process and the final decision.
Publisher’s note
All claims expressed in this article are solely those of the authors and do not necessarily represent those of their affiliated organizations, or those of the publisher, the editors and the reviewers. Any product that may be evaluated in this article, or claim that may be made by its manufacturer, is not guaranteed or endorsed by the publisher.
Abbreviations
AI, artificial intelligence; ML, machine learning; DL, deep learning; CNS, central nervous system; PCNSL, primary central nervous system lymphoma; PRISMA, preferred reporting items for systematic reviews and meta-analysis; MeSH; MeSH, Medical Subject Heading; MRI, magnetic resonance imaging; LR, logistic regression; SVM, support vector machine; NB, naïve bayes; kNN, k-nearest neighbour; MLP, multilayer perceptron; RF, random forest; AdaBoost, adaptive boosting; ENR, elastic net regression; LDA, linear discriminant analysis; CNN, convolutional neural network; LASSO regression, least absolute shrinkage and selection operator regression; T1W, T1-weighted; CE-T1W, contrast-enhanced T1 weighted image; T2W, T2-weighted; T2-FLAIR, T2 weighted fluid-attenuated inversion recovery; DWI, diffusion-weighted imaging; DSC, dynamic susceptibility contrast; PWI, perfusion-weighted imaging; T1-FFE, T1-weighted fast field echo; 18F-FDG-PET/CT; fluorine-18 fluorodeoxyglucose positron emission tomography/computed tomography; CT, computed tomography; SEN, sensitivity; SPE, specificity; ACC, accuracy; PPV, positive predictive value; NPV, negative predictive value; SROC, summary receiver operating characteristics; NOS, newcastle-ottawa scale; TP, true positive; FP, false positive; FN, false negative; TN, true negative; CI, confidence interval; FPR, false positive rate; GLRLM, gray level run length matrix; NGTDM, neighboring gray tone difference matrix.
References
1. Lambin P, Leijenaar RTH, Deist TM, Peerlings J, de Jong EEC, van Timmeren J, et al. Radiomics: the bridge between medical imaging and personalized medicine. Nat Rev Clin Oncol (2017) 14(12):749–62. doi: 10.1038/nrclinonc.2017.141
2. Aerts HJWL, Velazquez ER, Leijenaar RT, Parmar C, Grossmann P, Carvalho S, et al. Decoding tumour phenotype by noninvasive imaging using a quantitative radiomics approach. Nat Commun (2014) 5(1):4006. doi: 10.1038/ncomms5006
3. Chen C, Zheng A, Ou X, Wang J, Ma X. Comparison of radiomics-based machine-learning classifiers in diagnosis of glioblastoma from primary central nervous system lymphoma. Front Oncol (2020) 10:1151. doi: 10.3389/fonc.2020.01151
4. Stupp R, Mason WP, van den Bent MJ, Weller M, Fisher B, Taphoorn MJ, et al. Radiotherapy plus concomitant and adjuvant temozolomide for glioblastoma. N Engl J Med (2005) 352(10):987–96. doi: 10.1056/NEJMoa043330
5. Ferreri AJM, Holdhoff M, Nayak L, Rubenstein JL. “Evolving treatments for primary central nervous system lymphoma. Am Soc Clin Oncol Educ Book (2019) 39:454–66. doi: 10.1200/EDBK_242547
6. Alcaide-Leon P, Dufort P, Geraldo AF, Alshafai L, Maralani PJ, Spears J, et al. Differentiation of enhancing glioma and primary central nervous system lymphoma by texture-based machine learning. AJNR Am J Neuroradiol (2017) 38(6):1145–50. doi: 10.3174/ajnr.A5173
7. Page MJ, McKenzie JE, Bossuyt PM, Boutron I, Hoffmann TC, Mulrow CD, et al. The PRISMA 2020 statement: an updated guideline for reporting systematic reviews. BMJ (2021) n71:89. doi: 10.1136/bmj.n71
8. Ottawa Hospital Research Institute. . Available at: https://www.ohri.ca/programs/clinical_epidemiology/oxford.asp (Accessed Mar. 22, 2023).
9. Luchini C, Stubbs B, Solmi M, Veronese N. Assessing the quality of studies in meta-analyses: Advantages and limitations of the Newcastle Ottawa Scale. World J Meta-Analysis (2017) 5(4):80–4. doi: 10.13105/wjma.v5.i4.80
10. Doebler P, Holling H. Meta-analysis of diagnostic accuracy with mada. Psychometrika (2015) 80:1084–104. doi: 10.1007/s11336-014-9430-0
11. Arends LR, Hamza TH, van Houwelingen JC, Heijenbrok-Kal MH, Hunink MGM, Stijnen T. Bivariate random effects meta-analysis of ROC curves. Med Decis Making (2008) 28(5):621–38. doi: 10.1177/0272989X08319957
12. Bathla G, Priya S, Liu Y, Ward C, Le NH, Soni N, et al. Radiomics-based differentiation between glioblastoma and primary central nervous system lymphoma: a comparison of diagnostic performance across different MRI sequences and machine learning techniques. Eur Radiol (2021) 31(11):8703–13. doi: 10.1007/s00330-021-07845-6
13. Chen Y, Li Z, Wu G, Yu J, Wang Y, Lv X, et al. Primary central nervous system lymphoma and glioblastoma differentiation based on conventional magnetic resonance imaging by high-throughput SIFT features. Int J Neurosci (2018) 128(7):608–18. doi: 10.1080/00207454.2017.1408613
14. Kang D, Park JE, Kim YH, Kim JH, Oh JY, Kim J, et al. Diffusion radiomics as a diagnostic model for atypical manifestation of primary central nervous system lymphoma: development and multicenter external validation. Neuro-Oncology (2018) 20(9):1251–61. doi: 10.1093/neuonc/noy021
15. Kim Y, Cho H, Kim ST, Park H, Nam D, Kong D-S. Radiomics features to distinguish glioblastoma from primary central nervous system lymphoma on multi-parametric MRI. Neuroradiology (2018) 60(12):1297–305. doi: 10.1007/s00234-018-2091-4
16. Kong Z, Jiang C, Zhu R, Feng S, Wang Y, Li J, et al. 18F-FDG-PET-based radiomics features to distinguish primary central nervous system lymphoma from glioblastoma. NeuroImage Clin (2019) 23:101912. doi: 10.1016/j.nicl.2019.101912
17. Lu G, Zhang Y, Wang W, Miao L, Mou W. Machine learning and deep learning CT-based models for predicting the primary central nervous system lymphoma and glioma types: A multicenter retrospective study. Front Neurol (2022) 13:905227. doi: 10.3389/fneur.2022.905227
18. Lv K, Chen H, Cao X, Du P, Chen J, Liu X, et al. Development and validation of a machine learning algorithm for predicting diffuse midline glioma, H3 K27–altered, H3 K27 wild-type high-grade glioma, and primary CNS lymphoma of the brain midline in adults. J Neurosurg (2022) 139(2):393–401. doi: 10.3171/2022.11.JNS221544
19. Priya S, Ward C, Locke T, Soni N, Maheshwarappa RP, Monga V, et al. Glioblastoma and primary central nervous system lymphoma: differentiation using MRI derived first-order texture analysis – a machine learning study. Neuroradiol J (2021) 34(4):320–8. doi: 10.1177/1971400921998979
20. Wu G, Chen Y, Wang Y, Yu J, Lv X, Ju X, et al. Sparse representation-based radiomics for the diagnosis of brain tumors. IEEE Trans Med Imaging (2018) 37(4):893–905. doi: 10.1109/TMI.2017.2776967
21. Xia W, Hu B, Li H, Geng C, Wu Q, Yang L, et al. Multiparametric-MRI-based radiomics model for differentiating primary central nervous system lymphoma from glioblastoma: development and cross-vendor validation. J Magnetic Resonance Imaging (2020) 53(1):242–50. doi: 10.1002/jmri.27344
22. Xia W, Hu B, Li H, Shi W, Tang Y, Yu Y, et al. Deep learning for automatic differential diagnosis of primary central nervous system lymphoma and glioblastoma: multi-parametric magnetic resonance imaging based convolutional neural network model. J Magnetic Resonance Imaging (2021) 54(3):880–7. doi: 10.1002/jmri.27592
23. Yun J, Park JE, Lee H, Ham S, Kim N, Kim HS. Radiomic features and multilayer perceptron network classifier: a robust MRI classification strategy for distinguishing glioblastoma from primary central nervous system lymphoma. Sci Rep (2019) 9(1):5746. doi: 10.1038/s41598-019-42276-w
24. Noma H. Discussion on ‘Testing small study effects in multivariate meta-analysis’ by Chuan Hong, Georgia Salanti, Sally Morton, Richard Riley, Haitao Chu, Stephen E. Kimmel, and Yong Chen. Biometrics (2020) 76(4):1255–9. doi: 10.1111/biom.13343
25. Arora S, Sharma M. (2021). Deep learning for brain tumor classification from MRI images. In: 2021 Sixth International Conference on Image Information Processing (ICIIP). (Shimla, India: IEEE). pp. 409–12. doi: 10.1109/ICIIP53038.2021.9702609
26. Kang J, Ullah Z, Gwak J. MRI-based brain tumor classification using ensemble of deep features and machine learning classifiers. Sensors (2021) 21(6). doi: 10.3390/s21062222
27. Du X, He Y, Lin W. Diagnostic accuracy of the diffusion-weighted imaging method used in association with the apparent diffusion coefficient for differentiating between primary central nervous system lymphoma and high-grade glioma: systematic review and meta-analysis. Front Neurol (2022) 13:882334. doi: 10.3389/fneur.2022.882334
28. Lu X, Xu W, Wei Y, Li T, Gao L, Fu X, et al. Diagnostic performance of DWI for differentiating primary central nervous system lymphoma from glioblastoma: a systematic review and meta-analysis. Neurol Sci (y 2019) 40(5):947–56. doi: 10.1007/s10072-019-03732-7
29. Chilla GS, Tan CH, Xu C, Poh CL. Diffusion weighted magnetic resonance imaging and its recent trend—a survey. Quant Imaging Med Surg (2015) 5(3):407–22. doi: 10.3978/j.issn.2223-4292.2015.03.01
30. Yip SS, Aerts HJWL. Applications and limitations of radiomics. Phys Med Biol (2016) 61(13):13. R150–R166. 10.1088/0031-9155/61/13/R150
31. Zhang H, Hung C-L, Min G, Guo J-P, Liu M, Hu X. GPU-accelerated GLRLM algorithm for feature extraction of MRI. Sci Rep (2019) 9(1):10883. doi: 10.1038/s41598-019-46622-w
32. Amadasun M, King R. Textural features corresponding to textural properties. IEEE Trans Systems Man Cybernetics (1989) 19(5):1264–74. doi: 10.1109/21.44046
Keywords: radiomics, gliomas, primary central nervous system lymphomas, systematic review, meta-analysis
Citation: Garaba A, Aslam N, Ponzio F, Panciani PP, Brinjikji W, Fontanella M and De Maria L (2024) Radiomics for differentiation of gliomas from primary central nervous system lymphomas: a systematic review and meta-analysis. Front. Oncol. 14:1291861. doi: 10.3389/fonc.2024.1291861
Received: 10 September 2023; Accepted: 29 January 2024;
Published: 14 February 2024.
Edited by:
Sharon R. Pine, University of Colorado, United StatesReviewed by:
Hubert Szymon Gabryś, University Hospital Zürich, SwitzerlandRaees Tonse, Baptist Hospital of Miami, United States
Copyright © 2024 Garaba, Aslam, Ponzio, Panciani, Brinjikji, Fontanella and De Maria. This is an open-access article distributed under the terms of the Creative Commons Attribution License (CC BY). The use, distribution or reproduction in other forums is permitted, provided the original author(s) and the copyright owner(s) are credited and that the original publication in this journal is cited, in accordance with accepted academic practice. No use, distribution or reproduction is permitted which does not comply with these terms.
*Correspondence: Alexandru Garaba, YWxleGdhcmFiYWZsYkBnbWFpbC5jb20=
†ORCID: Alexandru Garaba, orcid.org/0000-0002-9003-6351