 Stephanie J. Blocker1*
 Yvonne M. Mowery2
 Jeffrey I. Everitt3James Cook1
 Gary Price Cofer1
 Yi Qi1Alex M. Bassil4Eric S. Xu5David G. Kirsch6
 Cristian T. Badea1
 G. Allan Johnson1
- 1Department of Radiology, Duke University Medical Center, Duke University, Durham, NC, United States
- 2Department of Radiation Oncology, Hillman Cancer Center, University of Pittsburgh Medical Center, Pittsburgh, PA, United States
- 3Department of Pathology, Duke University Medical Center, Duke University, Durham, NC, United States
- 4Department of Radiation Oncology, Duke University Medical Center, Duke University, Durham, NC, United States
- 5Duke University Medical Center, Duke University, Durham, NC, United States
- 6Departments of Radiation Oncology and Medical Biophysics, Princess Margaret Cancer Centre, University Health Network (UHN), Toronto, ON, Canada
Purpose: To identify significant relationships between quantitative cytometric tissue features and quantitative MR (qMRI) intratumorally in preclinical undifferentiated pleomorphic sarcomas (UPS).
Materials and methods: In a prospective study of genetically engineered mouse models of UPS, we registered imaging libraries consisting of matched multi-contrast in vivo MRI, three-dimensional (3D) multi-contrast high-resolution ex vivo MR histology (MRH), and two-dimensional (2D) tissue slides. From digitized histology we generated quantitative cytometric feature maps from whole-slide automated nuclear segmentation. We automatically segmented intratumoral regions of distinct qMRI values and measured corresponding cytometric features. Linear regression analysis was performed to compare intratumoral qMRI and tissue cytometric features, and results were corrected for multiple comparisons. Linear correlations between qMRI and cytometric features with p values of <0.05 after correction for multiple comparisons were considered significant.
Results: Three features correlated with ex vivo apparent diffusion coefficient (ADC), and no features correlated with in vivo ADC. Six features demonstrated significant linear relationships with ex vivo T2*, and fifteen features correlated significantly with in vivo T2*. In both cases, nuclear Haralick texture features were the most prevalent type of feature correlated with T2*. A small group of nuclear topology features also correlated with one or both T2* contrasts, and positive trends were seen between T2* and nuclear size metrics.
Conclusion: Registered multi-parametric imaging datasets can identify quantitative tissue features which contribute to UPS MR signal. T2* may provide quantitative information about nuclear morphology and pleomorphism, adding histological insights to radiological interpretation of UPS.
Introduction
Undifferentiated pleomorphic sarcomas (UPS) form the largest subset of the 10% to 20% of soft tissue sarcomas without a clear tissue of origin (1, 2). Although relatively rare, soft tissue tumors can be diagnostically challenging, with a large number of tumor subtypes that exhibit overlapping diagnostic features (3). The genomic underpinnings of UPS are defined by their mutational complexity, including marked aneuploidy (4, 5), rather than a set of specific alterations (2, 6). This complexity can make molecular subtyping of these tumors a challenge. Morphologically, UPS can be quite heterogeneous, with atypical ovoid or spindle-shaped cells arranged in disorganized fascicular or storiform patterns. UPS tumors characteristically harbor large variations in nuclear size and shape, and may include multinucleated cells (7). Radiographic findings are variable in UPS, but they typically present with heterogeneous intratumor signal (8). Accurate diagnosis in patients with UPS relies on adequate sampling of the lesion given the heterogeneity of these tumors (9).
Although diagnosis of UPS presents a challenge, identifying relevant features is of prognostic value (10, 11). Non-invasive magnetic resonance (MR) imaging is a staple of clinical management of soft tissue sarcomas, though its capacity for prognostication has traditionally been limited to tumor size, topological features, necrosis identification, and peritumoral enhancement (10, 12). In addition to these features, the presence of the “tail sign” on MRI is prognostic, having been associated with a higher risk of local recurrence in UPS following surgical excision (13, 14). Increased signal heterogeneity on T2-weighted (T2W) MR images is typically considered a negative prognostic factor for soft tissue sarcomas (15). More recently, studies of radiomic features of soft tissues sarcoma have demonstrated prediction of tumor grade based on MR imaging (16). However, the histological foundation for MR features in UPS has not been established. Specifically, the relationship between quantitative MR imaging (qMRI) features and the hallmark cytological morphologies of UPS remains unknown. The purpose of this study was to measure relationships between qMRI and histology in UPS that may improve prognostication and decision making for patients with this challenging disease. Specifically, we looked for correlations between tissue histological features and the parameters of apparent diffusion coefficient (ADC) and T2*, as these measurements were acquired during our co-clinical imaging trial of soft tissue sarcoma (NCI U24 CA220245) performed to mirror patient imaging in the ongoing phase II clinical trial SU2C-SARC032 (NCT03092323). Our hypothesis was that by registering MR to pathology at high resolution using MRH, we would identify histological features of UPS which significantly correlate with qMRI, specifically ADC and T2*.
Materials and methods
Animal models
All animal studies were reviewed and approved by the Institutional Animal Care and Use Committee. Soft tissue sarcomas (n = 8) were induced in the hind limb of genetically engineered mice through a combination of Cre recombinase (Cre) activation to delete p53 and local injection of carcinogen, as described previously (17, 18). Briefly, adenovirus expressing Cre and 300 μg 3-methylcholanthrene (MCA; Sigma-Aldrich, Saint Louis, MO) were injected into the gastrocnemius muscle of p53fl/fl mice on a 129/SvJ background. Induction was performed in both male and female mice at 6-12 weeks of age, and tumors developed in approximately 8-12 weeks. When tumors reached 500-1,000 mm3, imaging studies were initiated.
Study design
This pilot study was conducted prospectively. For analysis of multi-modal imaging libraries, three-dimensional (3D) in vivo MRI and subsequent ex vivo MRH were registered together. After tissues were processed for pathology, 3D MR datasets were then registered to two-dimensional (2D) histology slides that were digitized through whole-slide imaging (Figures 1A, B). From digitized histology, we generated quantitative cytometric feature maps based on whole-slide automated nuclear segmentation (Figure 1C). In registered libraries, we automatically segmented intratumoral regions of distinct qMRI values and measured corresponding cytometric features in these regions (Figure 1D).
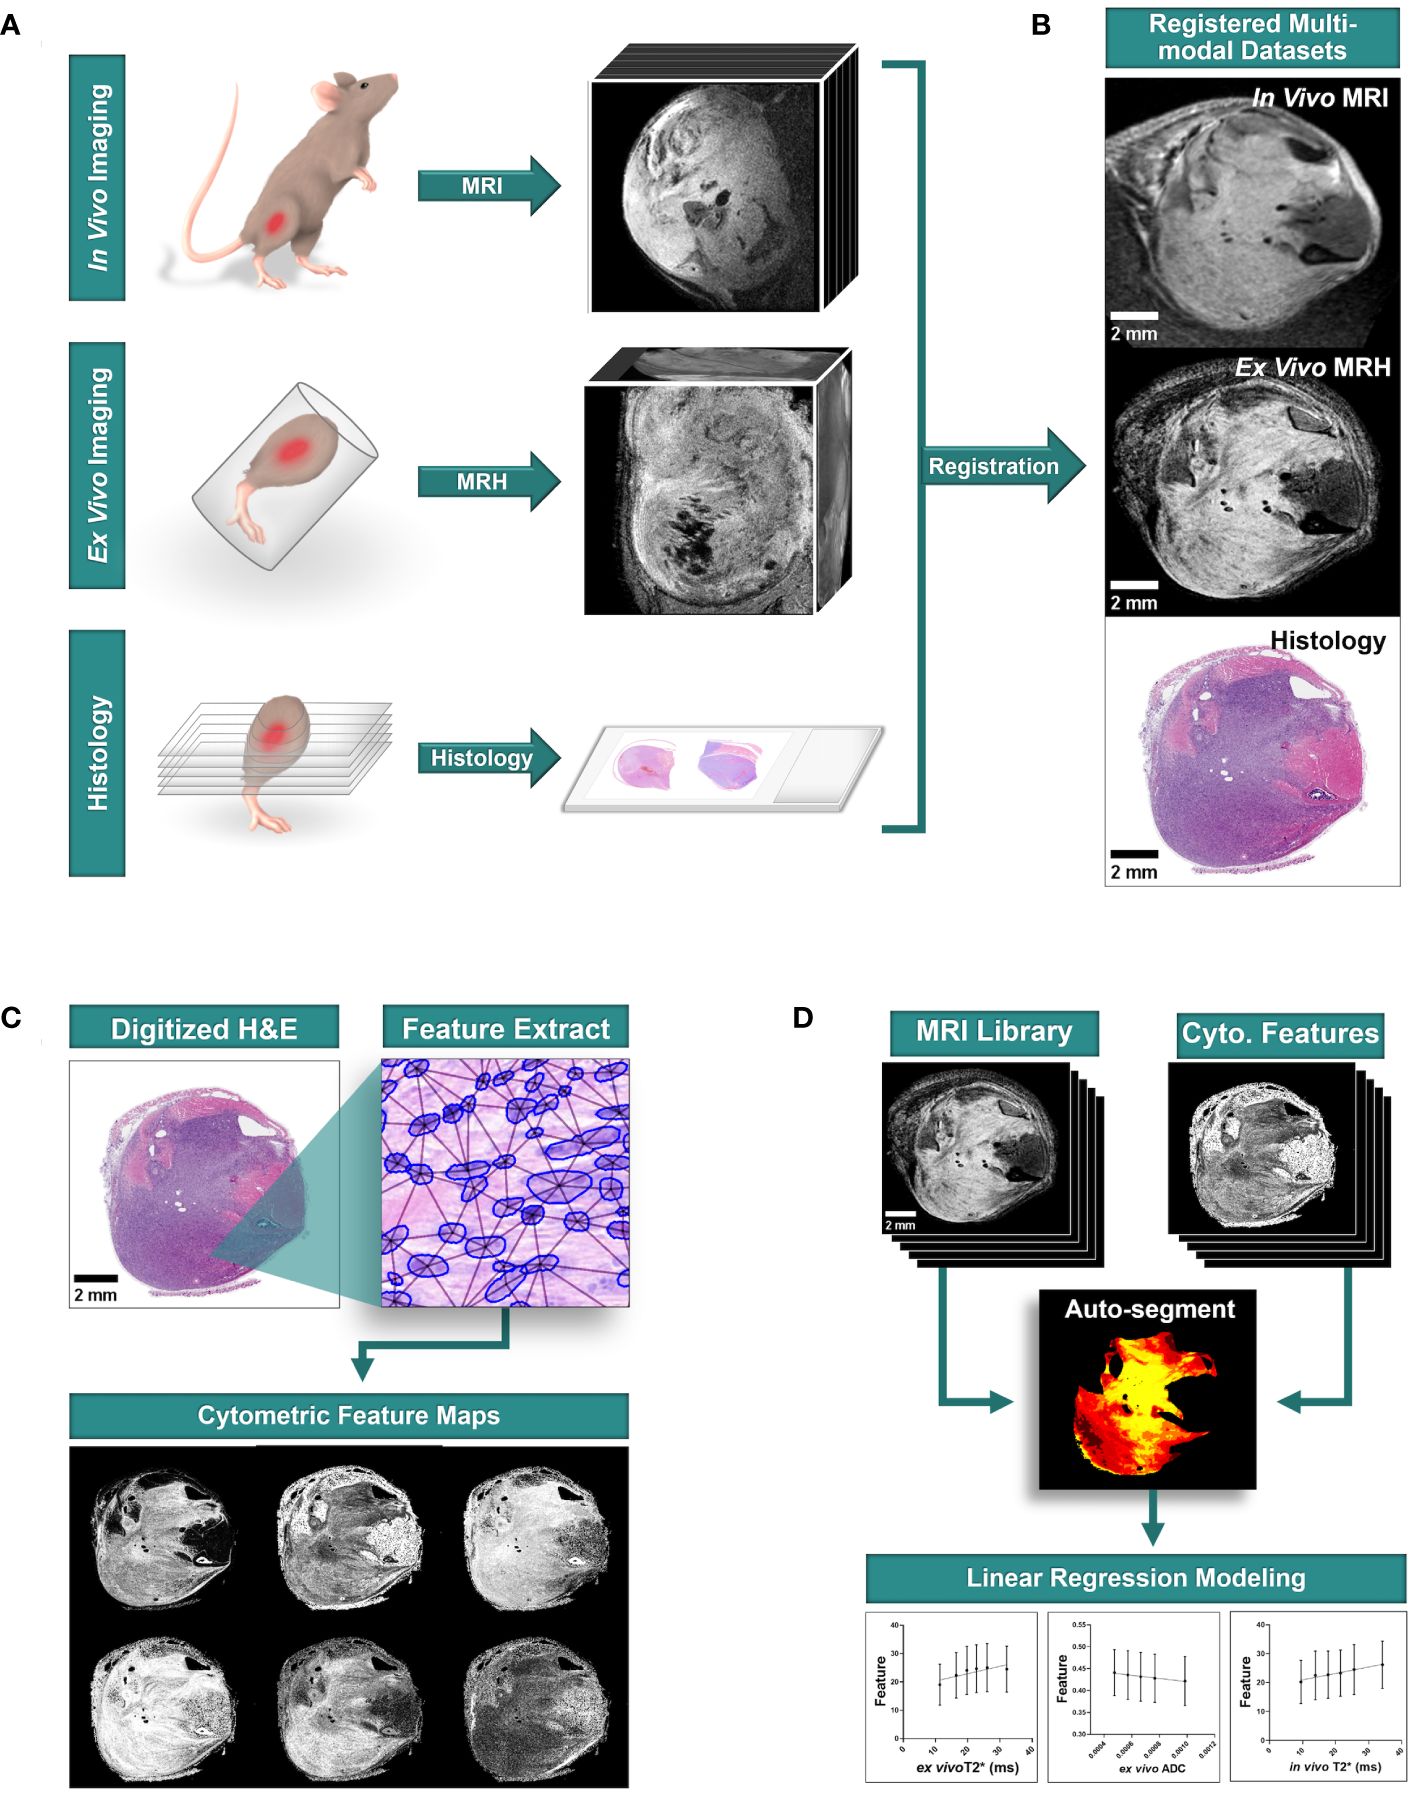
Figure 1 Multi-modal sarcoma imaging library registration and analysis workflow. Mouse models of UPS were imaged to construct registered imaging data libraries. (A) Tumors were imaged with MRI in vivo, and fixed tissues were imaged at high resolution with MRH before preparation for conventional histology with hematoxylin and eosin (H&E) staining. (B) Tumor imaging libraries were registered to histological sections. (C) Quantitative cytometric feature maps were generated from H&E-stained tumor cross sections. (D) Registered MR imaging datasets were compared to quantitative cytometrics intratumorally to probe for linear relationships between tumor features and MR signal. Scale bars = 2 mm.
In vivo MRI
In vivo MR images were acquired on a 7-T Biospec small-animal MRI scanner (Bruker, Billerica, MA). 2.5% atomized isoflurane in air was used to induce anesthesia, followed by maintenance at 1%-2%. Animals were imaged in the lateral recumbent position, with a four-element mouse brain coil secured over the tumor-bearing limb. The animals and surface coil were positioned on a custom 3D-printed bed with integrated tubing for circulation of warm water and equipment for active monitoring of breath rate and body temperature. Animal vitals were monitored through the duration of imaging. The unit was centered in a 72-mm diameter, actively decoupled linear volume coil for transmission. Acquisition was performed using ParaVision software, version 6.0.1 (Bruker). Images were exported in Digital Imaging and Communications in Medicine (DICOM) format. In vivo sequences included anatomic 2D, non-isotropic T1-weighted fast low-angle shot (FLASH), T2-weighted turbo rapid acquisition with relaxation enhancement (TurboRARE), spiral-trajectory diffusion-weighted imaging (DWI), and multigradient-recalled-echo (MGRE) sequences. Sequences were selected according to the small animal imaging protocols developed during the companion co-clinical imaging study of soft tissue sarcomas (NCI U24 CA220245), and were originally designed to mimic the clinical protocols on study. Basic scanning parameters are described in Table 1. Total acquisition time per animal was less than 90 minutes.
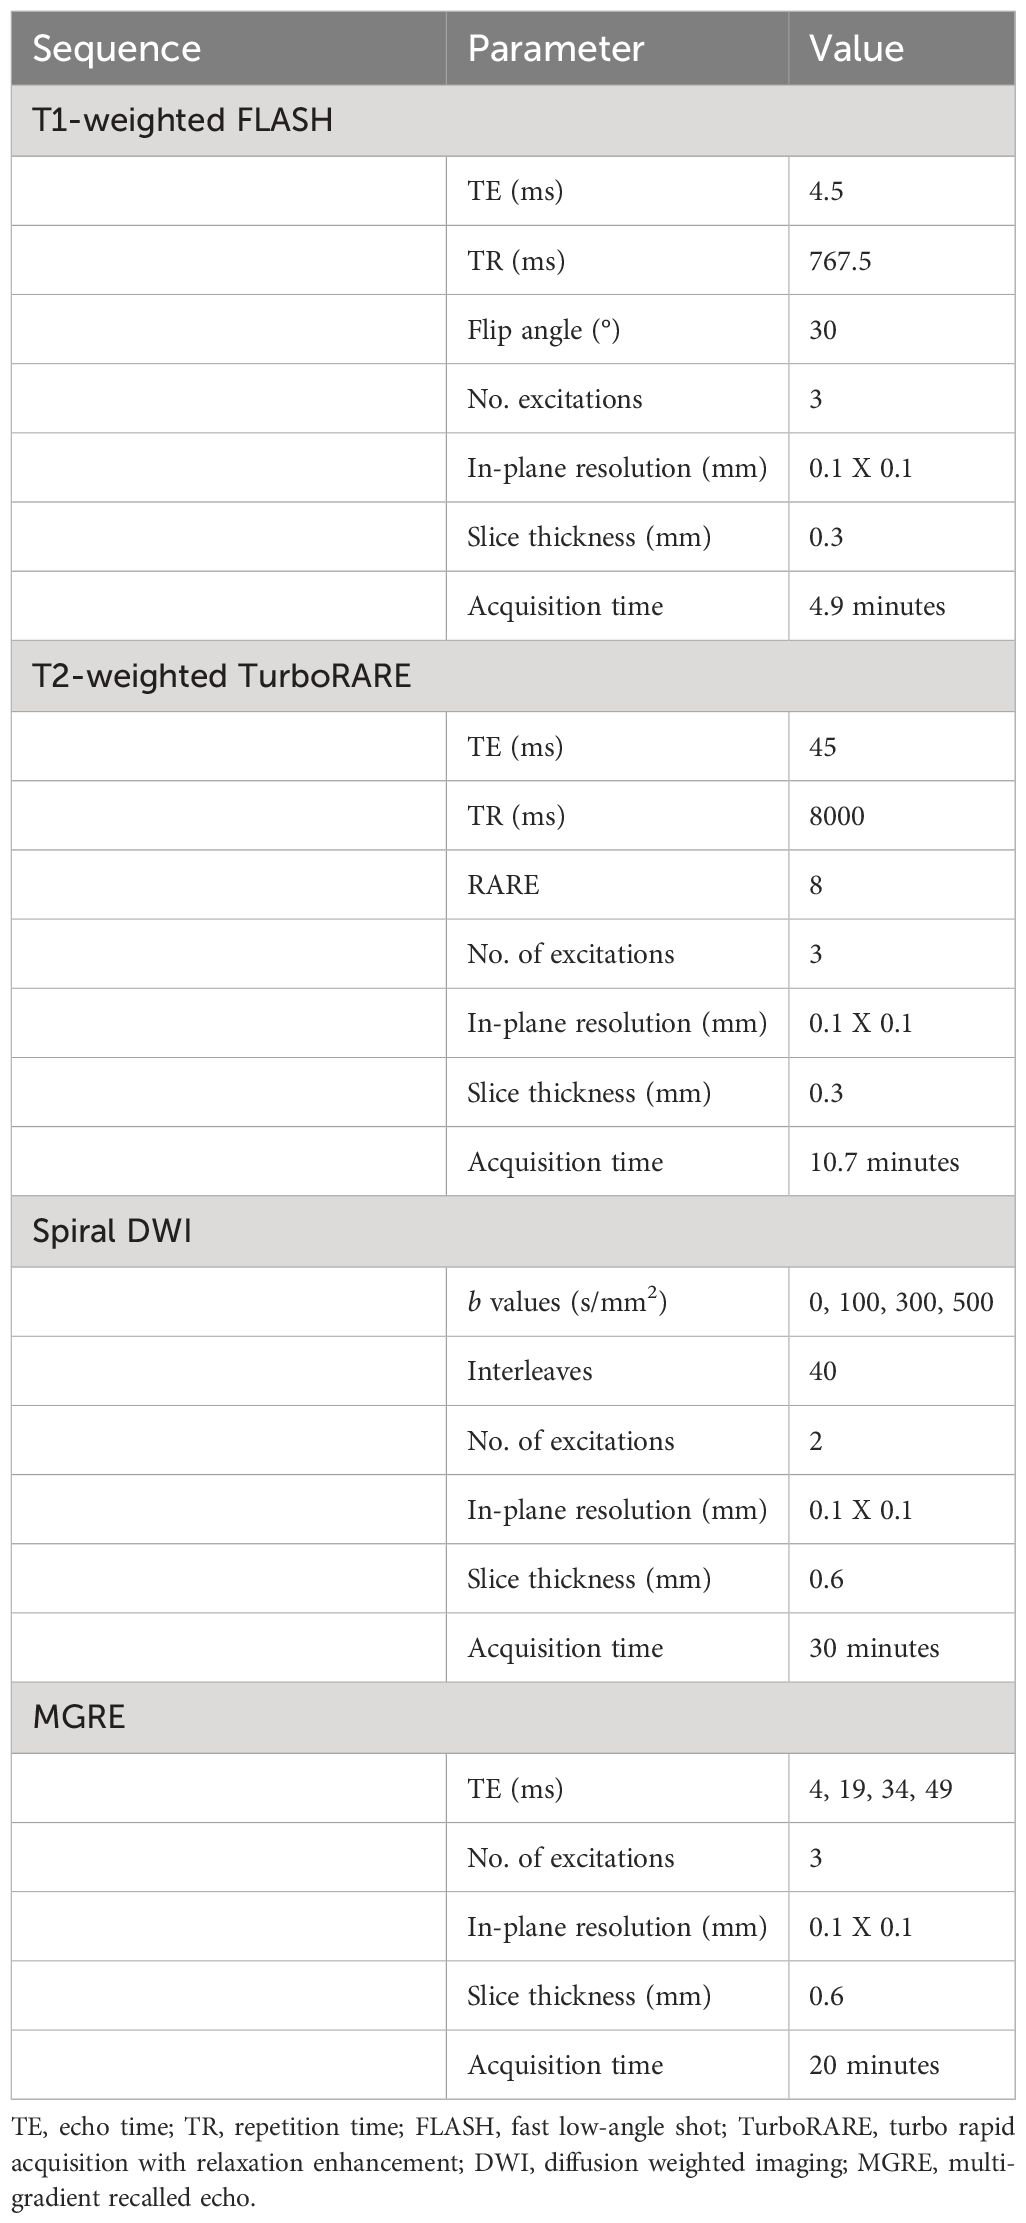
Table 1 Imaging Parameters for in vivo MR in preclinical soft tissue sarcomas.
Ex vivo MR histology
Following in vivo imaging experiments, animals were euthanized according to Institutional Animal Care and Use Committee humane practices guidelines. Tissues were enhanced for MRH with contrast agents using previously described methods (19–21). Transcardial perfusion was performed with a 1:10 mixture of ProHance (Bracco Diagnostics, Princeton, NJ) in formalin. Fixation with a 1:10 mixture of ProHance and buffered formalin reduces the T1 by more than six-fold in most mouse tissues. This permits the use of a 3D spin echo sequence, minimizing geometric distortions with a short TR providing the signal averaging inherent in 3D spin warp encoding without excessive acquisition times. At TR=50 ms, the SNR is more than 5 times greater in the actively stained tissue than in a formalin-fixed specimen (19). T1s in the specimens in this study were typically ~ 100 ms. The resulting gain in SNR allows us to achieve spatial resolution of 35 um with scan times of ~ 8 hrs which would not be possible with unstained specimens. Tumor-bearing limbs were then resected and immersed in the ProHance/formalin and kept at 4°C. 24 hours after resection, specimens were transferred to a 1:200 mixture of ProHance in phosphate buffered saline to rehydrate tissues one week prior to ex vivo MRH.
Specimen imaging was performed on a 7-T horizontal bore magnet with high-performance Resonance Research gradient coils (2500 mT/m peak) controlled by an Agilent Direct Drive console (Agilent Technologies). High sensitivity was achieved using an in-house built solenoid resonator. Tissues were immersed in fomblin (Sigma-Aldrich) to reduce surface susceptibility artifacts. 3D DWI and MGRE sequences were acquired at 35 µm isotropic resolution using compressed sensing with an acceleration of 8X. DWI was performed using a 3D Stejskal-Tanner sequence. Phase-encoding was sparsely sampled in two dimensions using probabilistic methods (21–23). The data was fully sampled in the readout direction. A script running on the Agilent console automated each acquisition by launching the sequence and writing the data to a local file. At the conclusion of that acquisition, the file was automatically written to a remote disc on a high-performance Dell cluster. The script launched the reconstruction program on the cluster which started with a Fourier Transform along the fully sampled readout dimension. This produced a large collection of undersampled 2D images which were distributed to multiple nodes of the cluster for iterative reconstruction using the BART reconstruction tool box (https://mrirecon.github.io/bart/). DWI and MGRE sequences were selected to ensure that qMRI parameters (ADC and T2*) were available to complement in vivo qMRI measurements. DWI and MGRE sequence parameters were calibrated to ensure adequate SNR at high resolution in fixed tissues in the shortest reasonable scan time. Total acquisition time was approximately 8 hours per sample. The basic scanning parameters are included in Table 2.
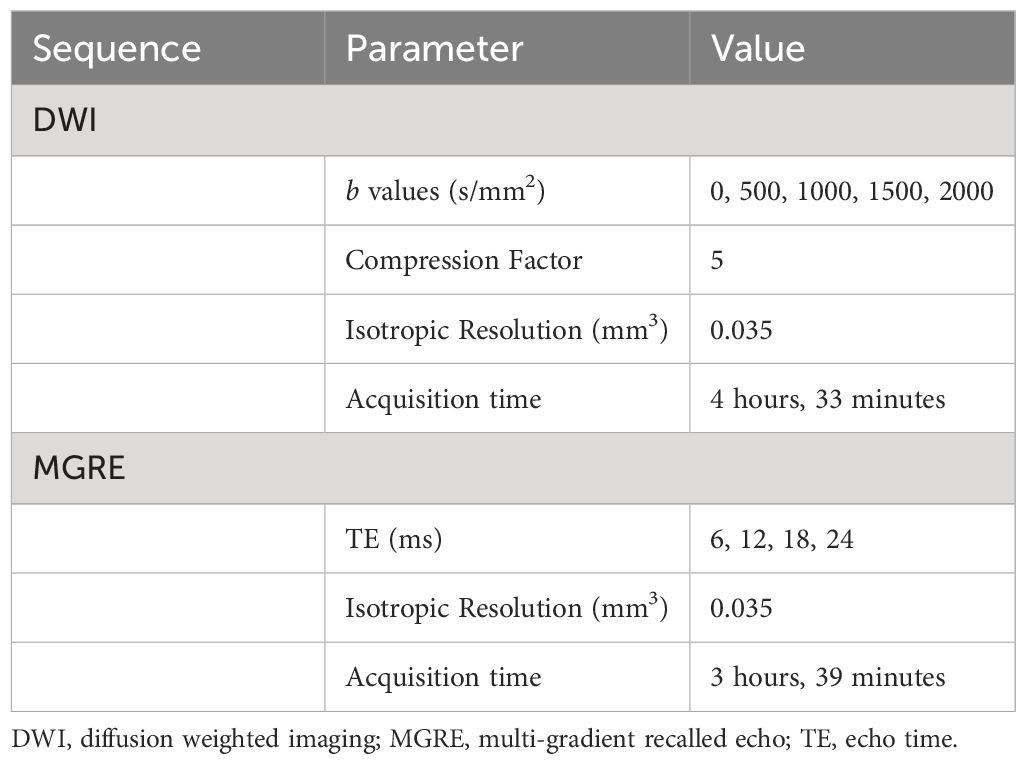
Table 2 Imaging Parameters for ex vivo MR in preclinical soft tissue sarcomas.
Histological preparation
Following MRH, tumor-bearing limbs were decalcified in 14% ethylenediaminetetraacetic acid for 14 days to allow tissue preparation with intact bone. Tissues were stored in 70% ethanol, and gross sections were trimmed to tissue cassettes at 2-3 levels along the tibia/fibula prior to embedding in paraffin. 6 μm sections were cut from each level and stained with hematoxylin and eosin (H&E). Stained slides were scanned at 40X on an Aperio AT2 whole-slide scanner (Leica Biosystems, Buffalo Grove, IL), and data were stored in SVS format. The result was digitized H&E images of tumor-bearing limb cross sections at 2-3 levels for each specimen.
Multi-modal image registration
For subsequent analysis of imaging libraries, 3D in vivo MRI and subsequent ex vivo MRH were registered together. After tissues were processed for pathology, 3D MR datasets were then registered to 2D digitized histology slides. Image registration was performed using 3D Slicer (https://www.slicer.org/), an open-source platform for image analysis, as described previously (18). Briefly, in vivo images were registered to MRH images through a series of linear (rigid) and landmarks-based (non-rigid) transformations. Ex vivo MRH images were registered to digitized histology via linear transformation and 2D slice selection, followed by landmarks based non-rigid transformation. The high resolution of MRH facilitates registration of multi-modal imaging datasets, as meso- and micro-scale structures are resolved. The resulting transformation was applied to all MRH-registered in vivo images. The result was a series of histology-registered MR images which included in vivo T1- and T2-weighted images, DWI, MGRE, and DTI, as well as ex vivo DWI and MGRE (Figure 2). In addition, apparent diffusion coefficient (ADC) and T2 star (T2*) qMRI maps were calculated for all DWI and MGRE image series, respectively.
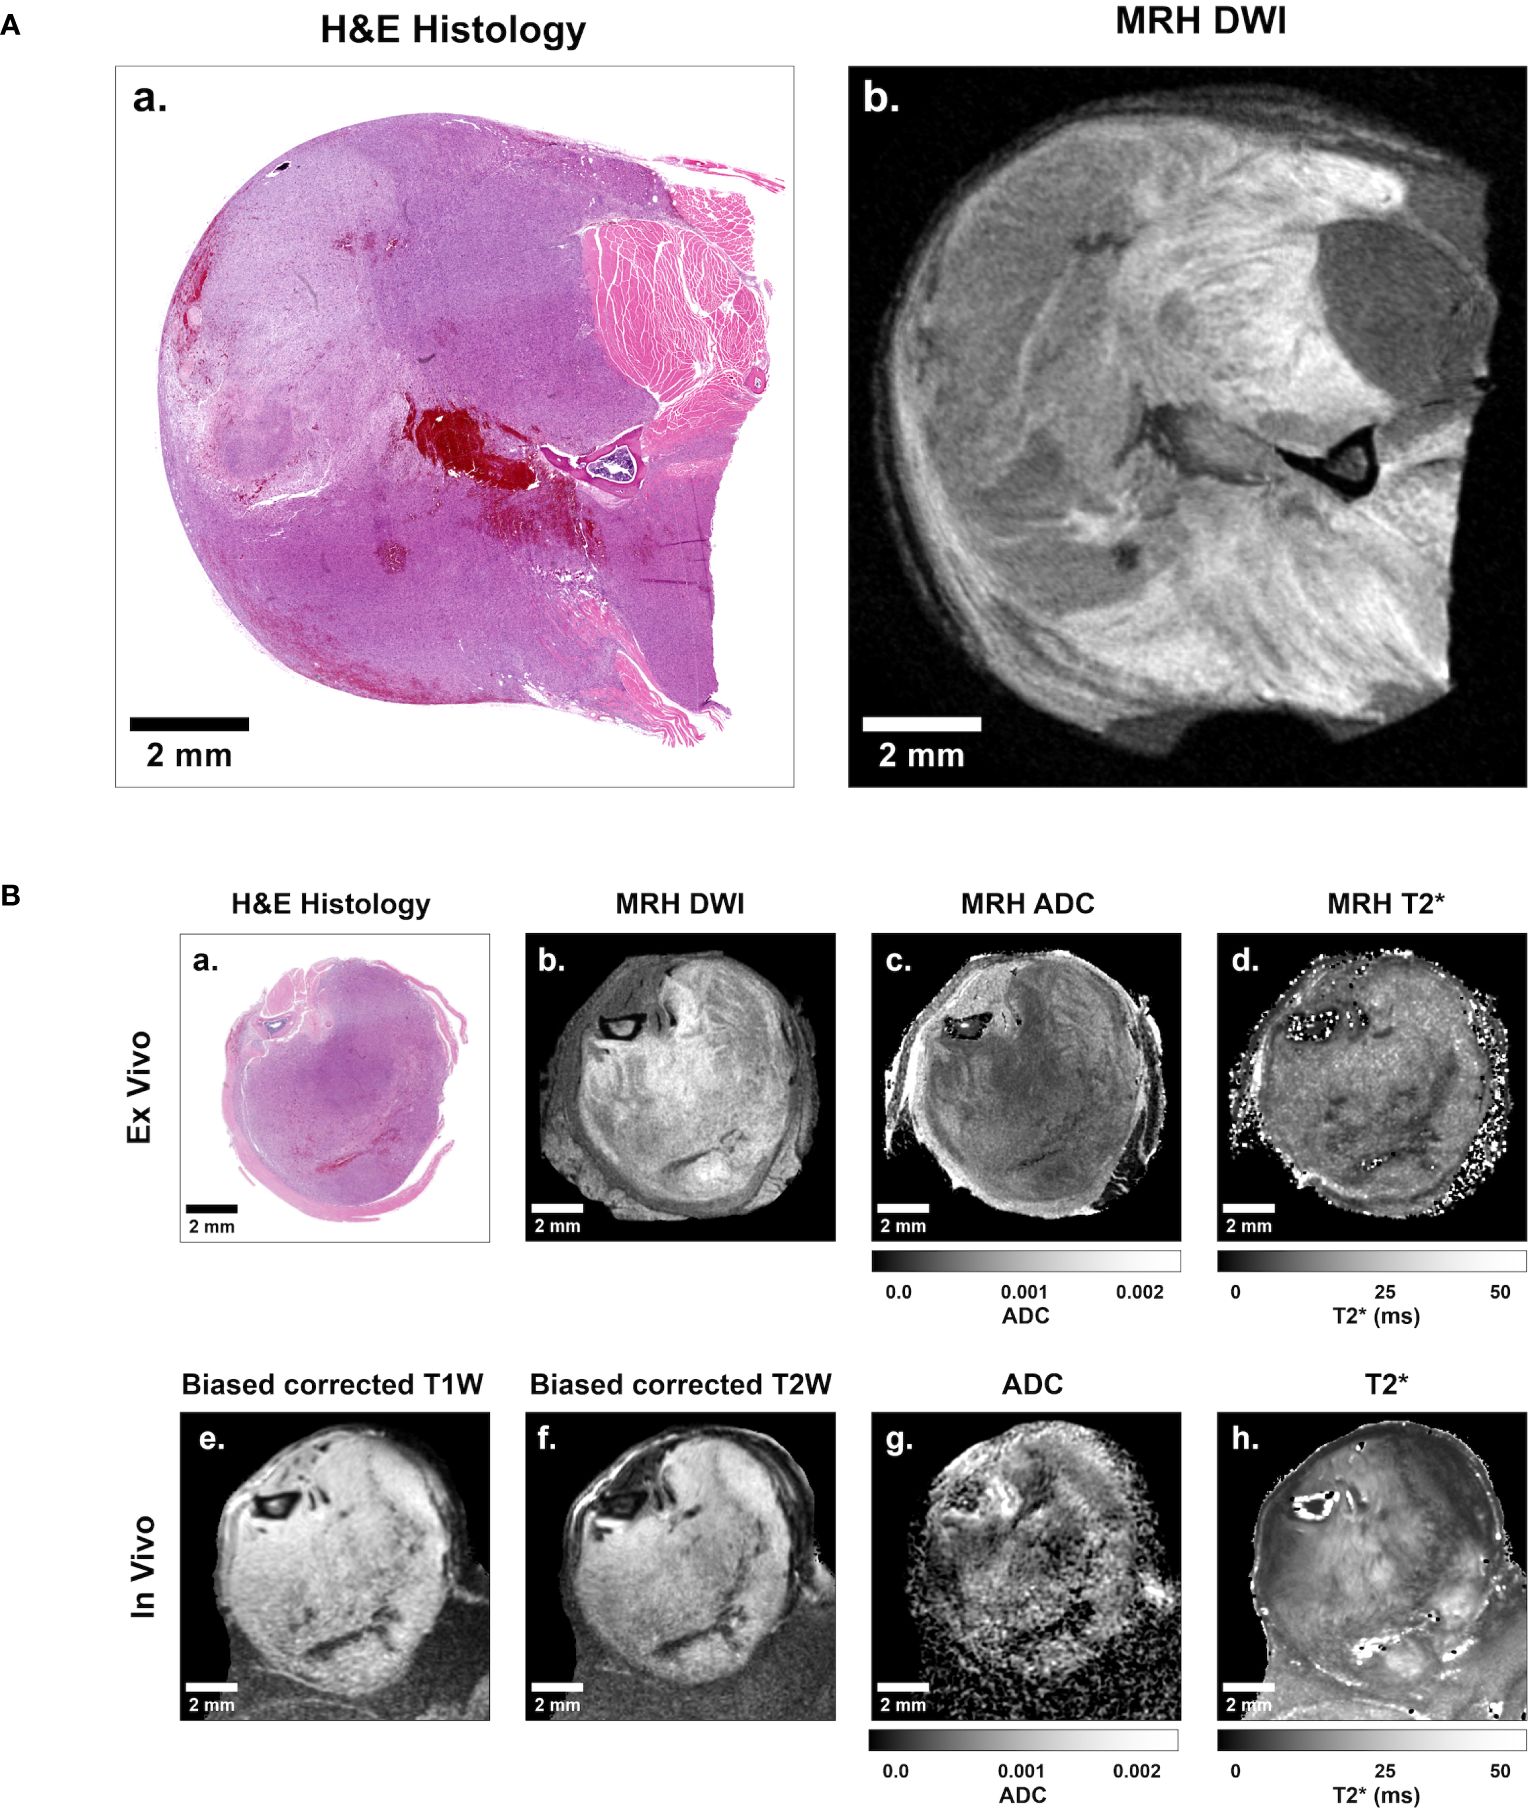
Figure 2 Representative sarcoma imaging library including multi-contrast, multi-resolution MR datasets registered to digitized 2D histological slides. (A) Shown is a sample of a digitized 2D histology image (left) with a registered 35 μm isotropic MRH diffusion-weighted image (right). (B) The complete imaging suite gathered for each sarcoma-bearing animal included registered ex vivo histology (B.a), diffusion-weighted MRH (B.b), MRH apparent diffusion coefficient (ADC) maps (B.c), MRH T2* maps (B.d), as well as in vivo bias corrected anatomical T1-weighted (B.e) and T2-weighted (B.f) images, ADC maps (B.g), and T2* maps (B.h). Scale bars = 2 mm.
Registration success was quantified by comparing tumor segmentations. Binary images defined via semi-automated tumor segmentation in MR (24) and histological images were compared post-registration transformation as described previously (18). Dice similarity coefficients (DSC) were calculated to measure registration success, with a minimum DSC cutoff of 0.8 required for study inclusion.
Cytometric feature mapping
To generate quantitative cytometric feature maps, automated nuclear segmentation was performed on digitized H&E images using the StarDist plugin for FIJI as described previously (25, 26). 30 features broadly divided into four categories were measured for each nucleus: Topology, Delaunay triangulation distance, nuclear stain Haralick features, and stain intensity features. Nuclei were sorted into 35 μm pixels to match the registered MRH resolution, and mean and variance of features were measured for each pixel. In addition, we measured how many cells were detected in each pixel to generate density maps. The result was a library of 61 cytometric feature maps for each H&E slide, which were quantitative and spatially matched to the registered MR images.
Image analysis
All correlative studies were performed using qMRI calculated diffusion coefficient and T2* maps derived from acquired MR data. Specifically, ADC was derived by exponential fitting of intensity across a range of b values, and T2* was calculated via exponential fitting of intensity from the series of echoes in MGRE. The resulting qMRI parameters are referred to as ADC and T2*, respectively, and were available for both in vivo and ex vivo data. The methods for automated segmentation and measurement of registered MR/pathology datasets were described in detail previously (18, 24). Briefly, normalized curves of ADC and T2* distribution among the entire cohort were calculated for both in vivo and ex vivo data. 6 bins were determined for each qMRI curve (ADC and T2*) with equal area under the curve, with boundaries at ± 2 standard deviations. These bins were used to automatically segment regions of differing qMRI values in histology-registered ADC and T2* images. The regions of interest were automatically measured in all 61 cytometric feature maps derived from registered histology slides. The results were cytometric feature measurements evaluated in regions of incrementally increasing ADC and T2*.
Measured features were plotted as a function of ADC or T2* for linear regression analysis. Where multiple slides were available per animal, the measured cytometric-to-MRH relationships were averaged on a per-animal basis prior to group analysis, as described previously (18, 25, 26). This ensured that the number of available slides for each subject did not impact the group analysis. Mean animal values for each cytometric feature were plotted for the cohort as a function of four qMRI parameters: ex vivo ADC, ex vivo T2*, in vivo ADC, and in vivo T2*. Tissue features which demonstrated significant non-zero relationships when plotted as a linear function of qMRI, after correction for multiple comparisons, were identified as potential contributors to qMRI in heterogeneous sarcomas.
Statistical analysis
Statistical analyses were performed using Prism (version 9.00 for Windows; GraphPad Software, San Diego, CA). The pilot sample size was chosen based on previous MRH pilot studies, in which individual tumor specimens demonstrated significant linear relationships between measured cytometric features and qMRI (p<0.05, R2>0.9, Pearson’s r>0.9). Sample size (n=7) was calculated to achieve statistical power (1- β) of 0.8, when α=0.05 and r=0.9, with a loss of n=1 incorporated to account for any errors in registration or imaging complications. The resulting pilot study was carried out with n=8. Linear regression analysis was performed for group data comparing each cytometric feature with four qMRI parameters, and p-values describing the significance of non-zero relationships were reported, as well as R2 goodness of fit. For each MR sequence, correction for multiple comparisons was performed using the Benjamini-Hochberg method. Features of interest were identified as regressions with slopes that statistically deviated from zero (P <.05) after correction for multiple comparisons.
Results
Multiple tumor cytometric features correlate linearly with MR signal in a cohort of murine soft tissue sarcomas
We successfully registered all MR images in this cohort to their corresponding histology slides, with a mean DSC of 0.944 for ex vivo MRH to histology, and a mean DSC of 0.930 for in vivo MRI to histology. Detailed metrics of registration success are provided for each specimen in Supplementary Table 1. Just as we have shown previously (18), we demonstrated linear relationships between intratumoral qMRI and cytometric features in individual registered datasets of preclinical soft tissue sarcomas (Figure 3). These relationships were often consistent in both the ex vivo and in vivo analyses for a given tissue (Figures 3C, D). However, due to improvements in tissue processing and histological data consistency, we were able to expand these experiments for cohort analysis (n = 8).
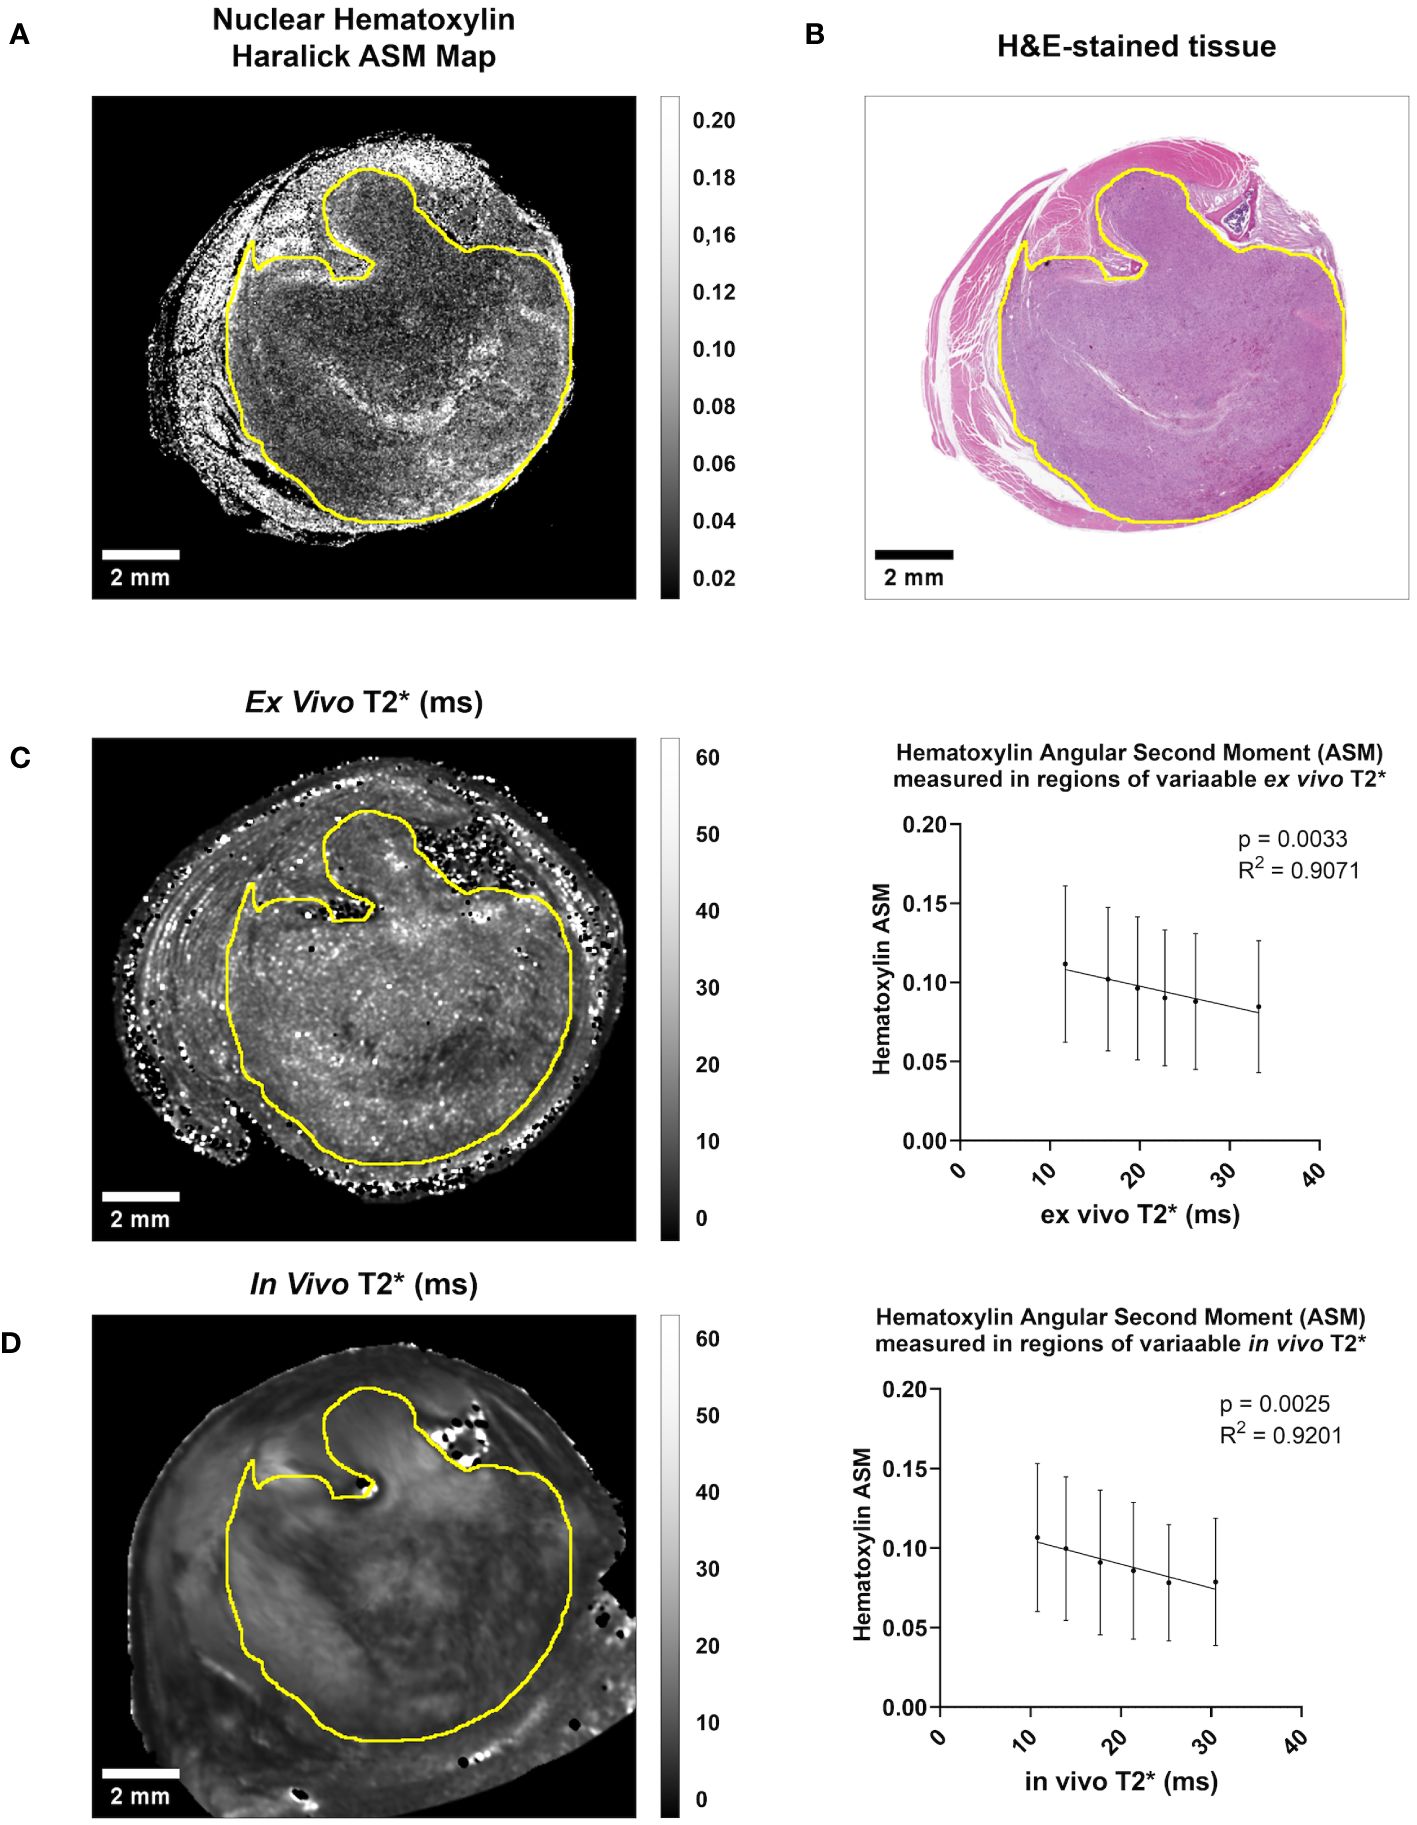
Figure 3 Both in vivo and ex vivo T2* demonstrate significant linear relationships with Hematoxylin Haralick Angular Second Moment (ASM) at the intratumoral level in murine soft tissue sarcomas. (A) A map of nuclear texture feature Haralick ASM was derived from an H&E-stained cross-section (B) of a soft tissue sarcoma of the hind limb. Within the tumor boundary (yellow line) Nuclear Haralick ASM demonstrated a significant linear relationship with ex vivo T2* in this sample (C). This trend was also seen when comparing Nuclear Haralick ASM to in vivo T2* imaging in this sample (D). Plotted are mean and SD Nuclear Haralick ASM in regions of variable T2*, and p-value and R2 values are included. Scale bar = 2 mm.
After correcting for multiple comparisons, we found that a subset of cytometric features correlated significantly with qMRI in the group data, including in vivo and ex vivo qMRI. Significant non-zero relationships between quantitative cytometric measurements plotted as a linear function of qMRI measurements are described in Table 3. Somewhat surprisingly, only three features out of 61 correlated with ex vivo ADC, and no features correlated with in vivo ADC. Complete summary tables describing the corrected p-values for all cytometric features compared to ex vivo and in vivo ADC are provided in Supplementary Table 2 and Supplementary Table 3, respectively. Interestingly, six features demonstrated significant linear relationships with ex vivo T2*, and fifteen features correlated significantly with in vivo T2*. Complete summary tables describing the corrected p-values for all cytometric features compared to ex vivo and in vivo T2* are provided in Supplementary Table 4 and Supplementary Table 5, respectively. In both cases, nuclear Haralick texture features were the most prevalent type of feature correlated with T2*.
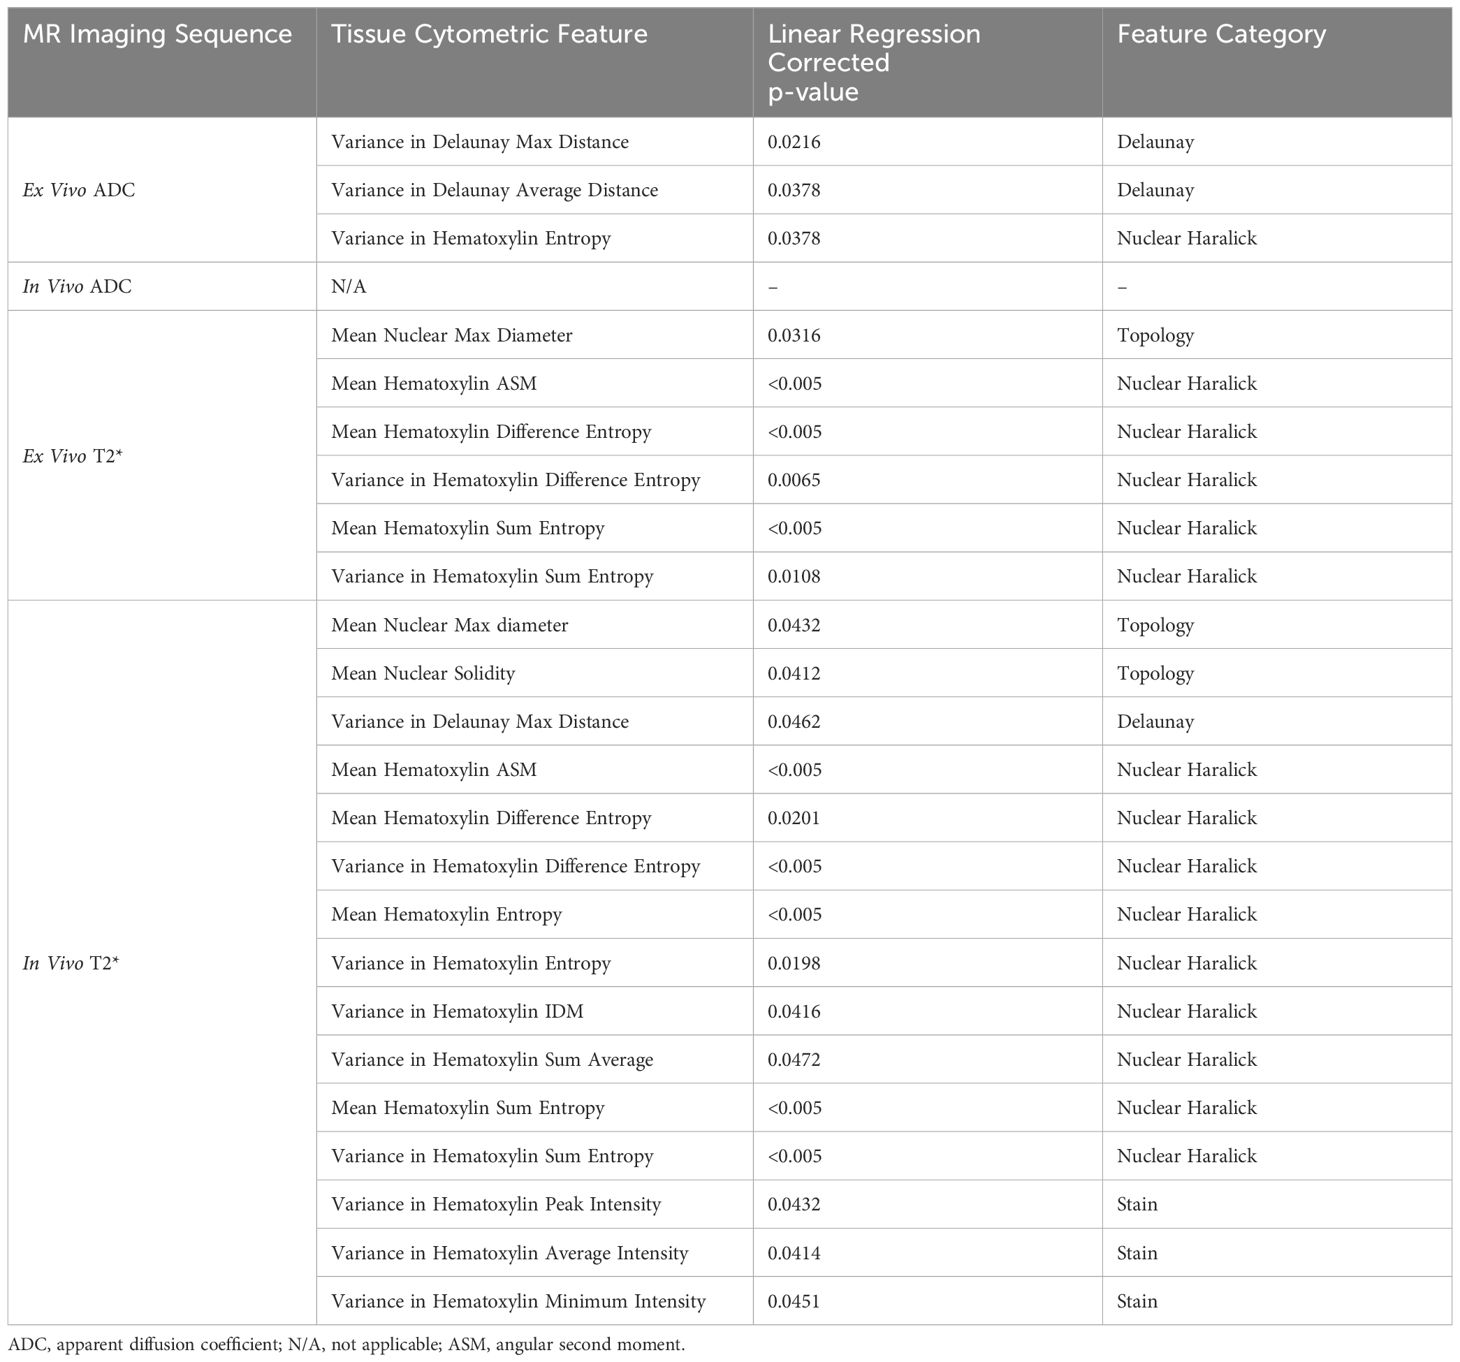
Table 3 Cytometric features demonstrating significantly non-zero linear relationships with quantitative in vivo and ex vivo MR signal in soft tissue sarcomas (n = 8) after correction for multiple comparisons.
T2* correlated significantly with nuclear texture and topology features in both in vivo MRI and ex vivo MRH
In both ex vivo and in vivo images, multiple cytometric features related to nuclear Haralick texture correlated significantly with T2*. For example, mean Haralick hematoxylin Angular Second Moment (ASM) exhibited a significant inverse linear correlation with ex vivo T2* (corr. p<0.005) and in vivo T2* (corr. p<0.005) (Figures 4A, B). Haralick ASM is a measure of homogeneity among grey level intensities in the measured pixels, in this case, within a nucleus stained by hematoxylin (27, 28). This is visibly evident on the pathology slide, with increased ASM demonstrating higher stain homogeneity within the nuclear boundary, and lower ASM values measured in nuclei with high stain variance, which occurs with heterogeneous chromatin structure or prominent nucleoli (Figure 4C). Other examples of Haralick features correlating with ex vivo and in vivo T2* include mean hematoxylin difference entropy (ex vivo, corr. p<0.005; in vivo corr. p=0.0201), variance in hematoxylin difference entropy (ex vivo, corr. p=0.0065; in vivo corr. p<0.005), mean hematoxylin sum entropy (ex vivo, corr. p<0.005; in vivo corr. p<0.005), and variance in hematoxylin sum entropy (ex vivo, corr. p<0.005; in vivo corr. p<0.005).
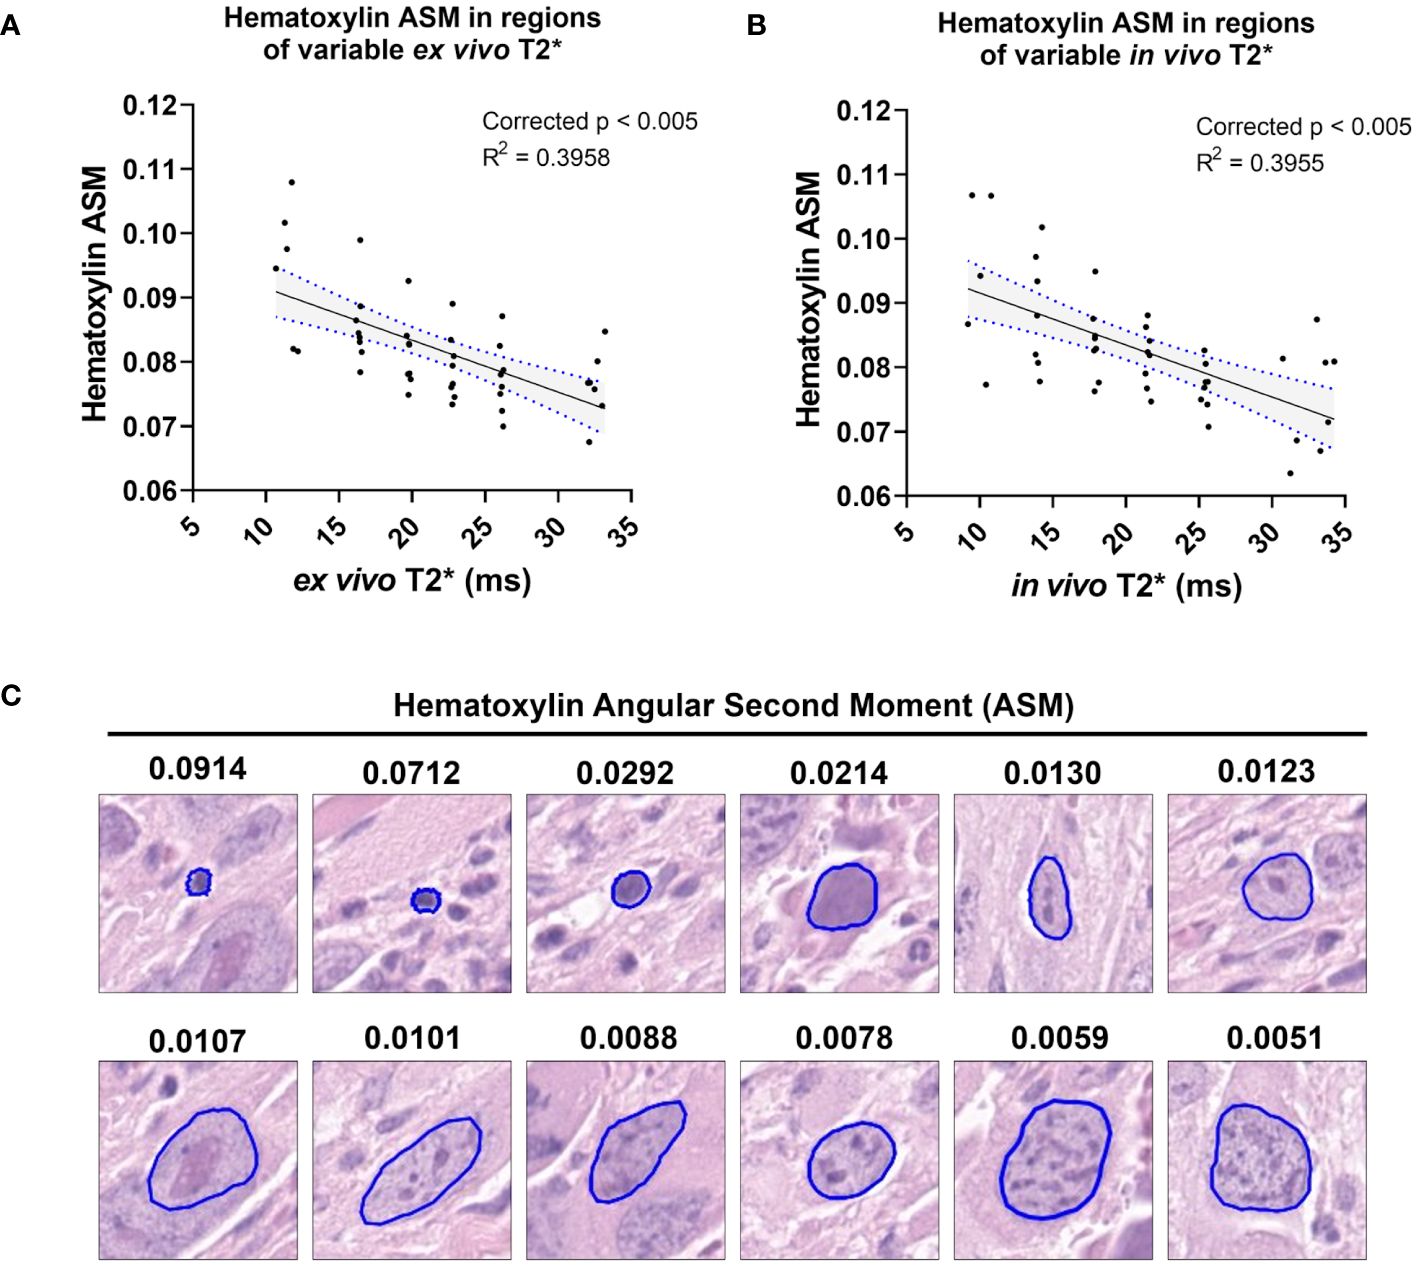
Figure 4 T2* correlates with a measure of nuclear stain texture, nuclear Haralick Angular Second Moment (ASM), in both ex vivo and in vivo MR. Among the cohort of soft tissue sarcomas (n = 8), regions of variable ex vivo T2* demonstrated a significant linear relationship with nuclear hematoxylin Haralick ASM (A). The same trend was observed in vivo among the same cohort (B). Regression lines are plotted in black, with 95% CI represented with blue dotted lines and shading. Corrected p-values and R2 values are provided for reference. Nuclear hematoxylin Haralick ASM is a measure of textural homogeneity, with high values corresponding to greater uniformity in intranuclear staining (C). Nuclear Haralick ASM is also related to size, as shown in representative nuclei with variable ASM values. Pathology images are 25 µm2 tiles, with nuclear segmentations outlined in blue.
A small group of nuclear topology features correlated with one or both T2* sequences. In vivo T2* showed a positive correlation with nuclear maximum diameter (corr. p=0.0432), a measure of nuclear size (Figures 5A, B). This correlation was also seen with ex vivo T2* (corr. p=0.0316). Differences in nuclear size are common in human UPS. Also correlating with in vivo T2* was mean nuclear solidity (corr. p=0.0412; Figure 5C), which measures irregularity of nuclear shape by calculating the difference between the measured area and the convex perimeter (Figure 5D). Interestingly, while significant correlations between T2* and nuclear topology features were limited, positive linear trends were noted between both T2* contrasts and measures of nuclear size (Figure 6). Along with significant positive linear correlations with nuclear maximum diameter, non-significant positive correlations were also seen with nuclear area (ex vivo corr. p=0.3372; in vivo corr. p=0.2666) and minimum nuclear diameter (ex vivo corr. p=0.2068; in vivo corr. p=0.1932). In each case, data from a single tumor diminished the goodness of fit, thus extinguishing statistical significance. For all nuclear size features, data from the same tumor was visibly separable from the rest of the cohort. This tumor showed consistently larger nuclear sizes compared to other mice in the cohort. The source of this difference in nuclear size is unknown. However, the positive correlation between T2* and nuclear size metrics was still observed in this tumor. Taken together, these observations suggest that nuclear size may play a considerable role in the T2* measured in these murine soft tissue sarcomas.
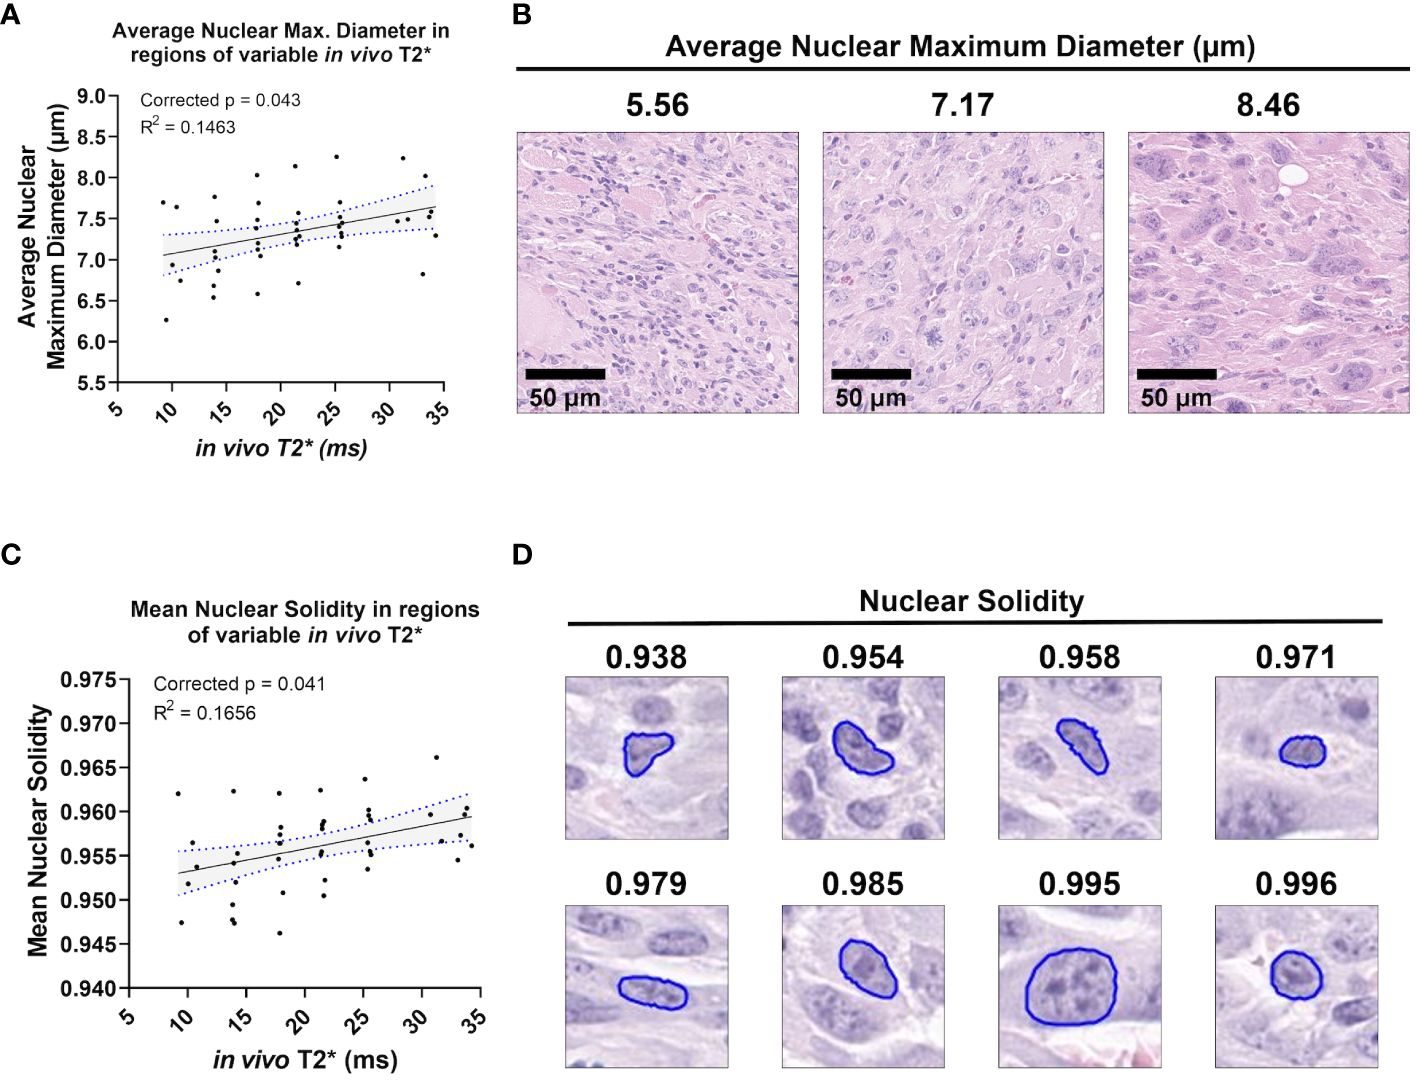
Figure 5 In vivo T2* correlates with nuclear topology metrics. Among the cohort of soft tissue sarcomas (n = 8), regions of variable in vivo T2* signal demonstrated significant linear relationships with average nuclear maximum diameter (A), a direct measure of nuclear size (B). In vivo T2* also correlated significantly with mean nuclear solidity (C). Nuclear solidity is a measure of how much the nuclear boundary deviates from a convex shape, with lower values correlating with greater irregularity (D). Scale bars = 100 µm.
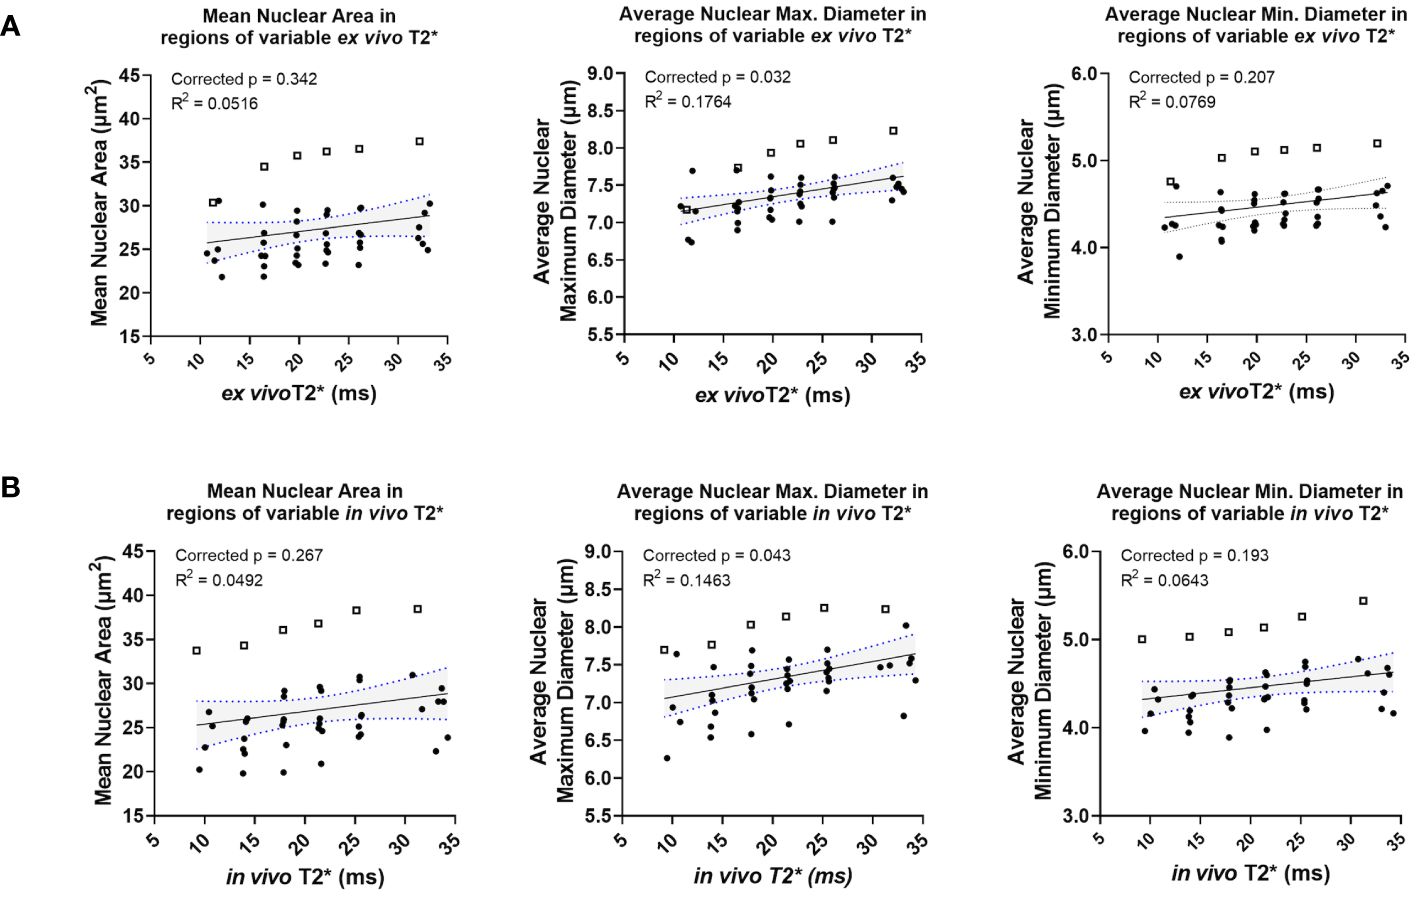
Figure 6 Ex vivo and in vivo T2* show positive correlations with nuclear size, including in a statistical outlier. Ex vivo T2* showed trends of positive correlation with nuclear size metrics, including mean nuclear area, average nuclear maximum diameter, and average nuclear minimum diameter (A). The same trends were seen with in vivo T2* and nuclear size metrics (B). In all cases, data from a single tumor (represented in each graph by open squares) exhibited larger nuclear size metrics overall relative to measurements made in all other tumors in the cohort (solid circles).
In vivo T2* correlated significantly with variance in nuclear stain intensity features
In addition to nuclear Haralick features and topology metrics, measures of hematoxylin stain intensity also correlated significantly with in vivo T2* (Figure 7). Specifically, the stain features correlating with in vivo T2* were variance metrics, including variance in hematoxylin peak intensity (corr. p=0.0432), variance in hematoxylin average intensity (corr. p=0.0414), and variance in hematoxylin minimum intensity (corr. p=0.0451). Important to note, variance metrics in this case refer to variance among neighboring cells in a 35 μm2 pixel. Unlike mean Haralick texture features, which measure intensity patterns within a nucleus, the calculated variance metrics measure differences among neighboring nuclei. In this case, a negative correlation between in vivo T2* and hematoxylin variance features suggests that higher T2* may be measured when neighboring cells have similar hematoxylin staining properties (Figure 7D).
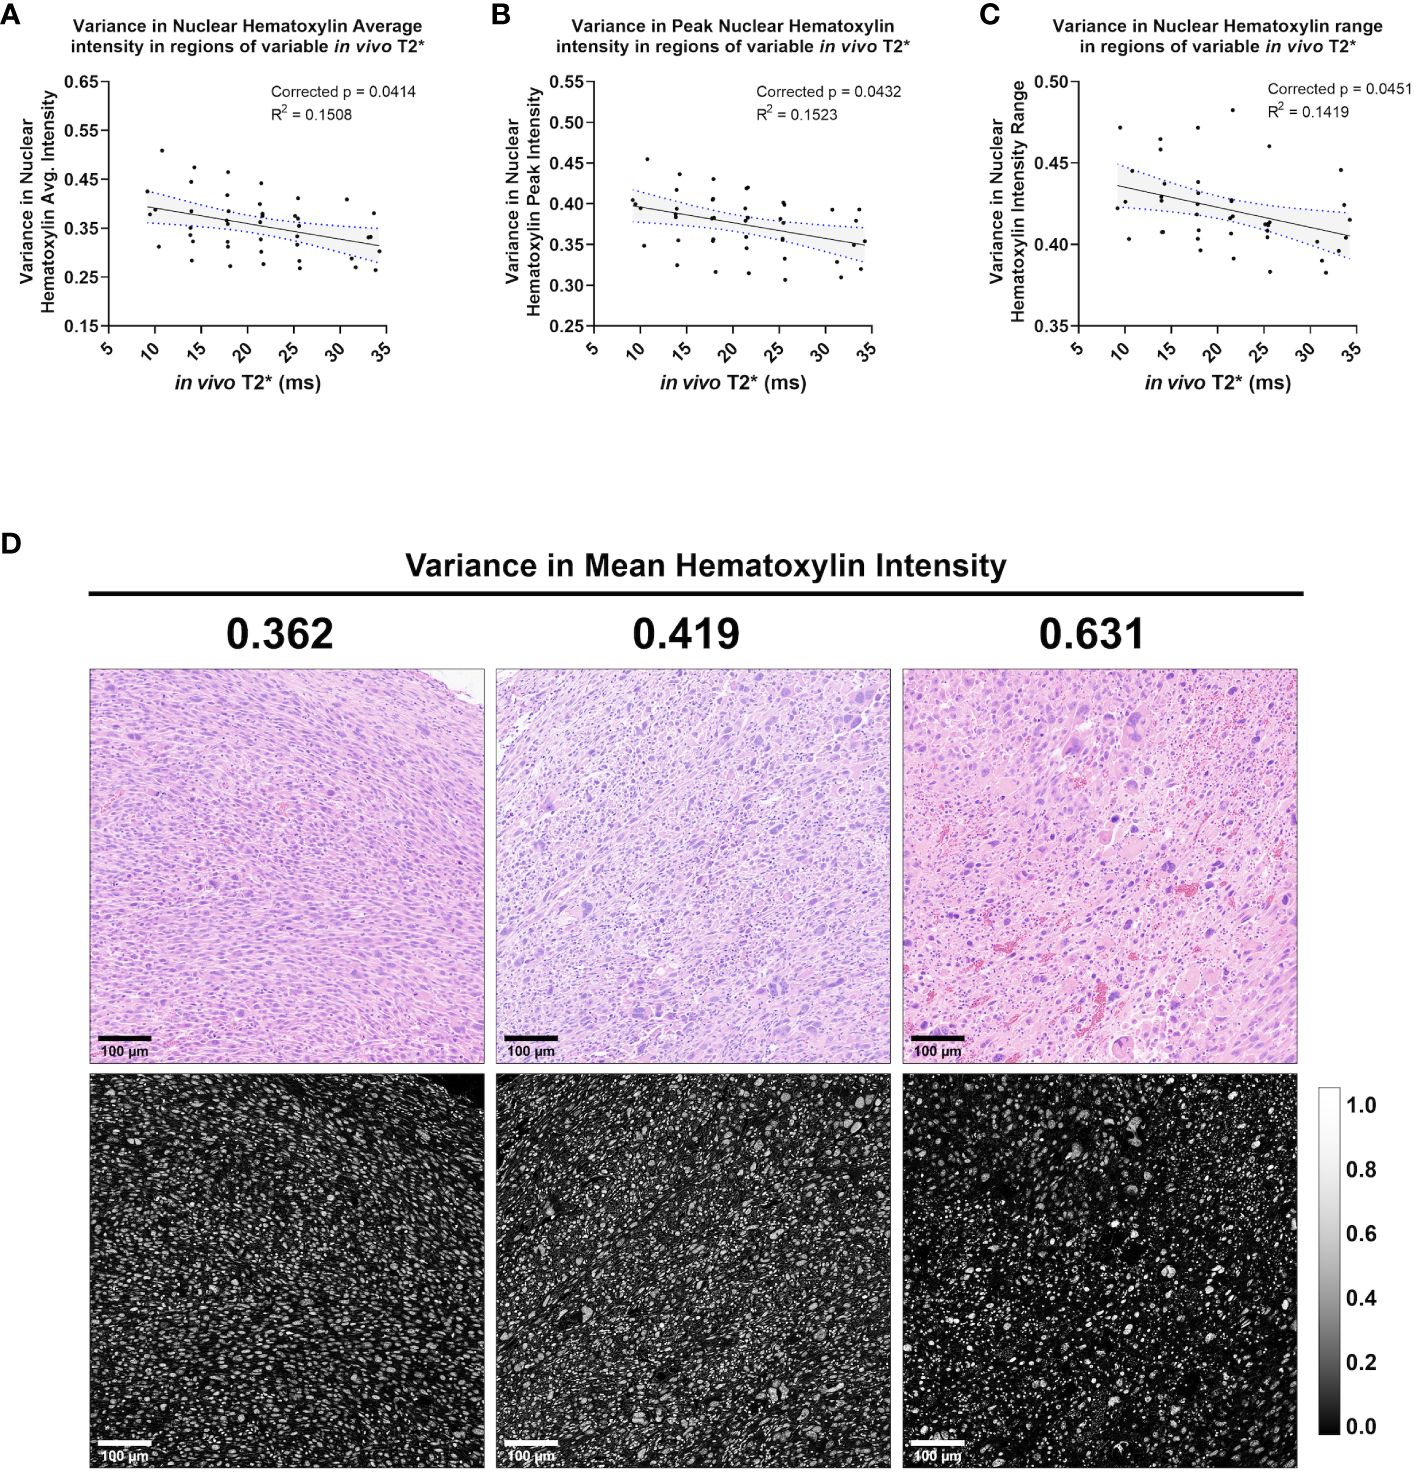
Figure 7 In vivo T2* correlates with three measures of variance in nuclear Hematoxylin stain intensity. Among the cohort of soft tissue sarcomas (n = 8), regions of variable in vivo T2* signal demonstrated significant linear relationship with variance in nuclear hematoxylin average intensity (A), variance in nuclear hematoxylin peak intensity (B), and variance in nuclear hematoxylin range (C). In each case, variance in hematoxylin intensity metrics showed an inverse correlation with in vivo T2*. Regression lines are plotted in black, with 95% CI represented with blue dotted lines and shading. Corrected p-values and R2 values are provided for reference. Variance in mean nuclear hematoxylin intensity is a measure of how a cell’s nuclear stain intensity varies from its local neighbors, with high values indicating more heterogeneous groups (C). Shown are representative tiles of H&E-stained soft tissue sarcomas with differing variance in nuclear mean hematoxylin intensity (top) and quantitative hematoxylin stain vector images (bottom) (D). Scale bars = 100 µm.
Ex vivo ADC correlated significantly with three measures of cytometric variance
While numerous cytometric features correlated with T2* in this preclinical sarcoma cohort, very few significant correlations were observed between cytometric features and ADC. No features demonstrated significantly non-zero linear relationships with in vivo ADC when corrected for multiple comparisons. When comparing cytometric features to ex vivo ADC, three features demonstrated a significant linear relationship: variance in Delaunay maximum distance (corr. p=0.0216), variance in Delaunay average distance (corr. p=0.0378), and variance in nuclear hematoxylin Haralick entropy (corr. p=0.0378). All three features are variance metrics, measuring variance among neighboring cells. Delaunay triangulation measures the distance between a cell and its nearest neighbors. Variance in Delaunay distances, which correlated positively with ex vivo ADC, measures the degree to which intercellular distances vary in local cell populations (Figure 8). Higher variance in Delaunay distances suggests greater heterogeneity in cell-to-cell distances, often demonstrated in highly pleomorphic regions of these soft tissue sarcomas (Figure 8C).

Figure 8 Ex vivo ADC correlates with two measures of Delaunay triangulation variance. Among the cohort of soft tissue sarcomas (n=8), regions of variable ex vivo ADC demonstrated a significant linear relationship with variance in Delaunay maximum distance (A) and Delaunay average distance (B). Regression lines are plotted in black, with 95% CI represented with blue dotted lines and shading. Corrected p-values and R2 values are provided for reference. Variance in Delaunay distances measures the heterogeneity of cell-to-cell distances within local populations, demonstrated visually in representative tiles comparing regions of increasing variance of Delaunay maximum distance in soft tissue sarcomas (C). Scale bars = 100 µm.
Discussion
UPS is one of the most aggressive subtypes of sarcoma, but is one of the most poorly categorized. Recent efforts to understand disease behavior have focused on genomic profiling (29), but clinical methods to aid decision making, such as radiological biomarkers, have remained elusive. In response to this deficiency, studies of qMRI parameters, including radiomic features, to predict UPS behavior and response to treatment are being explored with MRI (30). Despite efforts to understand or predict UPS behavior with MR imaging, the histological underpinnings of qMRI in UPS remain unresolved. Clinically, pathologist assessment is still the gold standard for prognostication in UPS, despite the challenge of adequate sampling posed by these heterogeneous and often large tumors. By providing a quantitative link between MR imaging signatures and tissue histology, we can empower the radiologist with histological insights as well as design better, more predictive imaging methods for UPS. To better understand the tissue histology underlying UPS qMRI, we utilized unique imaging libraries in a cohort of autochthonous soft tissue sarcomas in genetically engineered mice that resemble human UPS in both histologic appearance and gene expression. With these rich datasets that include in vivo and ex vivo MR images registered to tissue pathology slides, we identified significant linear relationships between quantitative MR and tumor cytometric features. In particular, we found a group of cytometric features, including nuclear texture and topology features, which correlated significantly with in vivo and ex vivo T2*. These studies represent the first of their kind to link qMRI and histological features quantitatively via tissue-registered imaging datasets in a preclinical cohort of UPS.
In this study, the majority of significant linear relationships between cytometric features and qMRI were identified in T2*, both ex vivo and in vivo. In both cases, nuclear Haralick features were predominant in correlating with T2*. Haralick features are calculated from the gray-level co-occurrence matrix (GLCM) of pixels or voxels within a region of interest (31). Unlike first order image statistics, Haralick features describe the spatial relationships, or “textures”, of normalized grayscale values (32). In the cytometric feature maps, the nuclear Haralick features were measured based on the hematoxylin stain vector, thus describing texture features within individual nuclei. Nuclear Haralick feature quantitation is sensitive to differences between uniformly-stained nuclei and nuclei with heterogeneous or unevenly distributed hematoxylin intensity. An example of this type of distinction would be heterochromatic versus euchromatic nuclei, both of which are seen in UPS (33). We identified linear relationships between T2* and multiple nuclear Haralick features, as well as with local variance in nuclear Haralick features. Nuclear pleomorphism is a hallmark of UPS, thus making T2* a potentially valuable imaging approach for understanding these tumors.
We also found a limited number of nuclear topological features, such as nuclear maximum diameter, which correlated significantly with T2*. Additional nuclear topology features, particularly those related to nuclear size, showed positive trends with T2*. Specifically, increased nuclear sizes were measured in regions with higher T2*. However, many of these linear relationships were not statistically significant due to the presence of single tumor. Although the positive relationships were measured in this tumor as well, the average size of the nuclei measured in this specimen was larger than the rest of the cohort. The cause of this discrepancy is unknown. When considering nuclear size as a possible correlate with T2* in these sarcomas, it is important to note that Haralick features can also be affected by the size of the region in which they are calculated (28, 34). In this case, the Haralick features would be inherently related to nuclear size. Taken together, despite the presence of a single tumor with excessive influence on this dataset, trends between nuclear size metrics and T2* warrant further exploration.
In observing the histology slides, we speculate that the origins of the correlations between cytometric features and T2* arise from differences in cytoarchitecture, size and distribution. Early NMR studies of the relaxation properties of tissues determined that many tissues have multicomponent T1, T2 (35, 36). R2*, i.e. the rate of decay, is the sum of the rates from all the mechanisms contributing to loss of coherence—molecular, imaging gradients, exchange effects and diffusion. Majumdar and Gore demonstrated that diffusion through susceptibility induced gradients would reduce the transverse relaxation time (37). While our data do not definitively support this mechanism, they are consistent with it. When reflecting on the utility of T2* measurement for studying tumor tissues, it is imperative to consider the relationship between T2* and spatial resolution. Although many of the relationships we found between T2* and histological features were observed in high resolution MRH as well as lower resolution in vivo MRI, we have not yet demonstrated the limits of detection of this relationship. Ongoing studies have incorporated these questions into sequence program design and included multi-resolution acquisition protocols. Still, improving our understanding of the pathological insights that T2* mapping may provide to radiologists could impact future clinical care, as nuclear size has been shown to have prognostic significance in multiple sarcomas (38–40). In osteosarcoma, particularly, tumor nuclear size has been shown to correlate with response to chemotherapy (41). In other solid tumors, nuclear size and feature variance, as described above, are associated with tumor grade and aggressiveness (42–44). Although T2* is not widely employed in the clinical setting, further exploration of its utility may add great value to UPS MRI.
While many cytometric features correlated with T2*, we found very few features significantly associated with ADC. This was surprising, given evidence in the literature connecting ADC to tumor pathology, particularly tumor cell density (45–47). Further, the limited correlations noted in ex vivo ADC were not seen in vivo. In both cases, we believe that deficiencies in the scan protocols may have diminished any findings of interest. Regarding in vivo ADC, we hypothesize that the lack of significant relationships may be attributable, in part, to challenges related to signal-to-noise ratio (SNR) with the scan protocol. The bias conferred by the surface coil caused a disproportionate SNR loss in the spiral DWI sequence compared to other sequences, such as the MGRE sequence. Often, this resulted in 30-50% of the tumor volume being irreparably affected by noise, depending on the size or depth of the tumor in the hind limb relative to the surface coil. To address this issue in subsequent studies, we have begun using a modified volume coil and updated the DWI protocol to achieve higher and more uniform SNR.
Results from the ex vivo ADC are more challenging to interpret. These images were free of coil-related signal bias and had excellent SNR. In fact, individual tumors demonstrated very strong linear correlations with ex vivo ADC, including inverse relationships with features related to cell density as expected based on the literature (48). However, many of these trends were in complete opposing directions for other tumors. As a result, group data for these features showed no significant relationships with ex vivo ADC. While challenging to interpret, we hypothesize that these peculiar results were also due to insufficiencies in the scan protocol. Specifically, the ex vivo DWI protocol employed multiple b values to calculate ADC, but all data were acquired in a single direction, which may be too reductive at such high resolutions. The cells measured within a 35 μm3 voxel can demonstrate directional architecture, as these sarcomas frequently include elongated or spindled tumor cells arranged in fascicular or storiform patterns with variable directionality. We hypothesize that at high resolution, the diffusion properties in a single direction may be impacted by this directional tissue structure. Important to note, while the literature generally associates tumor ADC with cell density, there have been discrepancies among studies (49–52). We hypothesize that our data could provide evidence that the DWI sequence parameters may play a role in how ADC relates to cell density. While not used in the present study, we have subsequently employed multi-directional DWI to exploit these features as additional parameters for future tumor analyses.
The primary limitations to this study were deficiencies in scan protocols discussed above and the small sample size for this cohort. Subsequent experiments have overcome many of the inadequacies of the scan protocols based on the confounds identified in this study. While statistically significant associations were observed between cytometric features and qMRI, these results should be interpreted in the context of the limited sample size. Ongoing studies have utilized the data from this pilot study to adjust our statistical models and to calculate suitable, larger cohort sizes. We have also improved our imaging and registration workflows to reduce technical noise in the resulting data. Further, future studies will incorporate more nuanced approaches for comparing cytometric features with qMRI beyond linear relationships, such as non-linear and multivariate analyses. Finally, in vivo and ex vivo images were acquired on different scanners, which could introduce technical variables when directly comparing in vivo and ex vivo MR. This has been remedied in subsequent experiments through instrumentation upgrades.
The most notable achievement of this work was demonstrating the ability to consistently measure significant quantitative relationships between soft tissue sarcoma histologic features and qMRI at the intratumoral level in a cohort of animals. These experiments represent the foundation by which tissue histology can directly inform results derived from radiomics studies in UPS (53, 54), thus providing a mechanistic link between qMRI and tumor biology. Our previous work focused primarily on methodological development to facilitate MRI/histology registration and quantitative comparison using MRH. However, in initial experiments we found that inconsistencies in tissue handling and histological preparation on a case-by-case basis, such as poor fixation and inconsistent staining, prevented us from comparing data between tumors. In this study, we employed a series of methodological advancements compared to previous studies to facilitate group data analysis. First, tumor-bearing limbs were perfusion-fixed during euthanasia to improve ex vivo tissue quality. Second, the histological technique was improved to ensure maintenance of tissue integrity, as well as to facilitate improved automated histological analysis. Third, we expanded the histological slide analysis to include more features for comparison to MR. Finally, we increased the spatial resolution of the MRH datasets to improve registration to histological slides. With the aforementioned improvements to data collection, these experiments represent the first of their kind to identify statistically significant relationships between cytometric features and qMRI among a cohort of tumor-bearing animals.
With these improvements, we have shown that the heterogeneity of multi-parametric qMRI in sarcomas can be linked to tissue pathology and that pathological hallmarks of UPS, like nuclear pleomorphism, may specifically correlate to select qMRI patterns. Importantly, we achieved image registration from in vivo MRI to histology slides by utilizing non-destructive MRH, without the need for any special tissue processing equipment, stereotactic tissue molds, or non-standard histological techniques. The results from this study provide pathology-based insights into qMRI in sarcomas, and can inform thoughtful sequence selection when designing MR imaging biomarker studies in UPS. Further, this work provides a methodological approach for defining the histological basis of tumor radiomics studies. Utilizing cutting-edge imaging techniques and analysis pipelines, these experiments have established quantifiable links between heterogeneous tumor qMRI properties and their histological underpinnings. In this way, we have begun to unravel the specific tissue pathologies which contribute to the radiological presentation of UPS. This work represents an initial key step in empowering the clinical radiologist with pathological insights using non-invasive, whole-tumor MR imaging.
Data availability statement
The raw data supporting the conclusions of this article will be made available by the authors, without undue reservation.
Ethics statement
The animal study was approved by Duke University Institutional Animal Care and Use Committee (IACUC). The study was conducted in accordance with the local legislation and institutional requirements.
Author contributions
SB: Writing – review & editing, Writing – original draft, Visualization, Validation, Methodology, Investigation, Formal analysis, Conceptualization. YM: Writing – review & editing, Writing – original draft, Visualization, Supervision, Resources, Project administration, Investigation, Data curation, Conceptualization. JE: Writing – review & editing, Validation, Supervision, Methodology, Conceptualization. JC: Writing – review & editing, Software, Methodology. GC: Writing – review & editing, Investigation, Data curation. YQ: Writing – review & editing, Investigation, Data curation. AB: Writing – review & editing, Investigation, Data curation. EX: Writing – review & editing, Investigation, Data curation. DK: Writing – review & editing, Supervision, Resources, Project administration, Methodology, Funding acquisition. CB: Writing – review & editing, Supervision, Resources, Project administration, Methodology, Funding acquisition. GJ: Writing – review & editing, Supervision, Resources, Project administration, Methodology, Funding acquisition.
Funding
The author(s) declare financial support was received for the research, authorship, and/or publication of this article. This work was supported by the National Cancer Institute (grants NCI U24 CA220245 and NCI R35CA197616). DK was also supported by grant R35CA197616 from the National Cancer Institute.
Acknowledgments
All small-animal imaging work was performed at the Duke Center for In Vivo Microscopy. The authors thank Anton Berns (Netherlands Cancer Institute) for providing the p53fl/fl mice.
Conflict of interest
DK is a co-founder of XRAD Therapeutics, which is commercializing radiosensitizers. DK is on the scientific advisory board for Lumicell, which is commercializing intraoperative imaging technology. DK has received research support from Merck, XRAD Therapeutics, Bristol Myers Squibb, and Varian. However, this funding did not support this work.
The remaining authors declare that the research was conducted in the absence of any commercial or financial relationships that could be construed as a potential conflict of interest.
Publisher’s note
All claims expressed in this article are solely those of the authors and do not necessarily represent those of their affiliated organizations, or those of the publisher, the editors and the reviewers. Any product that may be evaluated in this article, or claim that may be made by its manufacturer, is not guaranteed or endorsed by the publisher.
Supplementary material
The Supplementary Material for this article can be found online at: https://www.frontiersin.org/articles/10.3389/fonc.2024.1287479/full#supplementary-material
References
1. Choi JH, Ro JY. The 2020 WHO classification of tumors of soft tissue: selected changes and new entities. Adv Anat Pathol. (2021) 28:44–58. doi: 10.1097/PAP.0000000000000284
2. Thway K, Fisher C. Undifferentiated and dedifferentiated soft tissue neoplasms: Immunohistochemical surrogates for differential diagnosis. Semin Diagn Pathol. (2021) 38:170–86. doi: 10.1053/j.semdp.2021.09.005
3. Kallen ME, Hornick JL. The 2020 WHO classification: what's new in soft tissue tumor pathology? Am J Surg Pathol. (2021) 45:e1–e23. doi: 10.1097/PAS.0000000000001552
4. Fletcher CD, Dal Cin P, de Wever I, Mandahl N, Mertens F, Mitelman F, et al. Correlation between clinicopathological features and karyotype in spindle cell sarcomas. A report of 130 cases from the CHAMP study group. Am J Pathol. (1999) 154:1841–7. doi: 10.1016/S0002-9440(10)65441-7
5. Steele CD, Tarabichi M, Oukrif D, Webster AP, Ye H, Fittall M, et al. Undifferentiated sarcomas develop through distinct evolutionary pathways. Cancer Cell. (2019) 35:441–56 e8. doi: 10.1016/j.ccell.2019.02.002
6. Cancer Genome Atlas Research Network. Electronic address edsc, Cancer Genome Atlas Research N. Comprehensive and Integrated Genomic Characterization of Adult Soft Tissue Sarcomas. Cell. (2017) 171:950–65 e28. doi: 10.1016/j.cell.2017.10.014
7. Hames-Fathi S, Nottley SWG, Pillay N. Unravelling undifferentiated soft tissue sarcomas: insights from genomics. Histopathology. (2022) 80:109–21. doi: 10.1111/his.14446
8. Ramakrishnan K, Levy N, Goldbach A, Nagarathinam R, Ali S, Ling S, et al. Imaging of soft tissue sarcomas of the extremities with radiologic-pathologic correlation. Curr Probl Diagn Radiol. (2022) 51:868–77. doi: 10.1067/j.cpradiol.2022.04.005
9. Carvalho SD, Pissaloux D, Crombe A, Coindre JM, Le Loarer F. Pleomorphic sarcomas: the state of the art. Surg Pathol Clin. (2019) 12:63–105. doi: 10.1016/j.path.2018.10.004
10. Hornick JL. Subclassification of pleomorphic sarcomas: How and why should we care? Ann Diagn Pathol. (2018) 37:118–24. doi: 10.1016/j.anndiagpath.2018.10.006
11. Renne SL, Di Tommaso L. Poorly-differentiated and undifferentiated sarcomas of the mediastinum: a bag of tricks. Mediastinum. (2021) 5:3. doi: 10.21037/med
12. Spinnato P, Clinca R, Vara G, Cesari M, Ponti F, Facchini G, et al. MRI features as prognostic factors in myxofibrosarcoma: proposal of MRI grading system. Acad Radiol. (2021) 28:1524–9. doi: 10.1016/j.acra.2020.08.018
13. Spinnato P, Clinca R. MRI tail sign in soft-tissue sarcoma. Radiology. (2021) 299:276. doi: 10.1148/radiol.2021203877
14. Scalas G, Parmeggiani A, Martella C, Tuzzato G, Bianchi G, Facchini G, et al. Magnetic resonance imaging of soft tissue sarcoma: features related to prognosis. Eur J Orthop Surg Traumatol. (2021) 31:1567–75. doi: 10.1007/s00590-021-03003-2
15. Crombe A, Marcellin PJ, Buy X, Stoeckle E, Brouste V, Italiano A, et al. Soft-tissue sarcomas: assessment of MRI features correlating with histologic grade and patient outcome. Radiology. (2019) 291:710–21. doi: 10.1148/radiol.2019181659
16. Yan R, Hao D, Li J, Liu J, Hou F, Chen H, et al. Magnetic resonance imaging-based radiomics nomogram for prediction of the histopathological grade of soft tissue sarcomas: A two-center study. J Magn Reson Imaging. (2021) 53:1683–96. doi: 10.1002/jmri.27532
17. Lee CL, Mowery YM, Daniel AR, Zhang D, Sibley AB, Delaney JR, et al. Mutational landscape in genetically engineered, carcinogen-induced, and radiation-induced mouse sarcoma. JCI Insight. (2019) 4. doi: 10.1172/jci.insight.128698
18. Blocker SJ, Cook J, Mowery YM, Everitt JI, Qi Y, Hornburg KJ, et al. Ex vivo MR histology and cytometric feature mapping connect three-dimensional in vivo MR images to two-dimensional histopathologic images of murine sarcomas. Radiol Imaging Cancer. (2021) 3:e200103. doi: 10.1148/rycan.2021200103
19. Johnson GA, Cofer GP, Gewalt SL, Hedlund LW. Morphologic phenotyping with MR microscopy: the visible mouse. Radiology. (2002) 222:789–93. doi: 10.1148/radiol.2223010531
20. Johnson GA, Cofer GP, Fubara B, Gewalt SL, Hedlund LW, Maronpot RR. Magnetic resonance histology for morphologic phenotyping. J Magn Reson Imaging. (2002) 16:423–9. doi: 10.1002/jmri.10175
21. Wang N, Anderson RJ, Badea A, Cofer G, Dibb R, Qi Y, et al. Whole mouse brain structural connectomics using magnetic resonance histology. Brain Struct Funct. (2018) 223:4323–35. doi: 10.1007/s00429-018-1750-x
22. Lustig M, Donoho DL, Santos JM, Pauly JM. Compressed sensing MRI. IEEE Signal Process Magazine. (2008) 25:72–82. doi: 10.1109/MSP.2007.914728
23. Hu S, Lustig M, Chen AP, Crane J, Kerr A, Kelley DA, et al. Compressed sensing for resolution enhancement of hyperpolarized 13C flyback 3D-MRSI. J Magn Reson. (2008) 192:258–64. doi: 10.1016/j.jmr.2008.03.003
24. Blocker SJ, Mowery YM, Holbrook MD, Qi Y, Kirsch DG, Johnson GA, et al. Bridging the translational gap: Implementation of multimodal small animal imaging strategies for tumor burden assessment in a co-clinical trial. PloS One. (2019) 14:e0207555. doi: 10.1371/journal.pone.0207555
25. Blocker SJ, Cook J, Everitt JI, Austin WM, Watts TL, Mowery YM. Automated nuclear segmentation in head and neck squamous cell carcinoma pathology reveals relationships between cytometric features and ESTIMATE stromal and immune scores. Am J Pathol. (2022) 192:1305–20. doi: 10.1016/j.ajpath.2022.06.003
26. Blocker SJ, Morrison S, Everitt JI, Cook J, Luo S, Watts TL, et al. Whole-slide cytometric feature mapping for distinguishing tumor genomic subtypes in head and neck squamous cell carcinoma whole-slide images. Am J Pathol. (2023) 193:182–90. doi: 10.1016/j.ajpath.2022.11.004
27. Shamir L, Wolkow CA, Goldberg IG. Quantitative measurement of aging using image texture entropy. Bioinformatics. (2009) 25:3060–3. doi: 10.1093/bioinformatics/btp571
28. Pantic I, Pantic S, Paunovic J, Perovic M. Nuclear entropy, angular second moment, variance and texture correlation of thymus cortical and medullar lymphocytes: grey level co-occurrence matrix analysis. Acad Bras Cienc. (2013) 85:1063–72. doi: 10.1590/S0001-37652013005000045
29. Gibault L, Perot G, Chibon F, Bonnin S, Lagarde P, Terrier P, et al. New insights in sarcoma oncogenesis: a comprehensive analysis of a large series of 160 soft tissue sarcomas with complex genomics. J Pathol. (2011) 223:64–71. doi: 10.1002/path.2787
30. Toulmonde M, Lucchesi C, Verbeke S, Crombe A, Adam J, Geneste D, et al. High throughput profiling of undifferentiated pleomorphic sarcomas identifies two main subgroups with distinct immune profile, clinical outcome and sensitivity to targeted therapies. EBioMedicine. (2020) 62:103131. doi: 10.1016/j.ebiom.2020.103131
31. Haralick RM, Shanmugam K, Dinstein I. Textural features for image classification. IEEE Trans Systems Man Cybernetics. (1973) SMC-3:12. doi: 10.1109/TSMC.1973.4309314
32. Lofstedt T, Brynolfsson P, Asklund T, Nyholm T, Garpebring A. Gray-level invariant Haralick texture features. PloS One. (2019) 14:e0212110. doi: 10.1371/journal.pone.0212110
33. Tachibana M, Tsukamoto K, Takahashi M, Tsutsumi Y. Undifferentiated pleomorphic sarcoma with hyaline globules (Thanatosomes). Cureus. (2021) 13:e15789. doi: 10.7759/cureus.15789
34. Garpebring A, Brynolfsson P, Kuess P, Georg D, Helbich TH, Nyholm T, et al. Density estimation of grey-level co-occurrence matrices for image texture analysis. Phys Med Biol. (2018) 63:195017. doi: 10.1088/1361-6560/aad8ec
35. Barroilet LW MP. Nuclear magnetic resonance (NMR) relaxation spectroscopy in tissues. Med Phys. (1975) 2:3. doi: 10.1118/1.594177
36. Beall PT, Asch BB, Chang DC, Medina D, Hazlewood CF. Distinction of normal, preneoplastic, and neoplastic mouse mammary primary cell cultures by water nuclear magnetic resonance relaxation times. J Natl Cancer Inst. (1980) 64:335–8. doi: 10.1093/jnci/64.2.335
37. Majumdar S GJ. Studies of diffusion in random fields produced by variations in susceptibility. J Magn Reson. (1988) 78:4. doi: 10.1016/0022-2364(88)90155-2
38. de Andrea CE, Petrilli AS, Jesus-Garcia R, Bleggi-Torres LF, Alves MT. Large and round tumor nuclei in osteosarcoma: good clinical outcome. Int J Clin Exp Pathol. (2011) 4:169–74.
39. Kreicbergs A, Slezak E, Soderberg G. The prognostic significance of different histomorphologic features in chondrosarcoma. Virchows Arch A Pathol Anat Histol. (1981) 390:1–10. doi: 10.1007/BF00443894
40. Ishida T, Kikuchi F, MaChinami R. Histological grading and morphometric analysis of cartilaginous tumours. Virchows Arch A Pathol Anat Histopathol. (1991) 418:149–55. doi: 10.1007/BF01600290
41. Apel R, Delling G, Krumme H, Winkler K, Salzer-Kuntschik M. Nuclear polymorphism in osteosarcomas as a prognostic factor for the effect of chemotherapy. A quantitative study. Virchows Arch A Pathol Anat Histopathol. (1985) 405:215–23. doi: 10.1007/BF00704373
42. Boehm KM, Aherne EA, Ellenson L, Nikolovski I, Alghamdi M, Vazquez-Garcia I, et al. Multimodal data integration using machine learning improves risk stratification of high-grade serous ovarian cancer. Nat Cancer. (2022) 3:723–33. doi: 10.1038/s43018-022-00388-9
43. Singh V, Bhargava M, Varma K, Misra V, Singh R. Evaluation and quantification of cytomorphometry in conjunction with visual examination and exfoliative cytology in early diagnosis of oral premalignant and Malignant lesions. Acta Cytol. (2021) 65:522–8. doi: 10.1159/000518582
44. Saika T, Hirabayashi K, Itoh H, Miyajima Y, Serizawa A, Kato N, et al. Cancer-associated fibroblasts are a useful cytological finding for diagnosing pancreatic ductal adenocarcinoma. Cytopathology. (2020) 31:310–4. doi: 10.1111/cyt.12868
45. Tasaki A, Asatani MO, Umezu H, Kashima K, Enomoto T, Yoshimura N, et al. Differential diagnosis of uterine smooth muscle tumors using diffusion-weighted imaging: correlations with the apparent diffusion coefficient and cell density. Abdom Imaging. (2015) 40:1742–52. doi: 10.1007/s00261-014-0324-5
46. Chang PD, Malone HR, Bowden SG, Chow DS, Gill BJA, Ung TH, et al. A multiparametric model for mapping cellularity in glioblastoma using radiographically localized biopsies. AJNR Am J Neuroradiol. (2017) 38:890–8. doi: 10.3174/ajnr.A5112
47. Romanello Joaquim M, Furth EE, Fan Y, Song HK, Pickup S, Cao J, et al. DWI metrics differentiating benign intraductal papillary mucinous neoplasms from invasive pancreatic cancer: A study in GEM models. Cancers (Basel). (2022) 14. doi: 10.3390/cancers14164017
48. Drake-Perez M, Boto J, Fitsiori A, Lovblad K, Vargas MI. Clinical applications of diffusion weighted imaging in neuroradiology. Insights Imaging. (2018) 9:535–47. doi: 10.1007/s13244-018-0624-3
49. Surov A, Meyer HJ, Wienke A. Correlation between apparent diffusion coefficient (ADC) and cellularity is different in several tumors: a meta-analysis. Oncotarget. (2017) 8:59492–9. doi: 10.18632/oncotarget.v8i35
50. Chatterjee A, Watson G, Myint E, Sved P, McEntee M, Bourne R. Changes in epithelium, stroma, and lumen space correlate more strongly with gleason pattern and are stronger predictors of prostate ADC changes than cellularity metrics. Radiology. (2015) 277:751–62. doi: 10.1148/radiol.2015142414
51. Wu X, Pertovaara H, Dastidar P, Vornanen M, Paavolainen L, Marjomaki V, et al. ADC measurements in diffuse large B-cell lymphoma and follicular lymphoma: a DWI and cellularity study. Eur J Radiol. (2013) 82:e158–64. doi: 10.1016/j.ejrad.2012.11.021
52. White NS, Dale AM. Distinct effects of nuclear volume fraction and cell diameter on high b-value diffusion MRI contrast in tumors. Magn Reson Med. (2014) 72:1435–43. doi: 10.1002/mrm.25039
53. Crombe A, Perier C, Kind M, De Senneville BD, Le Loarer F, Italiano A, et al. T(2) -based MRI Delta-radiomics improve response prediction in soft-tissue sarcomas treated by neoadjuvant chemotherapy. J Magn Reson Imaging. (2019) 50:497–510. doi: 10.1002/jmri.26589
Keywords: MRI, sarcoma, histology, image registration, multi-modal, preclinical, feature mapping
Citation: Blocker SJ, Mowery YM, Everitt JI, Cook J, Cofer GP, Qi Y, Bassil AM, Xu ES, Kirsch DG, Badea CT and Johnson GA (2024) MR histology reveals tissue features beneath heterogeneous MRI signal in genetically engineered mouse models of sarcoma. Front. Oncol. 14:1287479. doi: 10.3389/fonc.2024.1287479
Received: 29 December 2023; Accepted: 15 May 2024;
Published: 31 May 2024.
Edited by:
Sharon R. Pine, University of Colorado Anschutz Medical Campus, United StatesReviewed by:
Paolo Spinnato, Rizzoli Orthopedic Institute (IRCCS), ItalyMarion Tardieu, INSERM U1194 Institut de Recherche en Cancérologie de Montpellier (IRCM), France
Copyright © 2024 Blocker, Mowery, Everitt, Cook, Cofer, Qi, Bassil, Xu, Kirsch, Badea and Johnson. This is an open-access article distributed under the terms of the Creative Commons Attribution License (CC BY). The use, distribution or reproduction in other forums is permitted, provided the original author(s) and the copyright owner(s) are credited and that the original publication in this journal is cited, in accordance with accepted academic practice. No use, distribution or reproduction is permitted which does not comply with these terms.
*Correspondence: Stephanie J. Blocker, c3RlcGhhbmllLmJsb2NrZXJAZHVrZS5lZHU=