 Chaojie Xu
 Dongchen Pei
 Yi Liu
 Nan Liu
 Zhengjun Kang
- Department of Urology, the Fifth Affiliated Hospital of Zhengzhou University, Zhengzhou University, Zhengzhou, Henan, China
Background: With the development of early diagnosis and treatment, the second primary malignancy (SPM) attracts increasing attention. The second primary prostate cancer (spPCa) is an important class of SPM, but remains poorly understood.
Methods: We retrospectively analyzed 3,322 patients with spPCa diagnosed between 2004 and 2015 in the Surveillance, Epidemiology, and End Results (SEER) database. Chi-square test was applied to compare demographic and clinical variables and analyze causes of death. Multivariate competitive risk regression model was used to identify risk factors associated with prostate-cancer-specific mortality (PCSM), and these factors were enrolled to build a nomogram of competitive risk. The C-index, calibration curve, and decision curve analysis (DCA) were employed to evaluate the discrimination ability of our nomogram.
Results: The median follow-up (interquartile range, IQR) time was 47 (24–75) months, and the median (IQR) diagnosis interval between the first primary cancer (FPC) and spPCa was 32 (16–57) months. We found that the three most common sites of SPM were the urinary system, digestive system, and skin. Through multivariate competitive risk analysis, we enrolled race (p < 0.05), tumor–node–metastasis (TNM) stage (p < 0.001), Gleason score (p < 0.05), surgery (p = 0.002), and radiotherapy (p = 0.032) to construct the model to predict the outcomes of spPCa. The C-index was 0.856 (95% CI, 0.813–0.899) and 0.905 (95% CI, 0.941–0.868) in the training and validation set, respectively. Moreover, both the calibration curve and DCA illustrated that our nomogram performed well in predicting PCSM.
Conclusion: In conclusion, we identified four risk factors associated with the prognosis of spPCa and construct a competing risk nomogram, which performed well in predicting the 3-, 5-, and 10-year PCSM.
Introduction
The early screening and improved treatment resulted in the increased number of cancer survivors. Meanwhile, the possibility of people developing second primary malignancy (SPM) increased accordingly (1). According to Warren, the histology of SPM is different from the original primary cancer, and the diagnostic interval time is no less than 6 months (2). The SPM is a new type of cancer that is not a recurrence or metastasis of a primary malignant tumor. Studies have shown that SPM was detected in more than 10% of young cancer patients and approximately 25% of elderly cancer survivors (3, 4). Nowadays, not only extensive literatures have focused on the original primary cancers, but also the SPM attracts increasing attention with the development of early diagnosis and treatment.
Prostate cancer (PCa) is the most common malignant tumor in men (5). In the late 1980s, due to the widely carried out prostate-specific antigen (PSA) screening in the United States, the total incidence of PCa doubled in 6 years (1986–1992) (6). According to the International Agency for Research on Cancer estimates, there were approximately 1.4 million new cases of PCa and 375,000 deaths worldwide in 2020; PCa was the fifth leading cause of cancer death among men in the world, with incidence rates ranging from 6.3/100,000 to 83.4/100,000 in different regions (7).
The second primary prostate cancer spPCA is a critical class of SPM for PCa, considering that it is an essential cause of cancer-related deaths among men in the United States (8). Several studies have explored the risk factors and outcomes of developing PSM in patients with primary PCa cancer (9, 10). However, there are few studies on the spPCa, and the risk factors associated with spPCa remain unclear.
Thus, the aim of this study was to determine the clinical and demographic factors related to survival of spPCa. Based on the sub-distribution risk method, we tried to create a competitive risk nomogram to predict the 3-, 5-, and 10-year PCSM of the spPCa.
Materials and methods
Data source
All original data used in this study were extracted from the Surveillance, Epidemiology, and End Results (SEER) database (www.seer.cancer.gov), which is an open access database. The MP-SIR sector of the SEER*Stat version 8.3.8 (Username:18501-Nov2019, http://seer.cancer.gov/seerstat/) was used to extract SPM cases from nine population-based registries (2004–2015), and a total of 6,099 original cases were extracted. The search conditions were as follows: (1) FPC cases diagnosed between 2004 and 2015, (2) patients with the second primary cancer, (3) diagnosis made by positive histology, and (4) patients with complete follow-up and end point. Clinicopathological parameters of interest, including diagnosis date (year), age, race, TNM stage, grade, PSA, Gleason score, site of FPC, histological type of FPC, surgery history of spPCa, radiation history of spPCa, chemotherapy history of spPCa, and marital status, were extracted.
Data processing and study design
A total of 3,322 cases were included in this study. The exclusion criteria were listed as follows: (1) the interval between FPC and SPM <6 months (n = 961), (2) patients with only autopsy or death certificate records (n = 52), and (3) patients with unknown clinical information, including no TNM stage of PCa (n =748), unknown marital status (n = 496), no grade of PCa (n=361), unknown survival time of PCa (n = 110), unknown race (n=7), and unknown cause of death (n=18). Patients with more than two primary cancers were excluded (n=24). The detailed flowed chart of patient screening is shown in Figure 1.

Figure 1 The specific flow chart of case screening in this study.
Statistical analysis
The normality of the continuous variable’s distribution was checked using Shapiro–Wilk test. Mean ± standard deviation (SD) or median (IQR) was used for continuous variables. Counts and percentages were used for categorical variables. Chi-square test was used for classified variables, and Kruskal–Wallis rank sum test or ANOVA tests were used for continuous variables. Kaplan–Meier (K–M) curves were plotted, and log-rank analysis was applied to compare the overall survival (OS). All cases were randomly divided into training set and validation set at a ratio of 7:3. Then, we incorporated the multivariate competitive risk model and established the competitive risk nomogram to predict the 3-, 5-, and 10-year PCSM of the spPCa. C-index, calibration curve (bootstrap 1,000), and DCA were applied to evaluate the prediction ability and to judge whether the actual result was consistent with the prediction probability.
All statistical analyses were performed in R software (version 3.6.3; http://www.r-project.org/) and EmpowerStats2.0 (www.empowerstats.com). All tests were two-sided, and p < 0.05 was considered statistically significant.
Results
Baseline characteristics of study population
After excluding patients with incomplete clinical information, 3,322 eligible patients were enrolled in the study. As shown in Table 1, the median year of diagnosis (interquartile range, IQR) of FPC and SPM was in 2007 (2005–2010) and in 2011 (2009–2014), respectively. The median age of diagnosis of FPC and SPM was 65 (59–71) and 68 (62–74) years old, respectively. The median interval between two cancers was 32 (16–57) months. In addition, most registered patients were diagnosed with cancer at the early stage of TNM (I–II, 64.66% of FPC and 86.79% of PCa, respectively). For the treatment of PCa, 41.72% (1,386) of patients had surgery, 35.16% (1,168) had radiotherapy, and only 0.69% (23) had chemotherapy.
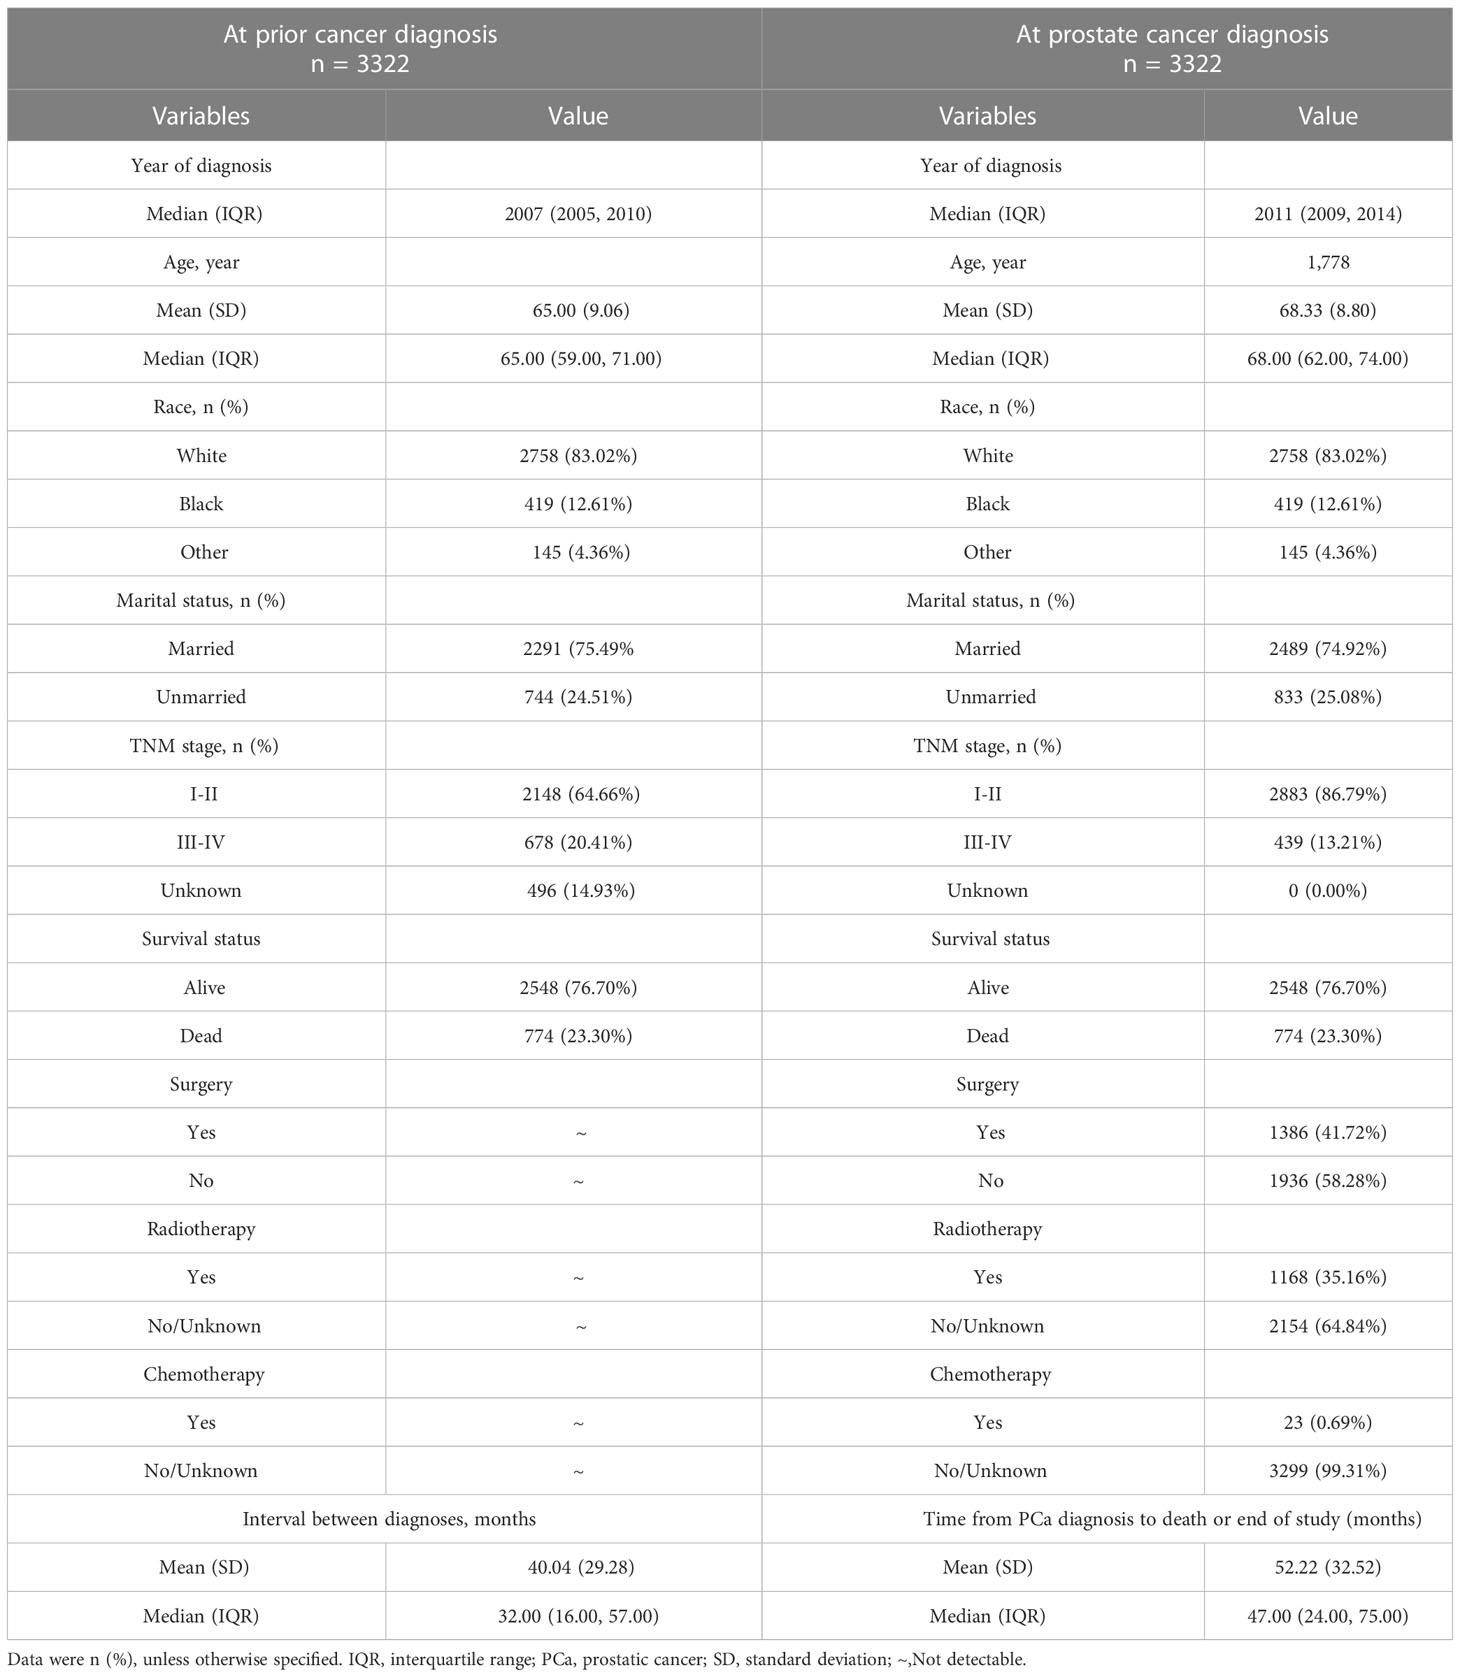
Table 1 Summary description of demographic and clinical factors.
As shown in Figure 2, the top 5 common sites of FPC were the urinary system (n = 1,035), digestive system (n = 831), skin (n = 431), lymphatic system (n = 347), and respiratory system (n = 235).
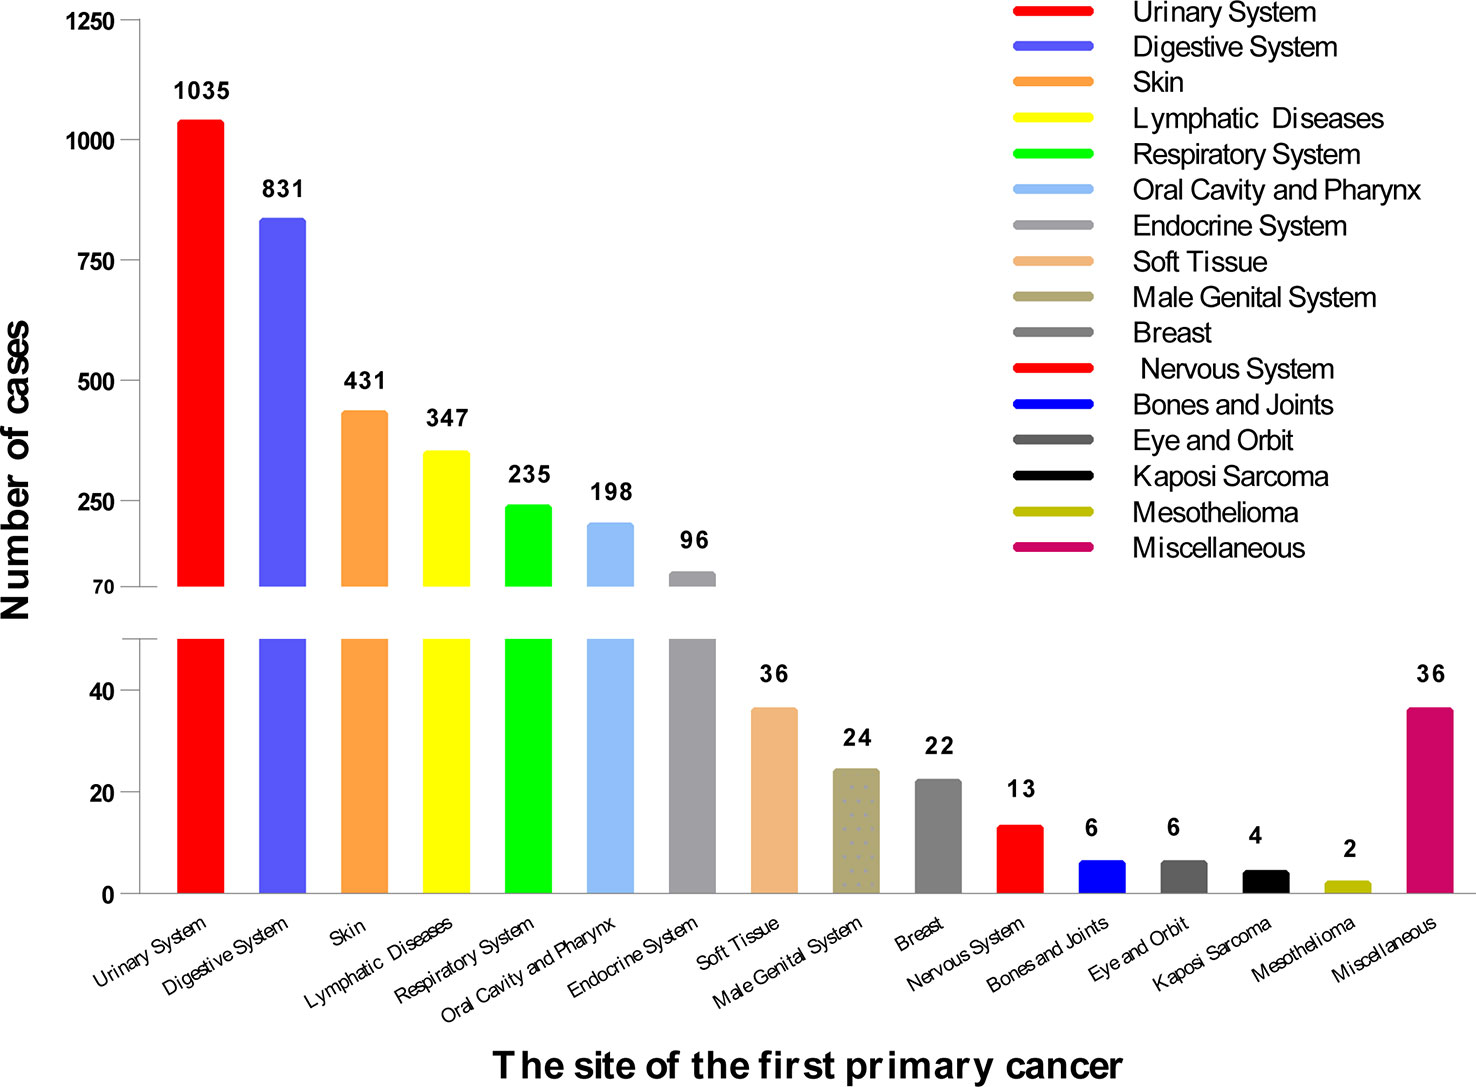
Figure 2 The location of the first primary cancer. We divided it into 16 sites, the most common of which was the urinary system (1,035), followed by the digestive system (831), and the skin (431). The location of 3,322 cases is shown here.
Mortality of study population
Among 3,322 patients with complete survival data, 23.30% (n = 774) died. We found that 36.30% of the cases died of FPC, 16.28% died of PCa, and 47.42% died of other causes (Figure 3). The proportion of patients who died of FPC was higher than that of prostate cancer: lymphatic diseases (40.26% vs. 19.48%, p<0.05), urinary system (47.62% vs. 11.36%, p<0.05), respiratory system (38.67% vs. 12.00%, p<0.05), and oral cavity and pharynx (17.86% vs. 12.50%, p<0.05). The number of deaths caused by PCa in the skin tissue (27.69% vs. 21.54%, p<0.05) was higher than that caused by FPC.
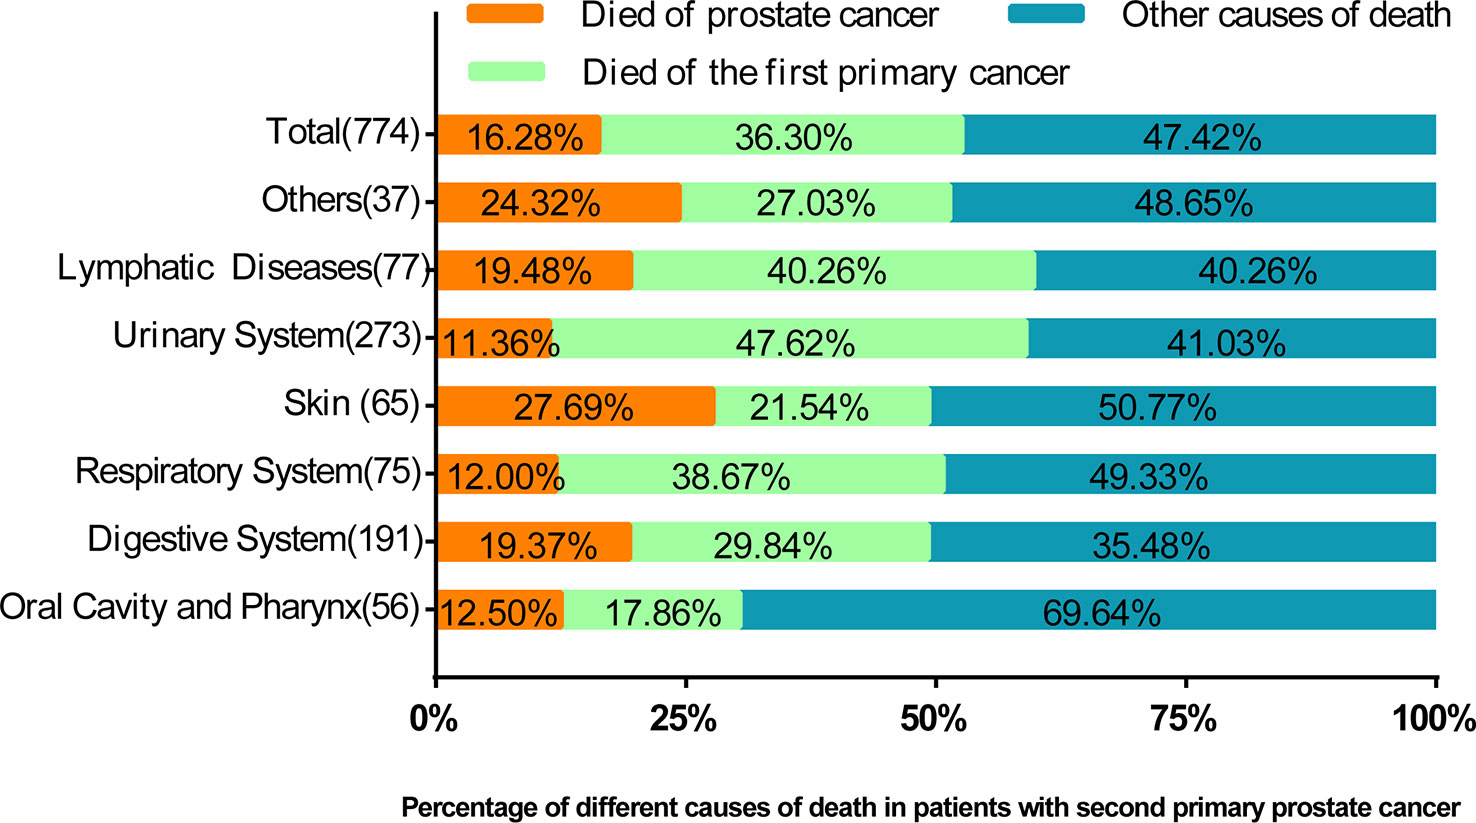
Figure 3 The percentage of prostate cancer deaths, deaths from prior cancer, and other causes of death by the location of the first primary cancer. In this figure, the proportion of causes of death is compared. It can be seen that in most cases, the proportion of deaths caused by prostate cancer is lower than that of previous cancers.
Kaplan–Meier analysis for prognostic factors
Kaplan–Meier (K–M) analysis showed that patients with lower age (p < 0.001) (Figure 4A), TNM stage (p < 0.001) (Figure 4H), PCa grade (p < 0.001) (Figure 4D), PSA (p < 0.001) (Figure 4F), and Gleason score (p < 0.001) (Figure 4C) had prolonged OS. Patients who received radiotherapy for SPM tended to have increased survival (p < 0.001) (Figure 4G). While patients who received chemotherapy (Figure 4B) or were unmarried (Figure 4E) had unfavorable outcomes (p < 0.001).

Figure 4 Kaplan–Meier analysis for overall survival (OS) of second primary malignancy (SPM) in the age (p < 0.001) (A), chemotherapy (p < 0.001) (B), Gleason score (p < 0.001) (C), grade (p < 0.001) (D), marital status (p < 0.001) (E), PSA (p < 0.001) (F), radiotherapy (p < 0.001) (G), and TNM stage (p < 0.001) (H).
Baseline characteristics of training and validation sets
At the ratio of 7:3, 3,322 cases were randomly divided into training set (n = 2,326) and validation set (n = 996). There were no significant differences in age, race, TNM stage, Gleason score, PSA, surgery, radiotherapy, chemotherapy, and marital status (p > 0.05) (Table 2). The competitive risk nomogram was constructed within the training set, and the internal validation of the model was carried out. As seen in Table 2, most patients were over 65 years old (66.71%), Caucasian (83.02%), and married (74.92%). The majority of the patients had lower TNM stages (stage I–II, 86.79%) and higher Gleason scores (8–10, 46.54%). The number of surgical and unoperated patients was equal (41.72% vs. 58.28%), and most patients did not receive radiotherapy (64.84%) and chemotherapy (99.31%).
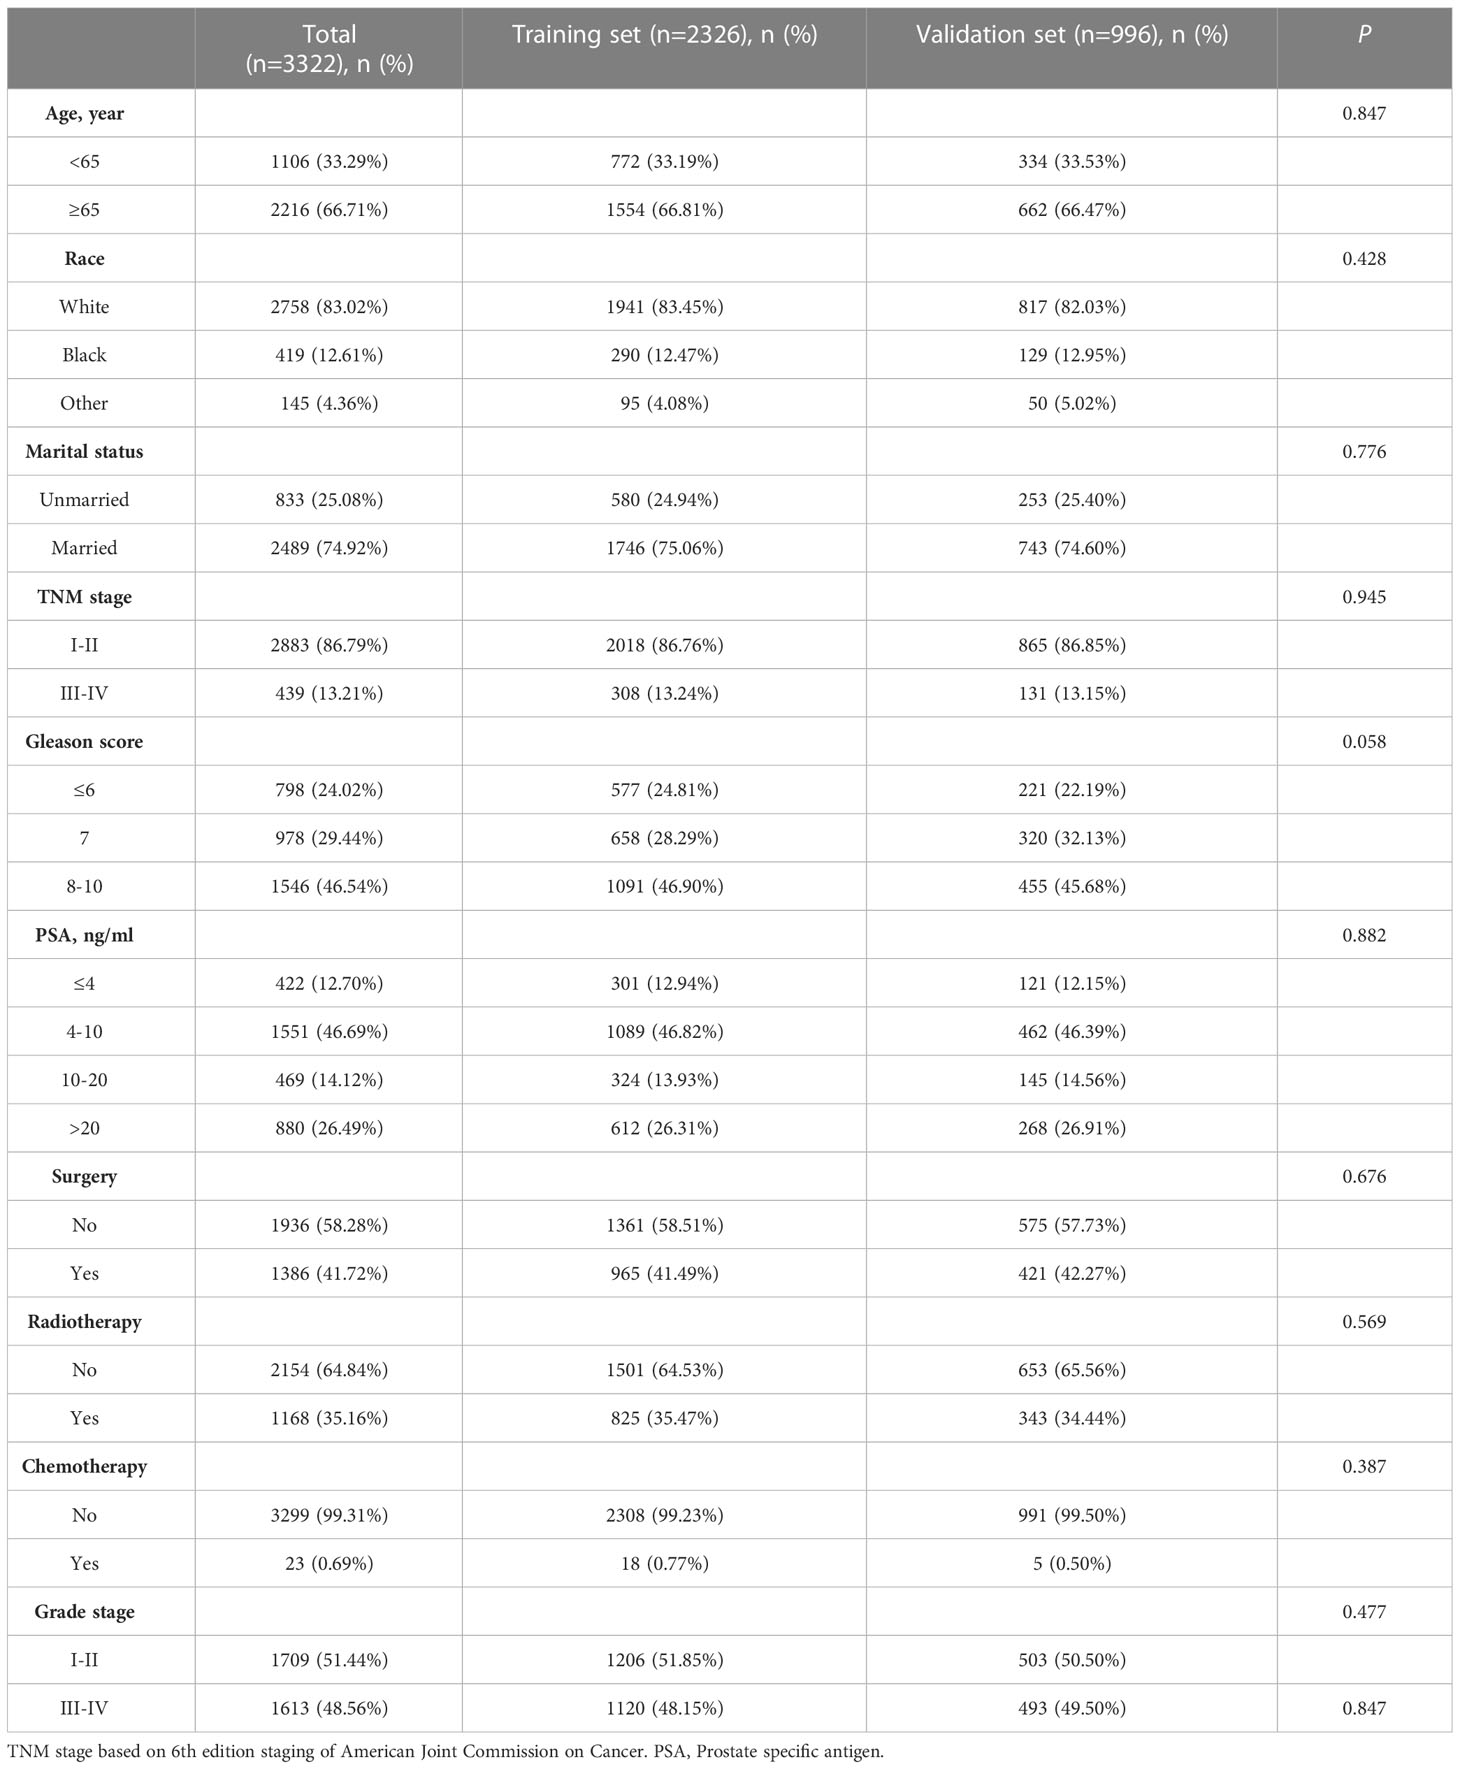
Table 2 Demographic characteristics of patients with second primary prostate cancer.
Competing risk analysis
We classified the causes of death as FPC caused, SPM caused, and other caused, and the results of the multivariate competitive risk analysis are displayed in Table 3. Race (p < 0.05), TNM stage (p < 0.001), Gleason score (p < 0.05), surgery (p = 0.002), and radiotherapy (p = 0.032) were statistically associated with cancer-specific survival of PCa. PCSM was higher in patients with higher stage (sub-distribution hazard ratio (sdHR), 7.274 (95% CI, 3.704–14.283)). spPCa patients who underwent surgery (sdHR =0.321; 95% CI, 0.155–0.667) had a higher PCSM than those who received no surgical treatment. Additionally, PCSM in patients with radiotherapy (sdHR =0.446; 95% CI, 0.213–0.933) was higher. Black people (sdHR =1.667; 95% CI, 0.711–3.966) and 8–10 Gleason scores (sdHR =1.040; 95% CI, 0.211–5.120) had higher PCSM, although there were no significant differences.
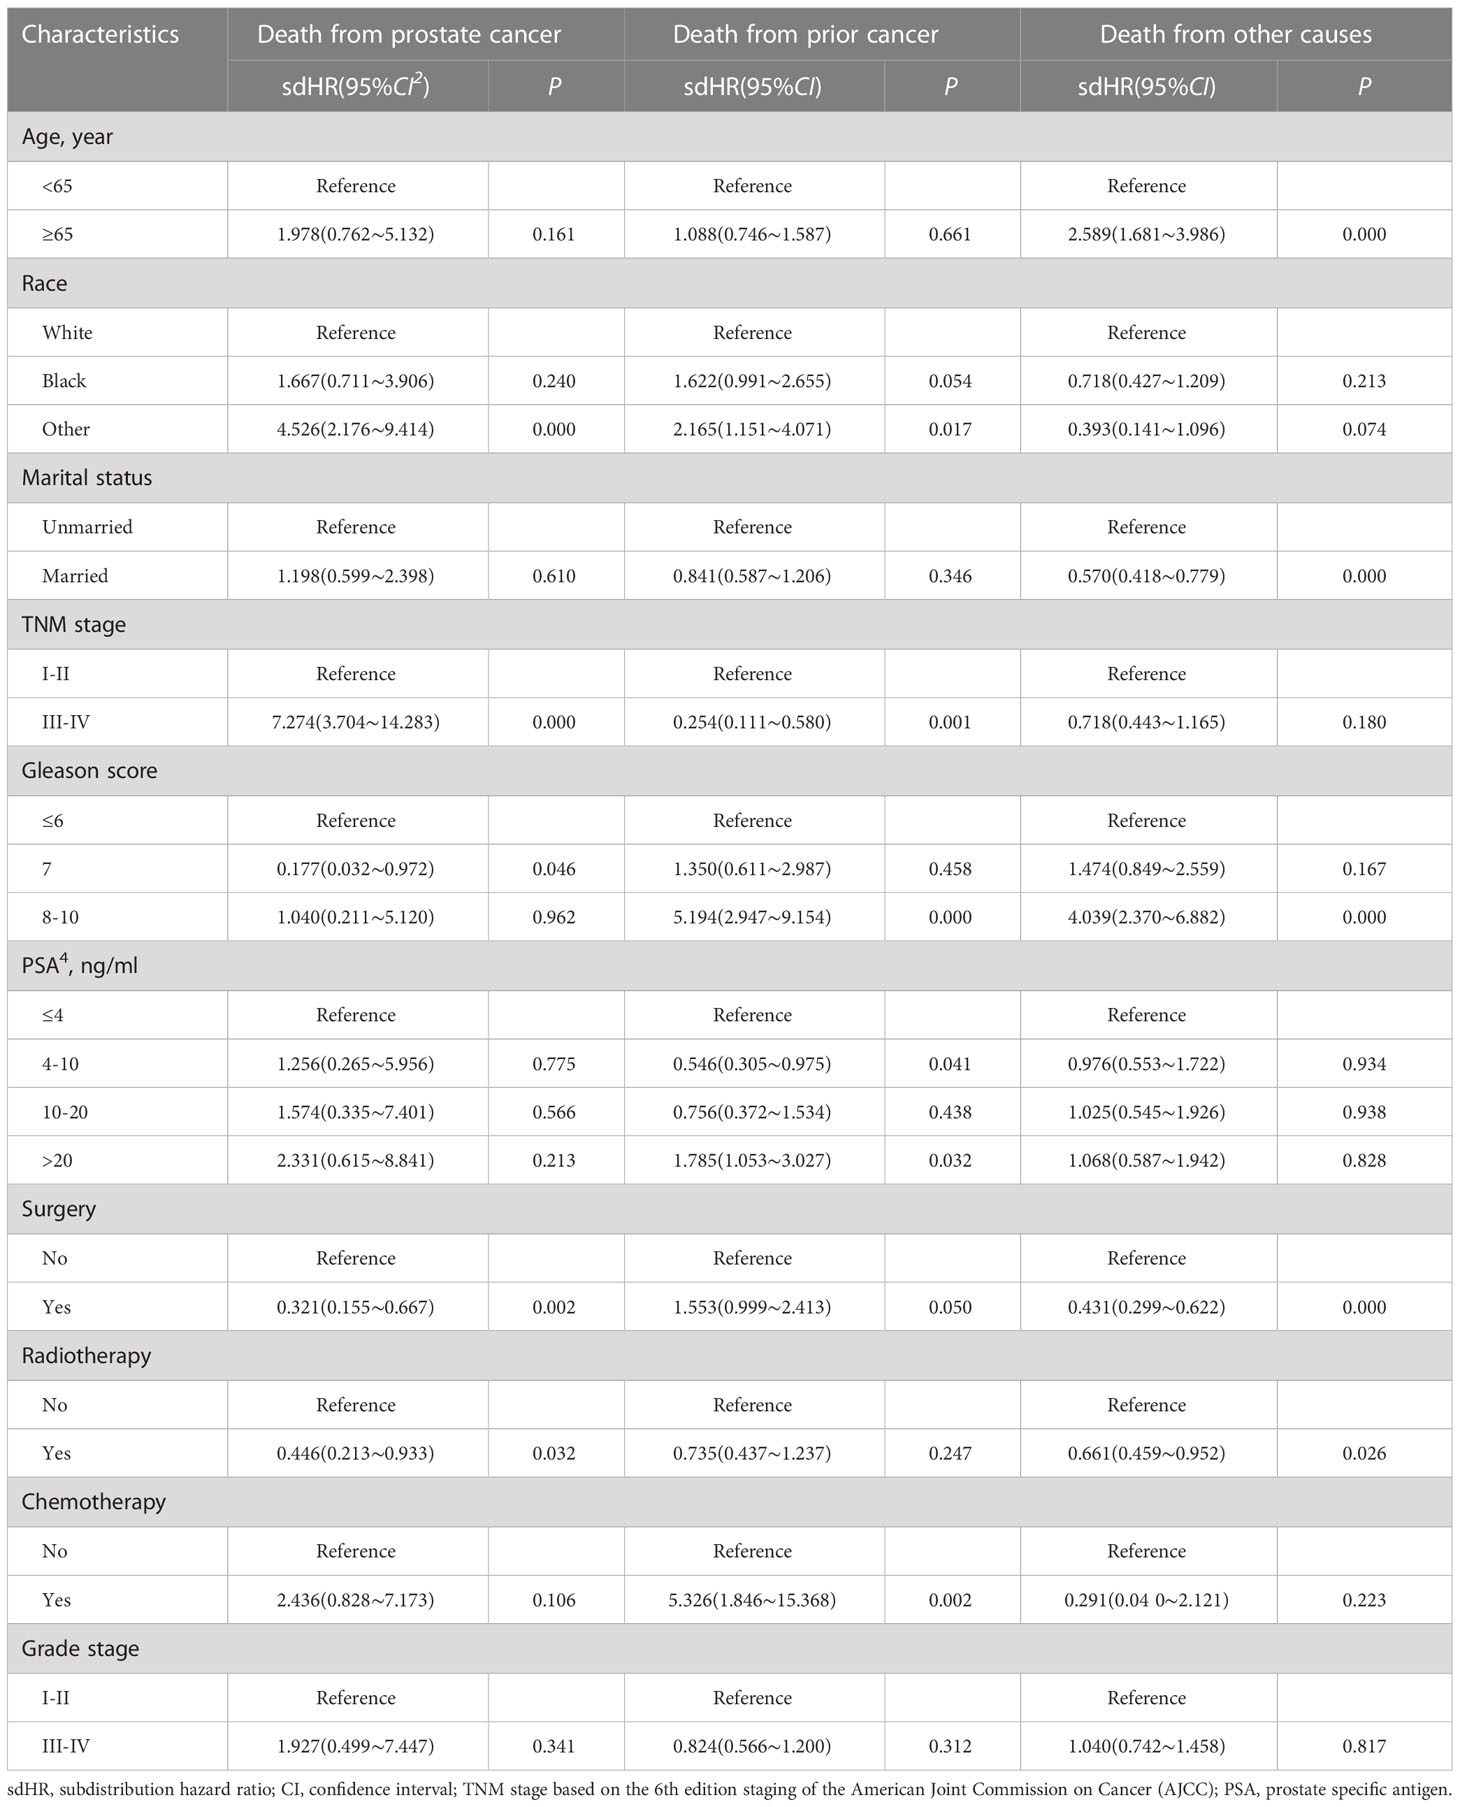
Table 3 Competing risk models of probabilities of death from prostate cancer, death from prior cancer, and death from other causes.
Similarly, race (p < 0.05), TNM stage (p < 0.001), Gleason score (p < 0.05), PSA (p < 0.05), surgery (p = 0.050), and chemotherapy (p = 0.002) were related to death caused by FPC. People who were non-Caucasian, had I–II TNM stage, high PSA, high Gleason score, and who received surgery and radiotherapy were more likely to die because of FPC. Age (p < 0.001), marital status (p < 0.001), Gleason score (p < 0.05), surgery (p < 0.001), and radiotherapy (p = 0.026) were related to death by other causes.
Construction and validation of prostate-cancer-specific mortality nomogram
The training set was analyzed by multivariate competitive risk analysis, and the factors with p < 0.05 were selected to establish a nomogram to predict the 3-, 5-, and 10-year PCSM. Five clinical indicators, including race, Gleason score, TNM stage, surgery, and radiotherapy, were included in our nomogram (Figure 5). In order to evaluate the discrimination of the nomogram, we calculated the C-index in the training set (0.856; 95% CI, 0.813–0.899) and the validation set (0.905; 95% CI, 0.941–0.868), which indicated that our model had good distinguishing ability (Table 4).
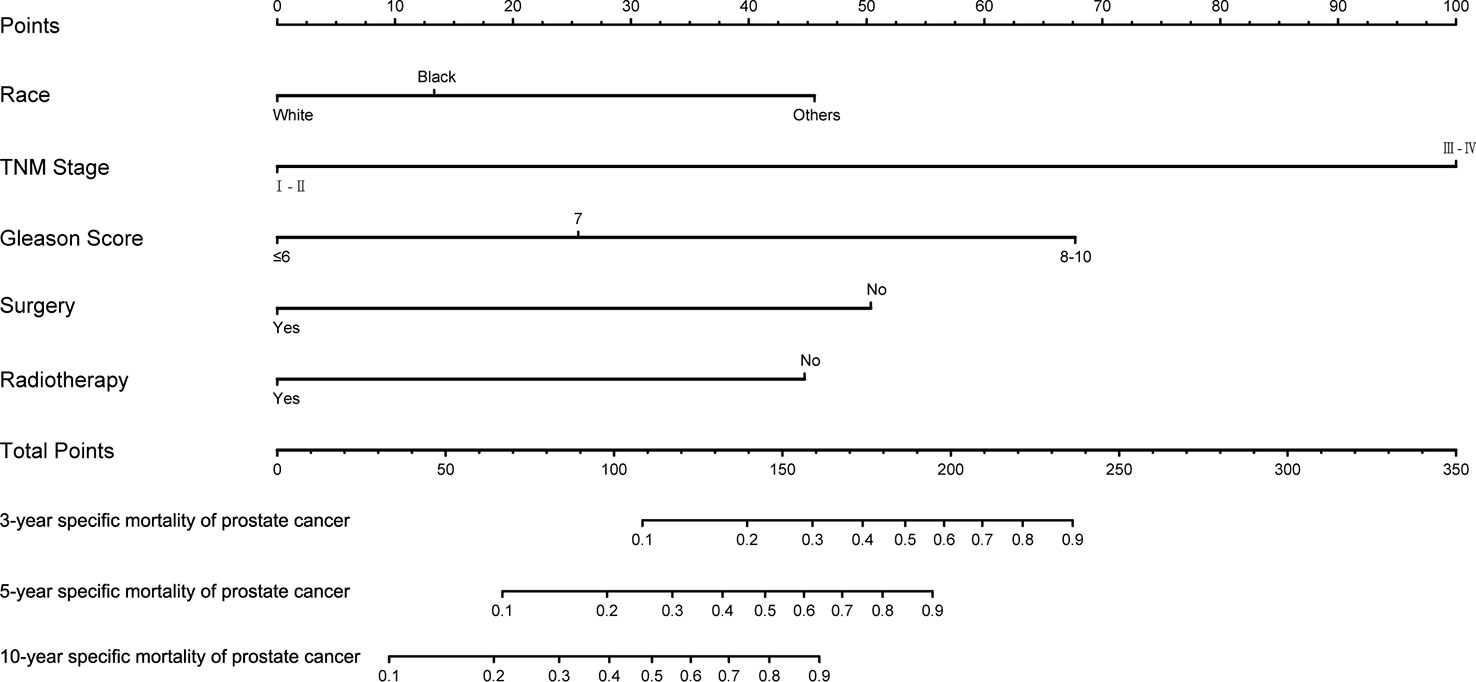
Figure 5 Nomogram to predict 3-, 5-, and 10-year prostate-cancer-specific mortality in patients with second primary prostate cancer.

Table 4 The discrimination of the nomogram for training set and validation set represented by c-index.
We drew calibration graphs of 3-, 5-, and 10-year PCSM in the training and validation sets to judge the consistency of our predictions with actual results (Figures 6A–F). Finally, we used the DCA to evaluate the clinical effectiveness of the model (Figures 7A–F). Both calibration plot and DCA in the training and validation sets showed good consistency and clinical effectiveness of our model in predicting the PCSM.
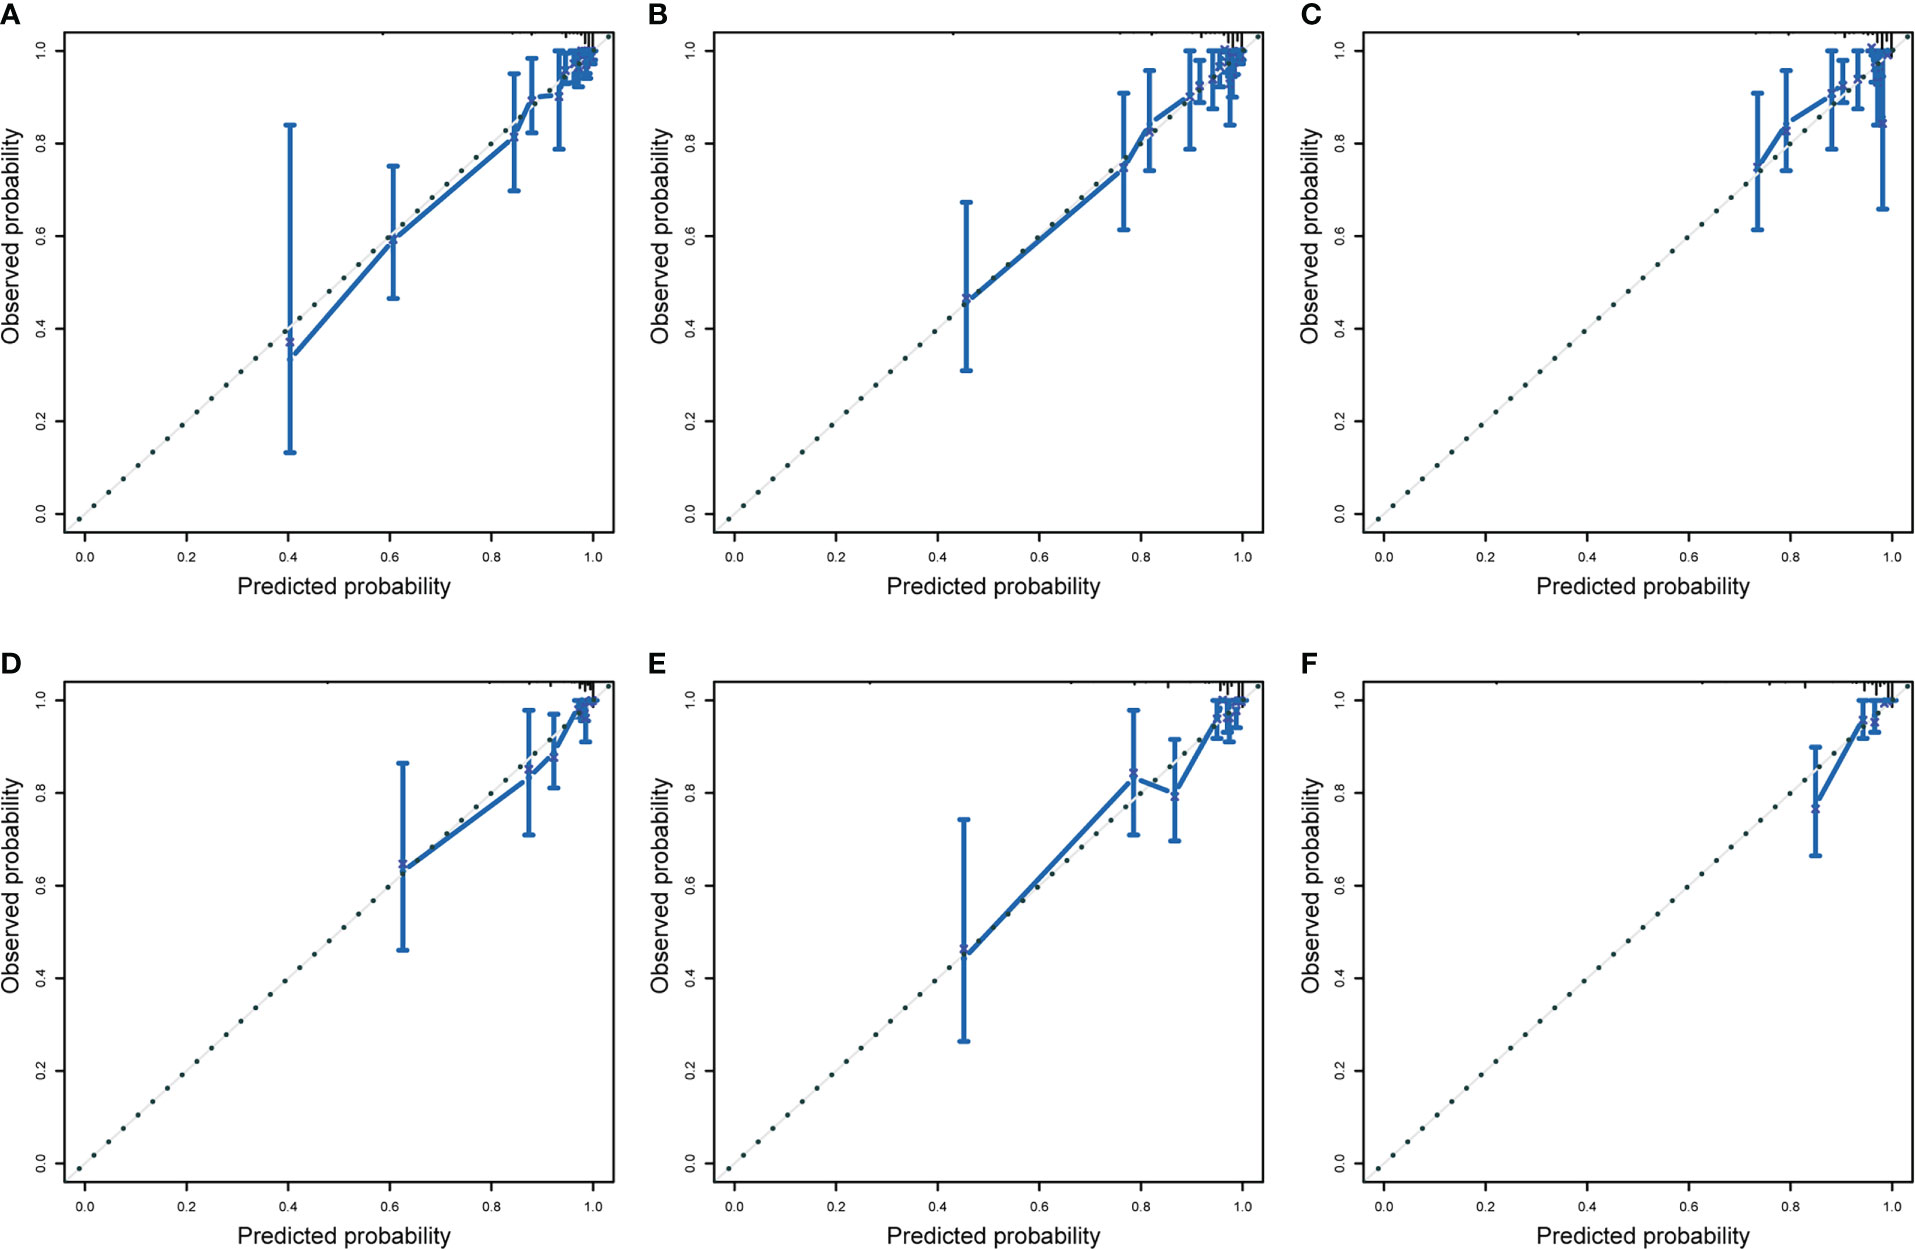
Figure 6 The training set evaluated the calibration curve of 3-year (A), 5-year (B), and 10-year (C) prostate cancer-specific mortality (PCSM) in patients with second primary cancer (SPM) and verified the calibration curve to evaluate 3-year (D), 5-year (E), and 10-year (F) prostate-cancer-specific mortality in patients with SPM. The dotted line indicates that the prediction probability is equal to the observation probability.
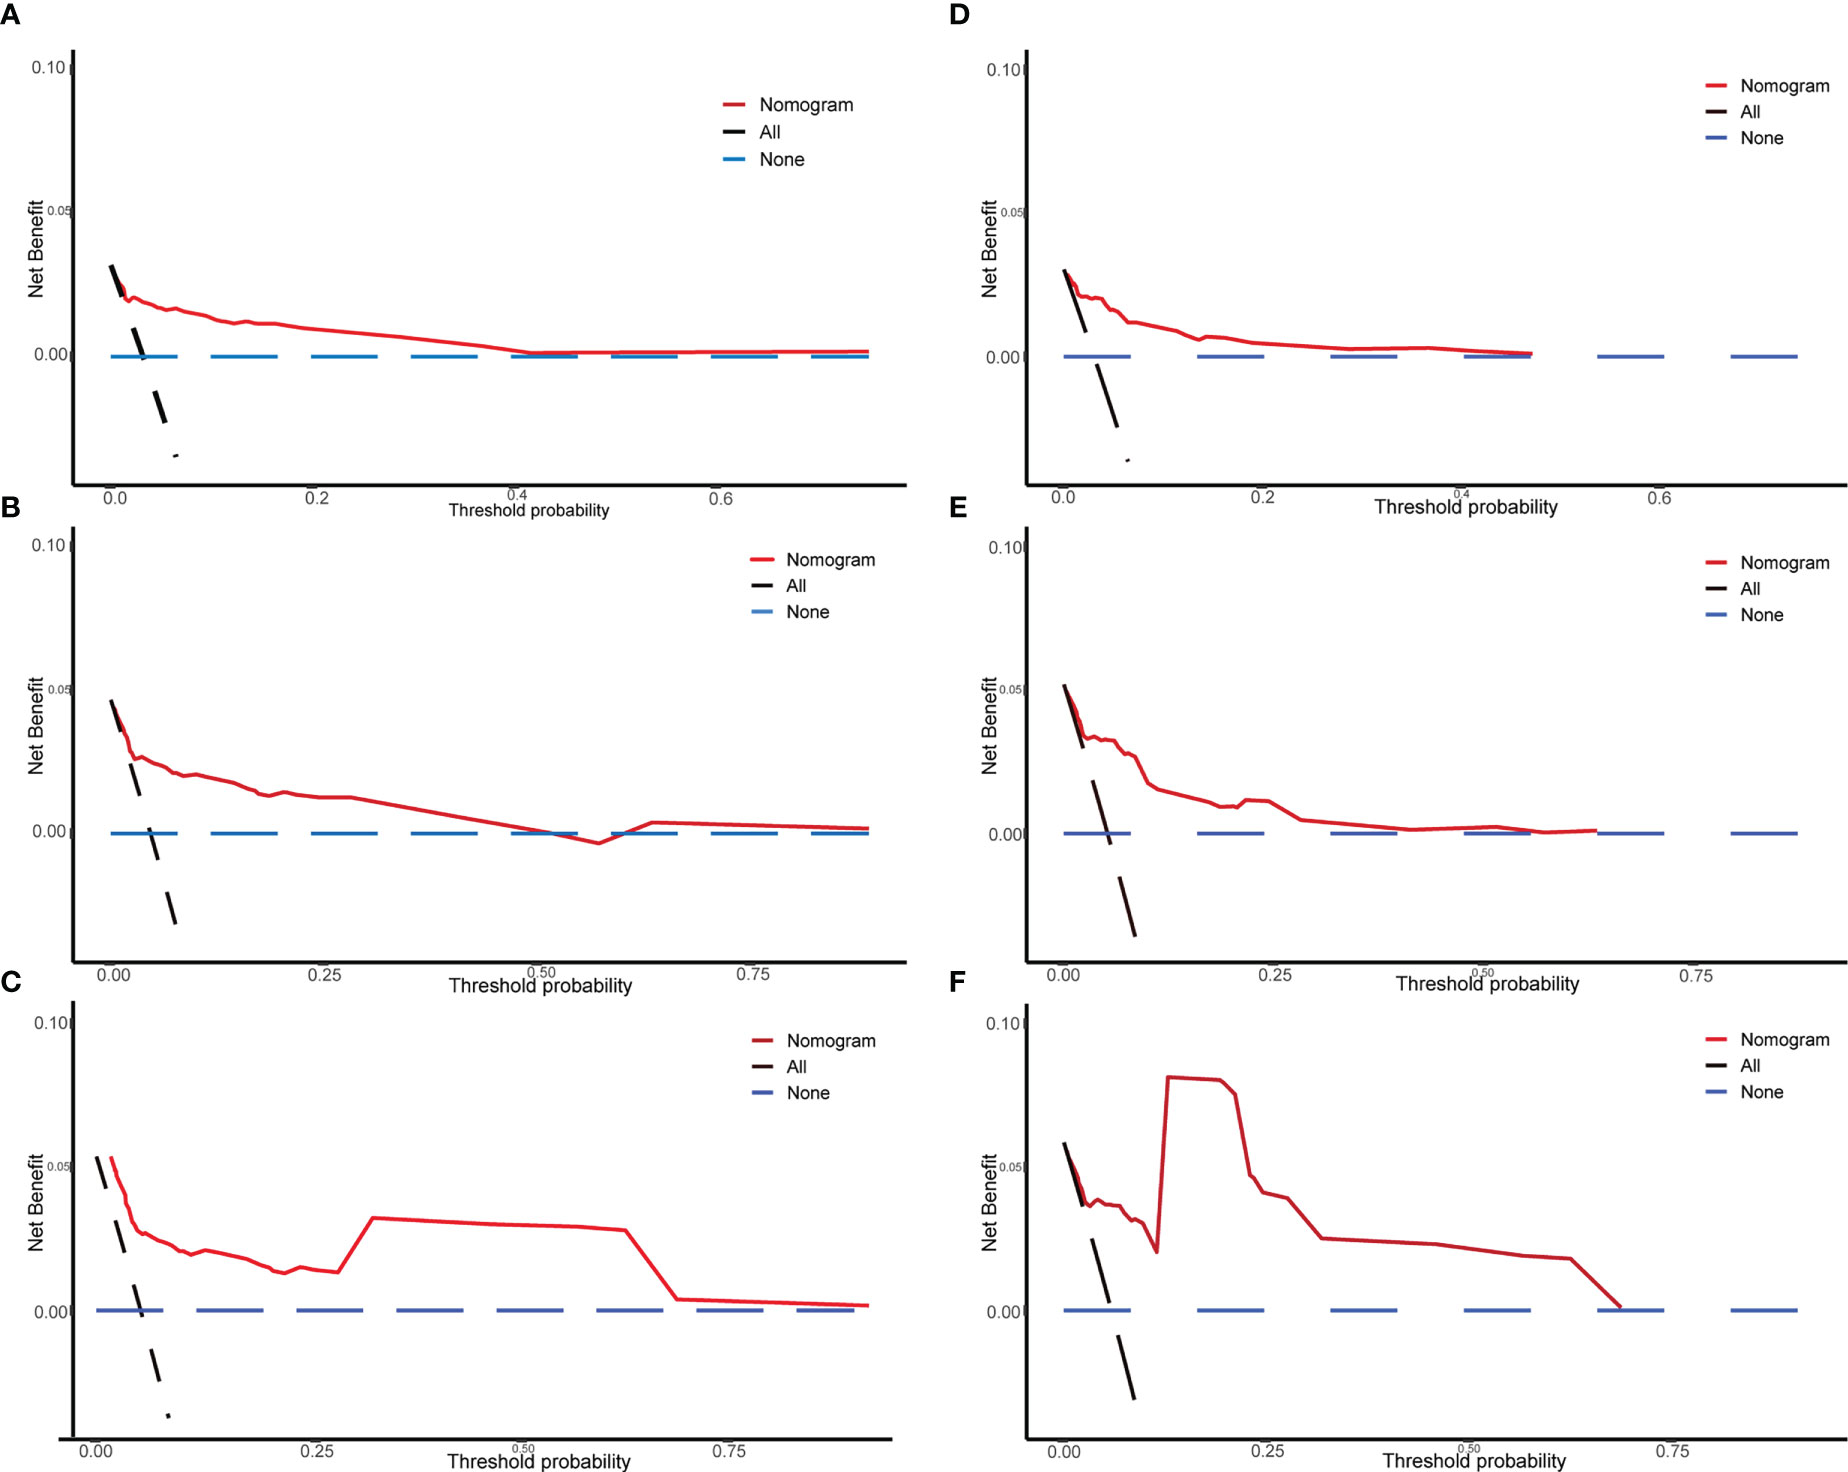
Figure 7 The DCA of the nomogram used in the training and validation sets for predicting prostate-cancer-specific mortality (PCSM). Training set of 3-year (A), 5-year (B), and 10-year (C) PCSM of DCA; verification set of 3-year (D), 5-year (E), and 10-year (F) PCSM of DCA. The Y-axis represents the net benefit, and the X-axis represents the threshold probability.
Discussion
It is reported that the number of cancer survivors in the United States is growing at a rate of 2% a year, and according to SEER, approximately 18% of cancer survivors suffer from SPM for the rest of their lives (1). spPCa is a vital subtype of SPM. Therefore, understanding the disease characteristics of spPCa in patients with multiple primary cancer is beneficial to the treatment and prognosis of disease. This study explored the prognosis of the spPCa, identified four risk factors including race, TNM stage, Gleason score, and radiotherapy associated with the prognosis of spPCa, and constructed a competing risk nomogram that performed well in predicting the 3-, 5-, and 10-year PCSM.
The median follow-up time from the diagnosis of spPCa to death or the end of follow-up was 47 months, which was consistent with a study conducted in the United States. Based on the SEER database, it found that 7,852 (7.85%) of 99,977 primary cancer patients developed spPCa, and one in seven men died of spPCa, with an average follow-up period of 66 months (11). Of the 3,322 patients enrolled in our study, 16.28% of people died of spPCa. Compared with patients with only primary PCa, Wu et al. (12) found that only 1.17% patients died of primary PCa, which was much lower than the proportion of PCa deaths (1.17% vs. 16.28%) in our study. In addition, compared with the mortality rate of primary prostate cancer (7.3%) by the International Agency for Research on Cancer estimates, the mortality rate of spPCa patients was significantly worse than that of primary prostate cancer patients. These data strongly suggested that although PCa is generally considered to be an “indolent” cancer, spPCa is still an important cause of death in SPM. Our current results encourage clinicians to treat patients with spPCa.
Our research showed that the five most common sites of SPM were the urinary system, digestive system, skin, lymphatic system, and respiratory system. Similar to our results, previous Swedish studies reported that the most common SPMs were colorectal cancer, skin cancer, bladder cancer, lung cancer, melanoma, and non-Hodgkin’s lymphoma (13). The urinary system being the most common site could be attributed to common carcinogenic pathways, same histological type, chronic inflammatory stimulation, and genetic mutations (14). These results suggested that these vulnerable sites should be carefully monitored.
The treatments of PCa mainly include waiting for active surveillance or watchful waiting (AS/WW), radical prostatectomy, and radical radiotherapy. Generally speaking, the main indications of AS/WW include T1–2, Gleason < 8, low tumor load at biopsy, life expectancy > 10 years, age > 70–75 years, and PSA lower than 10 ng/ml (12). However, a prospective study in the United States pointed out that active monitoring of low-risk PCa might cause patients to miss the best time for treatment, reducing their survival expectations (15). Similar with our results, we found that surgical treatment could reduce the PCSM of spPCa. However, with the development of surgical technology, radical prostatectomy has become the most common treatment for localized PCa (16). Wilt et al. (17) conducted an intervention study on radical prostatectomy and AS/WW for localized PCa. A total of 731 patients with early PCa were enrolled in the group. During 19.5 years of follow-up (median, 12.7 years), death occurred in 223 of 364 men (61.3%) assigned to surgery and in 245 of 367 (66.8%) assigned to AS/WW (absolute difference in risk, 5.5 percentage points; 95% CI, −1.5 to 12.4; hazard ratio, 0.84; 95% CI, 0.70–1.01; p = 0.06). Treatment for disease progression was less frequent with surgery than with AS/WW (absolute difference, 26.2 percentage points; 95% CI, 19.0–32.9). However, it increased the risk of urinary incontinence, erection, and sexual dysfunction within 10 years. Knipper et al. (18) found that 10-year cancer-specific mortality rates were 19.9% vs. 19.6% in radical prostatectomy vs. external beam radiation therapy patients in cumulative incidence smoothed plots. The difference was not statistically significant. This showed that radiation therapy had the same effect as surgery. Similarly, in our multi-factor competitive risk model, the sdHR of radiotherapy was 0.446. Surgery and radiotherapy should be seriously considered for patients with spPCa because it could improve their cancer-specific survival rate.
Due to the lack of relatively accurate evaluation methods, clinicians often made empirical judgments according to the pathological results, TNM stage, medical imaging data, and physical status of patients (19–21). The identified risk factors were limited to advanced age, family history of tumors, and certain gene mutations (e.g., BRCA1 and BRCA2) (22). Through multivariate Cox regression analysis, Liu (10) found that TNM stage (p < 0.001), site of SPM (p < 0.001), and marital status (p = 0.038) were independent prognostic factors for the OS of SPM. However, in SPM, when there were competitive risk events, using traditional survival analysis methods (Kaplan–Meier method, Cox proportional hazard regression model) would overestimate the risk of diseases studied, resulting in competitive risk bias. Some special studies have found that approximately 46% of the literature may have this bias (23), as some survivors usually die of other causes, such as heart disease, before the occurrence of SPM. Therefore, it was suggested that the competitive risk method based on the sub-distributed risk function should be adopted instead of the traditional method (24, 25). As far as we know, some researchers have established a competitive risk model for multiple primary cancers associated with cecal cancer and colon cancer (26, 27), but there was no competitive risk prediction model for patients with spPCa. We have identified that race, TNM stage, Gleason score, and radiotherapy were associated with the prognosis of spPCa using the competing risk model.
As a suitable scoring tool for clinical research, the nomogram could synthesize the influence of a variety of prognostic factors and present the results intuitively (28, 29). In addition, the pros and cons of a predictive model could be measured by distinguishing ability, calibration, and clinical utility (30, 31). It was worth noting that a model with good differentiation may have poor calibration, so both discrimination and calibration were very important to evaluate a model. We calculated the C index of the training set (0.856) and verification set (0.905) and drew calibration curves and DCA. Results showed that our model could better predict the 3-, 5-, and 10-year PCSM with spPCa.
Although we have explored the prognostic risk factors and treatment options and developed a good predictive model for patients with spPCa, there were still some shortcomings in this study. First of all, the SEER database lacked the necessary clinical information and treatment data, such as tumor biomarkers, transcriptome data, immunotherapy, radiotherapy, and chemotherapy dose, and tumor mutation data (32), which made it impossible for us to make a more detailed and comprehensive analysis of the patients. Second, potential bias may have existed when evaluating patients who died of PCa and FPC together, especially when the prevalence of predominantly latent or subclinical PCa rose with age and nearly half of the men aged 50–70 have latent or subclinical PCa. Finally, reasonably designed, large-scale prospective studies are needed to verify the conclusions of this study.
Conclusion
In conclusion, we identified five risk factors associated with the prognosis of spPCa and constructed a competitive risk nomogram, which performed well in predicting the 3-, 5-, and 10-year PCSM.
Data availability statement
The raw data supporting the conclusions of this article will be made available by the authors, without undue reservation.
Ethics statement
The studies involving human participants were reviewed and approved by Ethics Committee of the Fifth Affiliated Hospital of Zhengzhou University. Written informed consent for participation was not required for this study in accordance with the national legislation and the institutional requirements.
Author contributions
CX, ZK, and DP designed this work. YL, JG, NL and QW integrated and analyzed the data. YY wrote this manuscript. ZK edited and revised the manuscript. All authors approved this manuscript.
Funding
This study was funded by the Health Care Commission of Henan Province (201403125, LHGJ20190422) and the Department of Education of Henan Province (21A320037).
Conflict of interest
The authors declare that the research was conducted in the absence of any commercial or financial relationships that could be construed as a potential conflict of interest.
Publisher’s note
All claims expressed in this article are solely those of the authors and do not necessarily represent those of their affiliated organizations, or those of the publisher, the editors and the reviewers. Any product that may be evaluated in this article, or claim that may be made by its manufacturer, is not guaranteed or endorsed by the publisher.
Abbreviations
SPM, second primary malignancy; spPCa, second primary prostate cancer; SEER, Surveillance, Epidemiology, and End Results; PCSM, prostate-cancer-specific mortality; DCA, decision curve analysis; IQR, interquartile range; FPC, first primary cancer; PCa, prostate cancer; PSA, prostate-specific antigen; K–M, Kaplan–Meier; OS, overall survival; sdHR, sub-distribution hazard ratio; CI, confidence interval; AS/WW, active surveillance or watchful waiting.
References
1. Smyth EC, Tarazona N, Peckitt. C. Exclusion of gastrointestinal cancer patients with prior cancer from clinical T rials: Is this justified? Clin Colorectal Cancer (2016) 15:e53–59. doi: 10.1016/j.clcc.2015.11.003
2. Warren S OG. Multiple primary malignant tumors: A survey of the literature and a statistical study. Am J Cancer (1932) 16:1358–414.
3. Murphy CC, Gerber DE, Pruitt SL. Prevalence of prior cancer among persons newly diagnosed with cancer: An initial report from the surveillance, epidemiology, and end results program. JAMA Oncol (2018) 4:832–6. doi: 10.1001/jamaoncol.2017.3605
4. Lin C, Wu J SD. Impact of prior cancer history on the clinical outcomes in advanced breast cancer: A propensity score-adjusted, population-based study. Cancer Res Treat (2020) 52:552–62. doi: 10.4143/crt.2019.210
5. Capik O, Sanli F, Kurt A, Ceylan O, Suer I, Kaya M, et al. CASC11 promotes aggressiveness of prostate cancer cells through miR-145/IGF1R axis. Prostate Cancer Prostatic Dis (2021) 24(3):891–902. doi: 10.1038/s41391-021-00353-0
6. Carlsson S. Vickers AJ. Screening for Prostate Cancer. Med Clin N Am (2020) 104(6):1051–62. doi: 10.1016/j.mcna.2020.08.007
7. Bray F, Ferlay J, Soerjomataram I, Siegel RL, Torre LA, Jemal A. Global cancer statistics 2018: GLOBOCAN estimates of incidence and mortality worldwide for 36 cancers in 185 countries. CA Cancer J Clin (2018) 68(6):394–424. doi: 10.3322/caac.21492
8. Siegel DA, O'Neil ME, Richards TB, Dowling NF, Weir HK. Prostate cancer incidence and survival, by stage and Race/Ethnicity - United States, 2001-2017. MMWR Morb Mortal Wkly Rep (2020) 69(41):1473–80. doi: 10.15585/mmwr.mm6941a1
9. Murray L, Henry A, Hoskin P, Siebert FA, Venselaar J, PROBATE group of GEC ESTRO. Second primary cancers after radiation for prostate cancer: a systematic review of the clinical data and impact of treatment technique. Radiother Oncol (2014) 110(2):213–28. doi: 10.1016/j.radonc.2013.12.012
10. Liu Y, Zhang P, Zhang Y, Zheng L, Xu W, Hou D, et al. Clinical characteristics and overall survival nomogram of second primary malignancies after prostate cancer, a SEER population-based study. Sci Rep (2021) 11(1):1293. doi: 10.1038/s41598-020-80534-4
11. Dinh KT, Mahal BA, Ziehr DR, Muralidhar V, Chen YW, Viswanathan VB, et al. Risk of prostate cancer mortality in men with a history of prior cancer. BJU Int (2016) 117(6B):E20–28. doi: 10.1111/bju.13144
12. Wu X, Lv D, Eftekhar M, Cai C, Zhao Z, Gu D, et al. Cause-specific mortality of low and selective intermediate-risk prostate cancer patients with active surveillance or watchful waiting. Transl Androl Urol (2021) 10(1):154–63. doi: 10.21037/tau-20-994
13. Chattopadhyay S, Zheng G, Hemminki O, Försti A, Sundquist K, Hemminki K. Prostate cancer survivors: Risk and mortality in second primary cancers. Cancer Med (2018) 7(11):5752–9. doi: 10.1002/cam4.1764
14. Singh A, Kinoshita Y, Rovito PM Jr, Landas S, Silberstein J, Nsouli I, et al. Higher than expected association of clinical prostate and bladder cancers. J Urol (2008) 179(5 Suppl):S2–5. doi: 10.1016/j.juro.2008.03.130
15. Mufarrij P, Sankin A, Godoy G, Lepor HJU. Pathologic outcomes of candidates for active surveillance undergoing radical prostatectomy. Urology (2010) 76:689–92. doi: 10.1016/j.urology.2009.12.075
16. Rebello RJ, Oing C, Knudsen KE, Loeb S, Johnson DC, Reiter RE, et al. Prostate cancer. Nat Rev Dis Primers (2021) 7(1):9. doi: 10.1038/s41572-020-00243-0
17. Wilt TJ, Jones KM, Barry MJ, Andriole GL, Culkin D, Wheeler T, et al. Follow-up of prostatectomy versus observation for early prostate cancer. N Engl J Med (2017) 377(2):132–42. doi: 10.1056/NEJMoa1615869
18. Knipper S, Palumbo C, Pecoraro A, Rosiello G, Tian Z, Briganti A, et al. Survival outcomes of radical prostatectomy vs. external beam radiation therapy in prostate cancer patients with Gleason score 9-10 at biopsy: A population-based analysis. Urol Oncol (2020) 38(3):79 e79–14. doi: 10.1016/j.urolonc.2019.09.015
19. Lowenstein LM, Basourakos SP, Williams MD, Troncoso P, Gregg JR, Thompson TC, et al. Active surveillance for prostate and thyroid cancers: evolution in clinical paradigms and lessons learned. Nat Rev Clin Oncol (2019) 16(3):168–84. doi: 10.1038/s41571-018-0116-x
20. Rouvière O, Puech P, Renard-Penna R, Claudon M, Roy C, Mège-Lechevallier F, et al. Use of prostate systematic and targeted biopsy on the basis of multiparametric MRI in biopsy-naive patients (MRI-FIRST): a prospective, multicentre, paired diagnostic study. Lancet Oncol (2019) 20(1):100–9. doi: 10.1016/S1470-2045(18)30569-2
21. Ström P, Kartasalo K, Olsson H, Solorzano L, Delahunt B, Berney DM, et al. Artificial intelligence for diagnosis and grading of prostate cancer in biopsies: a population-based, diagnostic study. Lancet Oncol (2020) 21(2):222–32. doi: 10.1016/S1470-2045(19)30738-7
22. Leongamornlert D, Mahmud N MT. Germline BRCA1 mutations increase prostate cancer risk. Br J Cancer (2012) 106:697–701. doi: 10.1038/bjc.2012.146
23. Fine JP, Gray RJ. A proportional hazards model for the subdistribution of a competing risk. JASA (1999) 94:496–509. doi: 10.1080/01621459.1999.10474144
24. Han SS, Rivera GA, Tammemagi. MC. Risk stratification for second primary lung cancer. J Clin Oncol (2017) 35:289: 3–9. doi: 10.1200/JCO.2017.72.4203
25. Andersen PK, Geskus RB, de Witte T. Competing risks in epidemiology: possibilities and pitfalls. Int J Epidemiol (2012) 41:61–70. doi: 10.1093/ije/dyr213
26. Lv Z, Liang Y, Liu H, Mo D. Association of chemotherapy with survival in stage II colon cancer patients who received radical surgery: a retrospective cohort study. BMC Cancer (2021) 21:306. doi: 10.1186/s12885-021-08057-3
27. Wu W, Yang J, Li D, Huang Q, Zhao F, Feng X, et al. Competitive risk analysis of prognosis in patients with cecum cancer: A population-based study. Cancer control : Journal of the Moffitt Cancer Center (2021) 28:1073274821989316. doi: 10.1177/1073274821989316
28. Tendulkar RD, Agrawal S, Gao T, Efstathiou JA, Pisansky TM, Michalski JM, et al. Contemporary update of a multi-institutional predictive nomogram for salvage radiotherapy after radical prostatectomy. J Clin Oncol (2016) 34(30):3648–54. doi: 10.1200/JCO.2016.67.9647
29. Walz J, Gallina A, Saad F, Montorsi F, Perrotte P, Shariat SF, et al. A nomogram predicting 10-year life expectancy in candidates for radical prostatectomy or radiotherapy for prostate cancer. J Clin Oncol (2007) 25(24):3576–81. doi: 10.1200/JCO.2006.10.3820
30. Wu J, Zhang H, Li L, Hu M, Chen L, Xu B, et al. A nomogram for predicting overall survival in patients with low-grade endometrial stromal sarcoma: A population-based analysis. Cancer Commun (London, England) (2020) 40(7):301–12. doi: 10.1002/cac2.12067
31. Yu X, Gao S, Xue Q, Tan F, Gao Y, Mao Y, et al. Development of a nomogram for predicting the operative mortality of patients who underwent pneumonectomy for lung cancer: a population-based analysis. Transl Lung Cancer Res (2021) 10(1):381–91. doi: 10.21037/tlcr-20-561
Keywords: second primary malignancy, SEER database, competing risk regression analysis, nomogram, prostate cancer-specific mortality (PSCM)
Citation: Xu C, Pei D, Liu Y, Guo J, Liu N, Wang Q, Yu Y and Kang Z (2023) Clinical characteristics and prostate-cancer-specific mortality of competitive risk nomogram in the second primary prostate cancer. Front. Oncol. 13:918324. doi: 10.3389/fonc.2023.918324
Received: 12 April 2022; Accepted: 09 March 2023;
Published: 16 May 2023.
Edited by:
Fabio Grizzi, Humanitas Research Hospital, ItalyReviewed by:
Shengming Jin, Fudan University, ChinaYongqiang Yu, First Affiliated Hospital of Anhui Medical University, China
Copyright © 2023 Xu, Pei, Liu, Guo, Liu, Wang, Yu and Kang. This is an open-access article distributed under the terms of the Creative Commons Attribution License (CC BY). The use, distribution or reproduction in other forums is permitted, provided the original author(s) and the copyright owner(s) are credited and that the original publication in this journal is cited, in accordance with accepted academic practice. No use, distribution or reproduction is permitted which does not comply with these terms.
*Correspondence: Zhengjun Kang, a3pqNzE1M0BzaW5hLmNvbQ==
†These authors have contributed equally to this work