 Lu Zhou
 Yan Li
 Chaoyong Wu
 Chongxiang Xue
 Xihong Wang
- 1Traditional Chinese Medicine (Zhong Jing) School, Henan University of Chinese Medicine, Zhengzhou, Henan, China
- 2Shenzhen Hospital of Beijing University of Chinese Medicine, Shenzhen, China
- 3Graduate School, Beijing University of Chinese Medicine, Beijing, China
- 4The First Affiliated Hospital of Henan University of Chinese Medicine, Zhengzhou, Henan, China
Background: Radiomics have been increasingly used in the clinical management of hepatocellular carcinoma (HCC), such as markers prediction. Ki-67 and cytokeratin 19 (CK-19) are important prognostic markers of HCC. Radiomics has been introduced by many researchers in the prediction of these markers expression, but its diagnostic value remains controversial. Therefore, this review aims to assess the diagnostic value of radiomics in predicting Ki-67 and CK-19 expression in HCC.
Methods: Original studies were systematically searched in PubMed, EMBASE, Cochrane Library, and Web of Science from inception to May 2023. All included studies were evaluated by the radiomics quality score. The C-index was used as the effect size of the performance of radiomics in predicting Ki-67and CK-19 expression, and the positive cutoff values of Ki-67 label index (LI) were determined by subgroup analysis and meta-regression.
Results: We identified 34 eligible studies for Ki-67 (18 studies) and CK-19 (16 studies). The most common radiomics source was magnetic resonance imaging (MRI; 25/34). The pooled C-index of MRI-based models in predicting Ki-67 was 0.89 (95% CI:0.86–0.92) in the training set, and 0.87 (95% CI: 0.82–0.92) in the validation set. The pooled C-index of MRI-based models in predicting CK-19 was 0.86 (95% CI:0.81–0.90) in the training set, and 0.79 (95% CI: 0.73–0.84) in the validation set. Subgroup analysis suggested Ki-67 LI cutoff was a significant source of heterogeneity (I2 = 0.0% P>0.05), and meta-regression showed that the C-index increased as Ki-67 LI increased.
Conclusion: Radiomics shows promising diagnostic value in predicting positive Ki-67 or CK-19 expression. But lacks standardized guidelines, which makes the model and variables selection dependent on researcher experience, leading to study heterogeneity. Therefore, standardized guidelines are warranted for future research.
Systematic Review Registration: https://www.crd.york.ac.uk/PROSPERO/, identifier CRD42023427953.
1 Introduction
Hepatocellular carcinoma (HCC) is the most common primary liver malignancy. HCC ranks sixth in cancer incidence and third in cancer mortality, and has a 5-year survival rate of <20% (1, 2). Surgical resection is currently the preferred treatment for HCC (3). Unfortunately, HCC patients have poor prognosis, and the 5-year recurrence rate following liver resection ranges from 50% to 70% (4). Therefore, the identification of prognostic factors for HCC is important for developing and improving HCC treatments and prognosis.
Several factors such as microvascular invasion (MVI), tumor grade, Ki-67 and CK-19 expression are closely associated with HCC prognosis (5–7). Ki-67 is a cell proliferation marker present in all active stages of cell cycle and can reflect HCC progression. Positive Ki-67 expression often implies a biologically invasive phenotype in HCC as well as poor overall survival (8, 9). In addition, a study further found that Ki-67 protein expression level is an independent predictor for tumor growth rate and poor prognosis in HCC (10). For the patients with high Ki-67 expression, adjuvant hepatic arterial chemoembolization has been shown to decrease the risk of tumor recurrence after liver tumor resection and prolong the overall survival (11). In addition, systematic chemotherapy based on transarterial chemoembolization are also effective treatments for HCC (12). CK-19 is a cytoskeletal protein mainly found in epithelial cells, such as hepatocytes, biliary epithelial cells, and intrahepatic bile duct cells. High CK-19 expression is significantly associated with poor survival and early tumor recurrence in HCC patients (13). Furthermore, CK-19 was found to be valuable for distinguishing HCC from extrahepatic metastatic tumors (14). Nonetheless, CK-19 positive HCC patients were shown to be more likely to develop drug resistance and fail chemotherapy (15). And further study showed that patients with positive CK-19 expression can benefit from regorafenib, which facilitates the development of personalized therapy for HCC (16). Hence, CK-19 is not only a prognostic marker but also a potential therapeutic target for HCC. Therefore, Ki-67 and CK-19 expression levels in HCC are important for determining the course of disease, prognosis and treatment options.
Based on the above, accurate measurement of Ki-67 and CK-19 expression status helps to guide surveillance and adjuvant treatment strategies. At present, Ki-67 or CK-19 expression is primarily measured by immunohistochemistry. Nevertheless, tumor tissue biopsies are subject to sampling errors and false-negative results, and the procedure increases the risks of complications such as subcapsular hemorrhage and needle tract metastases.
Radiomics is a medical imaging technique that extracts quantitative imaging features from medical images with the help of computer software and selects valuable features by statistical and/or machine learning methods for the analysis of disease characterization, efficacy evaluation and prognosis prediction (17). In cancer research, radiomics has been shown to be useful in identifying tumor pathology information in medical imaging, such as tumor grade, progression and gene expression, without the need of tumor biopsy, thus allowing non-invasive detection of tumor pathology at multiple time points (18). Therefore, radiomics in combination with dynamic detection of Ki-67 and CK-19 expression is useful for timely assessment of HCC progression, and has important clinical implications in early HCC intervention and expansion of the treatment window for patients.
In recent years, numerous studies have constructed radiomics models for predicting Ki-67 or CK19 status based on magnetic resonance imaging (MRI), computed tomography (CT) or ultrasound (US) images. However, the diagnostic accuracy of these radiomics models has been inconsistent. Therefore, this systematic review and meta-analysis was performed to assess the accuracy of radiomics in predicting Ki-67 and CK-19 expression in HCC.
2 Methods
2.1 Study registration
This study was conducted in accordance with the Preferred Reporting Item for Systematic Reviews and Meta-Analysis (PRISMA 2020) and was registered on PROSPERO (CRD42023427953).
2.2 Eligibility criteria
2.2.1 Inclusion criteria
(1) Studies that used radiomics for predicting Ki-67 or CK-19 expression in HCC.
(2) HCC was diagnosed by any recognized diagnostic criteria.
(3) Studies that provided a clear description of Ki-67 or CK-19 expression status.
(4) Cohort, observational, prospective, retrospective, multi-center or case-control studies that assessed the diagnostic value of radiomics in predicting Ki-67 and CK-19 expression in HCC.
2.2.2 Exclusion criteria
(1) Studies with controversial diagnostic criteria for HCC.
(2) Studies that lacked a clear description of Ki-67 or CK-19 expression status.
(3) Review, meta-analysis, case report, expert comment, letter, and conference abstract.
(4) Only comparative analysis of radiomics features, but no diagnostic model was constructed.
(5) Diagnostics models with missing outcome measures (e.g., ROC, C-statistic, C-index, sensitivity, specificity, accuracy, precision, recall, F1 score, confusion matrix, diagnostic contingency table).
(6) Image segmentation and reconstruction were performed, but the diagnostic value of segmentation or reconstruction for predicting high Ki-67 or CK-19 expression was not reported.
2.3 Data sources and search strategy
Relevant studies were systematically searched in PubMed, Web of Science, Embase, and Cochrane Library from inception to May 10, 2023 using the MeSH and entry terms “radiomics,” “Ki-67,” “CK-19”, and “hepatocellular carcinoma”. The search strategy is shown in Supplementary Table 1. The reference lists of included studies were also manually searched to identify any relevant articles.
2.4 Study selection and data extraction
All retrieved studies were imported into Endnote 20, and duplicates were removed. After screening the titles and abstracts, the full texts of potentially eligible studies were downloaded for further assessment. Data were extracted into a standard data extraction table, including first author, country, year of publication, model, number of patients, radiomics source (e.g., MRI, CT, PET), feature source (e.g., radiomics or radiomics and clinical risk factors), and model (e.g., logistic regression). In addition, C-index or area under the receiver operating characteristic curve (AUROC), sensitivity, specificity, and accuracy were also extracted for data processing and forest plot generation. C-index was the primary outcome measure of this systematic review.
Study selection and data extraction were completed by two independent researchers, and any disagreement was resolved by a third researcher.
2.5 Quality assessment
Risk of bias and methodological quality were examined by two independent researchers according to the radiomics quality score (RQS) (18). The RQS is a standardized evaluation and reporting guideline that minimizes bias and enhances the usefulness of radiomics-based prediction models. This scale has 16 key components and a maximum score of 36 points. A higher QRS indicates higher quality. Discrepancies in quality score assessment were resolved by re-assessment and discussion.
2.6 Outcomes
The primary outcome measures of this study included the C-index of radiomics in the prediction of Ki-67 and CK-19 expression, as well as sensitivity and specificity. C-index is the probability that a correct diagnosis of Ki-67 or CK-19 coincides with the actual observed results. Moreover, in medical diagnosis, sensitivity and specificity are also important metrics for assessing the accuracy of diagnostic methods. Sensitivity refers to the ability of the test method to correctly determine the presence of a disease. Specificity refers to the ability of a test method to correctly determine that the patient does not have a certain disease. Improving sensitivity and specificity can help avoid missed diagnosis and misdiagnosis, respectively.
2.7 Synthesis methods
In the meta-analysis of C-index, the I2 statistic was used to measure the variation across studies due to heterogeneity rather than sampling error, and is expressed as a percentage of total variation. When I2> 50%, which indicates statistical heterogeneity, a random effects model was used for analysis; otherwise, a fixed effects model was used. In addition, the meta-analysis of sensitivity and specificity was performed using a bivariate mixed effects model based on the diagnostic contingency table. The diagnostic contingency table was estimated using sensitivity, specificity, precision, accuracy, number of positive cases, and total number of cases. All analyses were performed using Stata SE version 15.
2.8 Data cleaning and preprocessing
For data cleaning and preprocessing, C-index, sensitivity, specificity, and confidence interval (CI) values were first unified with all decimals retained. Missing C-index value, 95% CI or standard error was imputed according to the Debray methods (19). When only the ROC was provided in the original study, sensitivity and specificity were extracted under different probability cutoff values using Origin 2021 and summed to generate the diagnostic contingency table.
2.9 Subgroup analysis
Subgroup analysis was performed to identify potential influencing factors, including the positive Ki-67 threshold, internal and external validation, and use of radiomics in combination with clinical risk factors.
Since different positive Ki-67 thresholds have been reported in the original studies, a subgroup analysis was needed to identify whether this metric is a contributor of heterogeneity.
External validation refers to the verification of the performance of a diagnostic model, which is constructed based on the data from one hospital, with data from other hospitals, or collection of new data for model validation. Internal validation refers to the verification of model performance using data from the same hospital as that used for model construction. However, these data are often randomly shuffled such that part of the data is used for model construction and the other for model validation. Since the samples for external validation are derived from other medical institutions or newly collected samples, while those for internal validation is often randomly shuffled and selected, a subgroup analysis was conducted to determine if the difference in validation data selection was a source of heterogeneity.
Moreover, some of the original studies utilized radiomics combined with clinical risk factors to predict Ki-67 or CK-19, while others employed radiomics alone to make the predictions. Therefore, subgroup analysis was performed to assess whether these two different approaches contribute to the heterogeneity across studies.
3 Results
3.1 Study selection
Of the initially identified 1637 studies, 647 were removed due to duplication, and 954 were excluded due to ineligibility. The remaining 36 full-text studies were independently assessed by two reviewers, and a final total of 34 studies (20–53) were included in our systematic review. The study selection process is outlined in Figure 1.

Figure 1 Literature screening process.
3.2 Study characteristics
A total of 4300 samples were involved (2002 samples in Ki-67 models, 2298 samples in CK-19 models) in the 34 included studies. Among the included studies, 18 (20–37) focused on Ki-67 and 16 (38–53) focused on CK-19. The samples of the included studies came from different hospitals, with six studies from multiple centers and the rest from single centers (33, 37, 42, 44, 48, 53). In all included studies, diagnostic models for Ki-67 or CK-19 were constructed based on radiomics for HCC, thus meeting the needs of this study. Positive Ki-67 expression was defined by different thresholds in different studies, with 10% label index (LI) being the main positive threshold, and the proportion of positive samples ranged from 0.30 to 0.83. The positive threshold for CK-19 was 5% LI, and the proportion of positive samples ranged from 0.14 to 0.41. Most studies were conducted in China (32 out of 34), and nearly half of them were published in 2022 and 2023 (16 out of 34). MRI was the most common radiomics source (25 out of 34), and logistic regression was the most common algorithm for model construction (28 out of 34). Nineteen studies used both radiomics and clinical risk factors for modeling whereas 15 studies used only radiomics. The basic characteristics of the included studies are provided in Table 1.
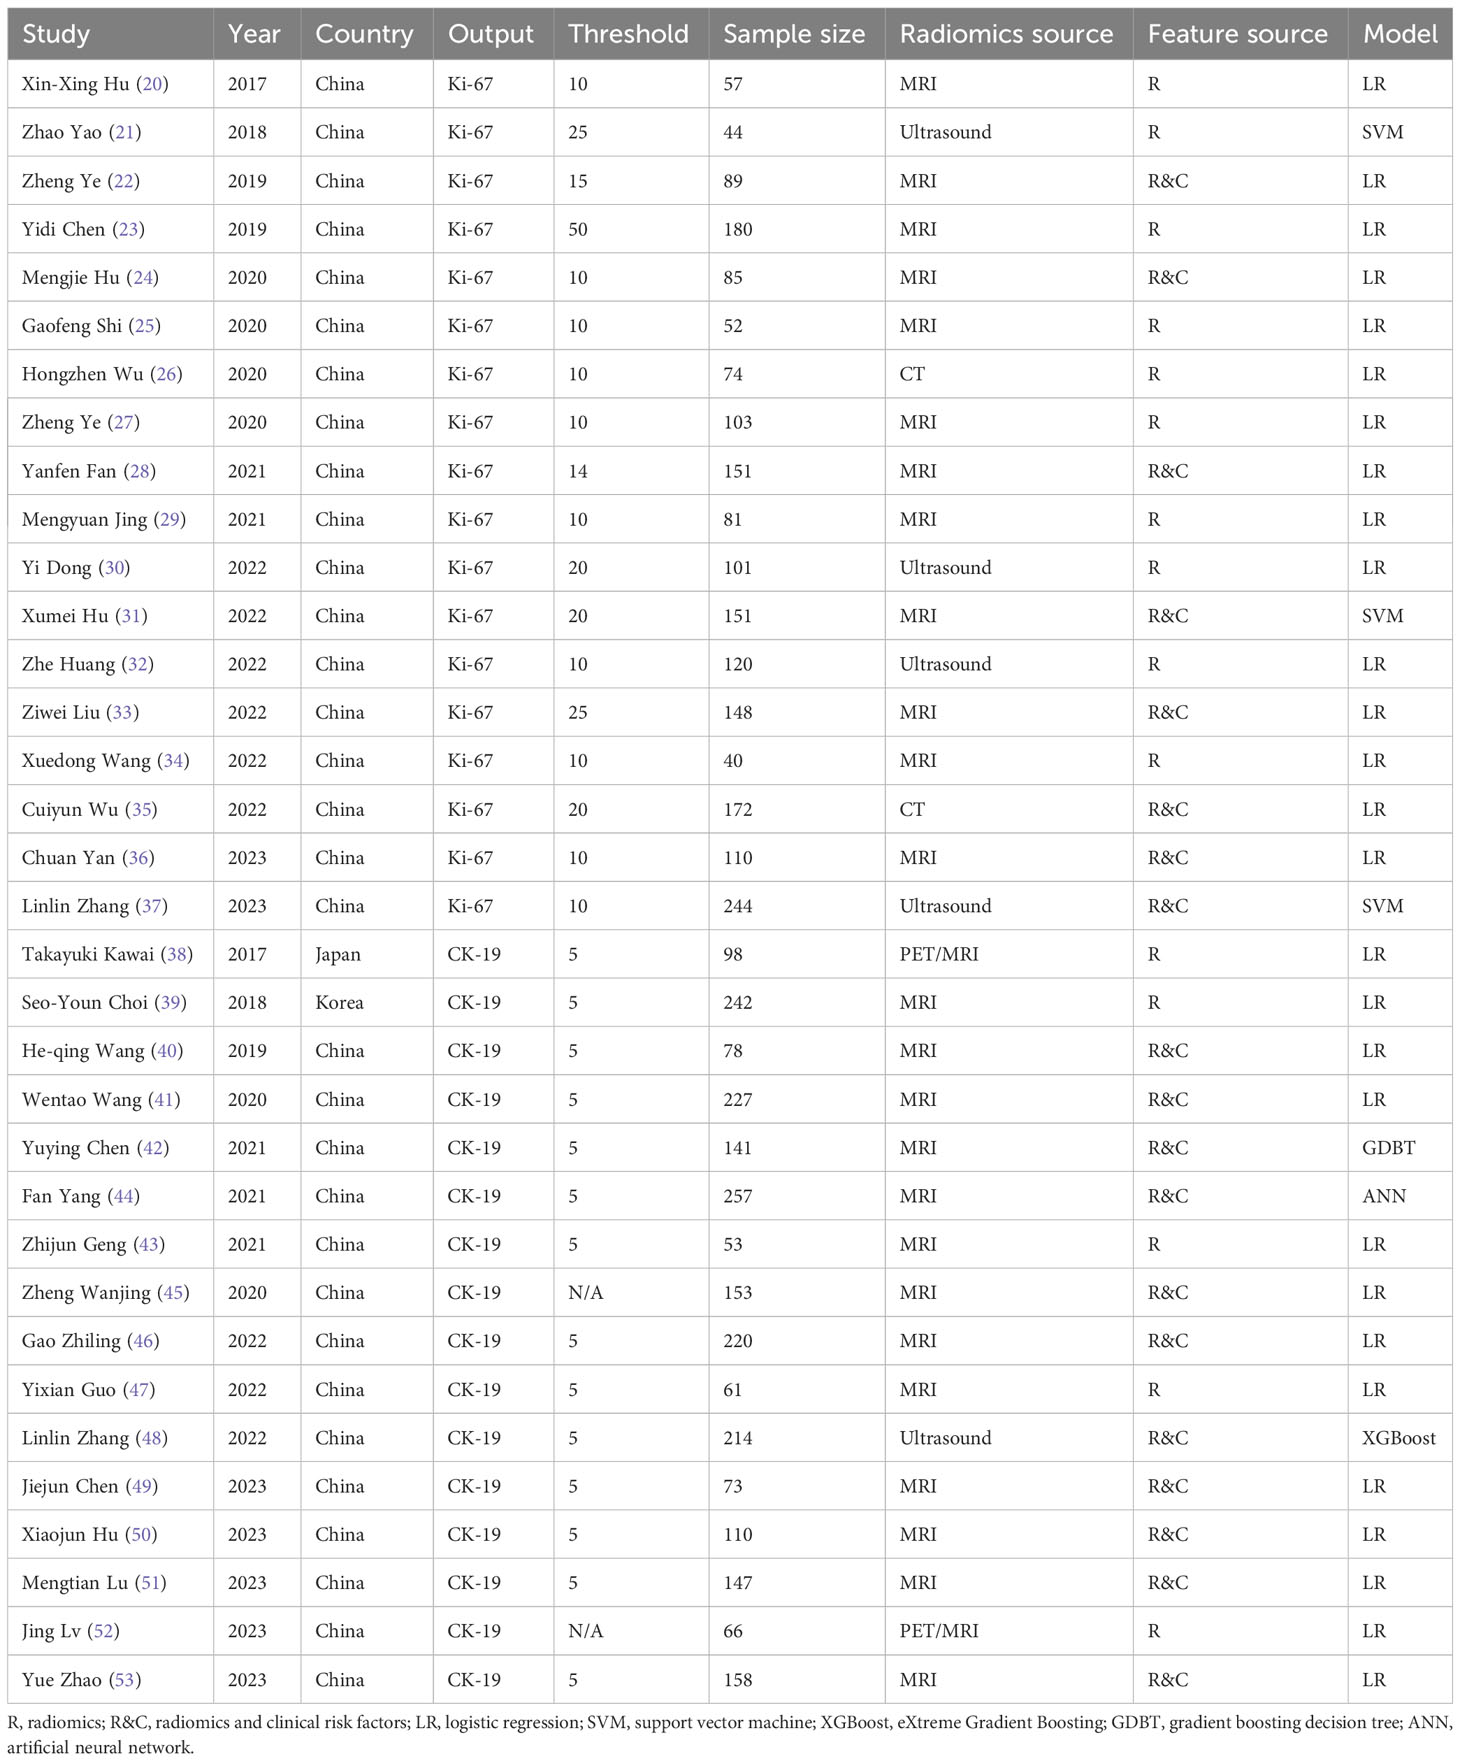
Table 1 Study characteristics.
3.3 Quality assessment
As show in Table 2. All studies but one scored below 50% (18 scores) of total RQS score. Strikingly, all studies failed to register in a trial database, and none of the included studies investigated the cost-effectiveness or opened data. RQS has no qualitative quality criteria. The higher the score, the higher the quality. The scores of all studies ranged from 5 to 18, with an average of 11.91, which exceeded 30% of the total RQS score.
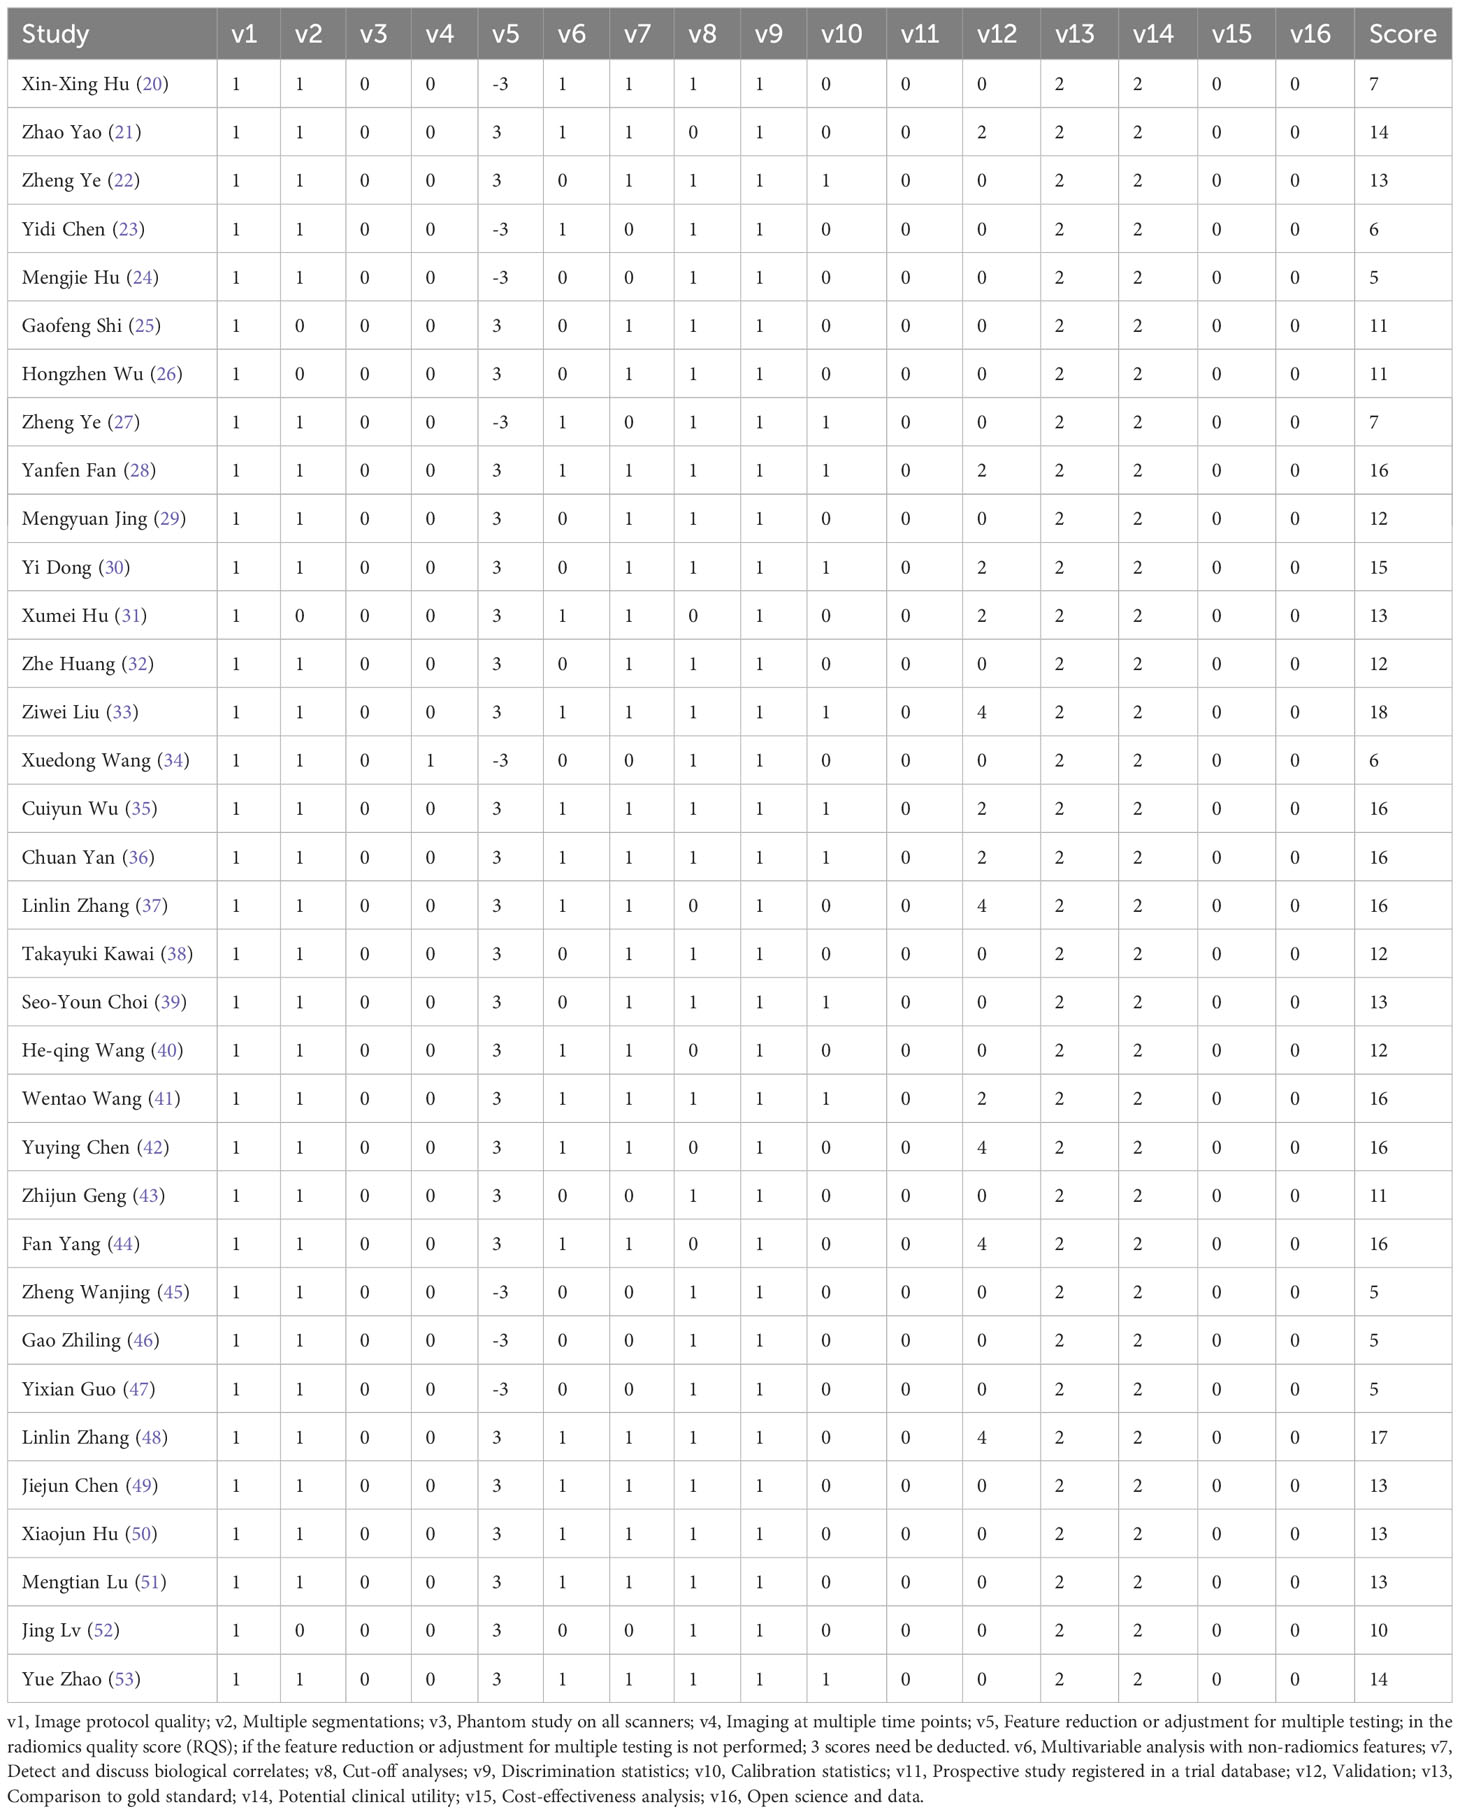
Table 2 Radiomics quality score.
3.4 Meta-analyses
3.4.1 Ki-67
(1) Synthesized results
The results of MRI-, CT- and US-based models for predicting Ki-67 expression were synthesized separately in both the training sets (Figure 2) and validation sets (Figure 3). In the training sets, the C-index was 0.89 (95% CI:0.86–0.92) for MRI-based models, 0.87 (95% CI: 0.82–0.92) for CT-based models, and 0.83 (95% CI: 0.61–1.00) for US-based models. In the validation sets, the C-index was 0.87 (95% CI: 0.82–0.92) for MRI-based models, 0.82 (95% CI: 0.71–0.93) for CT-based models, and 0.85 (95% CI: 0.75–0.94) for US-based models.
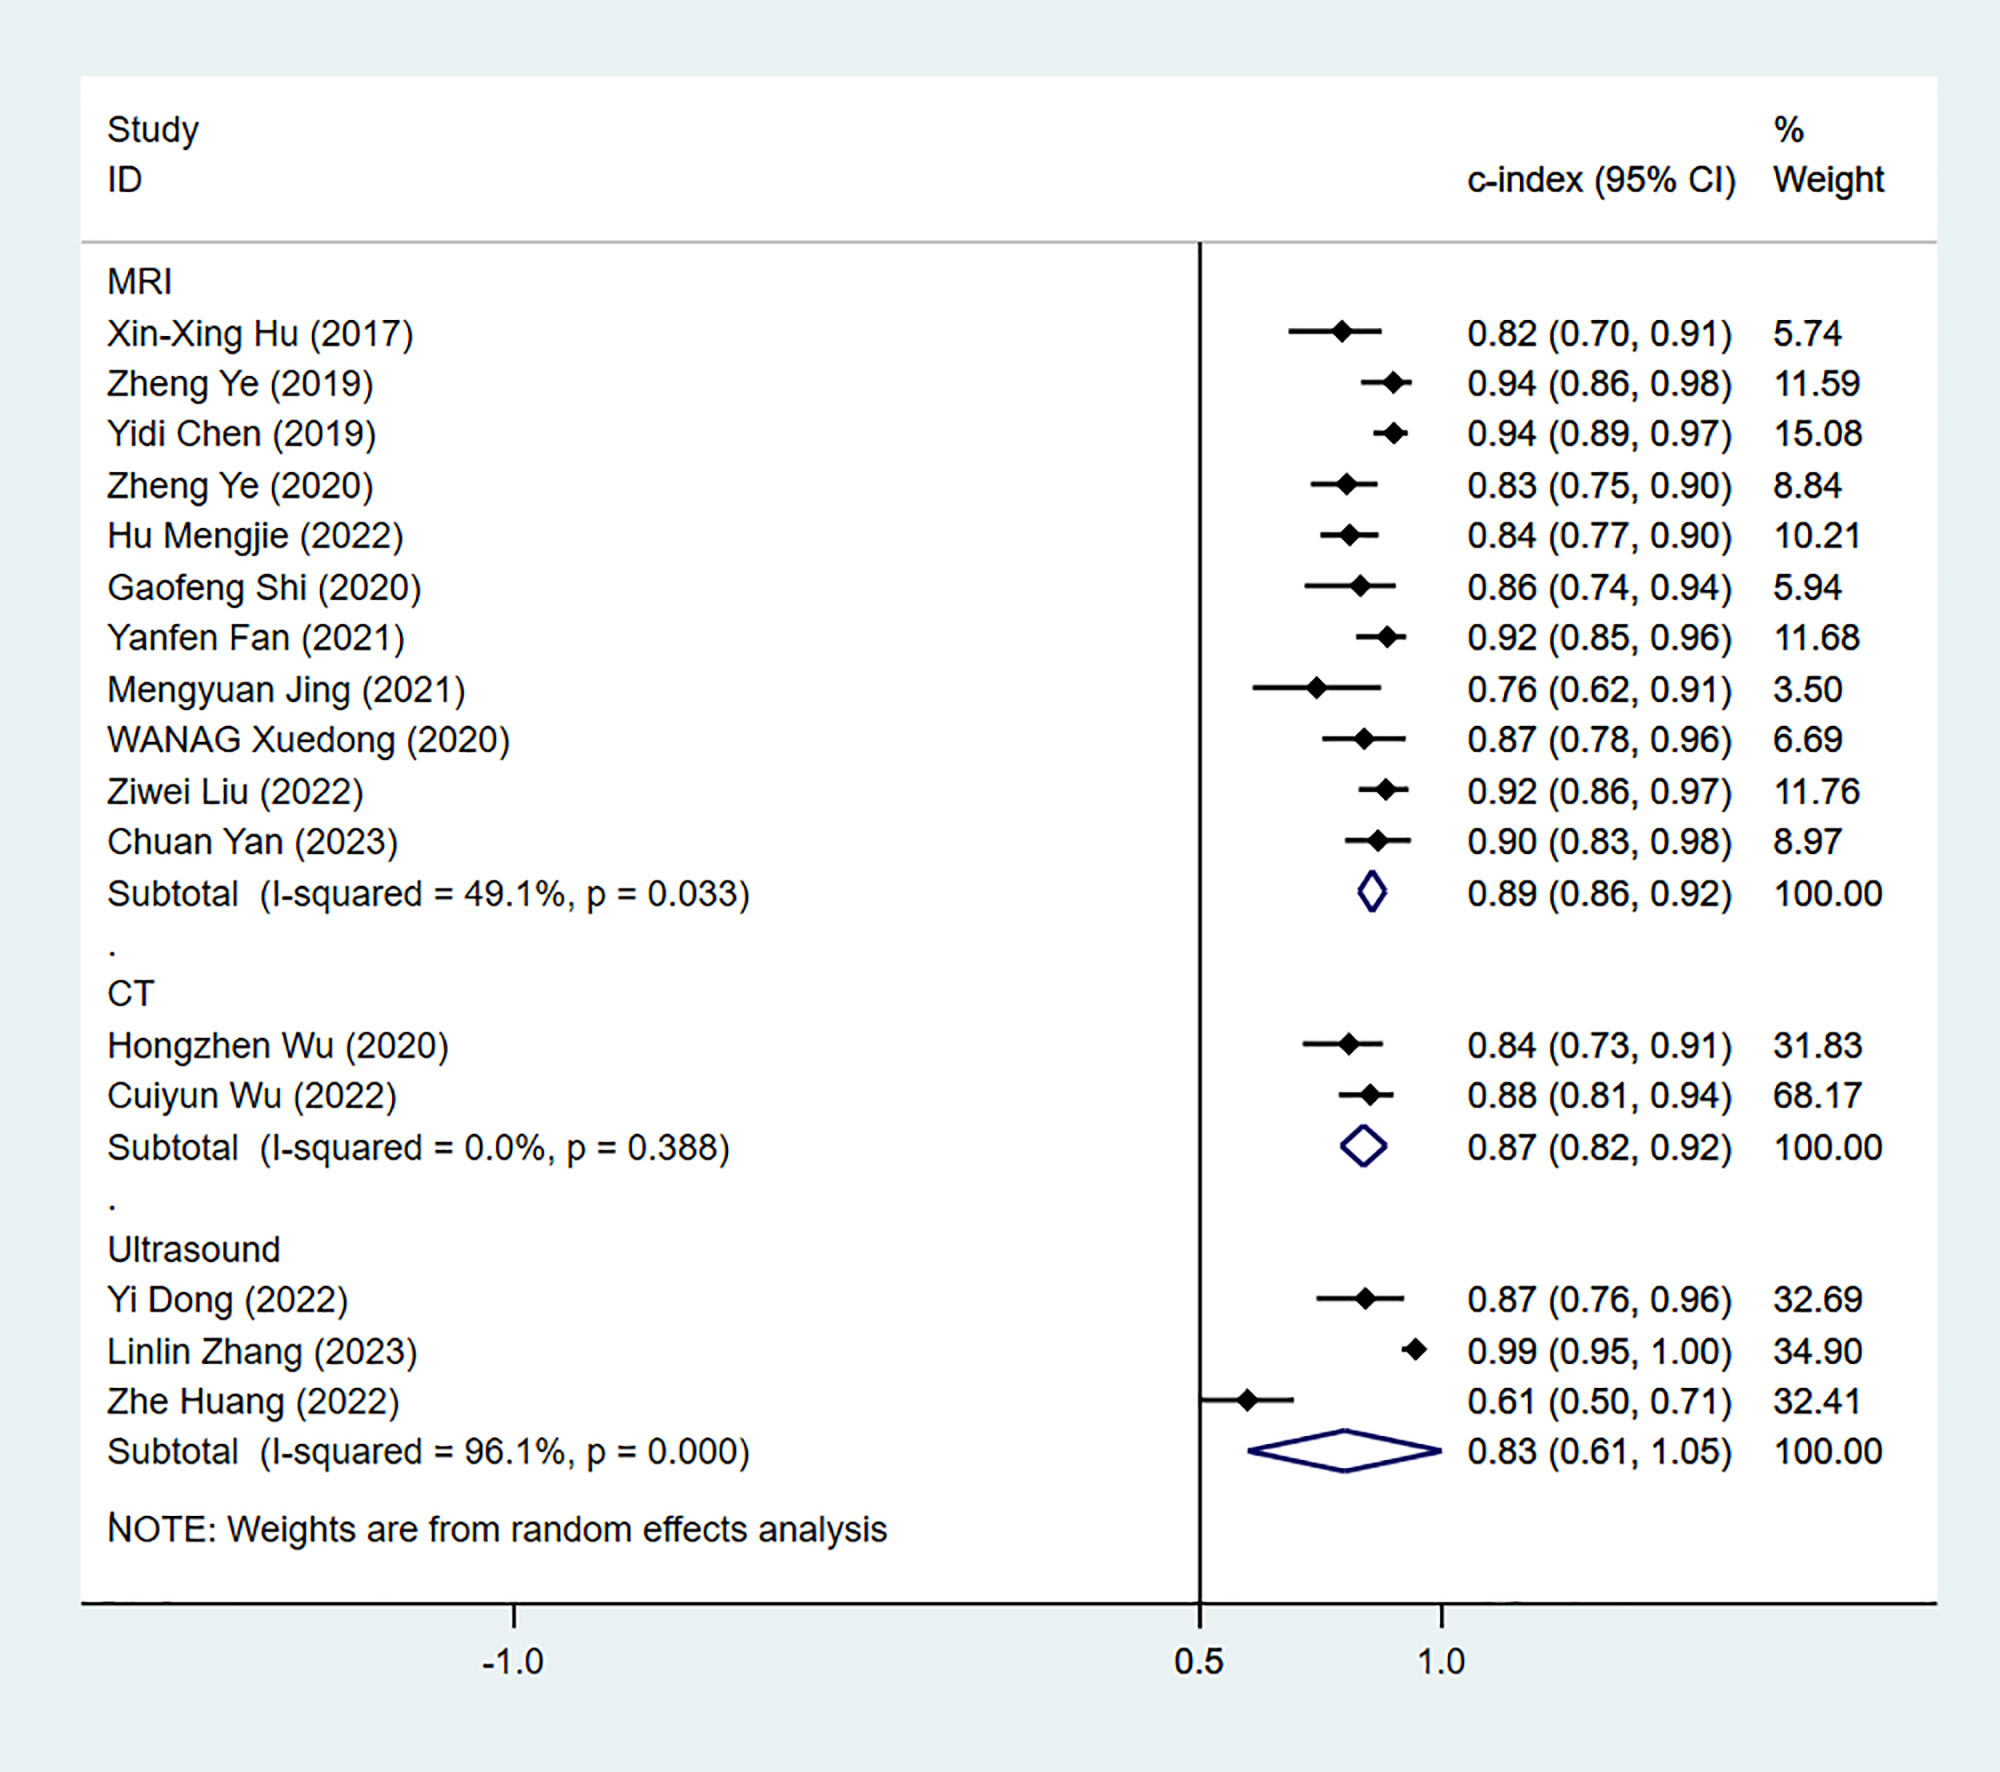
Figure 2 Forest plots for C-index of Ki-67 in the training set. [(1): Since the C-index estimates are synthesized, the invalid line is 0.5. (2) 95% confidence interval (CI) is depicted as the horizontal line. The hollow diamond represents the pooled C-index.].
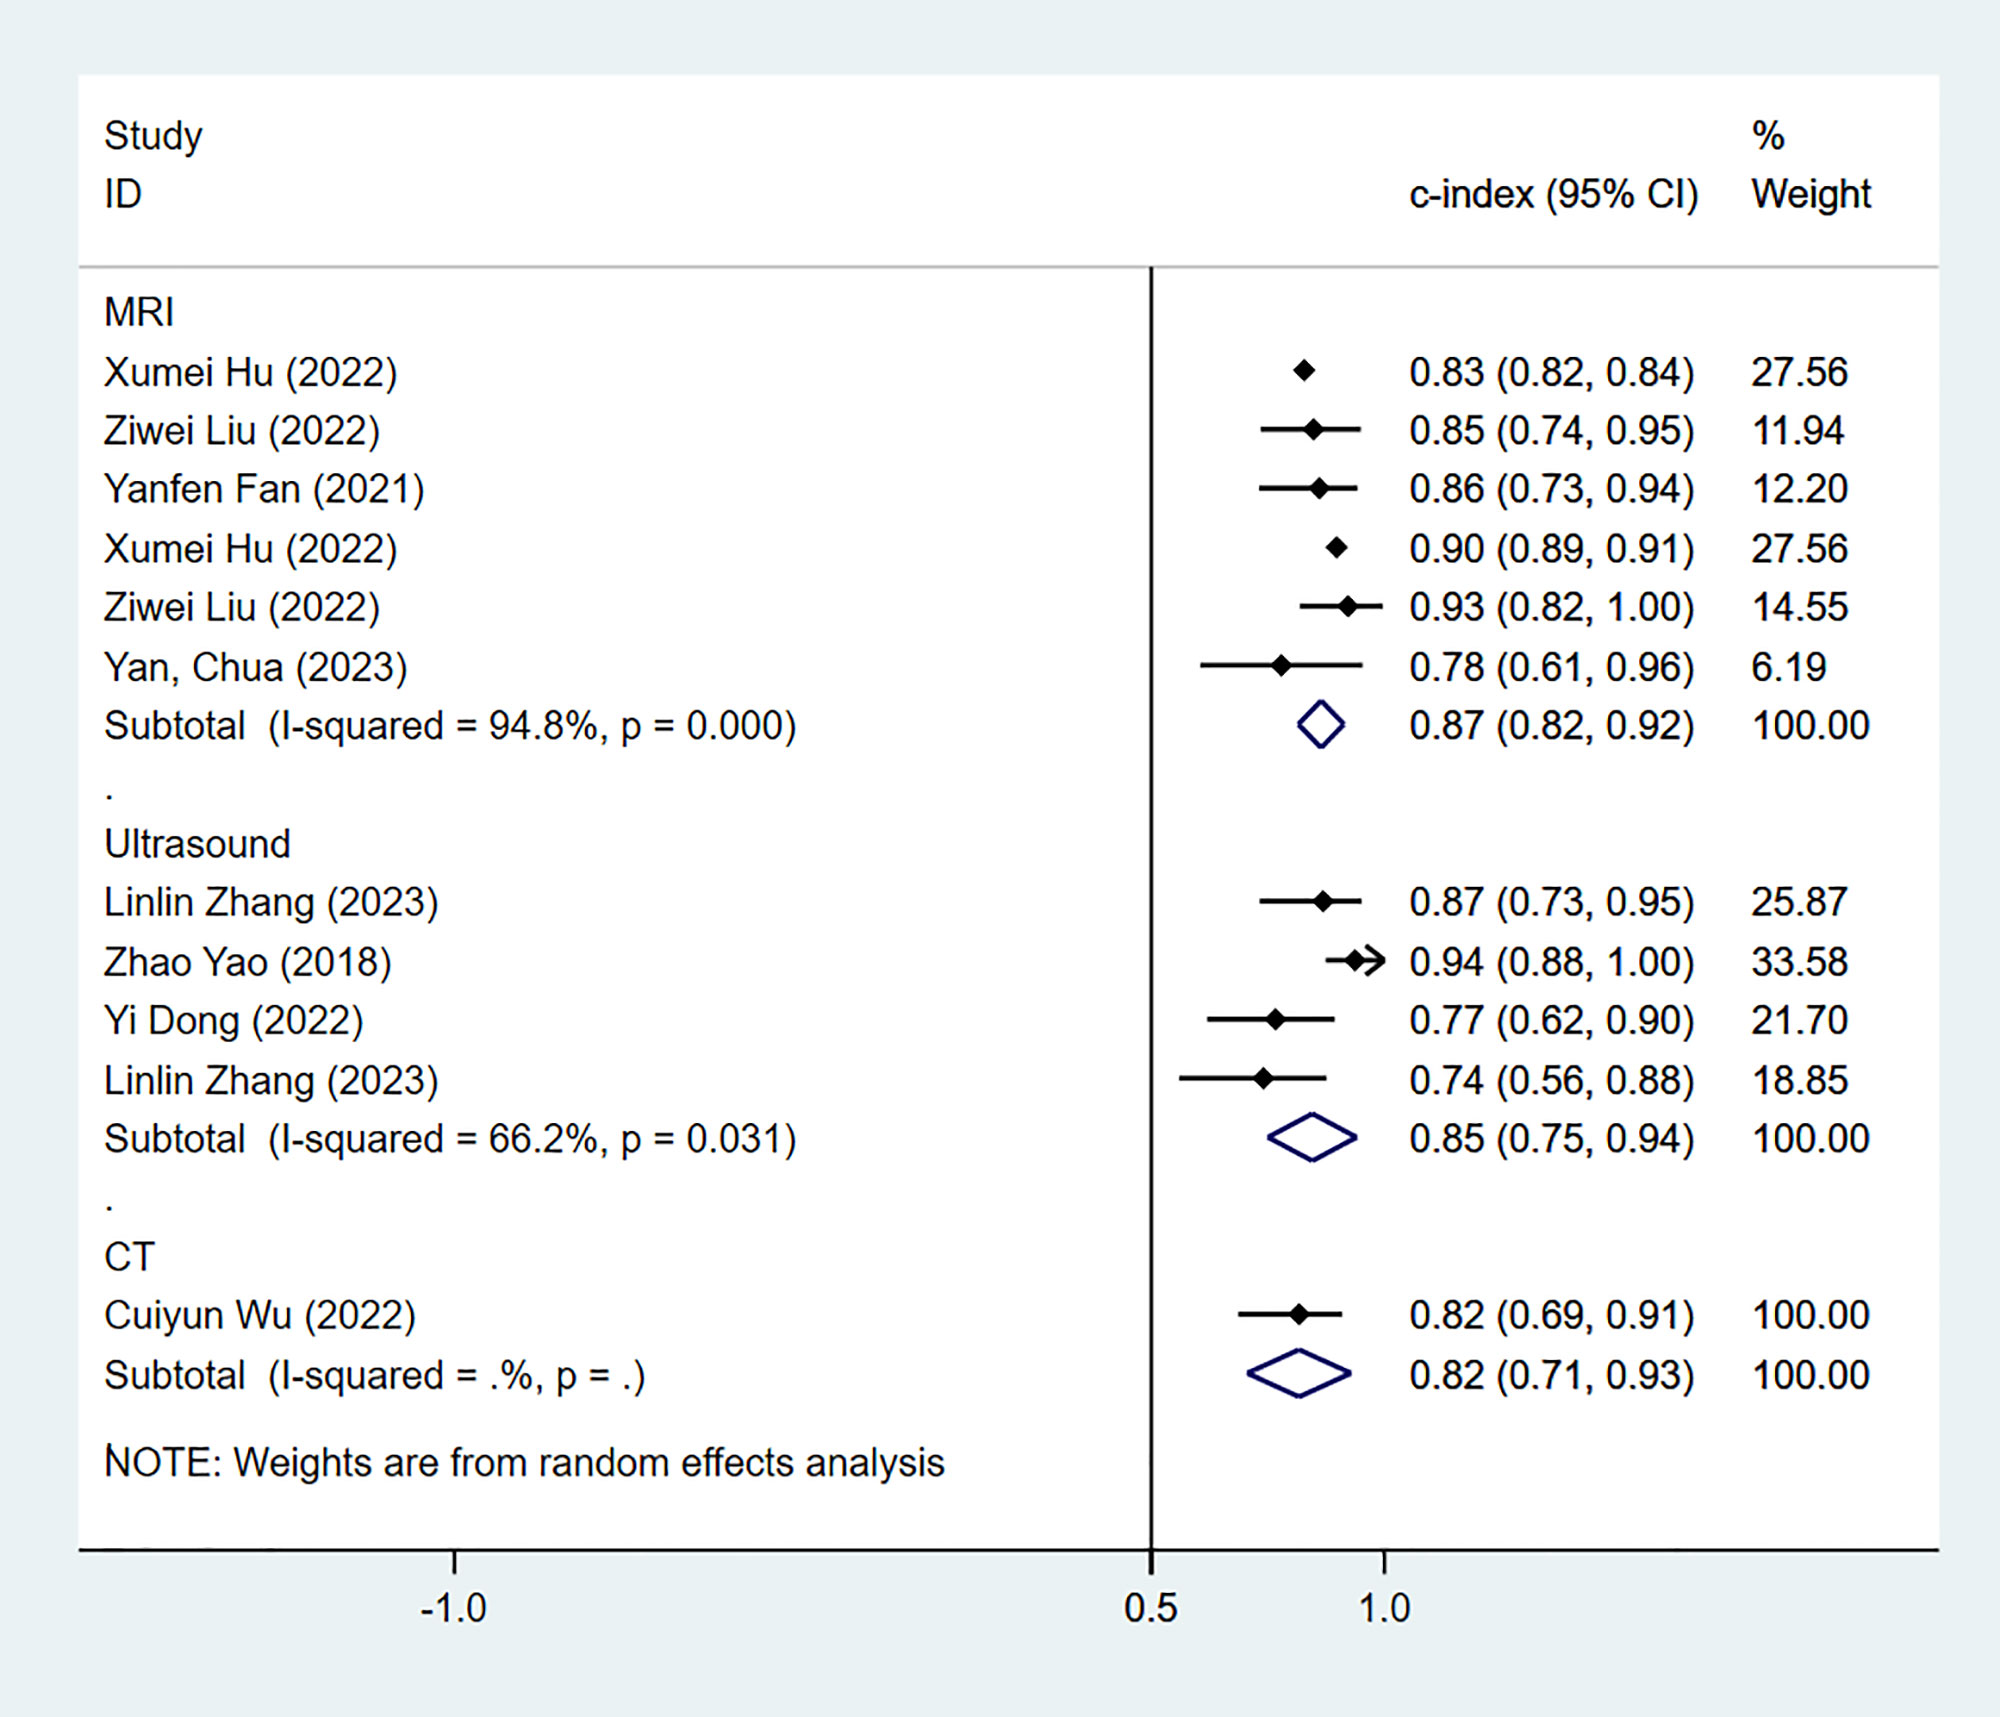
Figure 3 Forest plots for C-index of Ki-67 in the validation set. [(1) Since the C-index estimates are synthesized, the invalid line is 0.5. (2) 95% confidence interval (CI) is depicted as the horizontal line. The hollow diamond represents the pooled C-index.].
In the training sets, the sensitivity and specificity of MRI-based models were 0.89 (95% CI: 0.80–0.94) and 0.83 (95% CI: 0.75–0.89), respectively (Figure 4). In validation sets, the sensitivity and specificity of MRI-based models were 0.84 (95% CI: 0.77–0.90) and 0.80 (95% CI: 0.71–0.81), respectively (Figure 5).
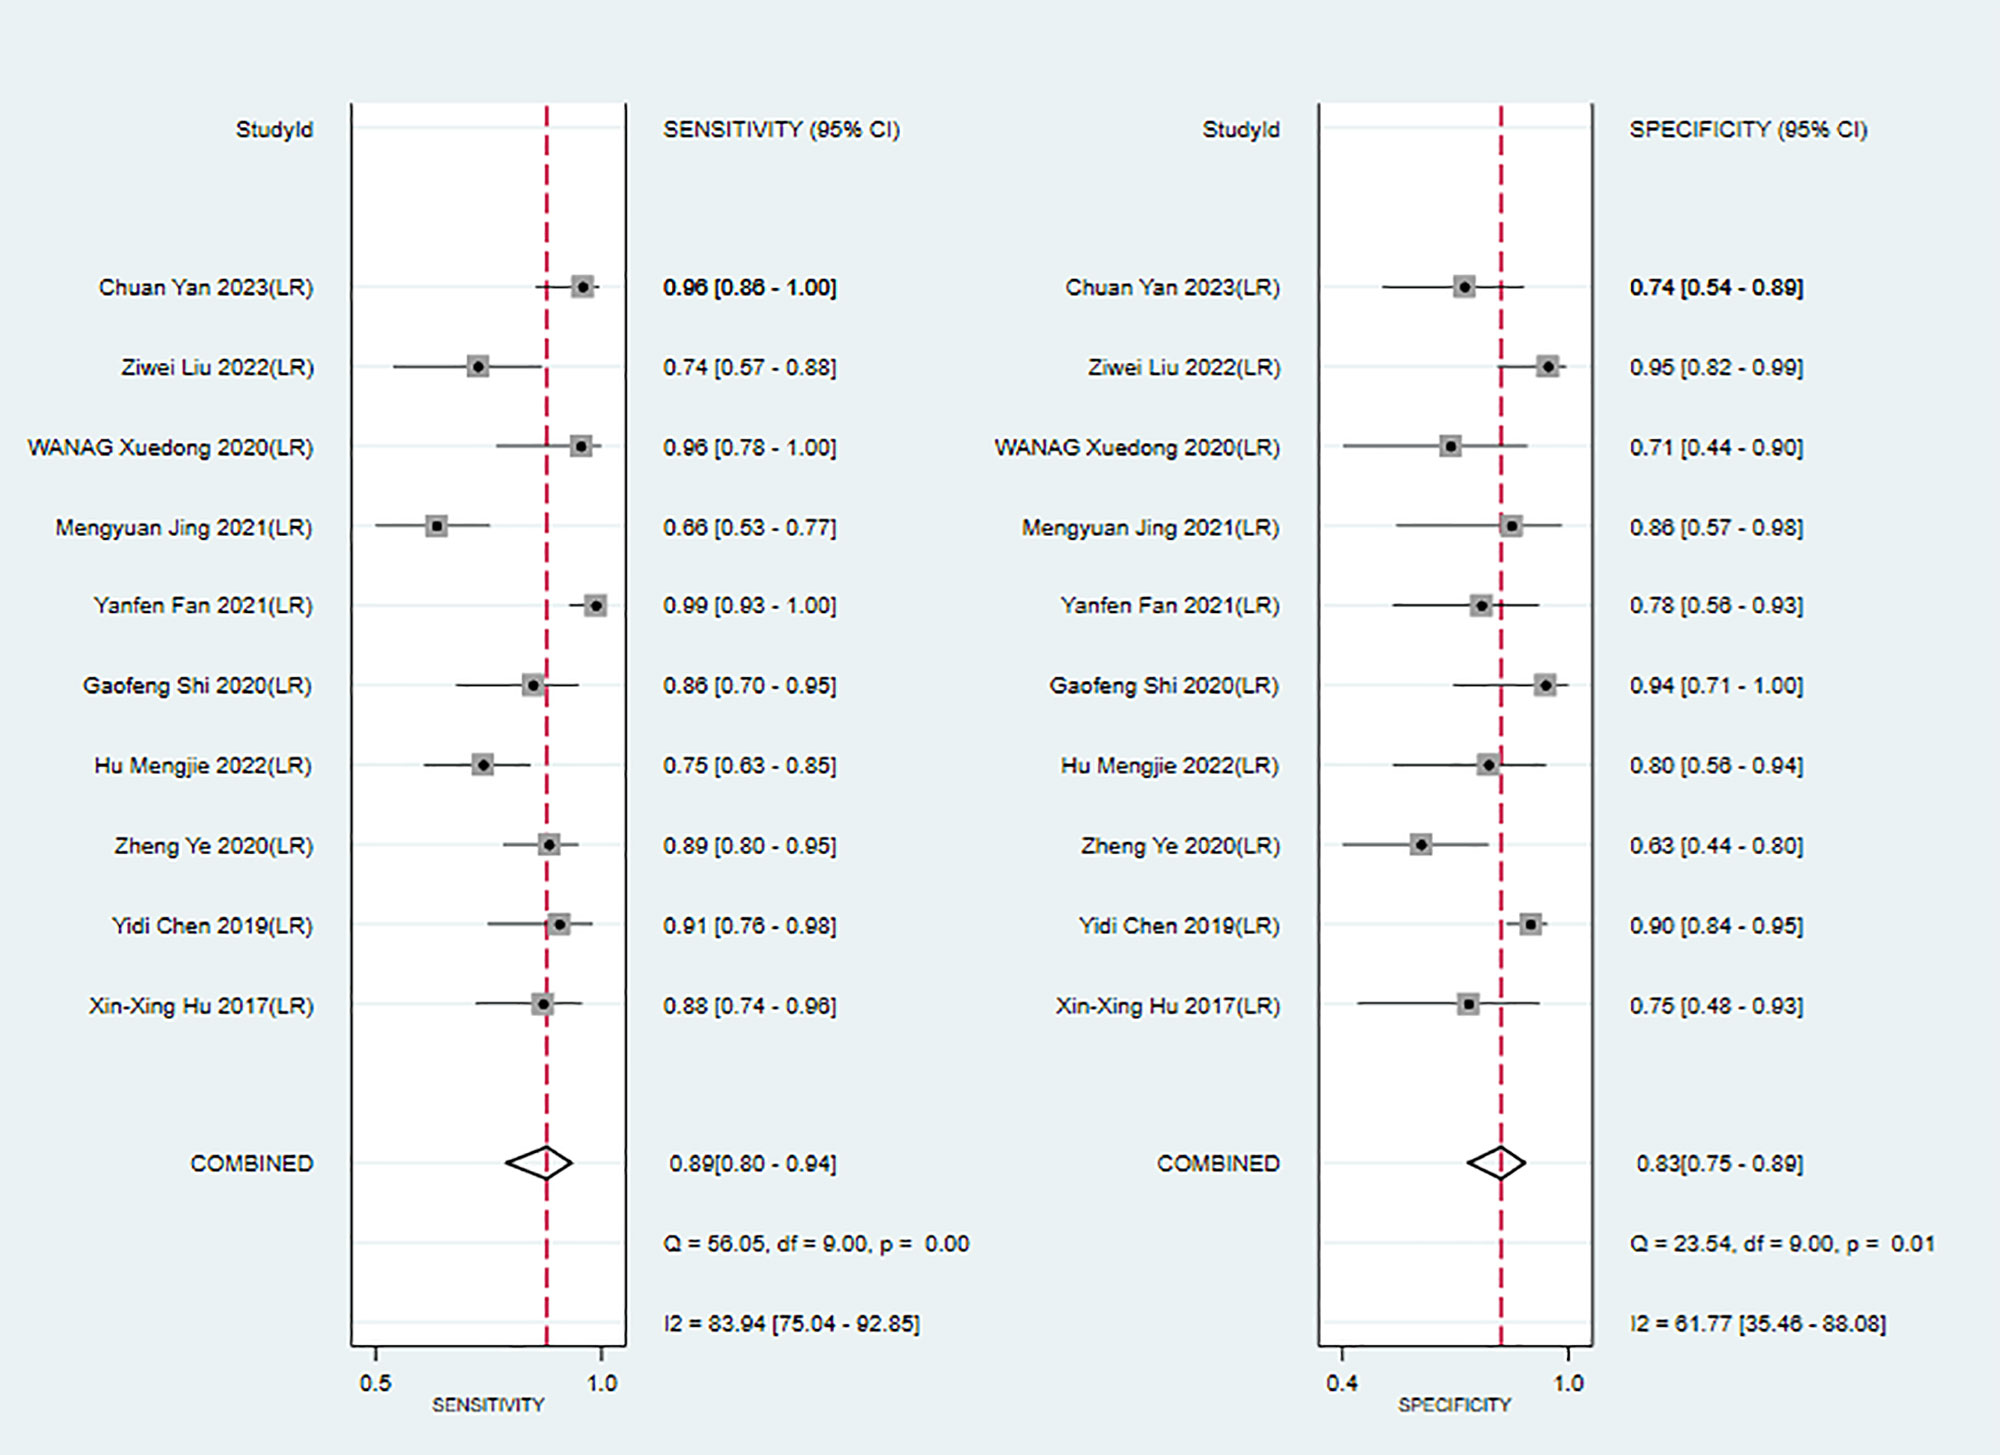
Figure 4 Forest plots for sensitivity and specificity of MRI-based models in the training set. [(1) Forest plots for sensitivity are shown on the left and for specificity on the right. (2) 95% confidence interval (CI) is depicted as the horizontal line. (3) The hollow diamond represents the pooled estimates.].
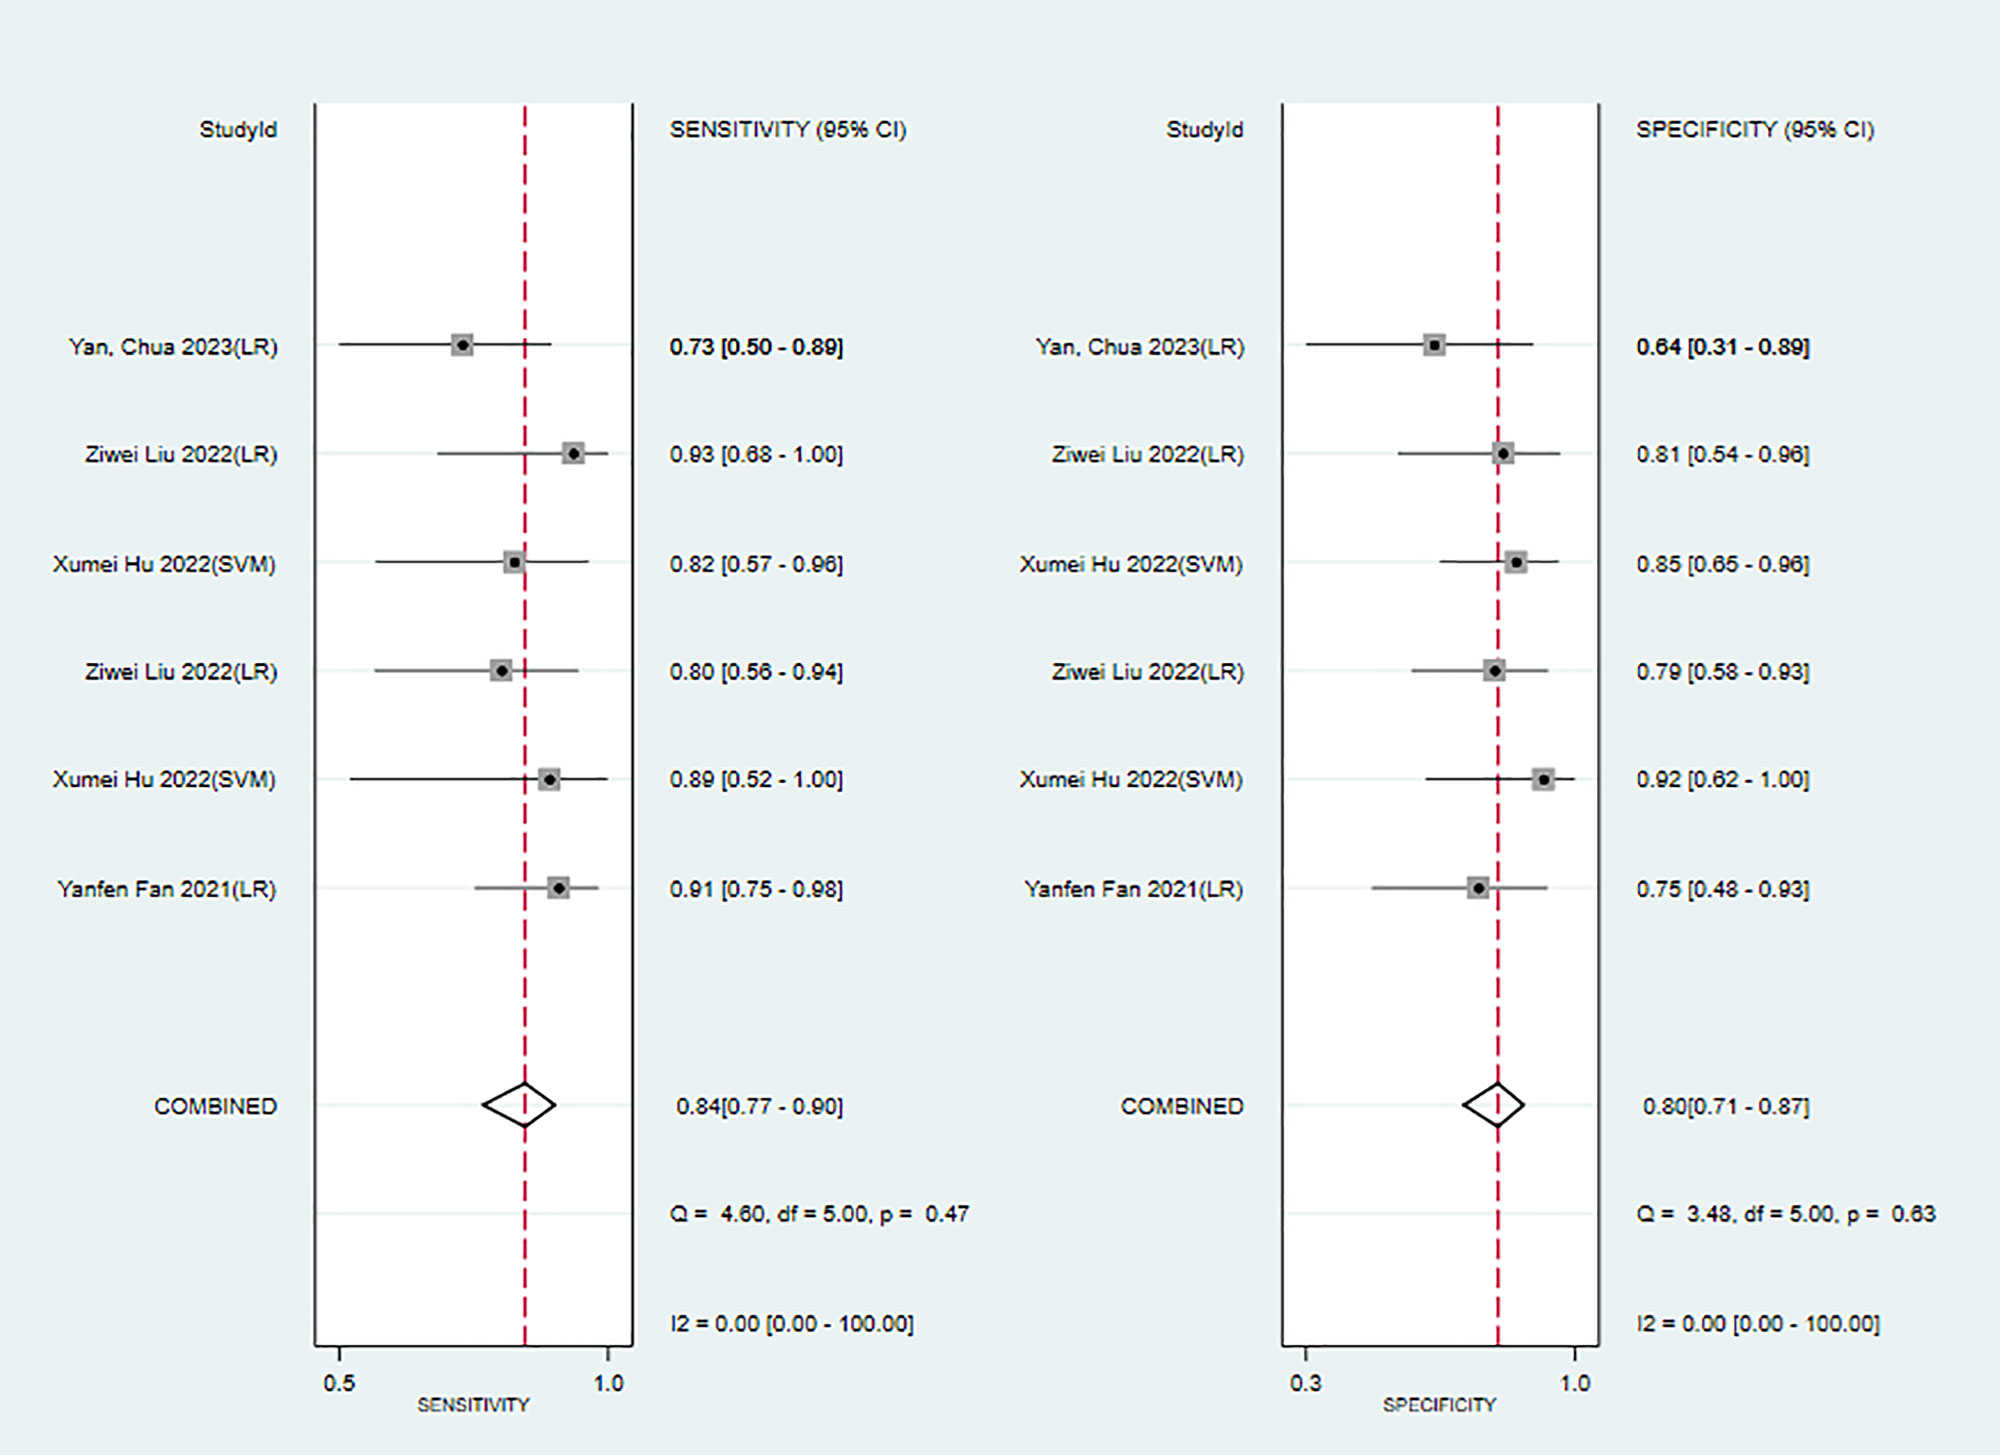
Figure 5 Forest plots for sensitivity and specificity of MRI-based models in the validation set. [(1) Forest plots for sensitivity are shown on the left and for specificity on the right. (2) 95% confidence interval (CI) is depicted as the horizontal line. (3) The hollow diamond represents the pooled estimates.].
(2) Subgroup analysis
Next, we performed subgroup analyses by the positive threshold and feature category of the radiomics models in the training sets. Since CT-based models were examined in only two studies, subgroup analysis was not performed for this model type. In addition, given that the US-based models exceeded the invalid line and the synthesized results were not statistically significant, a US-based subgroup analysis was also not performed in the training sets. As shown in Table 3, we divided the studies based on the MRI positive Ki-67 threshold into the 10 and 10+(over 10) subgroups. The C-index of these two subgroups were 0.85 (95% CI: 0.82–0.88%) and 0.93 (95% CI: 0.91–0.96%), respectively. There was significant heterogeneity in the positive Ki-67 threshold, and C-index was increased as the threshold increased. Furthermore, subgroup analyses based on feature source, positive threshold, and validation source indicated that validation source was a significant source of heterogeneity in the MRI-based models in the validation sets (Table 3).
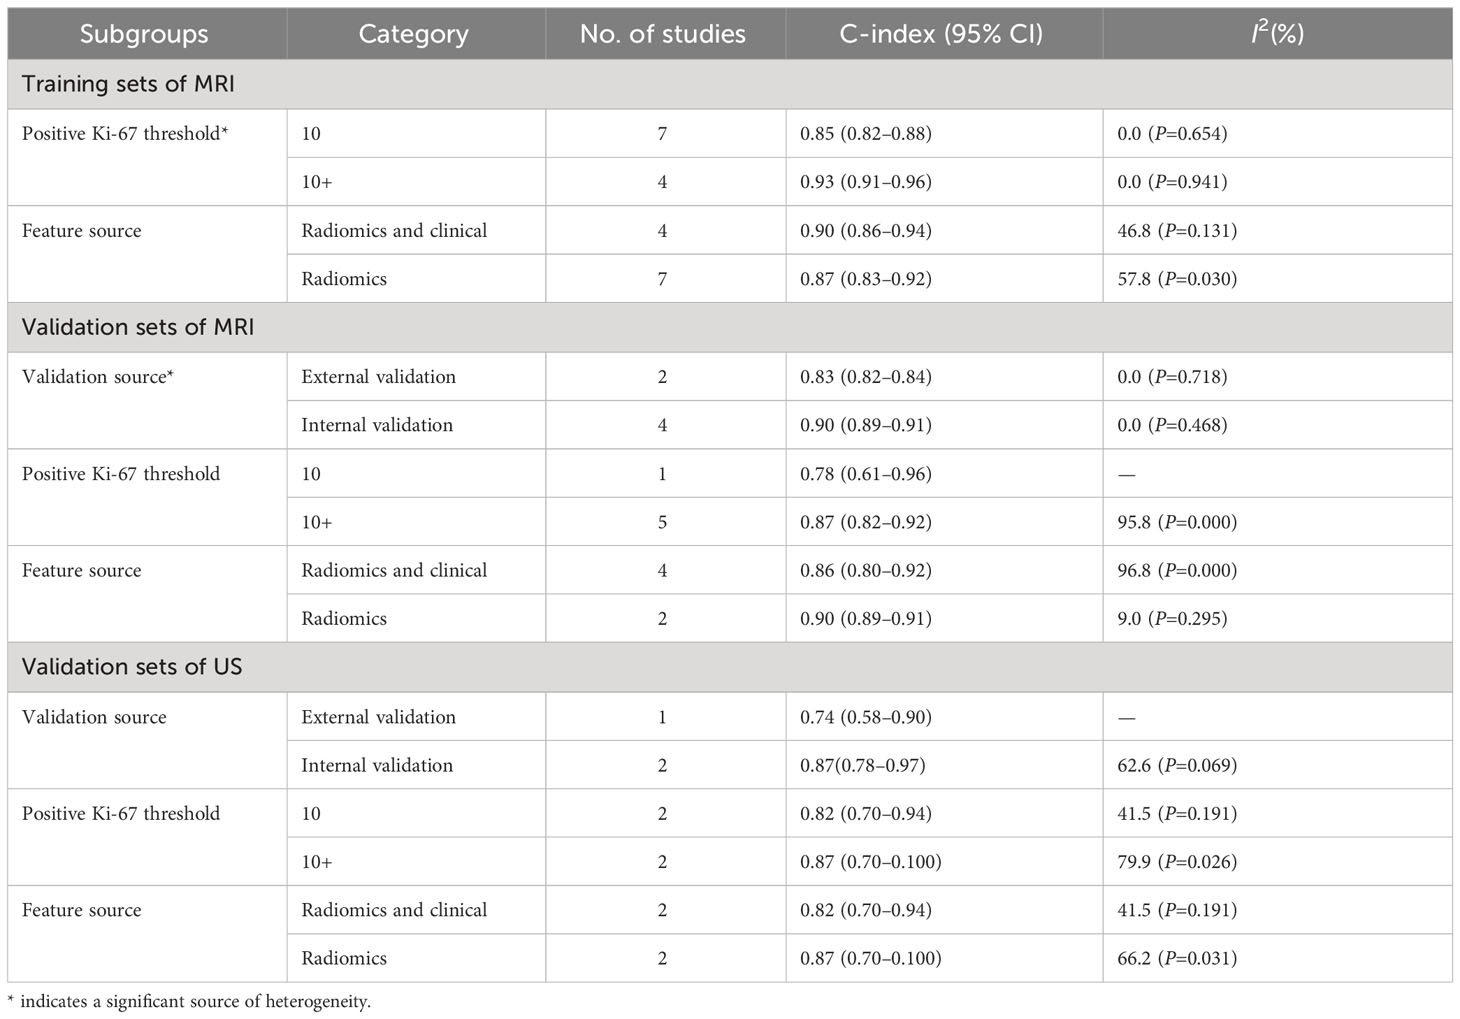
Table 3 Subgroup analyses in the training sets and validation sets.
(3) Reporting bias
The Begg’s test showed that there was no publication bias in the MRI-based models in the training sets (P=0.062, continuity corrected). In addition, the funnel plot also revealed stable data without trimming (Figure 6).
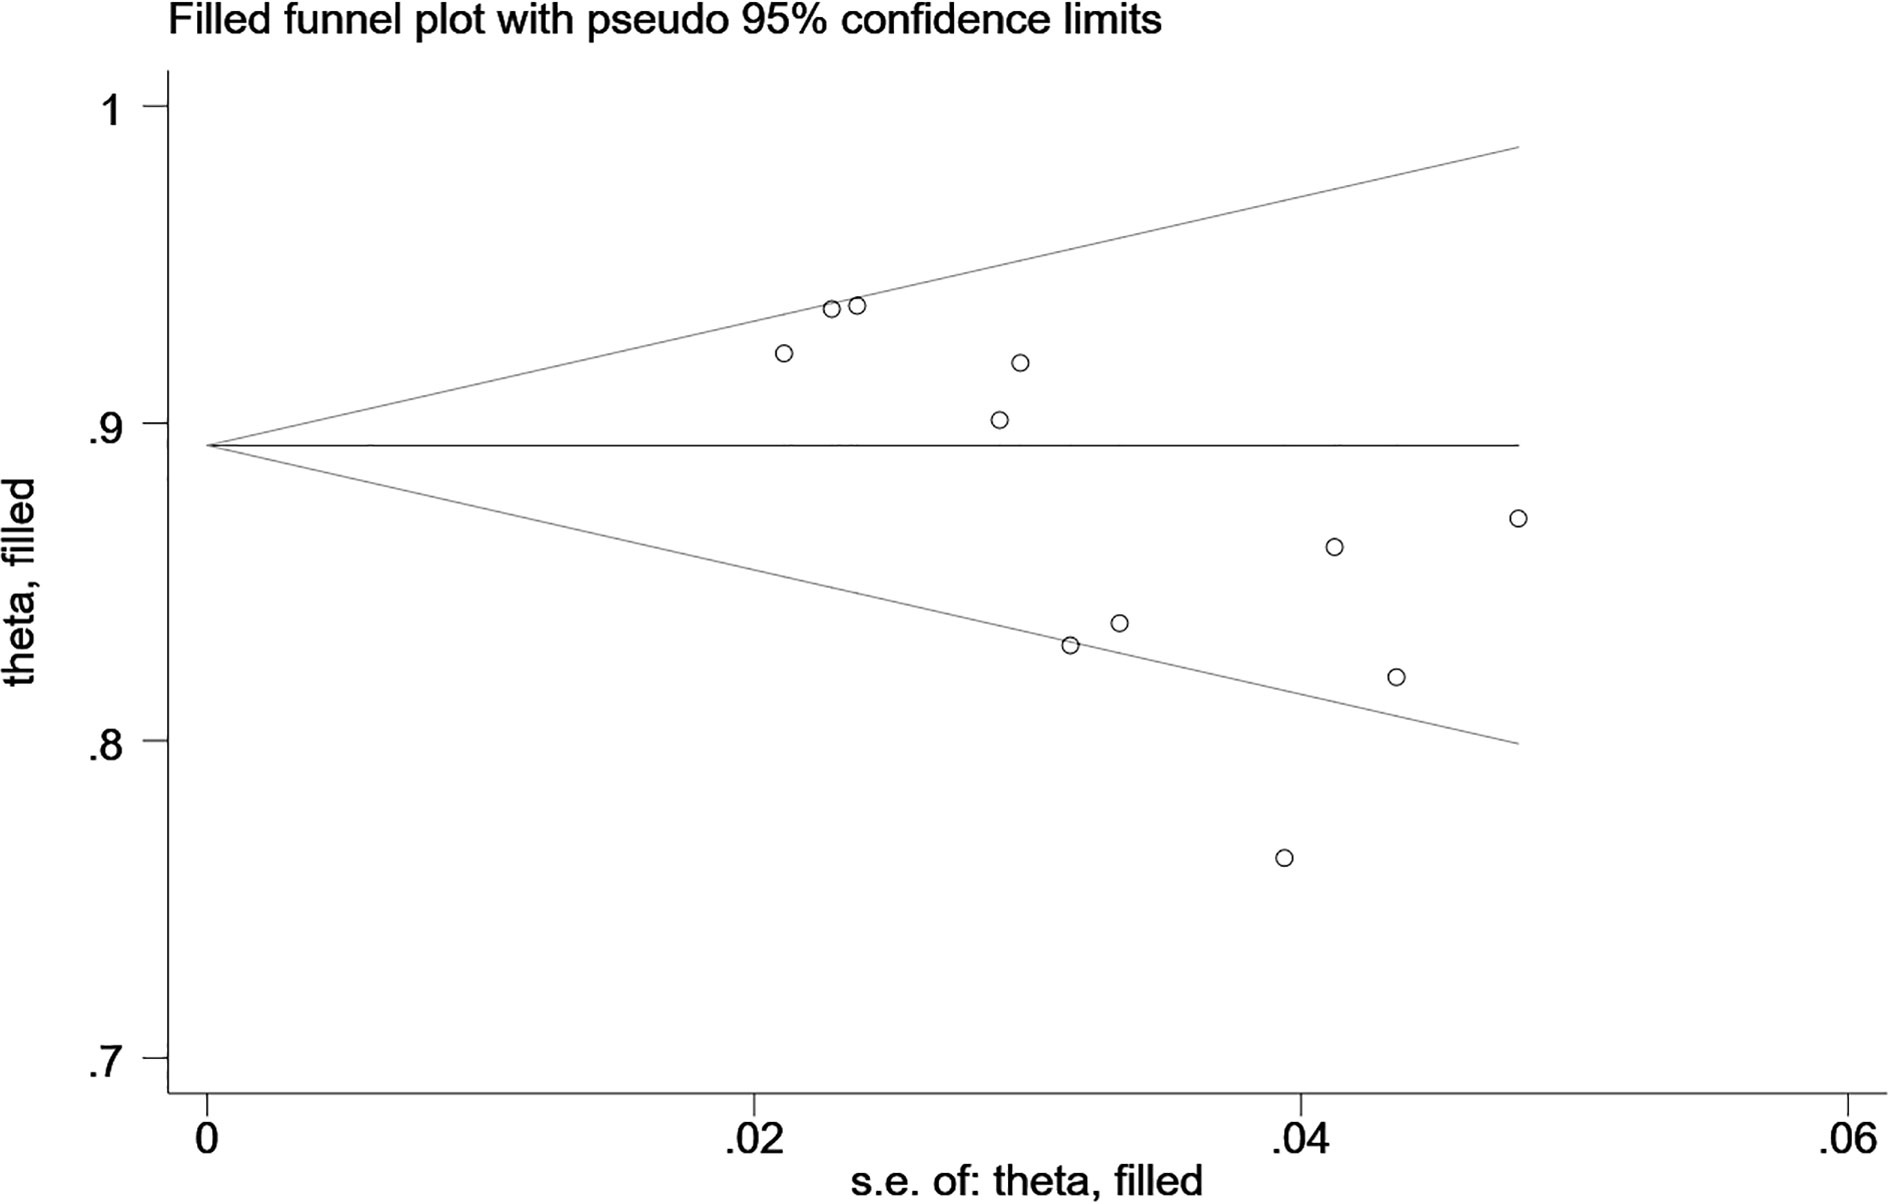
Figure 6 Beggs’ funnel plot of MRI-based models for predicting Ki-67 shows there is no publication bias in the MRI-based models in the training set. [(1) The ordinate represents the C-index value. (2) The abscissa represents the standard error of C-index.].
(4) Meta-regression
We performed a meta-regression of the MRI data to further analyze the sources of heterogeneity. Our results demonstrated that the positive Ki-67 threshold was a potential source of heterogeneity since its P-value (P=0.086) was close to the significance level (0.05), which was corroborated by the results of subgroup analysis. Furthermore, meta-regression revealed that the C-index increased as Ki-67 LI increased (Figure 7).
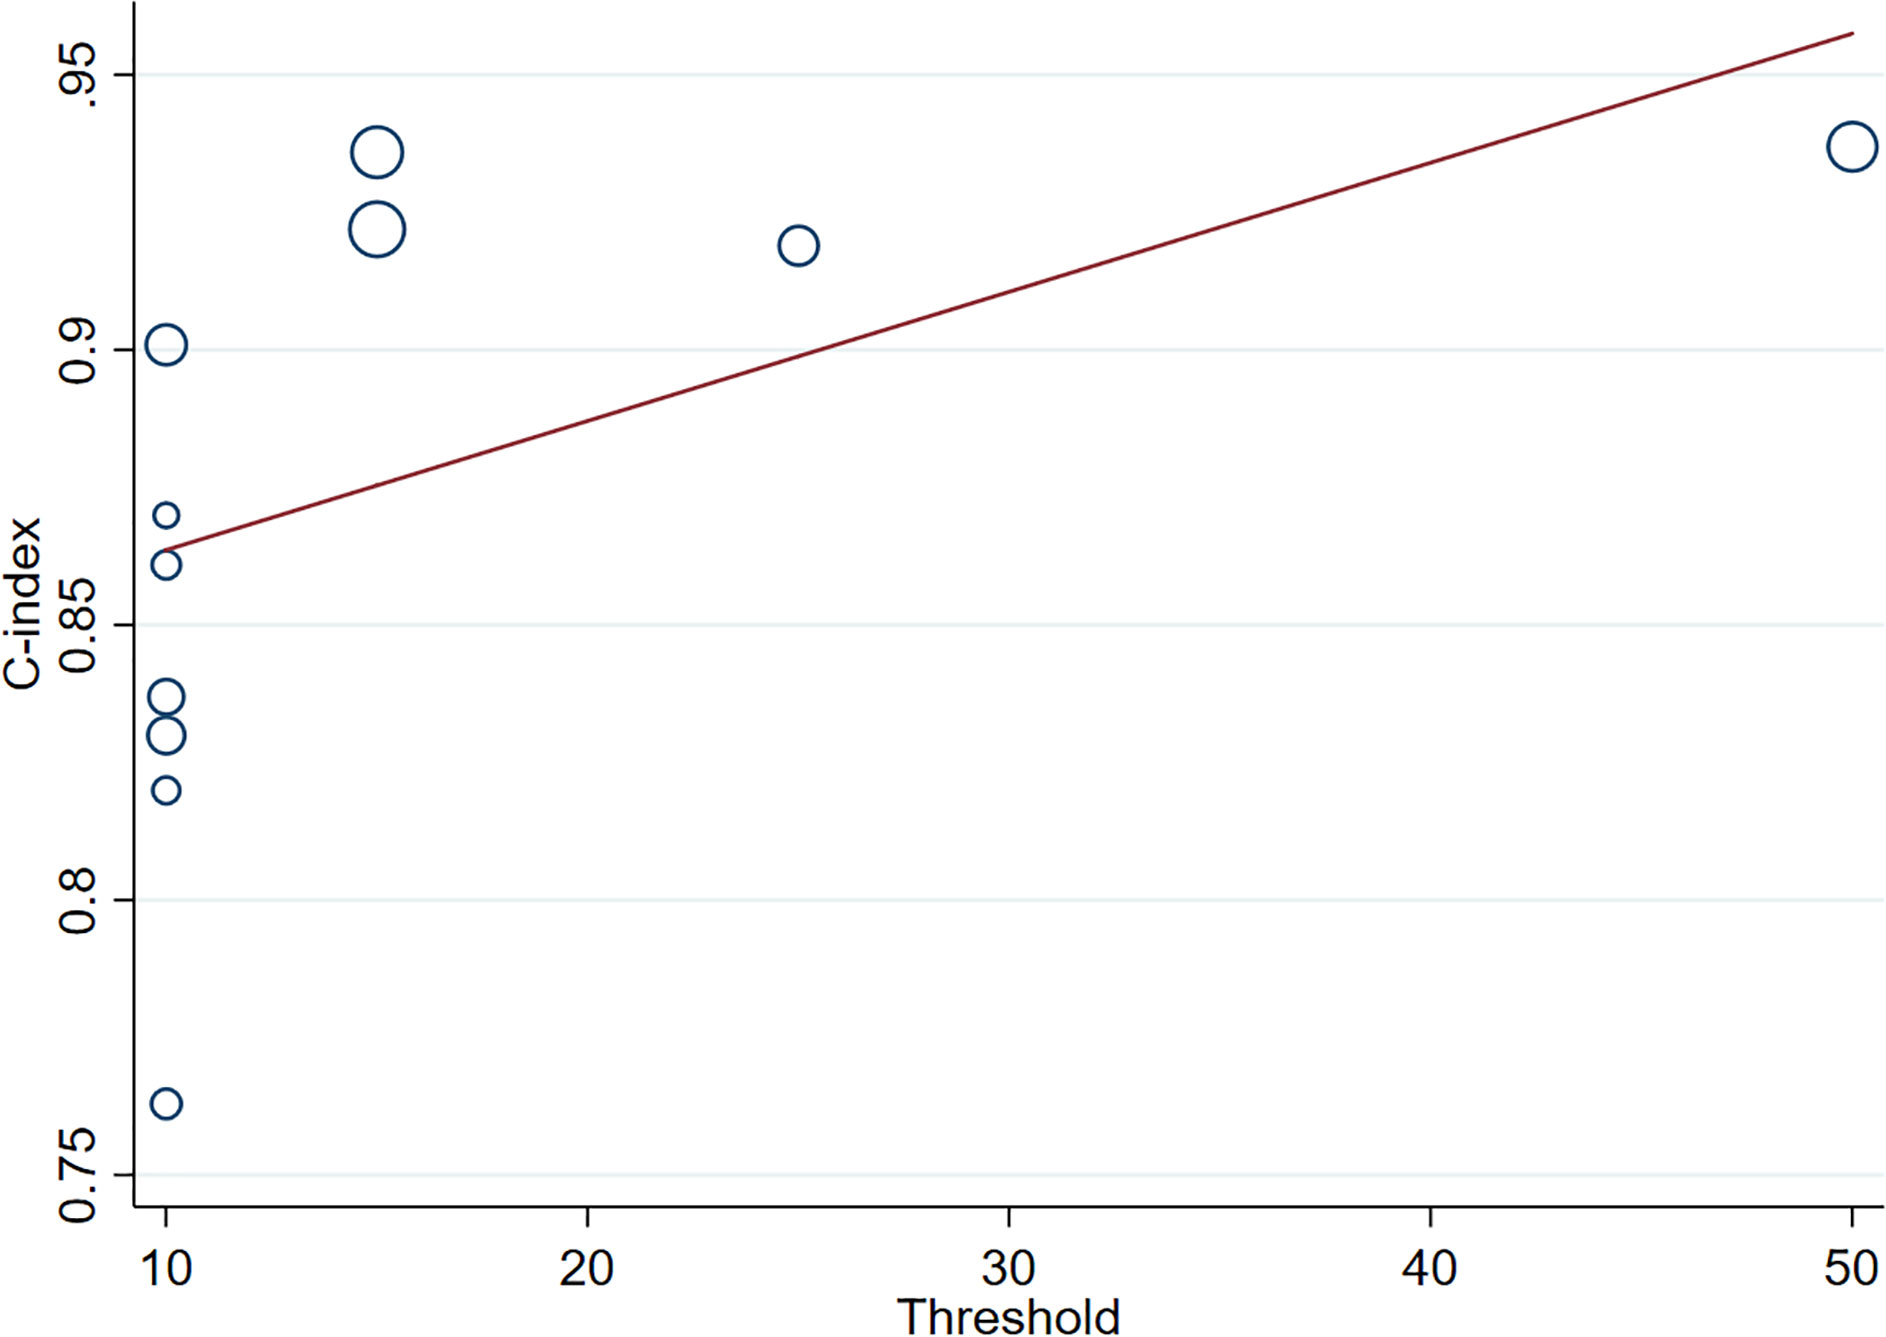
Figure 7 Meta-regression of Ki-67 in different positive thresholds. The abscissa represents the positive threshold of Ki-67; circles indicate the included studies, and larger circles indicate larger weights.).
3.4.2 CK-19
(1) Synthesized results
The results of the MRI-, PET- and US-based models for predicting CK-19 expression were synthesized separately. In the training sets, the C-index was 0.86 (95% CI:0.81–0.90) for MRI-based models, 0.82 (95% CI: 0.67–0.97) for PET-based models, and 1.00 (95% CI: 0.98–1.00) for US-based models (Figure 8). In the validation sets, the C-index was 0.79 (95% CI: 0.73–0.84) for the MRI-based models (Figure 9).
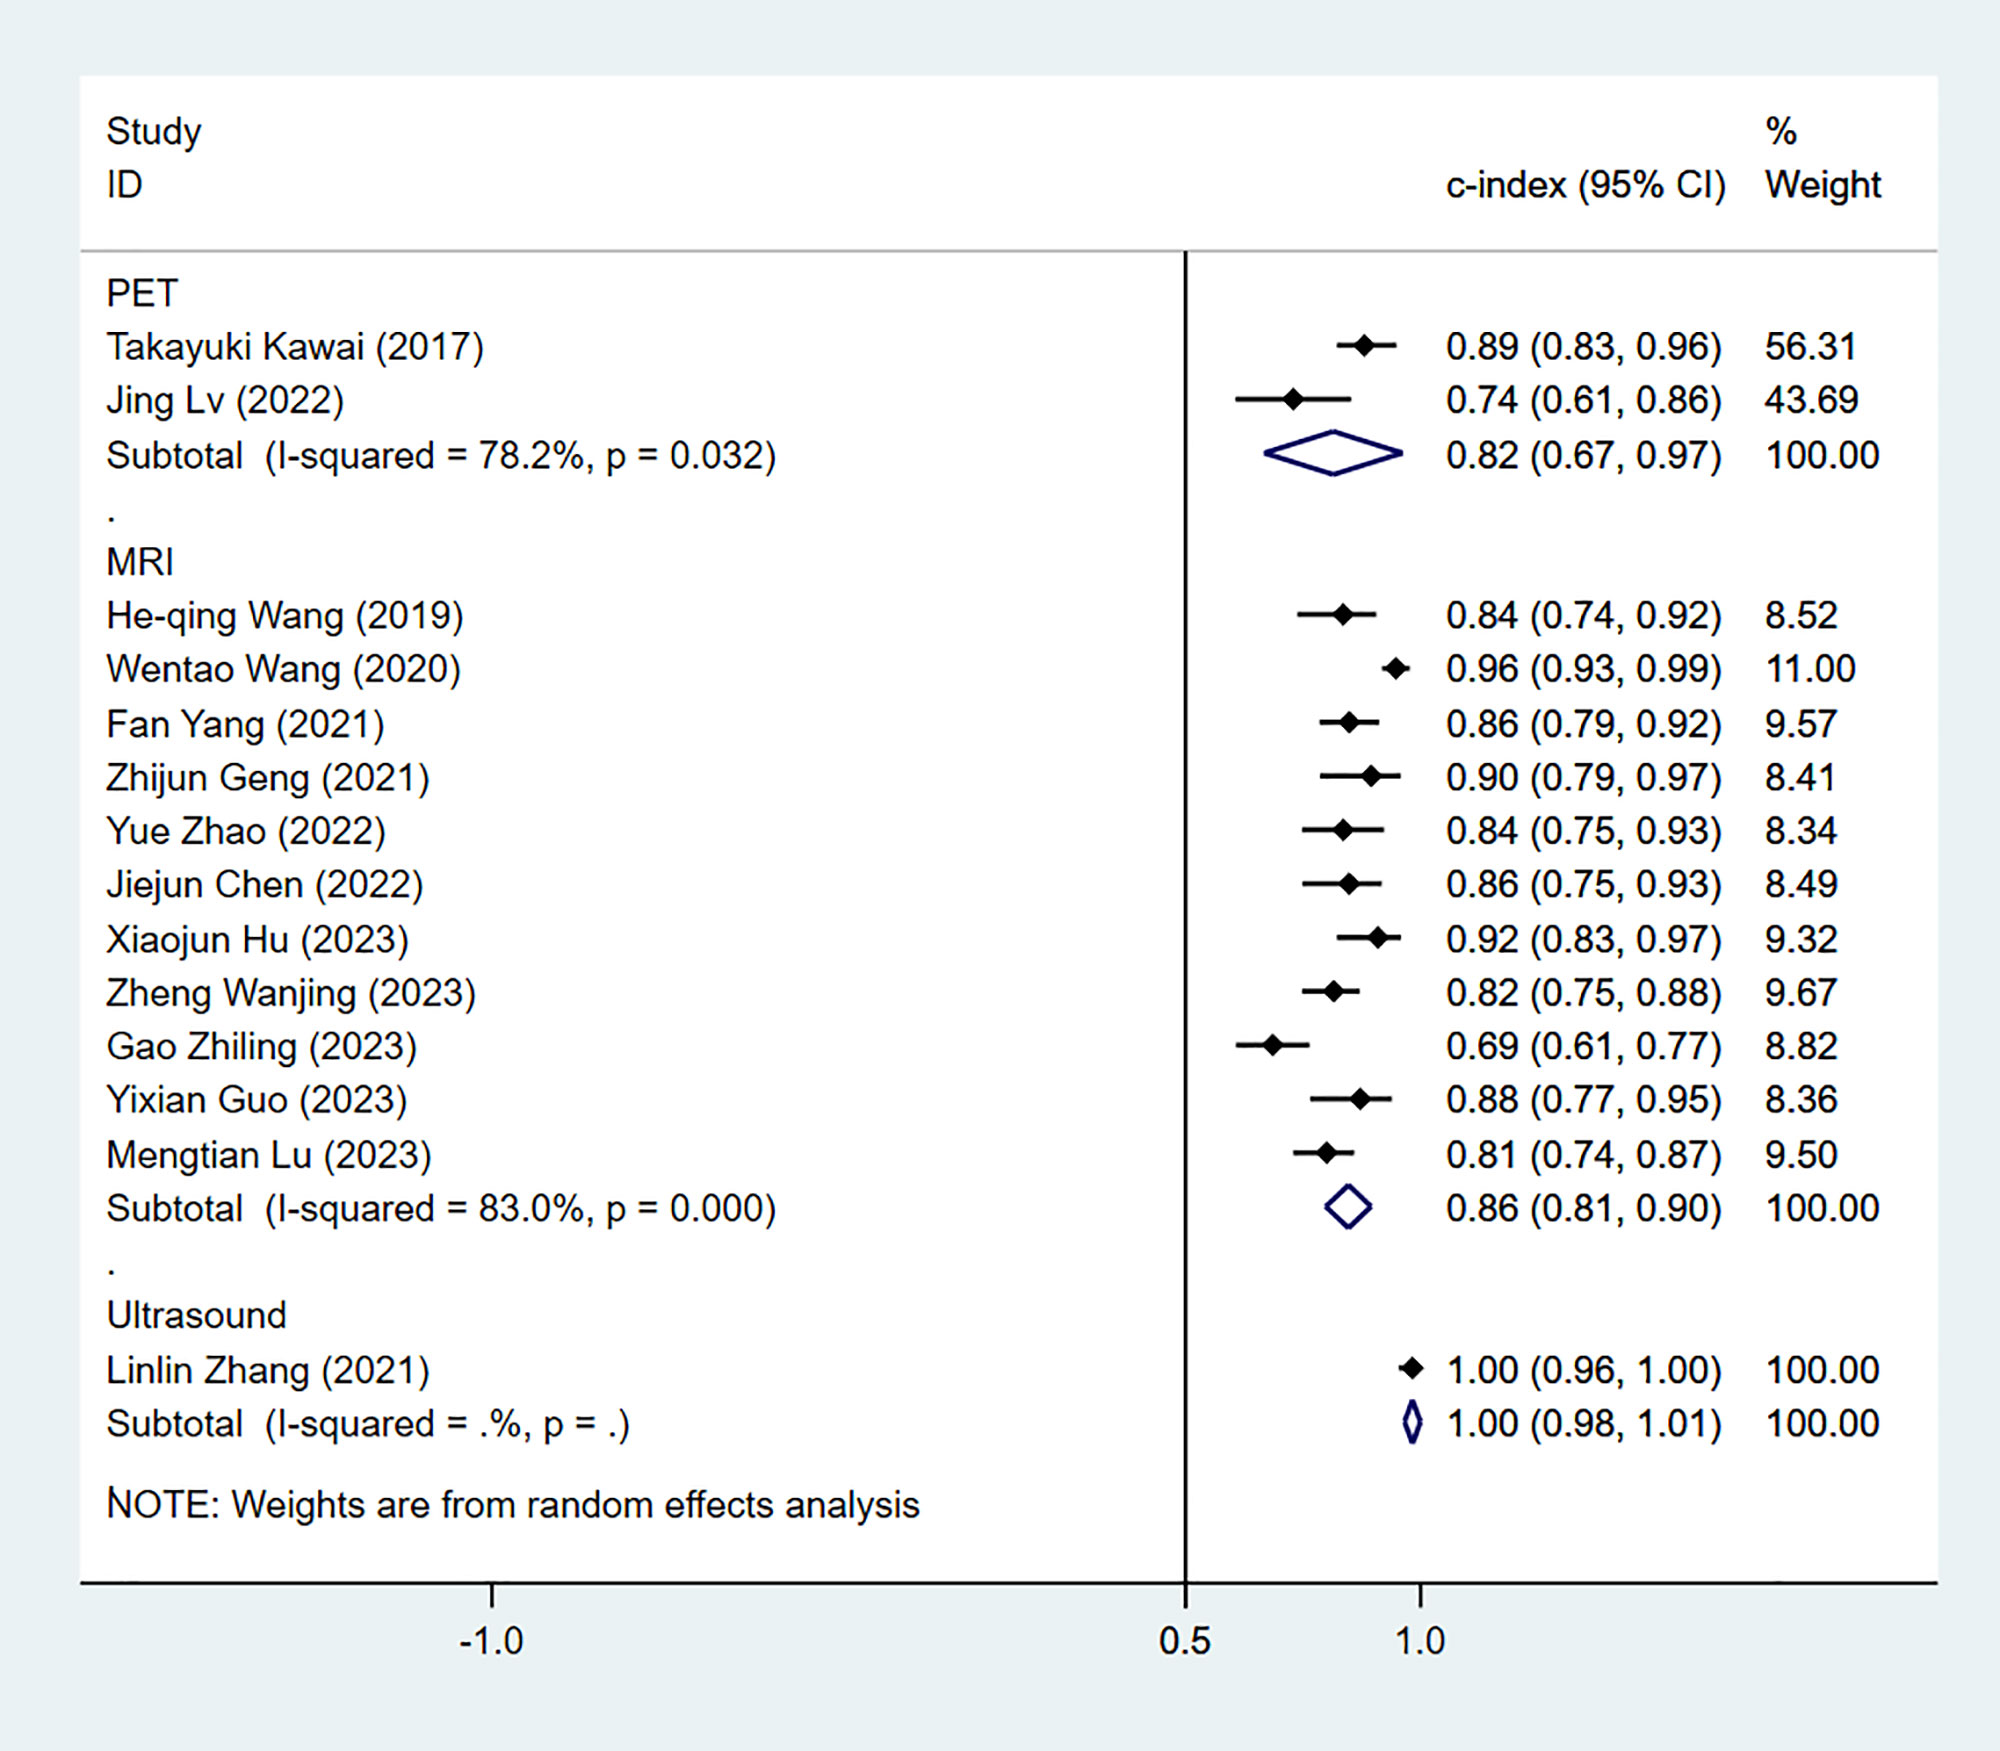
Figure 8 Forest plots for C-index of CK-19 in the training set. [(1) Since the C-index estimates are synthesized, the invalid line is 0.5. (2) 95% confidence interval (CI) is depicted as the horizontal line. The hollow diamond represents the pooled C-index.].
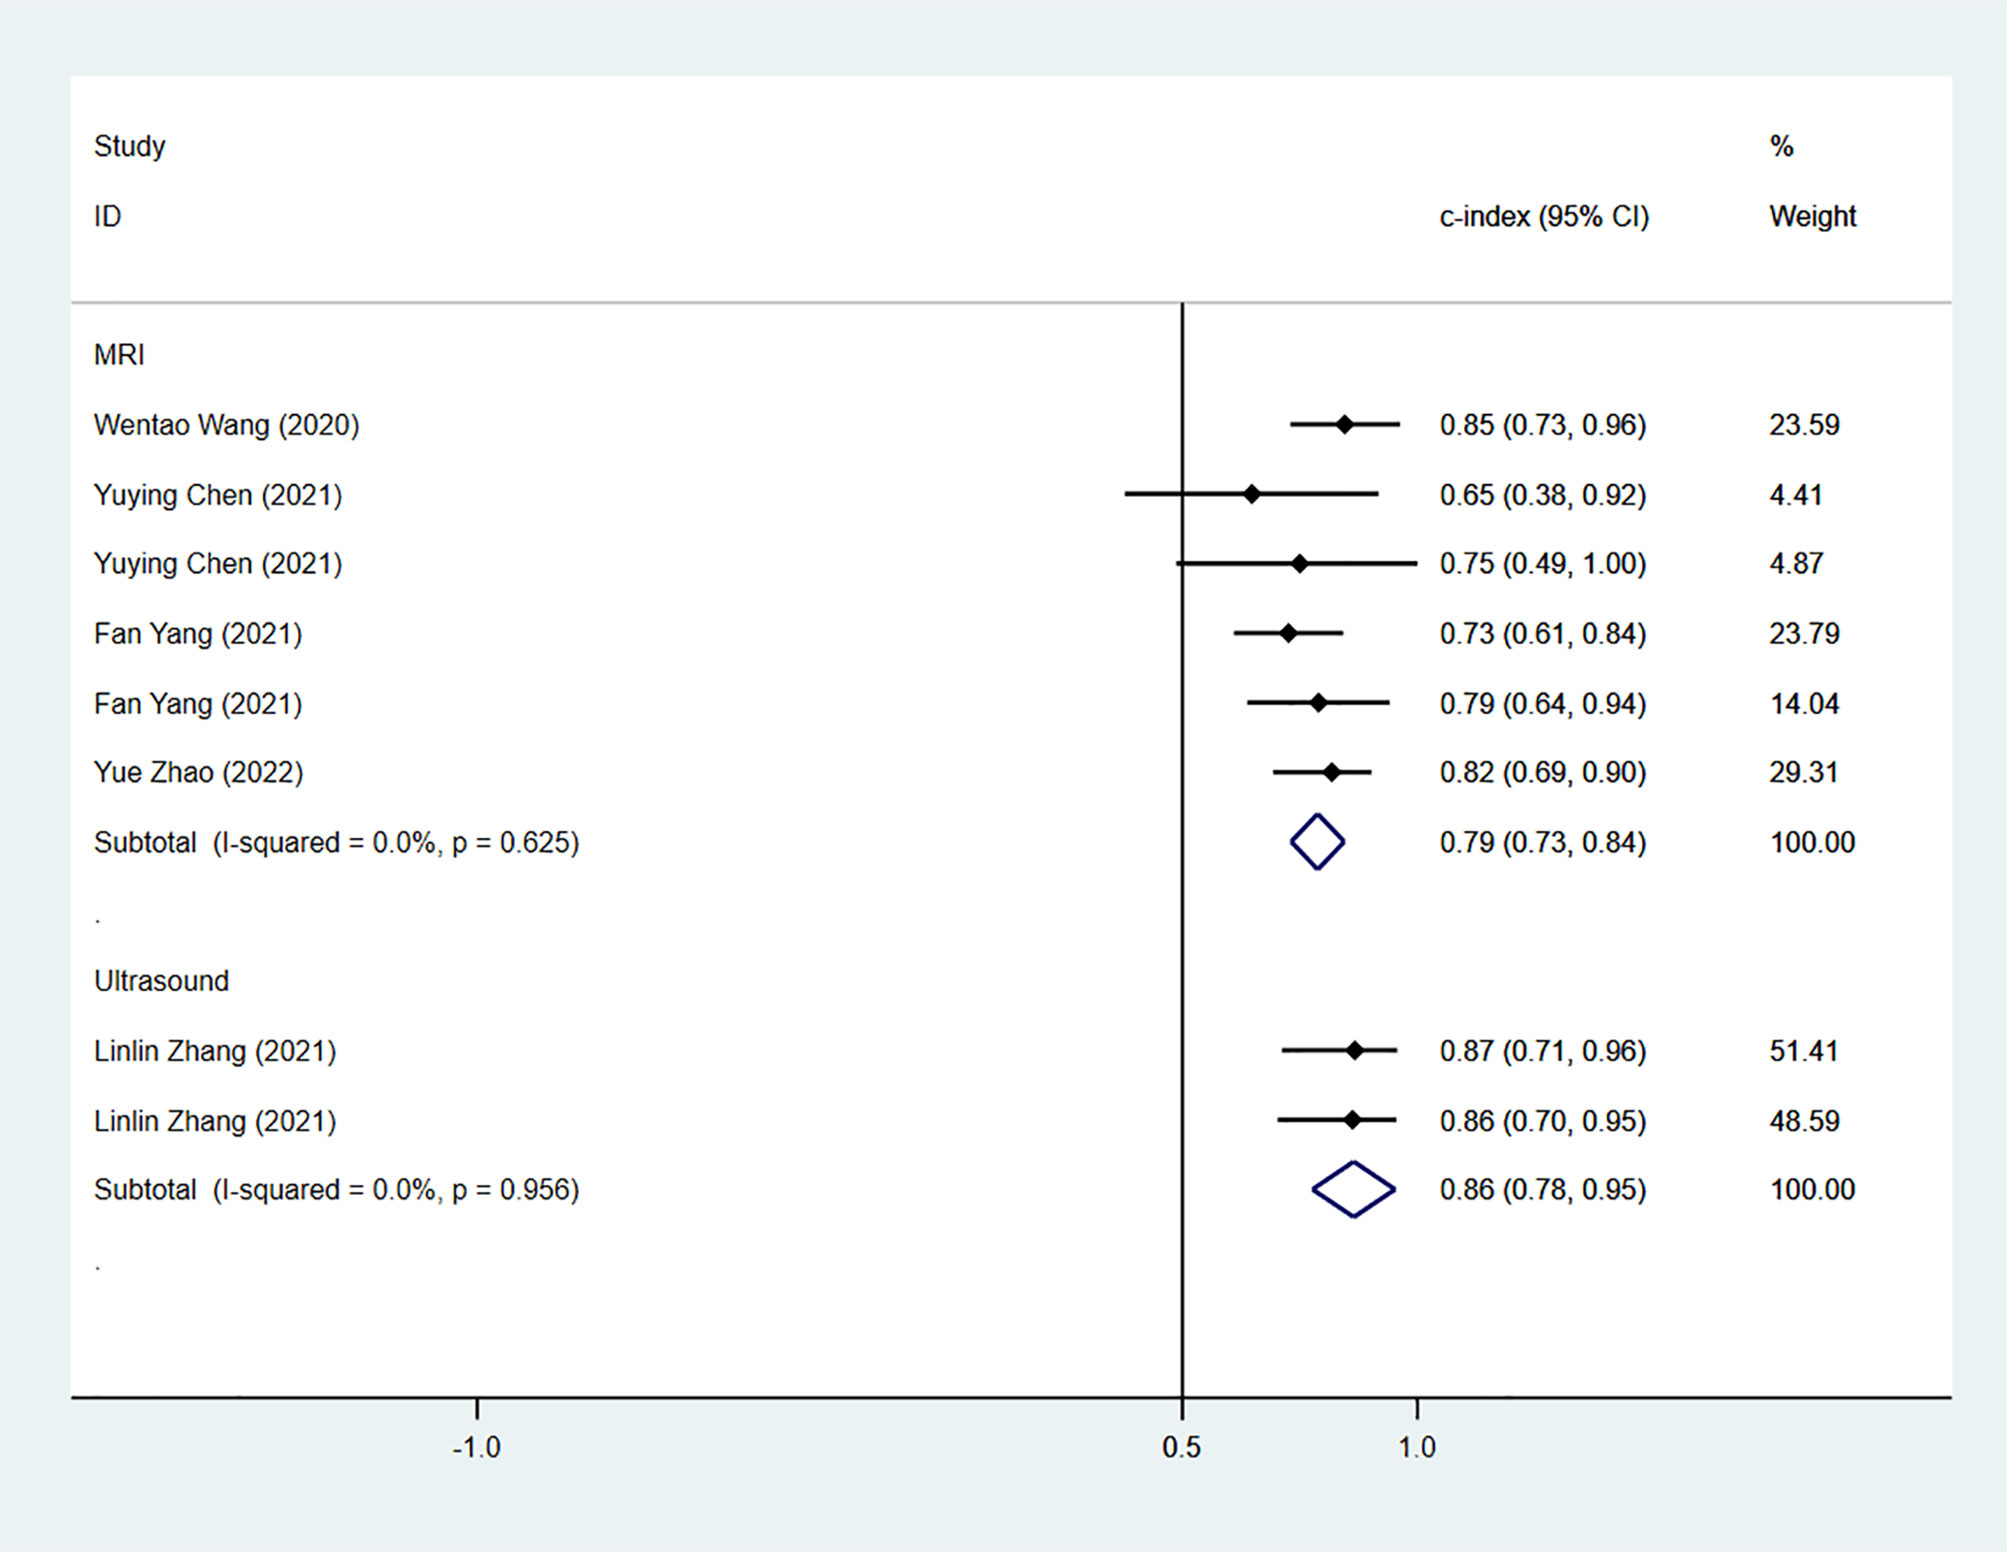
Figure 9 Forest plots for C-index of CK-19 in the validation set. [(1) Since the C-index estimates are synthesized, the invalid line is 0.5. (2) 95% confidence interval (CI) is depicted as the horizontal line. The hollow diamond represents the pooled C-index.].
We next determined the diagnostic sensitivity and specificity of the MRI-based models using a bivariate mixed-effects model. Our data showed that the sensitivity and specificity of MRI-based models were 0.89 (95% CI: 0.80–0.94) and 0.83 (95% CI: 0.75–0.89) in training sets (Figure 10), and 0.84 (95% CI: 0.77–0.90) and 0.80 (95% CI: 0.71–0.81) in the validation sets, respectively (Figure 11).
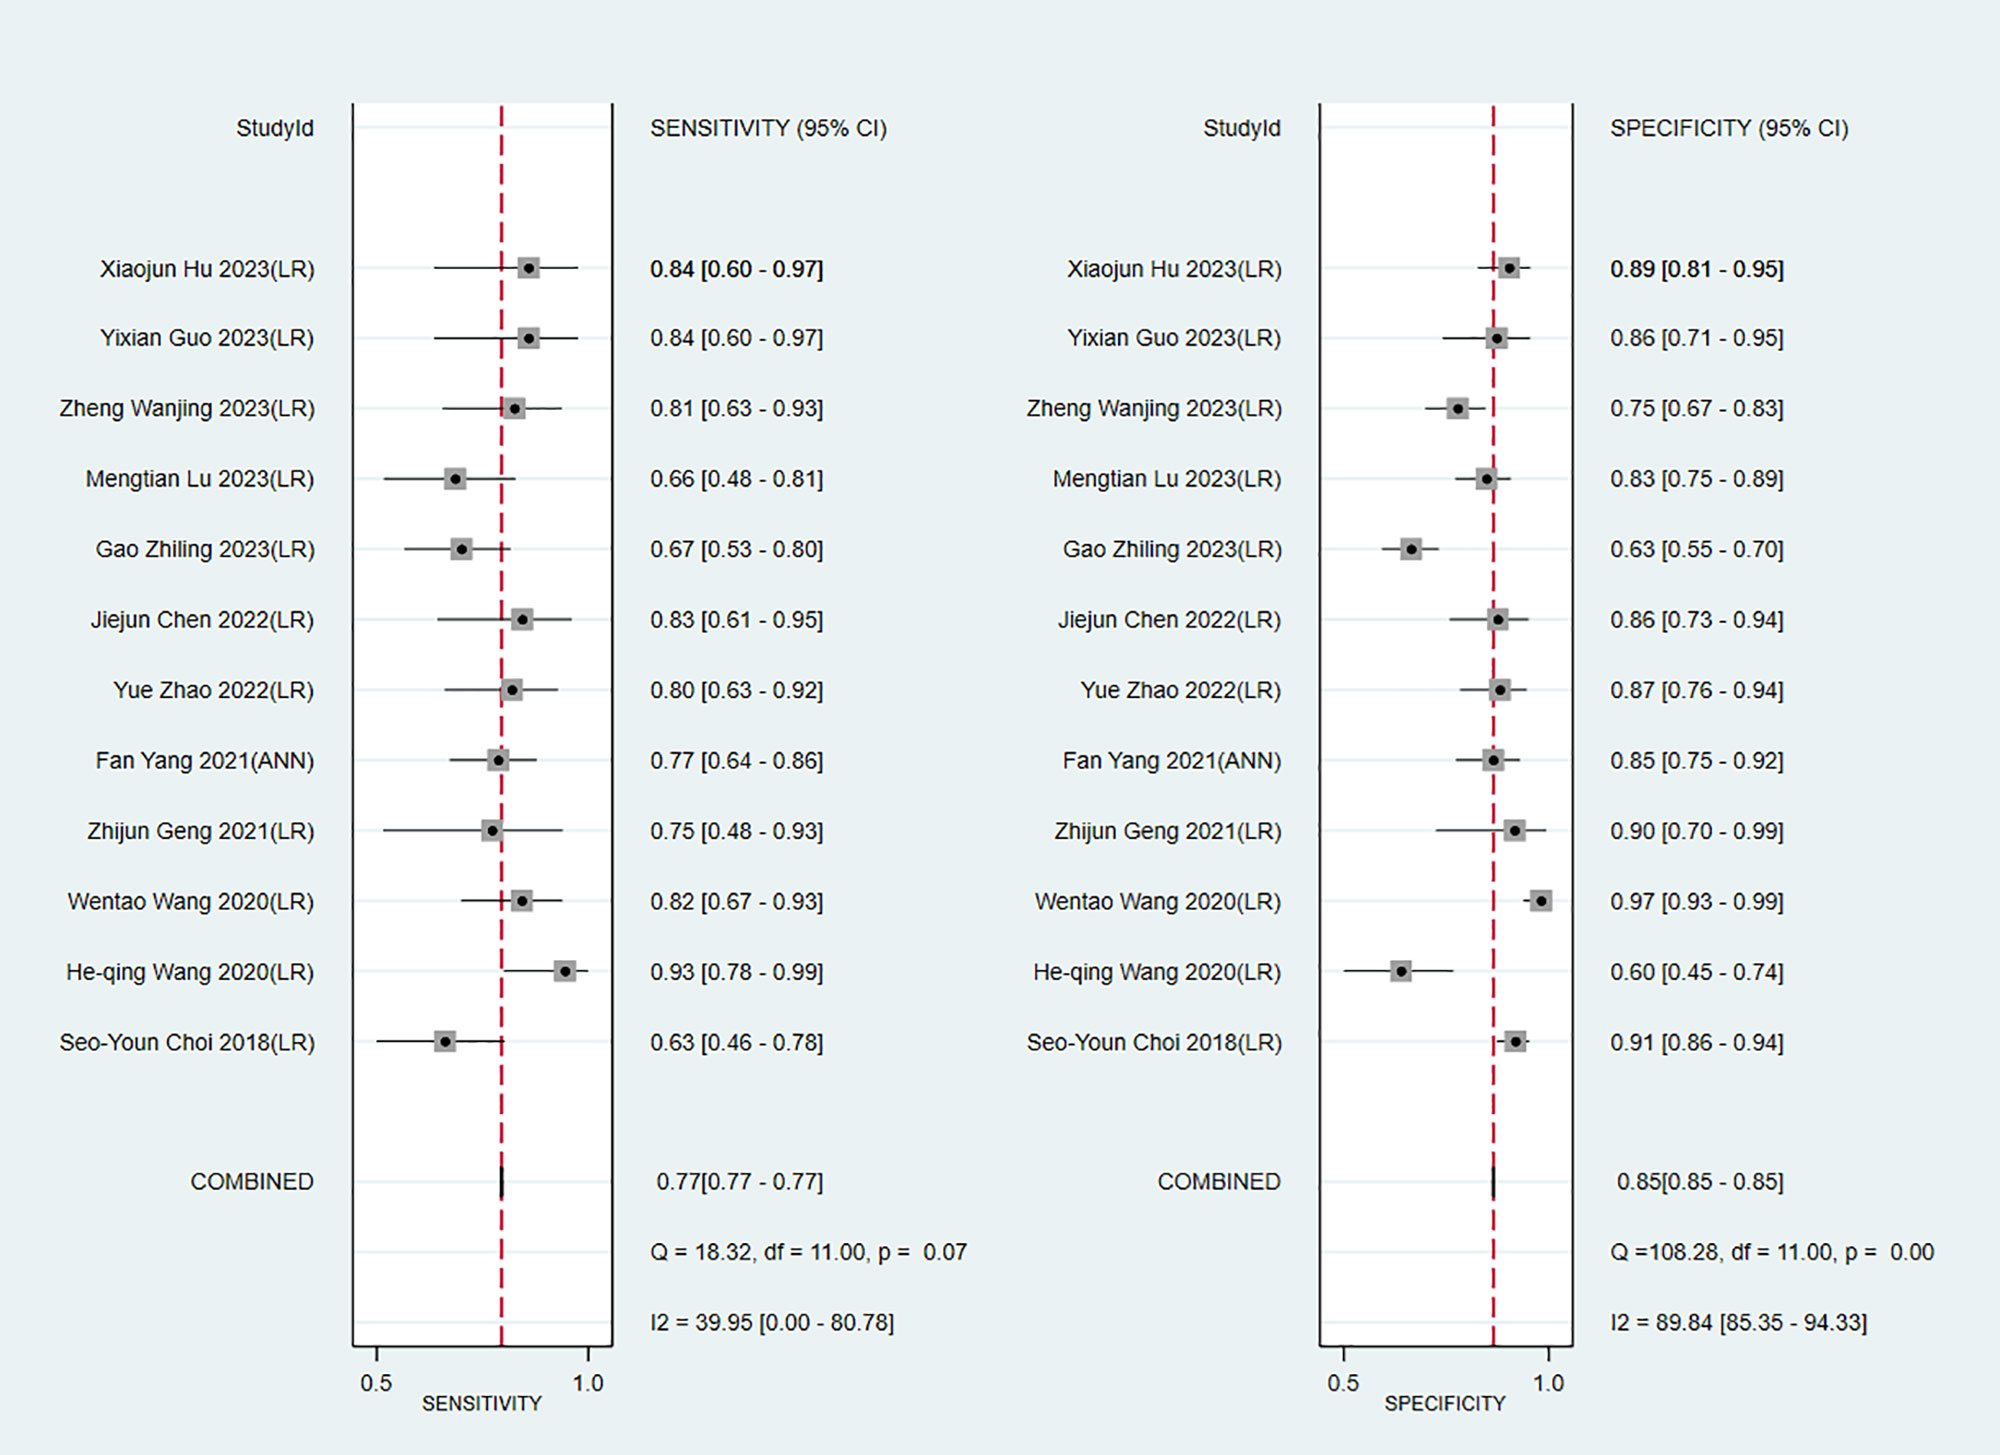
Figure 10 Forest plots for sensitivity and specificity of CK-19 in the training set. [(1) Forest plots for sensitivity are shown on the left and for specificity on the right. (2) 95% confidence interval (CI) is depicted as the horizontal line. (3) The hollow diamond represents the pooled estimates.].
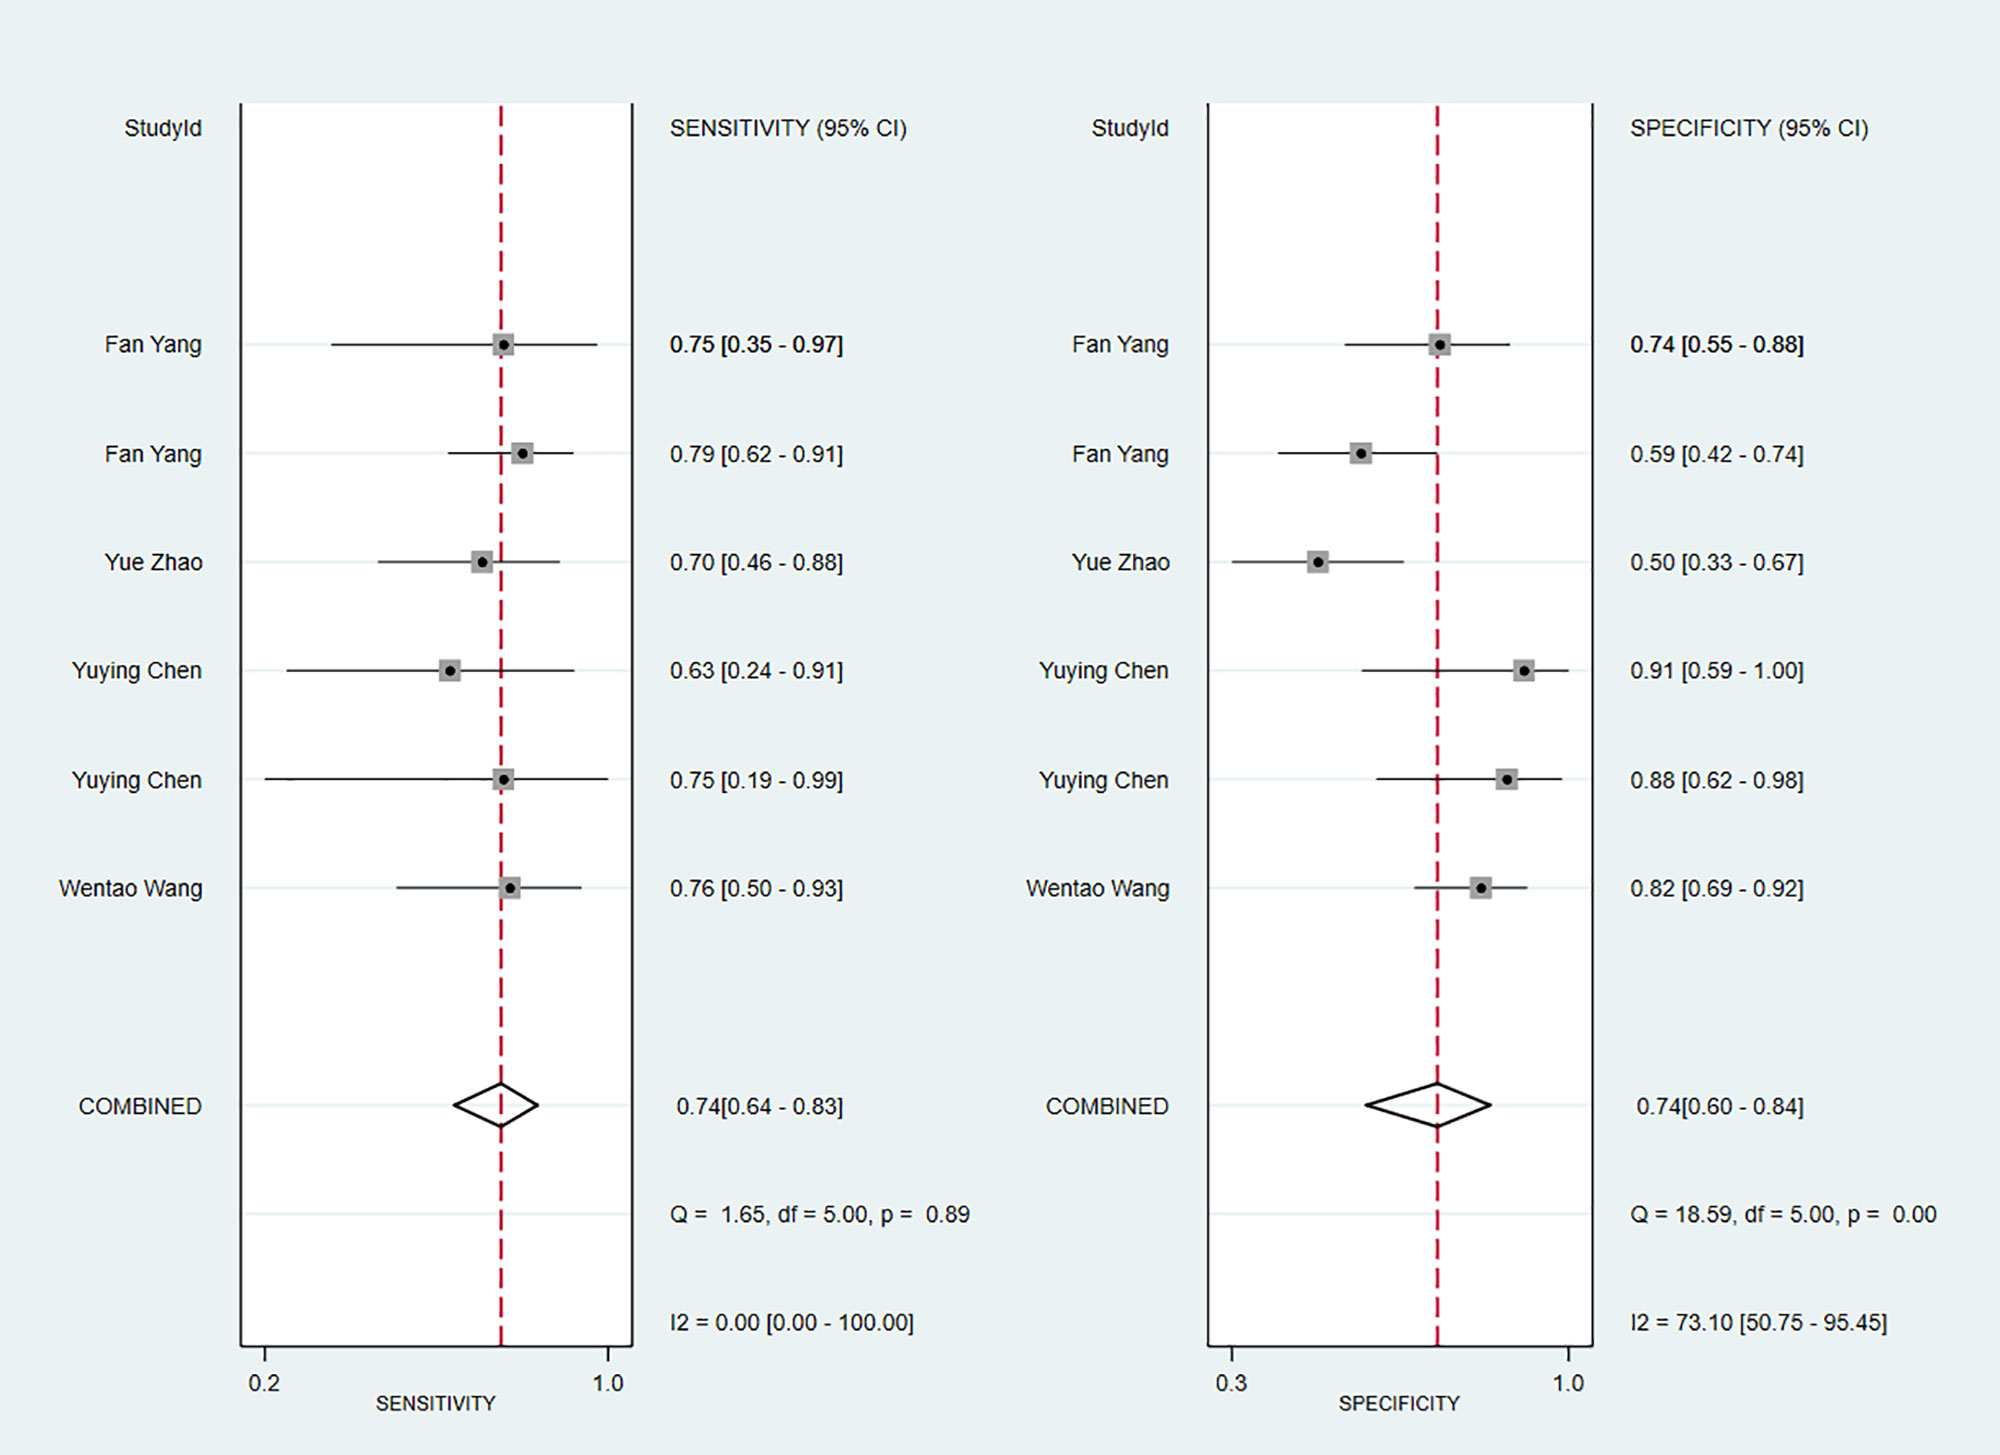
Figure 11 Forest plots for sensitivity and specificity of CK-19 in the validation set. [(1) Forest plots for sensitivity are shown on the left and for specificity on the right. (2) 95% confidence interval (CI) is depicted as the horizontal line. (3) The hollow diamond represents the pooled estimates.].
(2) Subgroup analysis and sensitivity analysis
In the training sets, subgroup analysis based on feature source revealed that C-index was 0.85 (95% CI: 0.77–0.92) for models based on radiomics and clinical features and 0.86 (95% CI: 0.81–0.90) for models based on radiomics features only. The I2 for models based on radiomics and clinical features (88.7% P=0.000) and those based on radiomics only (0.0% P=0.468) implied the feature source was not a significant source of heterogeneity. Further sensitivity analysis confirmed that the synthesized C-index results were stable (Figure 12).
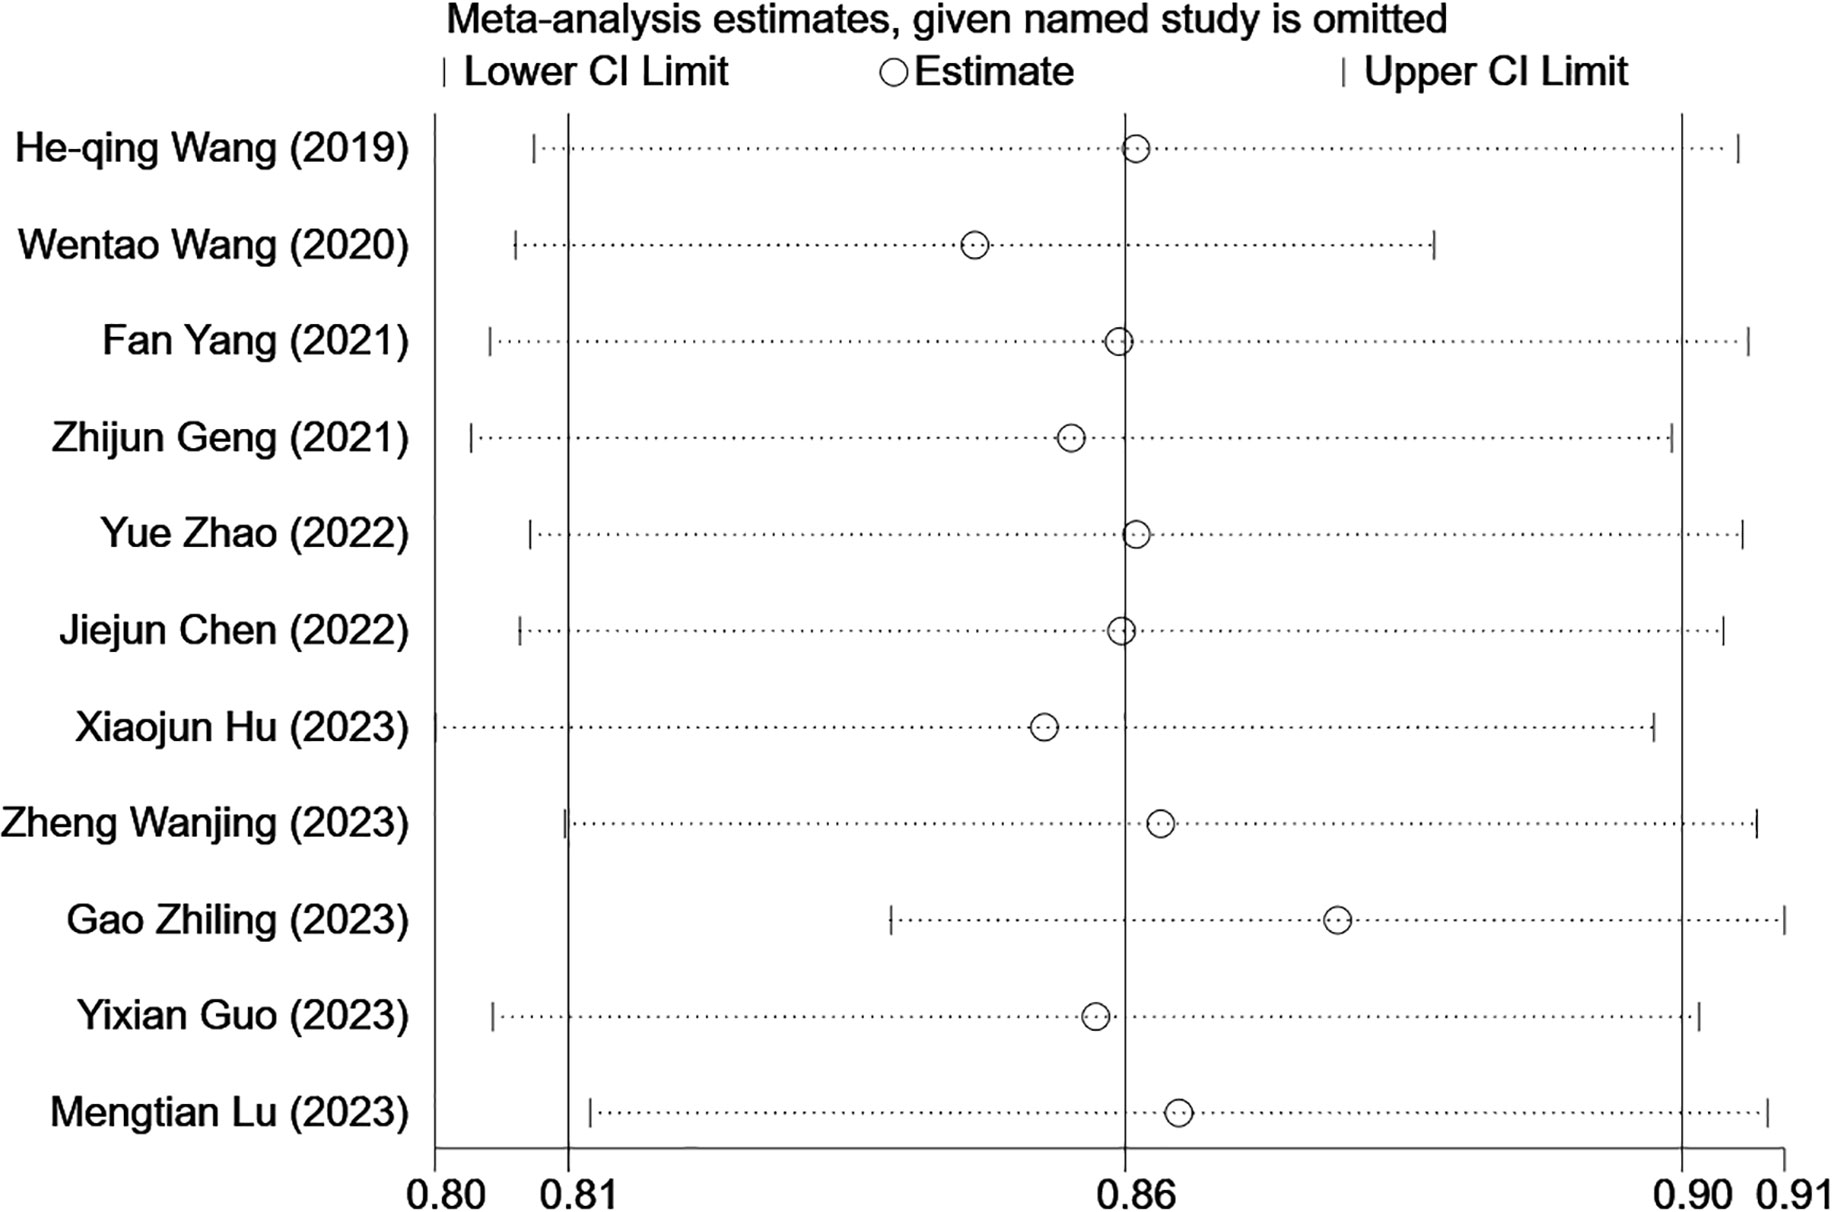
Figure 12 Sensitivity analysis of CK-19 in the training set confirmed that the pooled C-index results were stable. [(1) The ordinate represents the removal of one study. (2) The abscissa represents the pooled C-index after the removal of one study. (3) 95% confidence interval (CI) is depicted as the horizontal line.].
In the validation sets, C-index was 0.75 (95% CI: 0.66–0.84) for external validation, 0.82 (95% CI: 0.74–0.89) for internal validation, 0.81 (95% CI: 0.74–0.88) for models based on radiomics and clinical features, and 0.75 (95% CI: 0.66–0.84) for models based on radiomics features (Table 4).
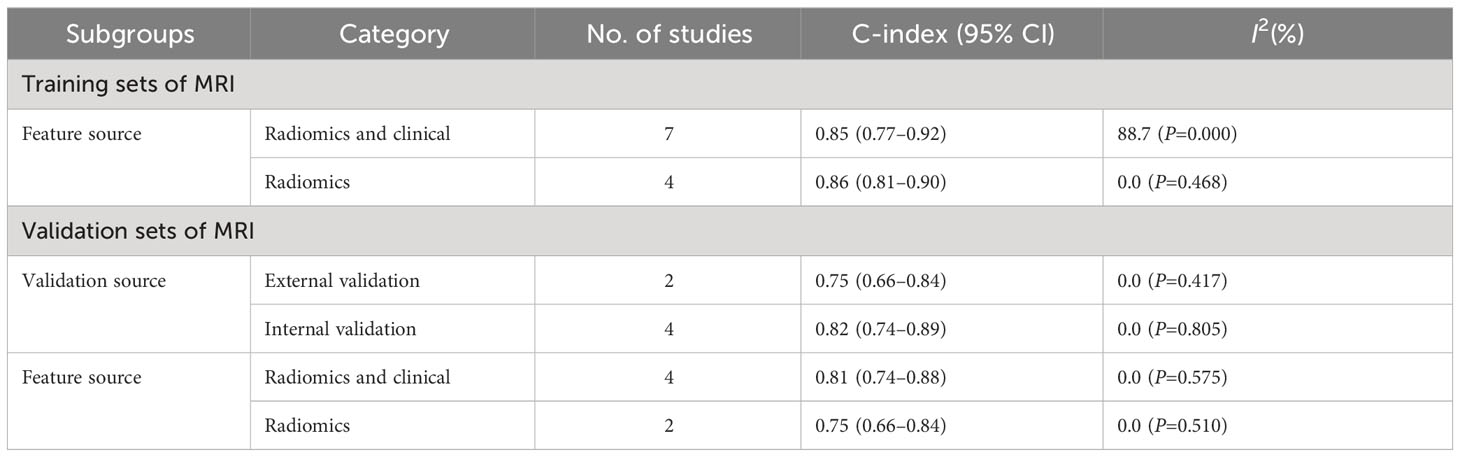
Table 4 Subgroup analysis of CK-19 in training sets and validation sets.
(3) Reporting bias
The Begg’s test showed no publication bias in the MRI-based models in the training sets (P=0.755, continuity corrected). In addition, the funnel plot also revealed stable data without trimming (Figure 13).
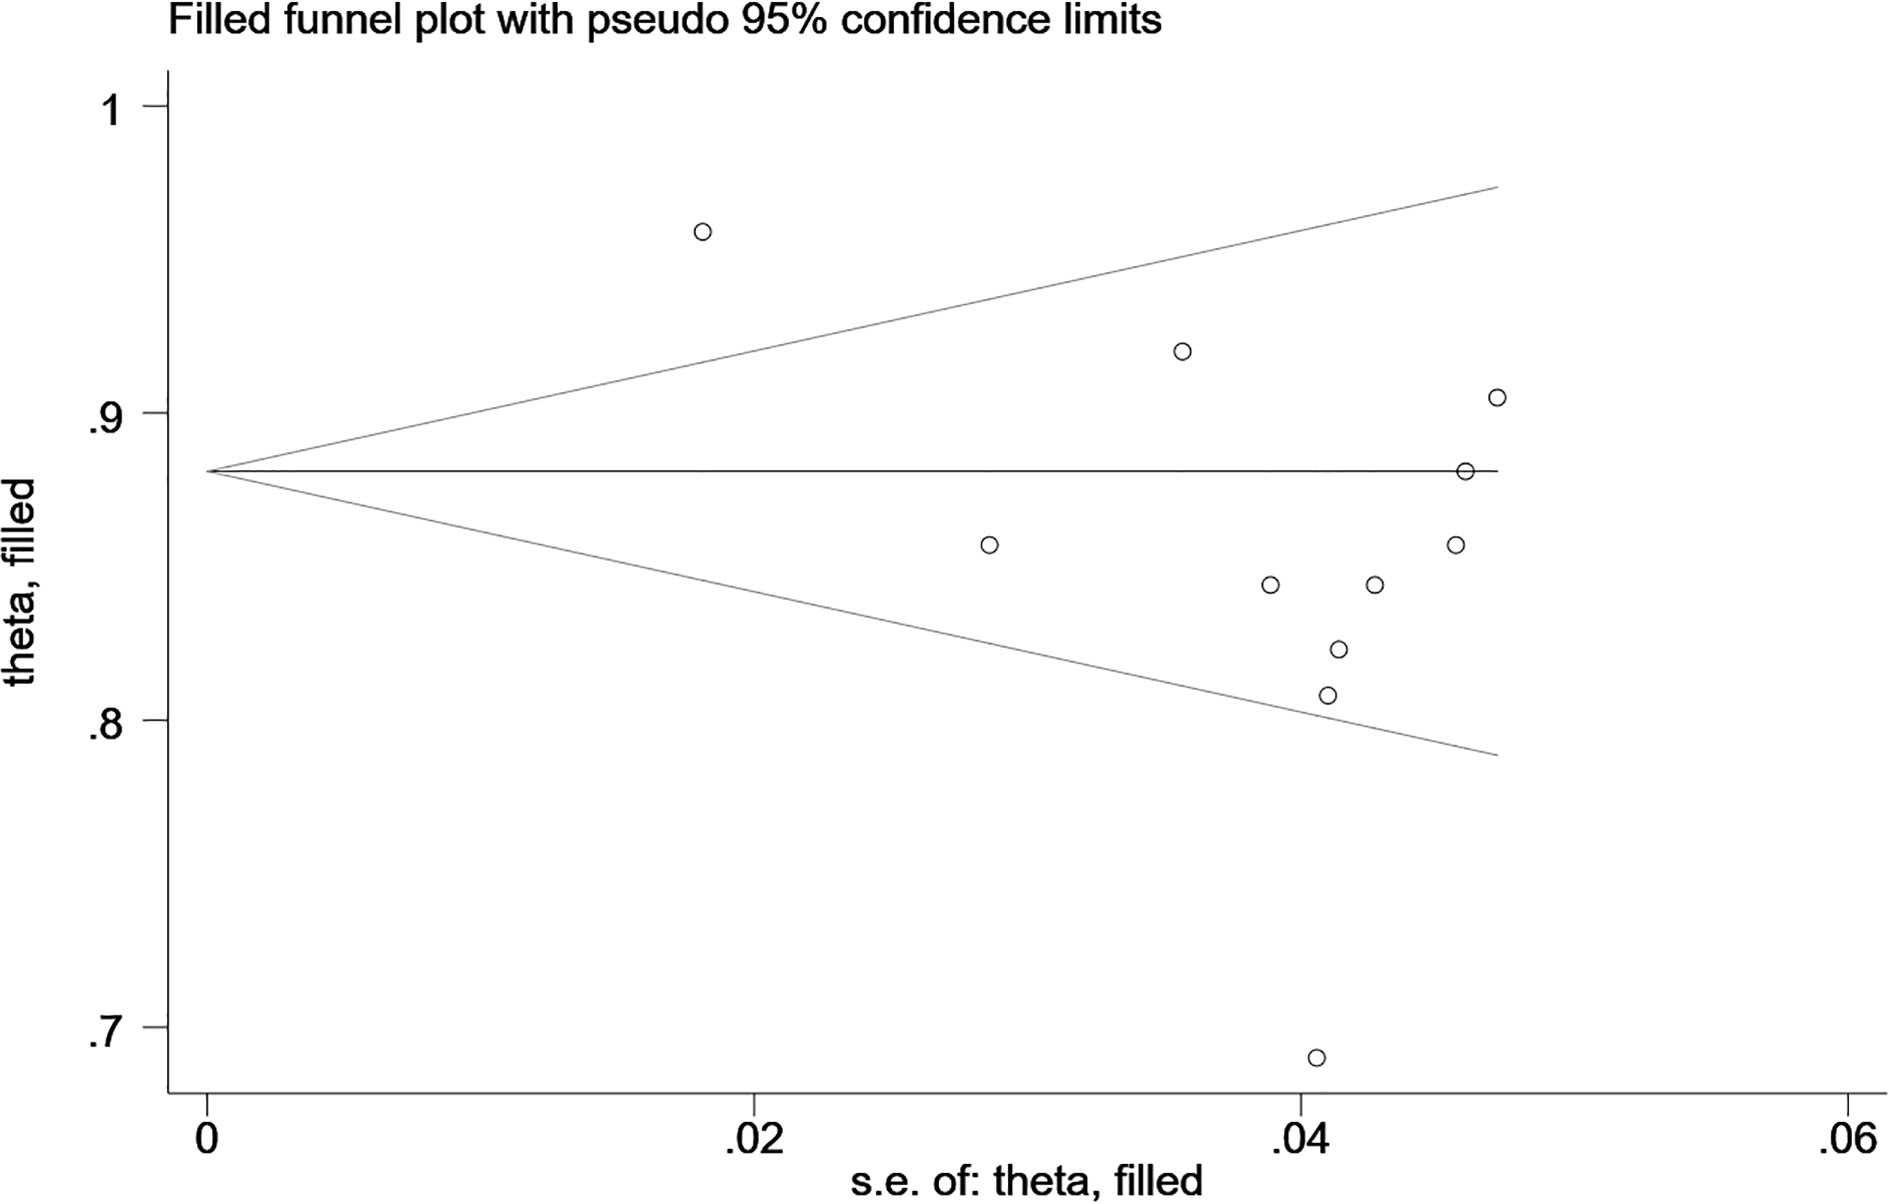
Figure 13 Beggs’ funnel plot of MRI-based models for predicting CK-19 shows there is no publication bias in the MRI-based models in the training sets. [(1) The ordinate represents the C-index value. (2) The abscissa represents the standard error of C-index.].
3.5 Apparent diffusion coefficient
Apparent diffusion coefficient (ADC) value is a highly specific diagnostic marker for Ki-67. We pooled ADC values from three studies (only in training sets) and found that C-index, sensitivity and specificity of the MRI-based models were 0.76(95% CI: 0.72–0.80), 0.83 (95% CI: 0.74–0.89) and 0.66(95% CI: 0.55–0.75), respectively (Figures 14, 15).
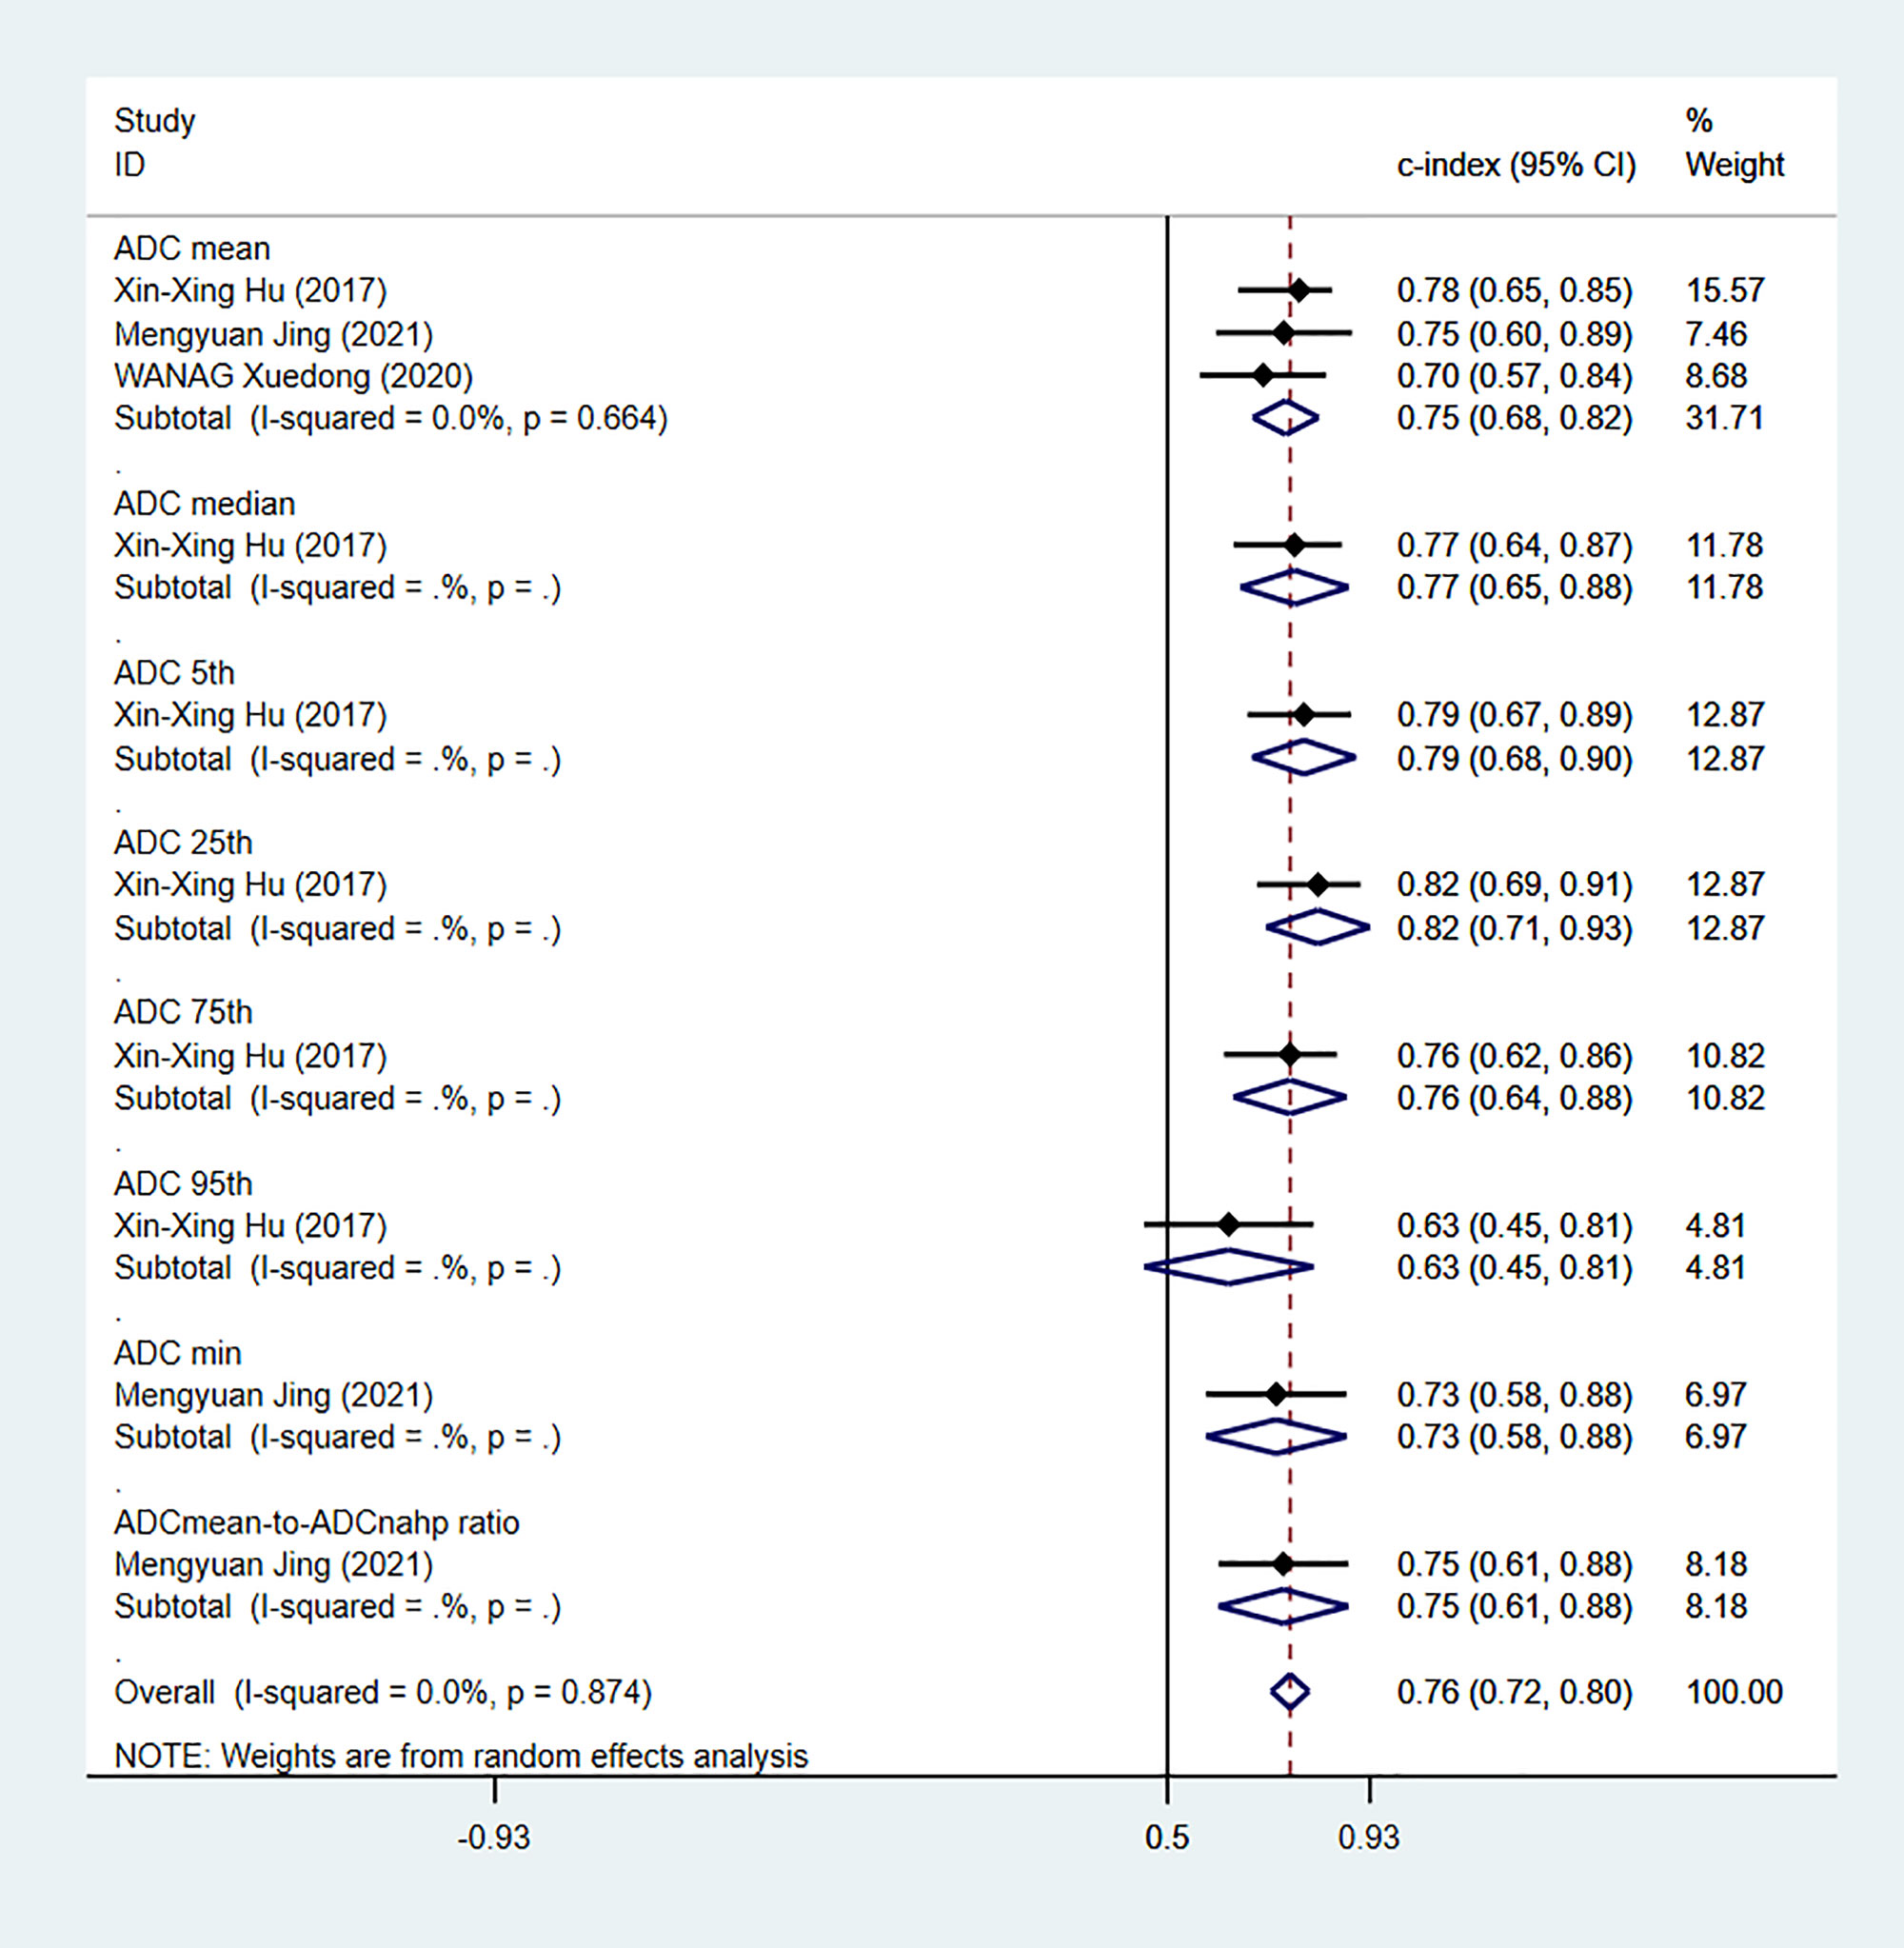
Figure 14 Forest plots for C-index of ADC in the training sets. [(1) Since the C-index estimates are synthesized, the invalid line is 0.5. (2) 95% confidence interval (CI) is depicted as the horizontal line. The hollow diamond represents the pooled C-index.].
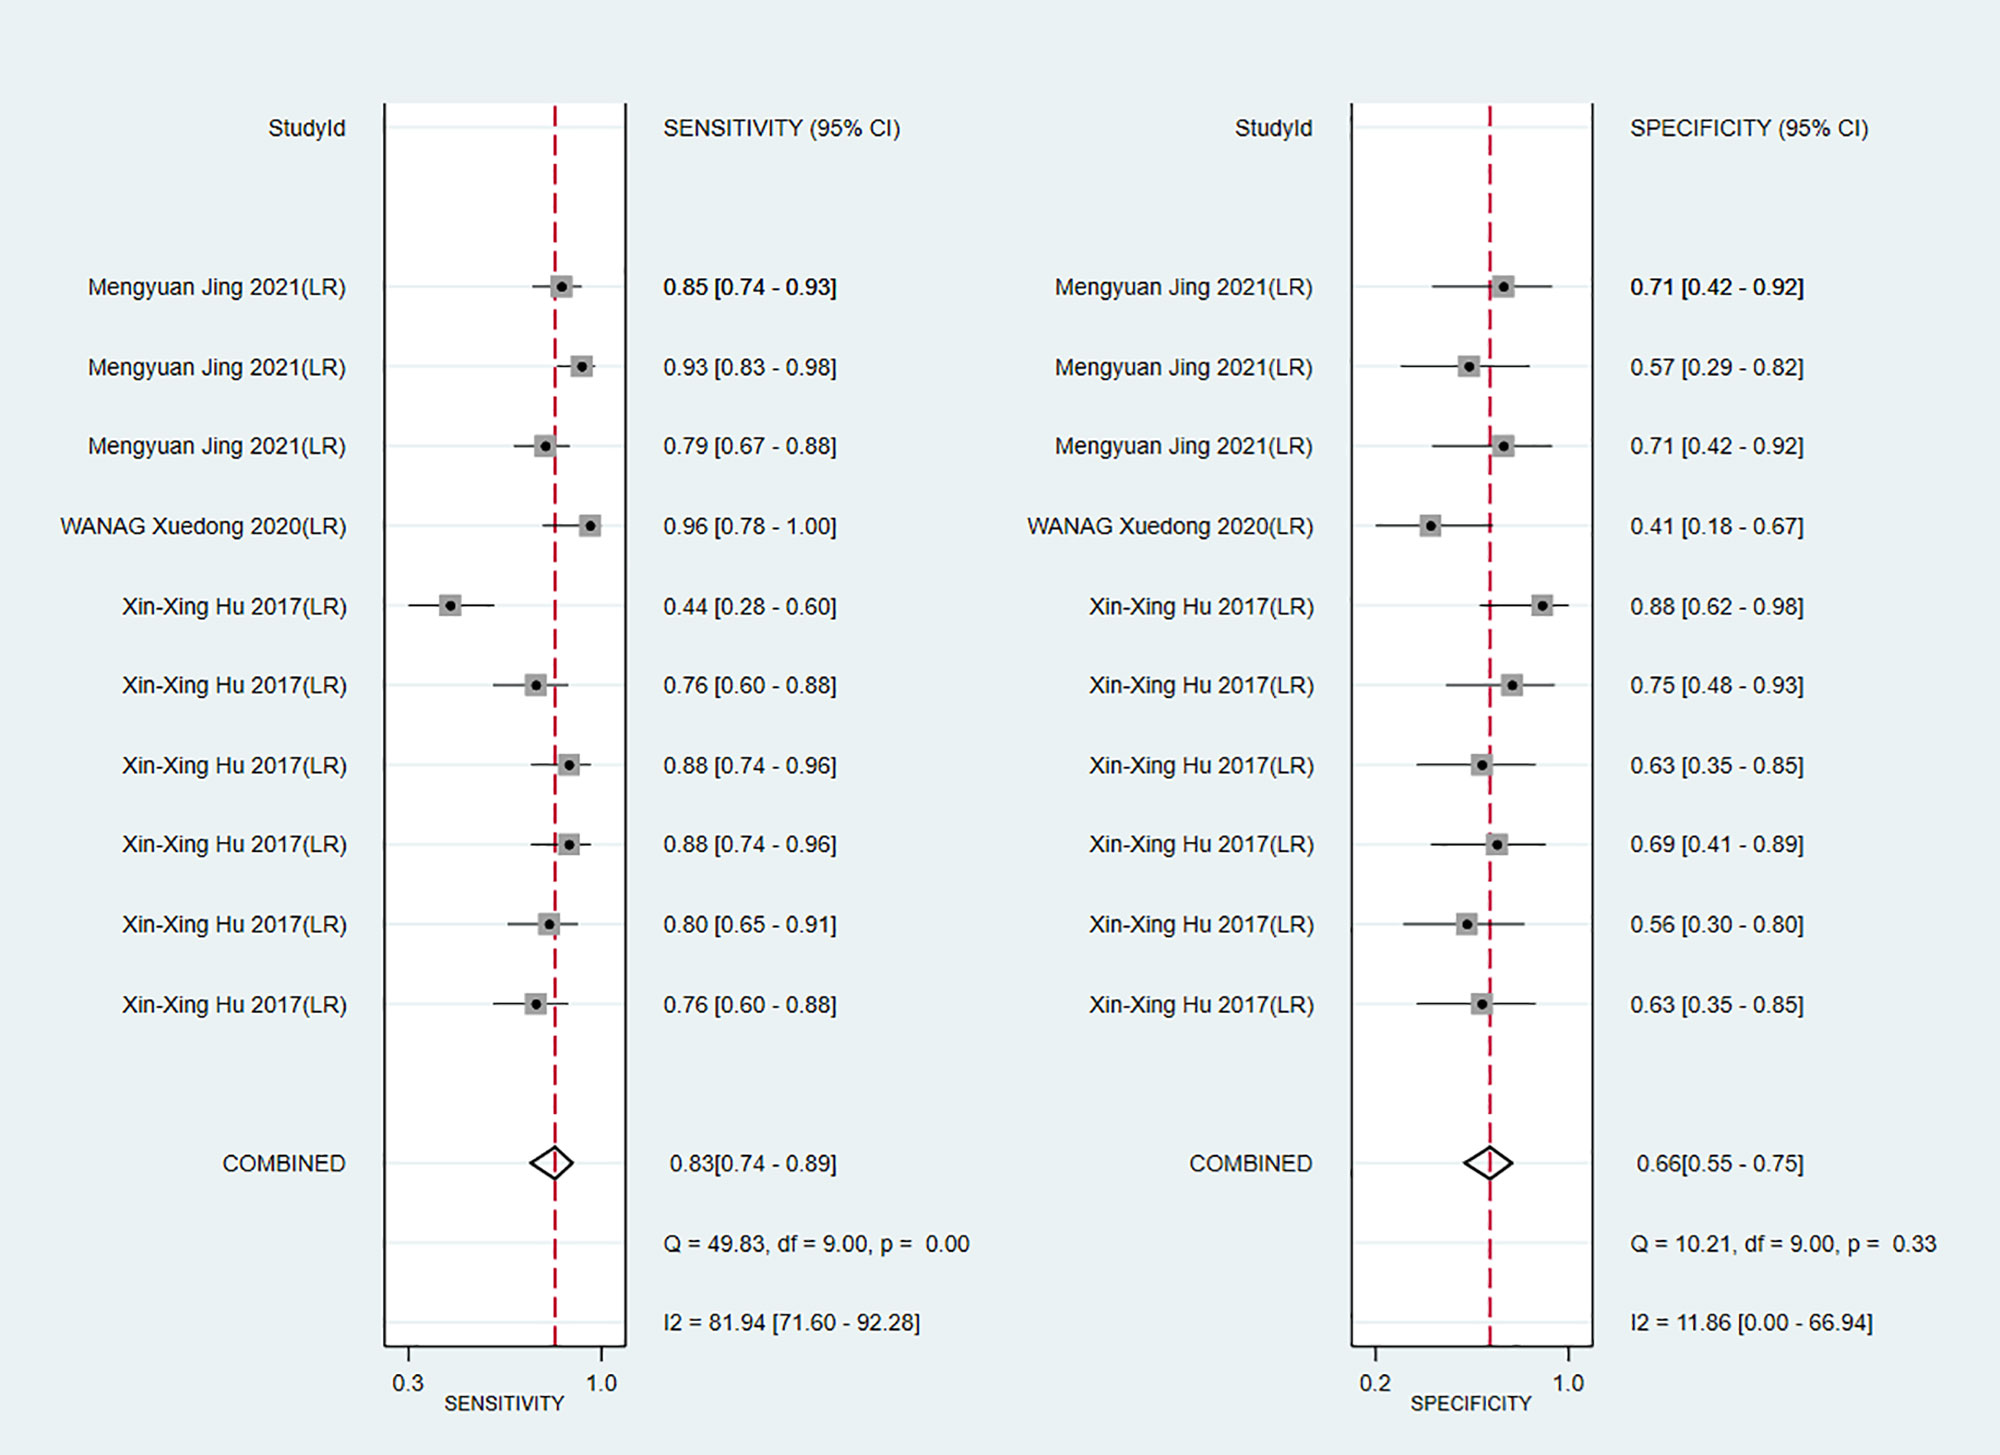
Figure 15 Forest plots for sensitivity and specificity of ADC in the training set. [(1) Forest plots for sensitivity are shown on the left and for specificity on the right. (2) 95% confidence interval (CI) is depicted as the horizontal line. (3) The hollow diamond represents the pooled estimates.].
4 Discussion
4.1 Summary of the main findings
This review shows that there is no clear consensus on the cutoff for positive Ki-67 expression, and a 10% LI score is the common threshold used for defining positive Ki-67 expression (10 out of 18). A previous systematic review has reported that a higher Ki-67 LI indicates a faster progression and poorer prognosis in HCC patients (54). HCC patients with Ki-67 LI > 25% are more susceptible to recurrence after surgery (33), and the mean Ki-67 LI of poorly differentiated HCC is higher than that of well- and moderately differentiated HCC (55). Meanwhile, our pooled results of C-index also suggested that 10% LI score also has a good diagnostic performance in radiomics models. Therefore, this review recommends a 10% LI score as a positive threshold for high Ki-67 expression in radiomics model to aid in early intervention in HCC patients.
ADC value is an important radiomics feature used for predicting MVI and tumor grade in HCC (56). It has also been reported that ADC value is negatively correlated with positive Ki-67 expression and is a predictor for Ki-67 expression in HCC (29, 57). However, compared ADC value pooled results with other pooled results in the study, the diagnostic performance of ADC value is poor. Therefore, it is not recommended to use only a single ADC value for the diagnosis of Ki-67.
Radiomics has demonstrated promising application prospects in differentiating HCC from other solid lesions, and for predicting MVI, early recurrence after hepatectomy, and prognosis after locoregional or systemic therapies (58). Our findings further confirmed that radiomics is a useful non-invasive diagnostic approach for determining Ki-67 and CK-19 expression status and a promising complementary technique to biopsy.
It is worth noting that most of the included studies were from China, which is likely attributed to the high incidence of liver cancer in China (59). Therefore, there is a more urgent need for liver cancer research in China, which may explain why these studies occurred in China.
Based on the evidence from this study, 5% LI is identified as the positive threshold of CK-19, and 10% LI can be used as the positive threshold of Ki-67 for the radiomics model and may be helpful for early intervention of HCC. In terms of radiomics source, MRI is the most extensively studied, regardless of Ki-67 or CK-19. In addition, this study also showed that models combining clinical risk factors and radiomics had higher C-index upper limit, which indicates that the incorporation of clinical risk factors can improve the accuracy of radiomics models in clinical practice.
Taken together, this study suggests that the MRI-based radiomics plus clinical risk factor model can be used for predicting Ki-67 and CK-19 expression in HCC using 10% LI and 5% LI as the positive thresholds for the two markers, respectively.
4.2 Comparison of MRI and US
MRI provides multi-directional, multi-sequence and high-resolution imaging with a plethora of radiomics features. However, MRI is expensive and has a prolonged examination time, which may not be suitable for some patients with metal implants. Compared with MRI, US is less costly, shorter in examination time, and not affected by metals in the patient. However, US examination is more subjective and prone to limitations in the operator’s technique and experience. Our study demonstrated that both US- and MRI-based models have favorable predictive accuracy and can hence be selected according to clinical need.
4.3 Comparison with previous studies
This is to date the first study that systematically evaluates the diagnostic value of radiomics in Ki-67 and CK-19 expression in HCC. A review by Chalkidou et al. indicated that Ki-67 expression was strongly correlated with many cancer types, including brain, lung and breast cancers (60). However, they did not examine the association between Ki-67 and HCC. Other related reviews suggested that high CK-19 or Ki-67 expression was significantly associated with poor prognosis in HCC patients (13, 54). These reviews mainly assessed the prognostic value but not the diagnostic value of radiomics in CK-19 and Ki-67 in HCC.
Despite a lack of comparisons between radiomics and other methods such as immunohistochemistry in current research, radiomics still is a promising non-invasive diagnostic tool for HCC and may serve as a useful complementary approach in patients with contraindications for biopsy or dynamic monitoring after treatment.
4.4 Strengths and limitations
This is the first meta-analysis to quantitatively assess the diagnostic performance of radiomics in predicting Ki-67 or CK-19 expression status and may provide key clues for the further clinical application of radiomics in HCC.
However, several limitations must be considered. First, we included 34 studies, but the external validation of radiomic models was only performed in few studies. Hence, more prospective multicenter trials are needed to fully validate the diagnostic value of radiomics. Second, different inclusion criteria were used in the included studies, making it difficult to determine what clinical settings these results are applicable to. Third, most of the studies included patients with different stages of HCC, which may represent a confounding factor that affects the performance of radiomics model in diagnosis. Fourth, given that a random effects model was used for meta-analysis, the results could possibly be biased with large CIs. Fifth, the threshold for positive Ki-67 expression varied across studies. Although we performed meta-analyses based on different threshold values, some thresholds of Ki-67 were reported in a small number of the studies, which may limit the interpretation of the results. Sixth, most radiomics models were based on MRI, with only a few on US and CT, which may impact the robustness of the pooled results. Therefore, a larger sample size is warranted to enhance the robustness of the results for US- and CT-based models. Last, since most studies originated from Asia, there may be geographic bias in our results.
In addition, we note that at this stage, the included studies mainly focused on the construction of diagnostic models based on radiomics, and lacked the establishment of radiomics score based on the radiomics variables. Therefore, in future studies, researchers should try to establish a radiomics score to analyze the non-linear association between variables and outcome.
5 Conclusions
MRI-based radiomics is a promising non-invasive diagnostic tool for predicting positive Ki-67 and CK-19 expression in HCC patients. A standard method for constructing radiomics models should be established in future studies to ensure consistency. In addition, since some of the items of the RQS were difficult to implement, further updates of the RQS may be warranted in subsequent studies. Moreover, the threshold for positive Ki-67 expression remains controversial, and thus as reasonable threshold that affects prognosis will need to be identified.
Data availability statement
The original contributions presented in the study are included in the article/Supplementary Material. Further inquiries can be directed to the corresponding author.
Author contributions
LZ: Conceptualization, Data curation, Formal Analysis, Methodology, Writing – original draft, Writing – review & editing. YC: Conceptualization, Data curation, Formal Analysis, Methodology, Writing – original draft, Writing – review & editing. YL: Resources, Software, Supervision, Writing – original draft. CW: Resources, Software, Writing – original draft. CX: Investigation, Supervision, Writing – original draft. XW: Conceptualization, Formal Analysis, Methodology, Writing – review & editing.
Funding
The author(s) declare that no financial support was received for the research, authorship, and/or publication of this article.
Conflict of interest
The authors declare that the research was conducted in the absence of any commercial or financial relationships that could be construed as a potential conflict of interest.
Publisher’s note
All claims expressed in this article are solely those of the authors and do not necessarily represent those of their affiliated organizations, or those of the publisher, the editors and the reviewers. Any product that may be evaluated in this article, or claim that may be made by its manufacturer, is not guaranteed or endorsed by the publisher.
Supplementary material
The Supplementary Material for this article can be found online at: https://www.frontiersin.org/articles/10.3389/fonc.2023.1323534/full#supplementary-material
References
1. Konyn P, Ahmed A, Kim D. Current epidemiology in hepatocellular carcinoma. Expert Rev GASTROENT (2021) 15(11):1295–307. doi: 10.1080/17474124.2021.1991792
2. Sung H, Ferlay J, Siegel RL, Laversanne M, Soerjomataram I, Jemal A, et al. Global cancer statistics 2020: globocan estimates of incidence and mortality worldwide for 36 cancers in 185 countries. CA-CANCER J Clin (2021) 71(3):209–49. doi: 10.3322/caac.21660
3. Benson AB, Michael I DA, Abrams T, Abbott DE, Ahmed A. Nccn guidelines version 1.2023 hepatocellular carcinoma. Natl Compr Cancer Network (2023), 1–104.
4. Zhang W, Zhang B, Chen XP. Adjuvant treatment strategy after curative resection for hepatocellular carcinoma. Front Med (2021) 15(2):155–69. doi: 10.1007/s11684-021-0848-3
5. Erstad DJ, Tanabe KK. Prognostic and therapeutic implications of microvascular invasion in H epatocellular carcinoma. Ann Surg Oncol (2019) 26(5):1474–93. doi: 10.1245/s10434-019-07227-9
6. Martins-Filho SN, Paiva C, Azevedo RS, Alves VAF. Histological grading of hepatocellular carcinoma-a systematic review O F literature. Front Med (Lausanne) (2017) 4:193. doi: 10.3389/fmed.2017.00193
7. Kim H, Choi GH, Na DC, Ahn EY, Kim GI, Lee JE, et al. Human hepatocellular carcinomas with "Stemness"-related marker express ion: keratin 19 expression and a poor prognosis. Hepatology (2011) 54(5):1707–17. doi: 10.1002/hep.24559
8. Ito Y, Matsuura N, Sakon M, Takeda T, Umeshita K, Nagano H, et al. Both cell proliferation and apoptosis significantly predict shortened disease-free survival in hepatocellular carcinoma. BRIT J Cancer (1999) 4):81.
9. Scholzen T, Gerdes. J. The ki-67 protein: from the known and the unknown. J Cell Physiol (2000) 182(3):311–22.
10. Burkhart RA, Ronnekleiv-Kelly SM, Pawlik TM. Personalized therapy in hepatocellular carcinoma: molecular markers of prognosis and therapeutic response. Surg Oncol (2017) 26(2):138–45. doi: 10.1016/j.suronc.2017.01.009
11. Zhao Y-F, Xiong X, Chen K, Tang W, Yang X, Shi Z-R. Evaluation of the therapeutic effect of adjuvant transcatheter arteria L chemoembolization based on ki67 after hepatocellular carcinoma surgery. Front Oncol (2021) 11:605234. doi: 10.3389/fonc.2021.605234
12. Schmilovitz-Weiss H, Tobar A, Halpern M, Levy I, Shabtai E, Ben-Ari Z. Tissue expression of squamous cellular carcinoma antigen and ki67 in hepatocellular carcinoma-correlation with prognosis: A historical prosp ective study. Diagn Pathol (2011) 6:121. doi: 10.1186/1746-1596-6-121
13. Sun DW, Zhang YY, Sun XD, Chen YG, Qiu W, Ji M, et al. Prognostic value of cytokeratin 19 in hepatocellular carcinoma: A meta-analysis. Clin Chim Acta (2015) 448:161–9. doi: 10.1016/j.cca.2015.06.027
14. Varma V, Cohen C. Immunohistochemical and molecular markers in the diagnosis of hepatocellular carcinoma. Adv Anat Pathol (2004) 11(5):239–49. doi: 10.1097/01.pap.0000131822.31576.9d
15. Zhuo JY, Lu D, Tan WY, Zheng SS, Shen YQ, Xu X. Ck19-positive hepatocellular carcinoma is a characteristic subtype. J Cancer (2020) 11(17):5069–77. doi: 10.7150/jca.44697
16. Zhuo J, Lu D, Lin Z, Yang X, Yang M, Wang J, et al. The distinct responsiveness of cytokeratin 19-positive hepatocellular carcinoma to regorafenib. Cell Death Dis (2021) 12(12):1084. doi: 10.1038/s41419-021-04320-4
17. Lambin P, Rios-Velazquez E, Leijenaar R, Carvalho S, van Stiphout RG, Granton P, et al. Radiomics: extracting more information from medical images using advanced feature analysis. Eur J Cancer (2012) 48(4):441–6. doi: 10.1016/j.ejca.2011.11.036
18. Lambin P, Leijenaar RTH, Deist TM, Peerlings J, de Jong EEC, van Timmeren J, et al. Radiomics: the bridge between medical imaging and personalized medicine. Nat Rev Clin Oncol (2017) 14(12):749–62. doi: 10.1038/nrclinonc.2017.141
19. Debray TP, Damen JA, Riley RD, Snell K, Reitsma JB, Hooft L, et al. A framework for meta-analysis of prediction model studies with binary and time-to-event outcomes. Stat Methods Med Res (2019) 28(9):2768–86. doi: 10.1177/0962280218785504
20. Hu XX, Yang ZX, Liang HY, Ding Y, Grimm R, Fu CX, et al. Whole-tumor mri histogram analyses of hepatocellular carcinoma: correlations with ki-67 labeling index. J Magn Reson Imaging (2017) 46(2):383–92. doi: 10.1002/jmri.25555
21. Yao Z, Dong Y, Wu G, Zhang Q, Yang D, Yu JH, et al. Preoperative diagnosis and prediction of hepatocellular carcinoma: radiomics analysis based on multi-modal ultrasound images. BMC Cancer (2018) 18(1):1089. doi: 10.1186/s12885-018-5003-4
22. Ye Z, Jiang H, Chen J, Liu X, Wei Y, Xia C, et al. Texture analysis on gadoxetic acid enhanced-mri for predicting ki-67 status in hepatocellular carcinoma: A prospective study. Chin J Cancer Res (2019) 31(5):806–17. doi: 10.21147/j.issn.1000-9604.2019.05.10
23. Chen Y, Qin X, Long L, Zhang L, Huang Z, Jiang Z, et al. Diagnostic value of gd-eob-dtpa-enhanced mri for the expression of ki67 and microvascular density in hepatocellular carcinoma. J Magn Reson Imaging (2020) 51(6):1755–63. doi: 10.1002/jmri.26974
24. Hu M, Yu Y, Fan Y, Wang X, Hu S, Hu C. The value of gadolinium-ethoxybenzyl-diethylenetriamine pentaacetic acid enhanced mri nomogram model for predicting ki-67 expression of hepatocellular carcinoma. Chin J Radiol (2020) 54(12):1185–90. doi: 10.3760/cma.j.cn112149-20191206-00968
25. Shi G, Han X, Wang Q, Ding Y, Liu H, Zhang Y, et al. Evaluation of multiple prognostic factors of hepatocellular carcinoma with intra-voxel incoherent motions imaging by extracting the histogram metrics. Cancer Manag Res (2020) 12:6019–31. doi: 10.2147/cmar.S262973
26. Wu H, Han X, Wang Z, Mo L, Liu W, Guo Y, et al. Prediction of the ki-67 marker index in hepatocellular carcinoma based on ct radiomics features. Phys Med Biol (2020) 65(23):235048. doi: 10.1088/1361-6560/abac9c
27. Ye Z, Cao L, Wei Y, Chen J, Zhang Z, Yao S, et al. Preoperative prediction of hepatocellular carcinoma with highly aggressive characteristics using quantitative parameters derived from hepatobiliary phase mr images. Ann Transl Med (2020) 8(4):85. doi: 10.21037/atm.2020.01.04
28. Fan Y, Yu Y, Wang X, Hu M, Hu C. Radiomic analysis of gd-eob-dtpa-enhanced mri predicts ki-67 expression in hepatocellular carcinoma. BMC Med Imaging (2021) 21(1):100. doi: 10.1186/s12880-021-00633-0
29. Jing M, Cao Y, Zhang P, Zhang B, Lin X, Deng L, et al. The benefit of apparent diffusion coefficient in evaluating the invasiveness of hepatocellular carcinoma. Front Oncol (2021) 11:719480. doi: 10.3389/fonc.2021.719480
30. Dong Y, Zuo D, Qiu YJ, Cao JY, Wang HZ, Wang WP. Prediction of histological grades and ki-67 expression of hepatocellular carcinoma based on sonazoid contrast enhanced ultrasound radiomics signatures. Diagnostics (Basel) (2022) 12(9):2175. doi: 10.3390/diagnostics12092175
31. Hu X, Zhou J, Li Y, Wang Y, Guo J, Sack I, et al. Added value of viscoelasticity for mri-based prediction of ki-67 expression of hepatocellular carcinoma using a deep learning combined radiomics (Dlcr) model. Cancers (Basel) (2022) 14(11):2575. doi: 10.3390/cancers14112575
32. Huang Z, Zhou P, Li S, Li K. Prediction of the ki-67 marker index in hepatocellular carcinoma based on dynamic contrast-enhanced ultrasonography with sonazoid. Insights Imaging (2022) 13(1):199. doi: 10.1186/s13244-022-01320-6
33. Liu Z, Yang S, Chen X, Luo C, Feng J, Chen H, et al. Nomogram development and validation to predict ki-67 expression of hepatocellular carcinoma derived from gd-eob-dtpa-enhanced mri combined with T1 mapping. Front Oncol (2022) 12:954445. doi: 10.3389/fonc.2022.954445
34. Wang X, Chen M, Liu X, Yu X, Wang L. Mr iterative decomposition of water and fat with echo asymmetry and least-squares estimation-iron sequence and diffusion weighted image for evaluating expression of ki-67 of hepatocellular carcinoma. Chin J Med Imaging Technol (2022) 38(1):98–102. doi: 10.13929/j.issn.1003-3289.2022.01.023
35. Wu C, Chen J, Fan Y, Zhao M, He X, Wei Y, et al. Nomogram based on ct radiomics features combined with clinical factors to predict ki-67 expression in hepatocellular carcinoma. Front Oncol (2022) 12:943942. doi: 10.3389/fonc.2022.943942
36. Yan C, Han Z, Chen X, Gao L, Ye R, Li Y. Diffusion-weighted imaging as a quantitative imaging biomarker for predicting proliferation rate in hepatocellular carcinoma: developing a radiomics nomogram. J Comput Assist Tomogr (2023) 47(4):539–47. doi: 10.1097/rct.0000000000001448
37. Zhang L, Duan S, Qi Q, Li Q, Ren S, Liu S, et al. Noninvasive prediction of ki-67 expression in hepatocellular carcinoma using machine learning-based ultrasomics: A multicenter study. J Ultrasound Med (2023) 42(5):1113–22. doi: 10.1002/jum.16126
38. Kawai T, Yasuchika K, Seo S, Higashi T, Ishii T, Miyauchi Y, et al. Identification of keratin 19-positive cancer stem cells associating human hepatocellular carcinoma using 18f-fluorodeoxyglucose positron emission tomography. Clin Cancer Res (2017) 23(6):1450–60. doi: 10.1158/1078-0432.CCR-16-0871
39. Choi SY, Kim SH, Park CK, Min JH, Lee JE, Choi YH, et al. Imaging features of gadoxetic acid-enhanced and diffusion-weighted mr imaging for identifying cytokeratin 19-positive hepatocellular carcinoma: A retrospective observational study. Radiology (2018) 286(3):897–908. doi: 10.1148/radiol.2017162846
40. Wang HQ, Yang C, Zeng MS, Rao SX, Ji Y, Weng X, et al. Magnetic resonance texture analysis for the identification of cytokeratin 19-positive hepatocellular carcinoma. Eur J Radiol (2019) 117:164–70. doi: 10.1016/j.ejrad.2019.06.016
41. Wang W, Gu D, Wei J, Ding Y, Yang L, Zhu K, et al. A radiomics-based biomarker for cytokeratin 19 status of hepatocellular carcinoma with gadoxetic acid–enhanced mri. Eur Radiol (2020) 30(5):3004–14. doi: 10.1007/s00330-019-06585-y
42. Chen Y, Chen J, Zhang Y, Lin Z, Wang M, Huang L, et al. Preoperative prediction of cytokeratin 19 expression for hepatocellular carcinoma with deep learning radiomics based on gadoxetic acid-enhanced magnetic resonance imaging. J HEPATOCELL CARCINO (2021) 8:795–808. doi: 10.2147/JHC.S313879
43. Geng Z, Zhang Y, Wang S, Li H, Zhang C, Yin S, et al. Radiomics analysis of susceptibility weighted imaging for hepatocellular carcinoma: exploring the correlation between histopathology and radiomics features. Magn Reson Med Sci (2021) 20(3):253–63. doi: 10.2463/mrms.mp.2020-0060
44. Yang F, Wan Y, Xu L, Wu Y, Shen X, Wang J, et al. Mri-radiomics prediction for cytokeratin 19-positive hepatocellular carcinoma: A multicenter study. Fron Oncol (2021) 11:672126. doi: 10.3389/fonc.2021.672126
45. Zheng W, Xing Z, Xiong M, Lin X, Cao D. The value of gadobenate dimeglumine multi-phase enhanced mri in predicting the expression of cytokeratin19 in hepatocellular carcinoma. Chin J Radiol (2021) 55(6):644–9. doi: 10.3760/cma.j.cn112149-20200428-00623
46. Gao Z, Shu J, Chen Y, Sun C, Yang G. Application value of magnetic resonance imaging targetoid enhancement combined with alpha-fetoprotein level in evaluating the expression of cytokeratin 19 in hepatocellular carcinoma. Chin J Dig Surg (2022) 21(7):956–65. doi: 10.3760/cma.j.cn115610-20220515-00276
47. Guo Y, Chen J, Zhang Y, Guo Y, Jiang M, Dai Y, et al. Differentiating cytokeratin 19 expression of hepatocellular carcinoma by using multi-B-value diffusion-weighted mr imaging with mono-exponential, stretched exponential, intravoxel incoherent motion, diffusion kurtosis imaging and fractional order calculus models. Eur J Radiol (2022) 150:110237. doi: 10.1016/j.ejrad.2022.110237
48. Zhang L, Qi Q, Li Q, Ren S, Liu S, Mao B, et al. Ultrasomics prediction for cytokeratin 19 expression in hepatocellular carcinoma: A multicenter study. Front Oncol (2022) 12:994456. doi: 10.3389/fonc.2022.994456
49. Chen J, Liu D, Guo Y, Zhang Y, Guo Y, Jiang M, et al. Preoperative identification of cytokeratin 19 status of hepatocellular carcinoma based on diffusion kurtosis imaging. ABDOM Radiol (2023) 48(2):579–89. doi: 10.1007/s00261-022-03736-6
50. Hu X, Wang Q, Huang G, He X, Sparrelid E, Brismar TB, et al. Gadoxetic acid-enhanced mri-based radiomics signature: A potential imaging biomarker for identifying cytokeratin 19-positive hepatocellular carcinoma. Comput MATH METHOD M (2023) 2023:5424204. doi: 10.1155/2023/5424204
51. Lu M, Qu Q, Xu L, Zhang J, Liu M, Jiang J, et al. Prediction for aggressiveness and postoperative recurrence of hepatocellular carcinoma using gadoxetic acid-enhanced magnetic resonance imaging. Acad Radiol (2023) 30(5):841–52. doi: 10.1016/j.acra.2022.12.018
52. Lv J, Yin H, Yu H, Shi H. The added value of 18f-fdg pet/mri multimodal imaging in hepatocellular carcinoma for identifying cytokeratin 19 status. ABDOM Radiol (2023) 48(7):2331–9. doi: 10.1007/s00261-023-03911-3
53. Zhao Y, Tan X, Chen J, Tan H, Huang H, Luo P, et al. Preoperative prediction of cytokeratin-19 expression for hepatocellular carcinoma using T1 mapping on gadoxetic acid-enhanced mri combined with diffusion-weighted imaging and clinical indicators. Fron Oncol (2023) 12:1068231. doi: 10.3389/fonc.2022.1068231
54. Luo Y, Ren F, Liu Y, Shi Z, Tan Z, Xiong H, et al. Clinicopathological and prognostic significance of high ki-67 labeling index in hepatocellular carcinoma patients: A meta-analysis. Int J Clin Exp Med (2015) 8(7):10235–47.
55. Murakami K, Kasajima A, Kawagishi N, Ohuchi N, Sasano H. Microvessel density in hepatocellular carcinoma: prognostic significance and review of the previous published work. Hepatol Res (2015) 45(12):1185–94. doi: 10.1111/hepr.12487
56. Surov A, Pech M, Omari J, Fischbach F, Damm R, Fischbach K, et al. Diffusion-weighted imaging reflects tumor grading and microvascular invasion in hepatocellular carcinoma. Liver Cancer (2021) 10(1):10–24. doi: 10.1159/000511384
57. Surov A, Meyer HJ, Wienke A. Associations between apparent diffusion coefficient (Adc) and ki 67 in different tumors: A meta-analysis. Part 1: adc(Mean). Oncotarget (2017) 8(43):75434–44. doi: 10.18632/oncotarget.20406
58. Harding-Theobald E, Louissaint J, Maraj B, Cuaresma E, Townsend W, Mendiratta-Lala M, et al. Systematic review: radiomics for the diagnosis and prognosis of hepatocellular carcinoma. Aliment Pharmacol Ther (2021) 54(7):890–901. doi: 10.1111/apt.16563
59. Rumgay H, Arnold M, Ferlay J, Lesi O, Cabasag CJ, Vignat J, et al. Global burden of primary liver cancer in 2020 and predictions to 2040. J Hepatol (2022) 77(6):1598–606. doi: 10.1016/j.jhep.2022.08.021
Keywords: radiomics, hepatocellular carcinoma, Ki-67, CK-19, C-index
Citation: Zhou L, Chen Y, Li Y, Wu C, Xue C and Wang X (2024) Diagnostic value of radiomics in predicting Ki-67 and cytokeratin 19 expression in hepatocellular carcinoma: a systematic review and meta-analysis. Front. Oncol. 13:1323534. doi: 10.3389/fonc.2023.1323534
Received: 18 October 2023; Accepted: 11 December 2023;
Published: 03 January 2024.
Edited by:
Changchang Jia, Third Affiliated Hospital of Sun Yat-sen University, ChinaReviewed by:
Hao Chi, The Affiliated Hospital of Southwest Medical University, ChinaChunwang Yuan, Capital Medical University, China
Copyright © 2024 Zhou, Chen, Li, Wu, Xue and Wang. This is an open-access article distributed under the terms of the Creative Commons Attribution License (CC BY). The use, distribution or reproduction in other forums is permitted, provided the original author(s) and the copyright owner(s) are credited and that the original publication in this journal is cited, in accordance with accepted academic practice. No use, distribution or reproduction is permitted which does not comply with these terms.
*Correspondence: Xihong Wang, d2FuZ3hpaG9uZ0BoYWN0Y20uZWR1LmNu
†These authors have contributed equally to this work