 Guangchun Liu
 Shenglin Zhang1
 Xudong Cao
 Lihong Yuan
95% of researchers rate our articles as excellent or good
Learn more about the work of our research integrity team to safeguard the quality of each article we publish.
Find out more
ORIGINAL RESEARCH article
Front. Oncol. , 08 December 2023
Sec. Molecular and Cellular Oncology
Volume 13 - 2023 | https://doi.org/10.3389/fonc.2023.1307838
Cancer remains the leading cause of death worldwide. In spite of significant advances in targeted and immunotherapeutic approaches, clinical outcomes for cancer remain poor. The aim of the present study was to investigate the potential mechanisms and therapeutic targets of Frondoside A for the treatment of liver, pancreatic, and bladder cancers. The data presented in our study demonstrated that Frondoside A reduced the viability and migration of HepG2, Panc02, and UM-UC-3 cancer cell in vitro. Moreover, we utilized the GEO database to screen and identify for differentially expressed genes (DEGs) in liver, pancreatic, and bladder cancers, which resulted in the identification of 714, 357, and 101 DEGs, respectively. Gene Ontology (GO) analysis and Kyoto Encyclopedia of Genes and Genomes (KEGG) pathway annotation were performed using the Metascape database for DEGs that were significantly associated with cancer development. The protein-protein interaction (PPI) networks of the identified DEGs in liver, pancreatic, and bladder cancers were analyzed using Cytoscape 3.9.0 software, and subsequently identified potential key genes that were associated with these networks. Subsequently, their prognostic values were assessed by gene expression level analysis and Kaplan-Meier survival analysis (GEPIA). Furthermore, we utilized TIMER 2.0 to investigate the correlation between the expression of the identified key gene and cancer immune infiltration. Finally, molecular docking simulations were performed to assess the affinity of Frondoside A and key genes. Our results showed a significant correlation between these DEGs and cancer progression. Combined, these analyses revealed that Frondoside A involves in the regulation of multiple pathways, such as drug metabolism, cell cycle in liver cancer by inhibiting the expression of CDK1, TOP2A, CDC20, and KIF20A, and regulates protein digestion and absorption, receptor interaction in pancreatic cancer by down-regulation of ASPM, TOP2A, DLGAP5, TPX2, KIF23, MELK, LAMA3, and ANLN. While in bladder cancer, Frondoside A regulates muscle contraction, complement and coagulation cascade by increase FLNC expression. In conclusion, the present study offers valuable insights into the molecular mechanism underlying the anticancer effects of Frondoside A, and suggests that Frondoside A can be used as a functional food supplement or further developed as a natural anti-cancer drug.
Cancer remains the predominant cause of mortality globally. In 2020, according to the GLOBOCAN report, the annual incidence of new cancer cases is estimated to be 19.3 million, with nearly 10.0 million cancer-related deaths (1). The projected incidence of new cancer cases in China and the USA for the year 2022 is around 4,820,000 and 2,370,000, respectively, with estimated cancer-related deaths of approximately 3,210,000 and 640,000 in these two countries (2). In the past decades, many basic and clinical studies have investigated underlying mechanisms of cancer formation and progression leading to advances in the molecular biology and diagnosis of cancers. However, despite these advancements, the incidence and mortality rates of cancer continue to exhibit high levels, and the available treatment options remain limited in their efficacy and scope (3). While there are many treatment options currently available for cancer patients – and many are clinically effective – these treatment options are known to have significant side effects (4, 5). Consequently, the development of novel and efficacious therapeutic agents for the treatment of cancer constitutes an urgent requirement. In general, natural products have served as a principal reservoir of compounds for the management of a diverse spectrum of cancers, presenting encouraging prospects for examining not only novel anticancer agents but also unexplored and potentially significant mechanisms of action (6). Marine organisms have emerged as a recent research focus for the identification of novel compounds that hold potential in the prevention and treatment of cancer (7), and there is growing interest in exploiting the diverse and complex marine organisms for rational drug discovery (8). The advancement of technology and extensive research on marine natural products have culminated in the identification of a novel cohort of anti-cancer drugs, and a number of marine biological extracts are currently being studied in clinical trials after showing anti-cancer activity in various preclinical studies (7, 9, 10). So far, 20 drugs from marine sources are already in clinical use (10).
To date, the exploration for anticancer agents in diverse marine phyla has unveiled numerous active compounds (11). The echinoderms, which exclusively inhabit the marine milieu and encompass sea stars, sea urchins, sand dollars, sea cucumbers, and sea lilies, have garnered significant attention as a subject of interest, amongst which sea cucumbers are of particularly interesting as they have been used as dietary remedies for cancer, inflammation, and other diseases for centuries (12). For example, triterpenoid glycosides from diverse species of sea cucumbers have been recognized for their potential anti-cancer properties (13). Frondoside A, a specific triterpenoid saponin, has recently gained significant attention due to its demonstrated potent anti-cancer effects against various types of solid malignancies and leukemias (14). However, few studies have attempted either Frondoside A as a potential treatment option for liver, pancreatic, and bladder cancers or investigated their mechanisms of action. In this study, we analyzed the in vitro antitumor activity of Frondoside A and its potential targets, and mechanisms of action related to the treatment of liver, pancreatic and bladder cancers using in vitro cellular assays, bioinformatics and molecular docking techniques. The full analytical work flow of this study is shown in Figure 1.
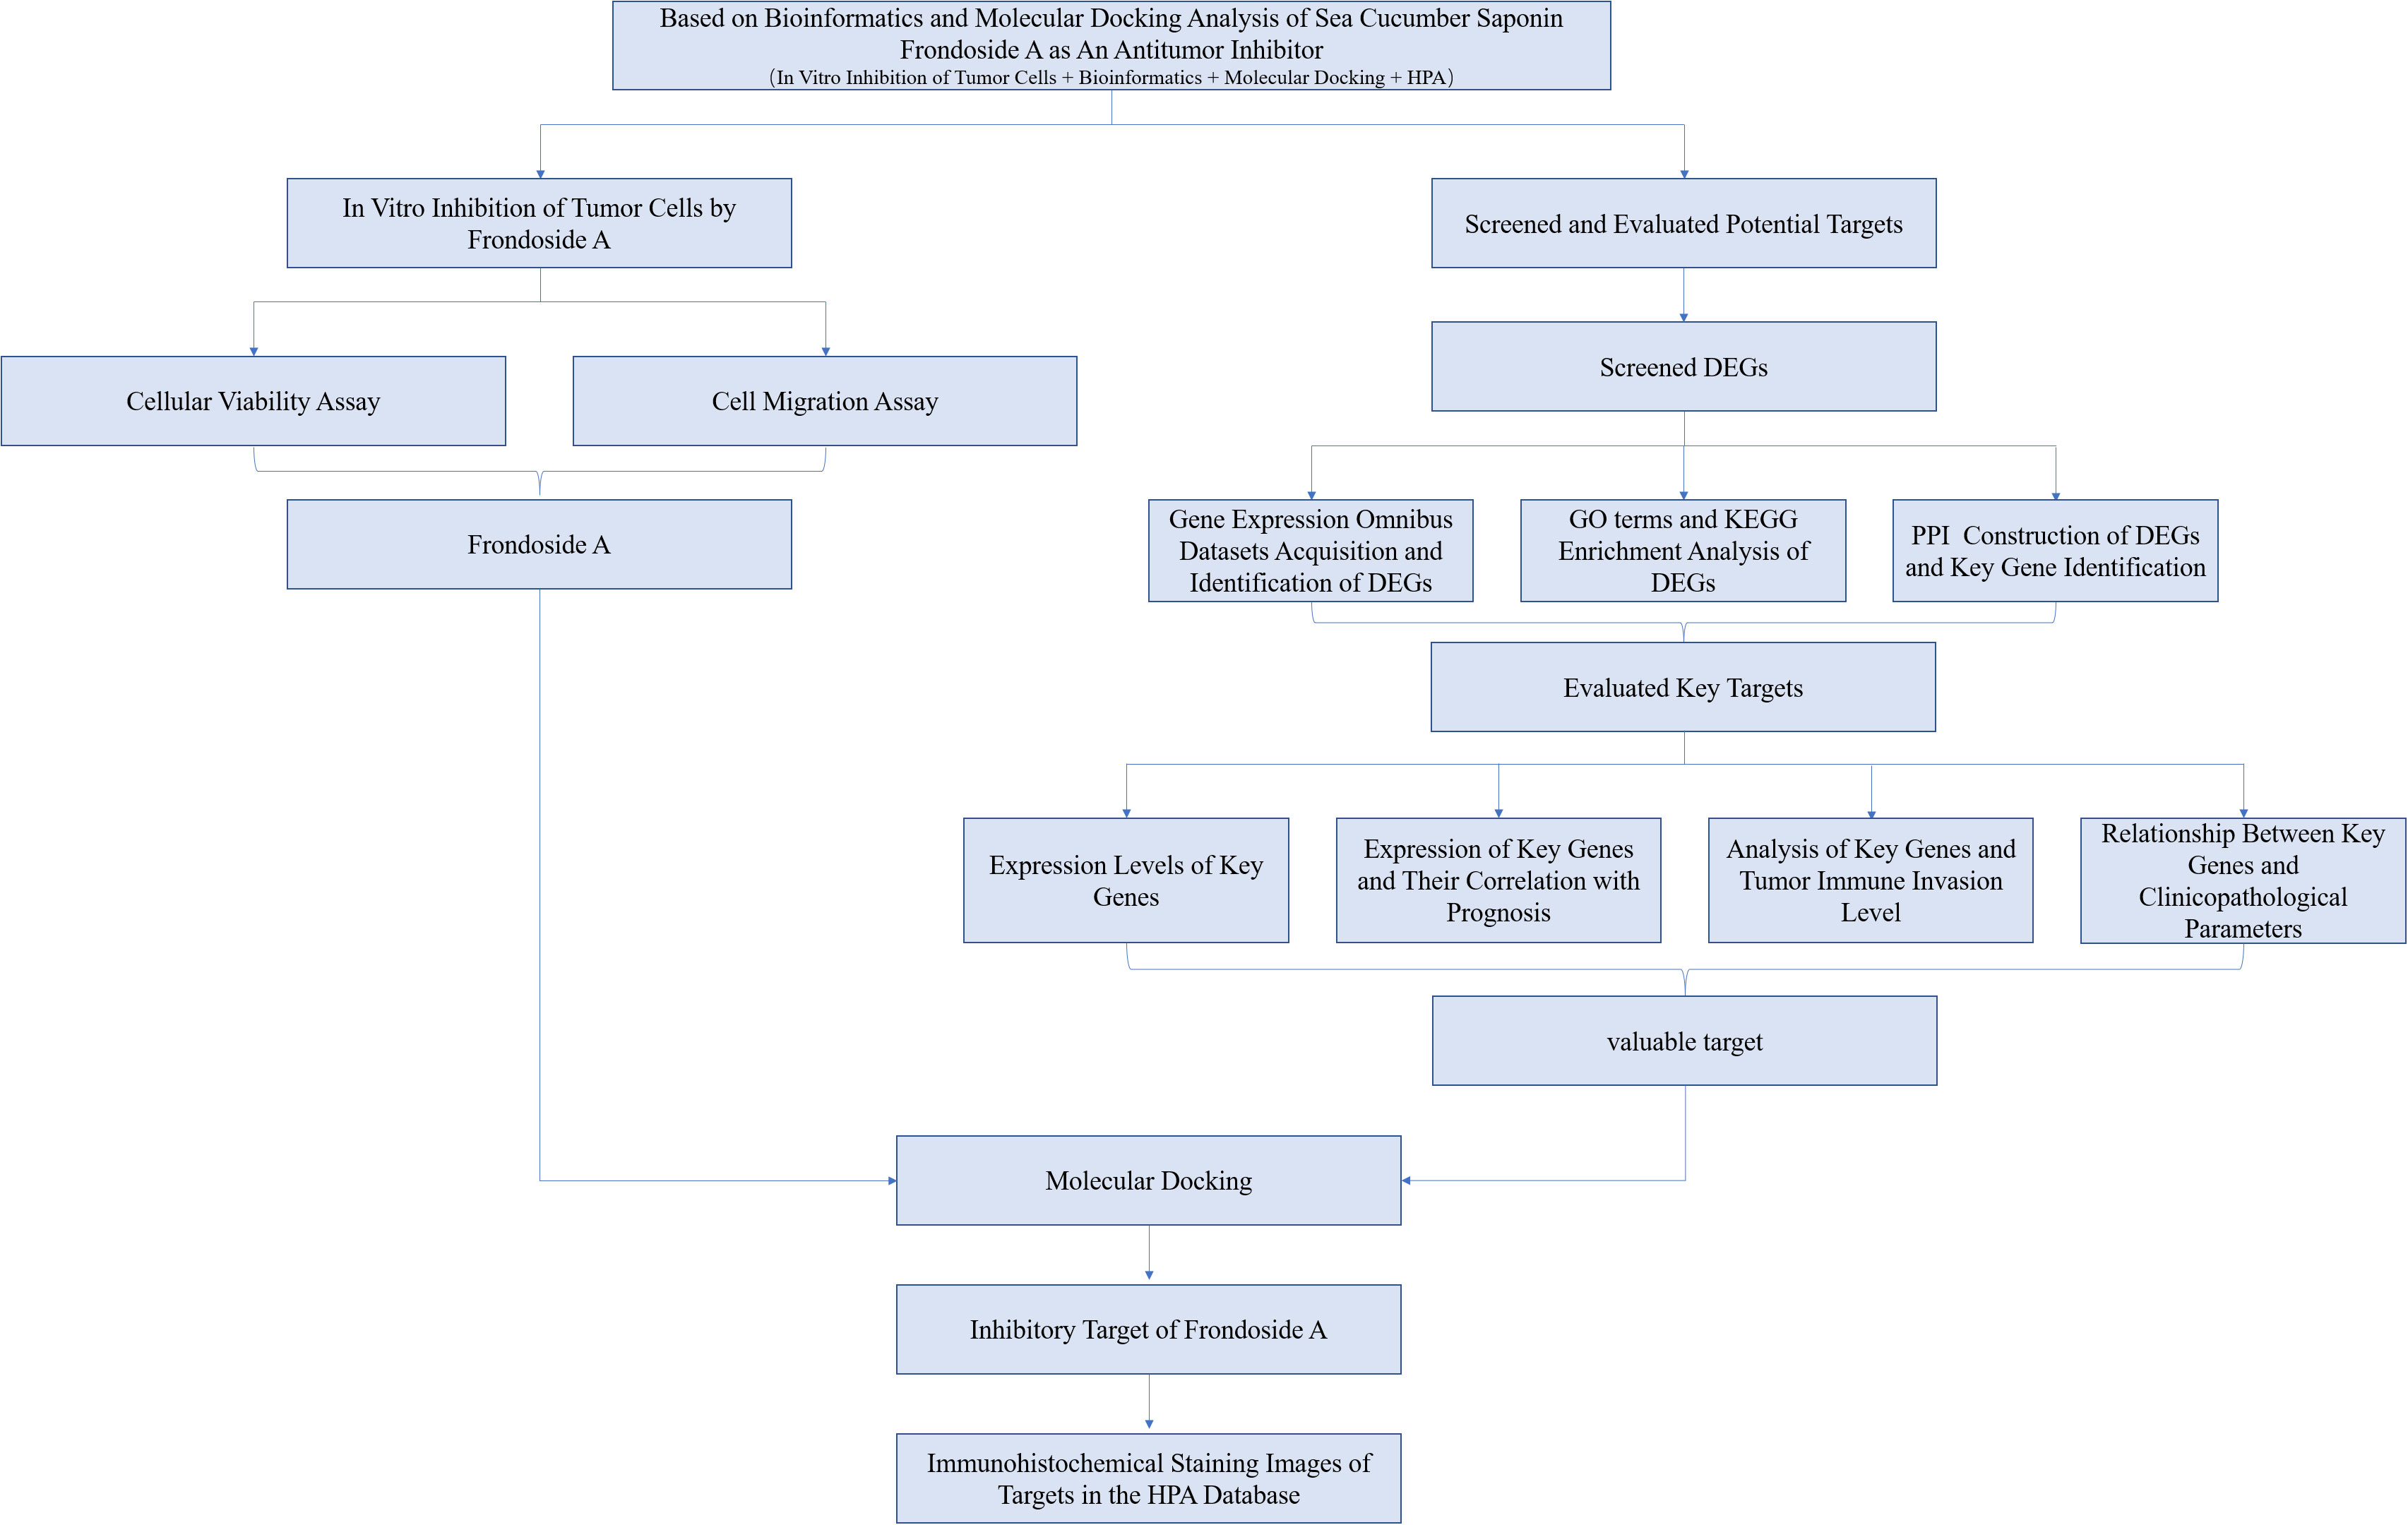
Figure 1 The flow chart for whole process analysis of articles. Preliminary analysis of the anticancer activity of Frondoside A by in vitro cell activity assay and screening of potential anticancer targets by combining bioinformatics and molecular docking methods.
Triterpene glycoside Frondosid A (extracted from Cucumaria frondosa, purity > 98% determined by HPLC) was purchased from Kerafast (Boston, MA). Cell Counting Kit-8 (CCK-8) was obtained from US EVERBRIGHT®INC., Suzhou, Jiangsu, China. DMEM medium, MEM medium, fetal bovine serum (FBS), and phosphate buffer solution (PBS, pH 7.4) were purchased from Thermo Fisher Scientific (Waltham, MA. Finally, penicillin (100 Units/mL), streptomycin (100 µg/mL), 0.25% Trypsin (×1), and Nonessential Amino Acid Solution (NAAS, 100X) were obtained fromGibco (Grand Island, NY) were used in the study Chemotherapeutic agent Epirubicin hydrochloride (EPI), a commonly used anti-tumor drug to treat solid tumors, for instance liver cancer, breast cancer, and bladder cancer, was purchased from Aladdin.
Three cancer cell lines were used in this study, including Human liver cancer cell HepG2 (ATCC® No. HB-8065), Human pancreatic cancer cell Panc02 (ATCC® No. CRL-2553) and Human bladder cancer cell UM-UC-3 (ATCC® No. CRL-1749). Both HepG2 and Panc02 cells were incubated with DMEM medium supplemented with 10% FBS, and UM-UC-3 cells were cultured in MEM medium supplemented 1% NAAS. Moreover, three cell lines were supplemented with 10% FBS, 100 Units/mL of penicillin, and 100 μg/mL, and incubated at 37°C with 5% CO2 atmosphere and 100% humidity.
To evaluate the cytotoxicity of drugs of interest, HepG2, Panc02, and UM-UC-3 cells were seeded in 96-well plates at a density of 5000 cells per well and incubated overnight. Triplicate treatments with increasing concentrations of Frondoside A were administered to the cells for 48 hours, while EPI (10 μM) and PBS (pH 7.4) were used as positive and blank controls, respectively. Subsequently, PBS (pH 7.4) was used to carefully wash the cells, after which 10% CCK-8 reagent was added, and the cultures were incubated for 3 hours. The plates were analyzed at 450 nm utilizing a microplate reader (Bio-Rad, Hercules, CA). Cell viabilities were expressed as proportional viabilities (%) normalized against the blank control and assumed 100% survival. The half maximal inhibitory concentration (IC50) values of Frondoside A for HepG2, Panc02, and UM-UC-3 cell lines were also determined.
Confluent cell monolayers of HepG2, Panc02, and UM-UC-3 cells were cultivated in 6-well tissue culture plates. A plastic micropipette tip was used to carefully scratch the confluent cell monolayers, and the cell cultures were subsequently washed twice with PBS (pH 7.4). The cells were cultured in their respective cell culture media that contained 1% FBS and supplemented with Frondoside A at their respective IC50 concentrations for 24 h. The widths of the wound in the cultures were documented using an Olympus inverted microscope at 0, 12, and 24 h after the wound. Finally, the scratched area was measured using a NIH Image J (Bethesda, MD), and the degree of wound closure was calculated.
The Gene Expression Omnibus (GEO) database (https://www.ncbi.nlm.nih.gov/geo/) is a publicly available functional genomics resource that provides high-throughput gene expression data, chips, and microarrays (15). For the relevant tumors, gene expression profile data was acquired from the GEO database. The inclusion criteria were: (1) The specimens were obtained from patients with human liver cancer, pancreatic cancer, and bladder cancer; (2) The study population was comprised of both tumor patients and normal controls; (3) The study design was “expression profiling by array”. Finally, we downloaded liver cancer-related datasets (GSE14520 and GSE60502), pancreatic cancer datasets (GSE16515 and GSE28735), and bladder cancer datasets (GSE13507, GSE23732, and GSE37815) from the GEO database.
The GEO2R (https://www.ncbi.nlm.nih.gov/geo/geo2r/) is an online analytical tool that is utilized for the identification of differently expressed genes (DEGs) between tumor and healthy controls. The data was categorized into tumor and normal groups and analyzed based on |log2FC| ≥ 1.0 and adj. p value < 0.05, respectively. Following the screening of the DEGs within each dataset, the Venny2.0 online tool (https://bioinfogp.cnb.csic.es/tools/venny/) was employed to identify common targets within the relevant datasets, and the overlapping DEGs were retained for further analysis.
In order to annotate the DEGs identified from the aforementioned comparison groups in a functional manner, GO term annotation and KEGG pathway analysis were conducted with the use of Metascape. Metascape (https://metascape.org/gp/index.html#/main/step1) (16) is a comprehensive analytical website that incorporates functional enrichment, gene annotation, interactome analysis, and membership search, leveraging more than 40 independent knowledge bases. KEGG is a database resource used for elucidating high-level features and effects of biological systems, while GO is a widely used bioinformatics program for high-quality functional gene annotation based on biological processes (BP), molecular functions (MF), and cellular components (CC). Metascape was utilized with a minimum overlap of 3 and a minimum richness of 1.5 as screening criteria to determine the characteristics of DEGs. A significance level of p < 0.01 was considered statistically significant, and GraphPad Prism 9.0 software was used to generate bar graphs to visually represent the obtained results.
The intersection targets that were obtained were subjected to analysis and construction of Protein-Protein Interaction (PPI) networks using the STRING database (https://string-db.org/). The STRING database is one of the most informative databases for studying protein interactions at this stage, which evaluates and integrates information on known and predicted protein interactions to form a comprehensive protein network covering > 1,100 organisms (17). The STRING database utilizes probability calculations of various evidence channels, including the correction of random interaction probability, to construct PPI networks. The resulting composite score is assigned based on the level of confidence, with a score of 0.4 indicating medium confidence, 0.7 indicating high confidence, and 0.9 indicating the highest level of confidence. In this study, a PPI network with a score of 0.9, i.e., the highest confidence network, was used to import potential targets into the STRING database and select “Homo Sapiens” species to obtain target protein interaction relationships.
GEPIA2.0 (http://gepia2.cancer-pku.cn/#index) is a newly developed web server for cancer and normal gene expression analysis and the interactive analysis with rich analysis functions, such as tumor/normal differential expression analysis, survival analysis, gene correlation analysis, and downscaling analysis (18). This study will use the GEPIA2.0 database to analyze the obtained key genes and initially validate their expression differences between tumor and normal tissues.
In this study, GEPIA2.0 was utilized to examine the correlation between the expression of key genes in tumors and overall survival (OS) (18). The statistical analysis was performed by calculating risk ratios (HR) and p values with 95% interval confidence (IC) using a Log-rank test. Finally, genes with insignificant differences were excluded for further analysis to screen for key genes with a significant expression.
The Tumor Immunity Estimation Resource (TIMER) database contains 10,897 samples from The Cancer Genome Atlas (TCGA) for 32 cancer types (19). In this study, the correlation between key genes and the degree of immune cell infiltration, including B cells, CD8+ T cells, CD4+ T cells, neutrophils, macrophages, and dendritic cells, was investigated using the TIMER2 database (http://timer.cistrome.org/). The tumor purity of PCs was adjusted prior to analysis. Key genes were input into the “gene module” to generate scatter plots, which were used to observe the relationship between gene expression and the level of tumor immune invasion.
To confirm the binding of Frondoside A to the predicted key targets, the structural formula of Frondoside A was retrieved and downloaded from the PubChem database (https://www.ncbi.nlm.nih.gov/pccompound) in mol format. The structure was optimized using Chem3D 14.0 software with MM2 force field for energy minimization and saved in pdb format. Three-dimensional structures of CDK1 (PDB ID: 4YC6) (20), ASPM (PDB ID: 3QBT) (21), BUB1 (PDB ID: 4QPM) (22), KIF20A (PDB ID: 5LEF) (23), TOP2A (PDB ID:5NNE) (24), TPX2 (PDB ID:4C3P) (25), KIF23 (PDB ID: 3VHX) (26), MELK (PDB ID:5TWL) (27), and FLNC (PDB ID: 7OUU) were obtained from RCSB PDB database (https://www.rcsb.org/) (28). The proteins were preprocessed with PyMOL software for dehydration, hydrogenation, and removal of irrelevant ligands. The Grid Box parameters were set with the receptor as the center, and molecular docking analysis was performed with AutoDock Vina 1.1.2. The conformation with the lowest free energy was selected and visualized with PyMOL (29). A binding free energy of < -5 kcal/mol indicates that the target has some binding activity to the compound (30), and the lower the binding energy, the more stable the receptor-ligand binding (31).
The experiments were conducted in triplicate, and the data were presented as mean ± standard deviation (SD). Statistical analysis was performed using unpaired Student’s t-test and one-way analysis of variance (ANOVA). Results with a p-value of less than 0.05 were considered statistically significant.
As shown in Figures 2A to C, Frondoside A exhibited a dose-dependent reduction in the cell viability in HepG2, Panc02, and UM-UC-3 cell lines. The IC50 values of Frondoside A for HepG2, Panc02, and UM-UC-3 were 1.5 μM, 1.5 μM, and 1 μM, respectively.
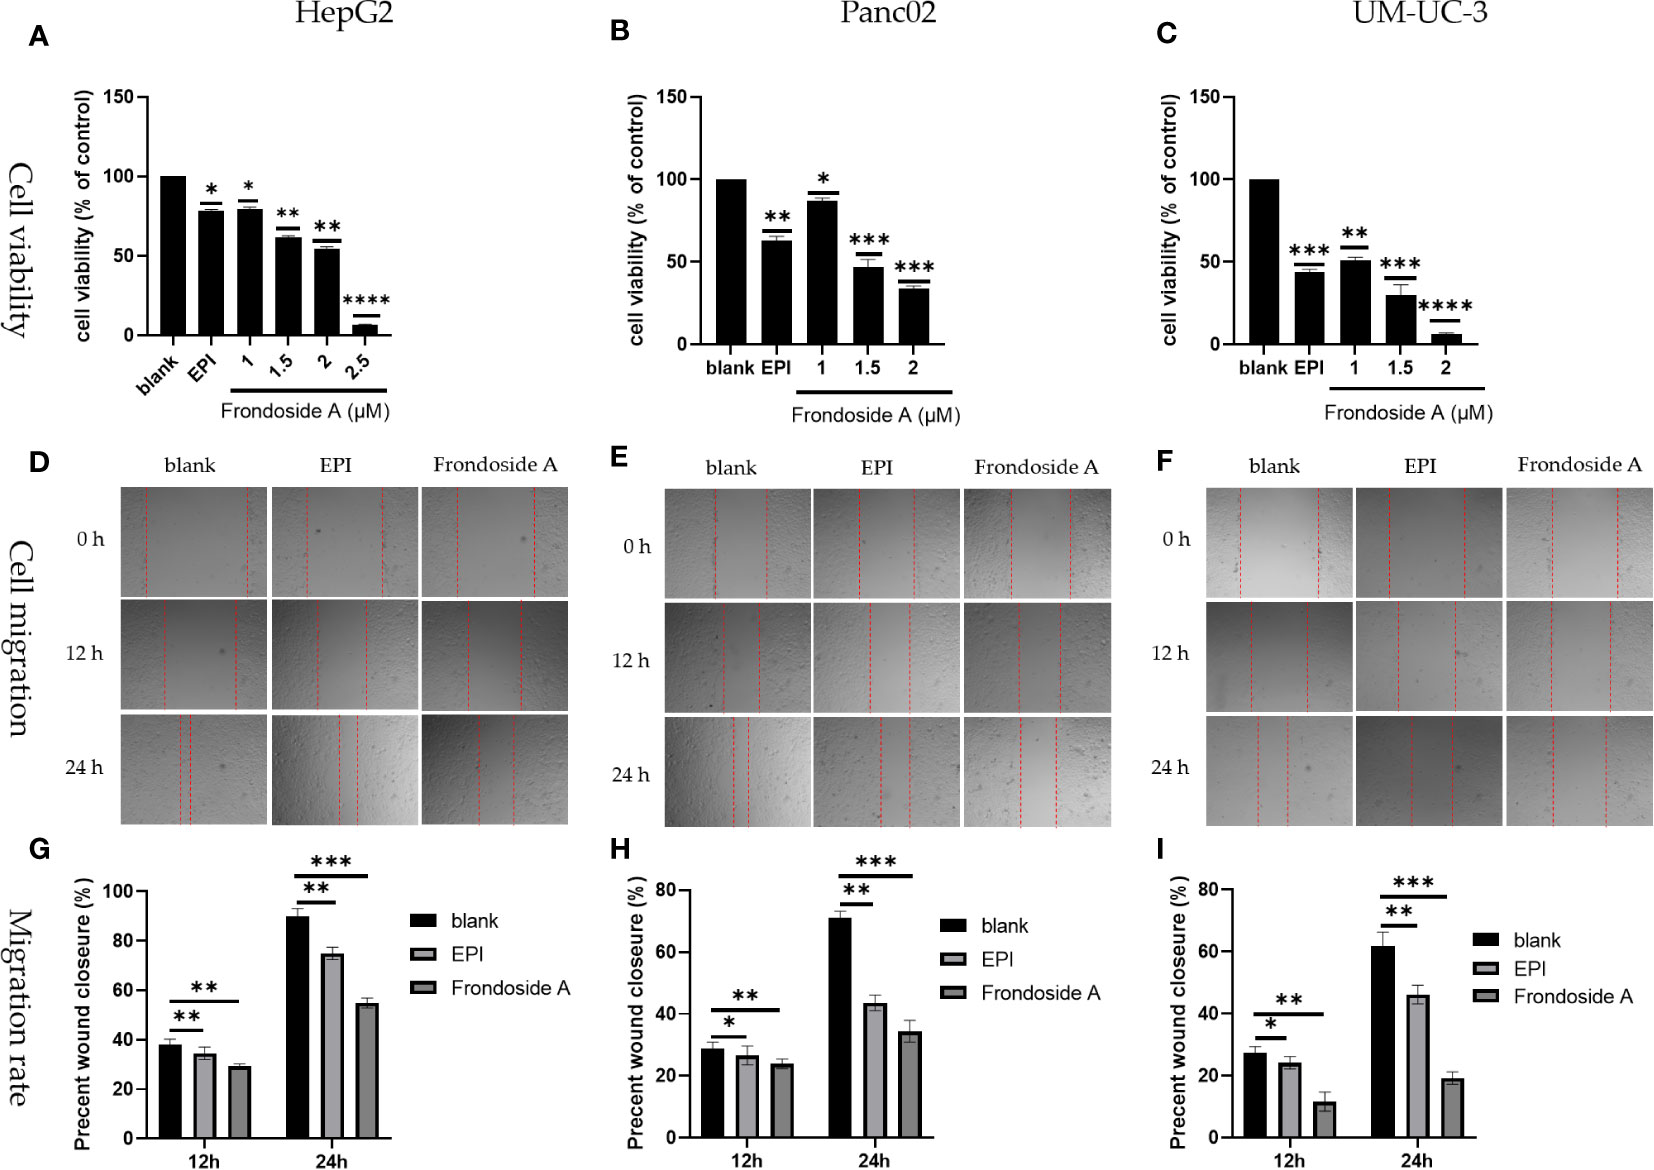
Figure 2 Inhibition of tumor cell proliferation and migration by Frondoside A. (A–C) Logarithmic growth HepG2, Panc02, and UM-UC-3 cells were treated with EPI and Frondoside A for 48 h. (D–F) Figures of cell migration of HepG2, Panc02, and UM-UC-3 respectively were confluent mono-layers cultured in the presence or absence (control) with the IC50 concentrations of Frondoside A for 0, 12, and 24 h, and EPI (10 μM) as a positive group. (G–I) The migration rate of HepG2, Panc02, and UM-UC-3, respectively. Determination of cells as described in Materials and methods. All experiments were repeated at least three times. Data for SD ± means, *p < 0.05, * *p < 0.01, * * * p < 0.001, * * * *p < 0.0001.
As shown in Figures 2D to E, both Frondoside A and EPI treatments significantly inhibited cell migration and reduced the proliferation of HepG2, Panc02, and UM-UC-3. In addition, Frondoside A exhibited a more conspicuous suppression of cell migration than EPI (Figures 2G–I) The migration rate of HepG2, Panc02, and UM-UC-3, respectively.
GEO is a free database of microarray/gene profiles and next-generation sequencing, from which liver cancer and normal or adjacent liver tissue gene expression profiles of GSE14520 and GSE60502 were obtained. Using adj. p < 0.05 and |log2FC|> 1 as cut-off criteria, from the microarray data of GSE14520 and GSE60502, 1238 (573 up-regulated and 665 down-regulated) and 1556 (794 up-regulated and 762 down-regulated) DEGs were extracted, respectively (Figures 3A, B). After integrated bioinformatical analysis, a total of 714 genes were identified from the two profile datasets (Figure 3C).
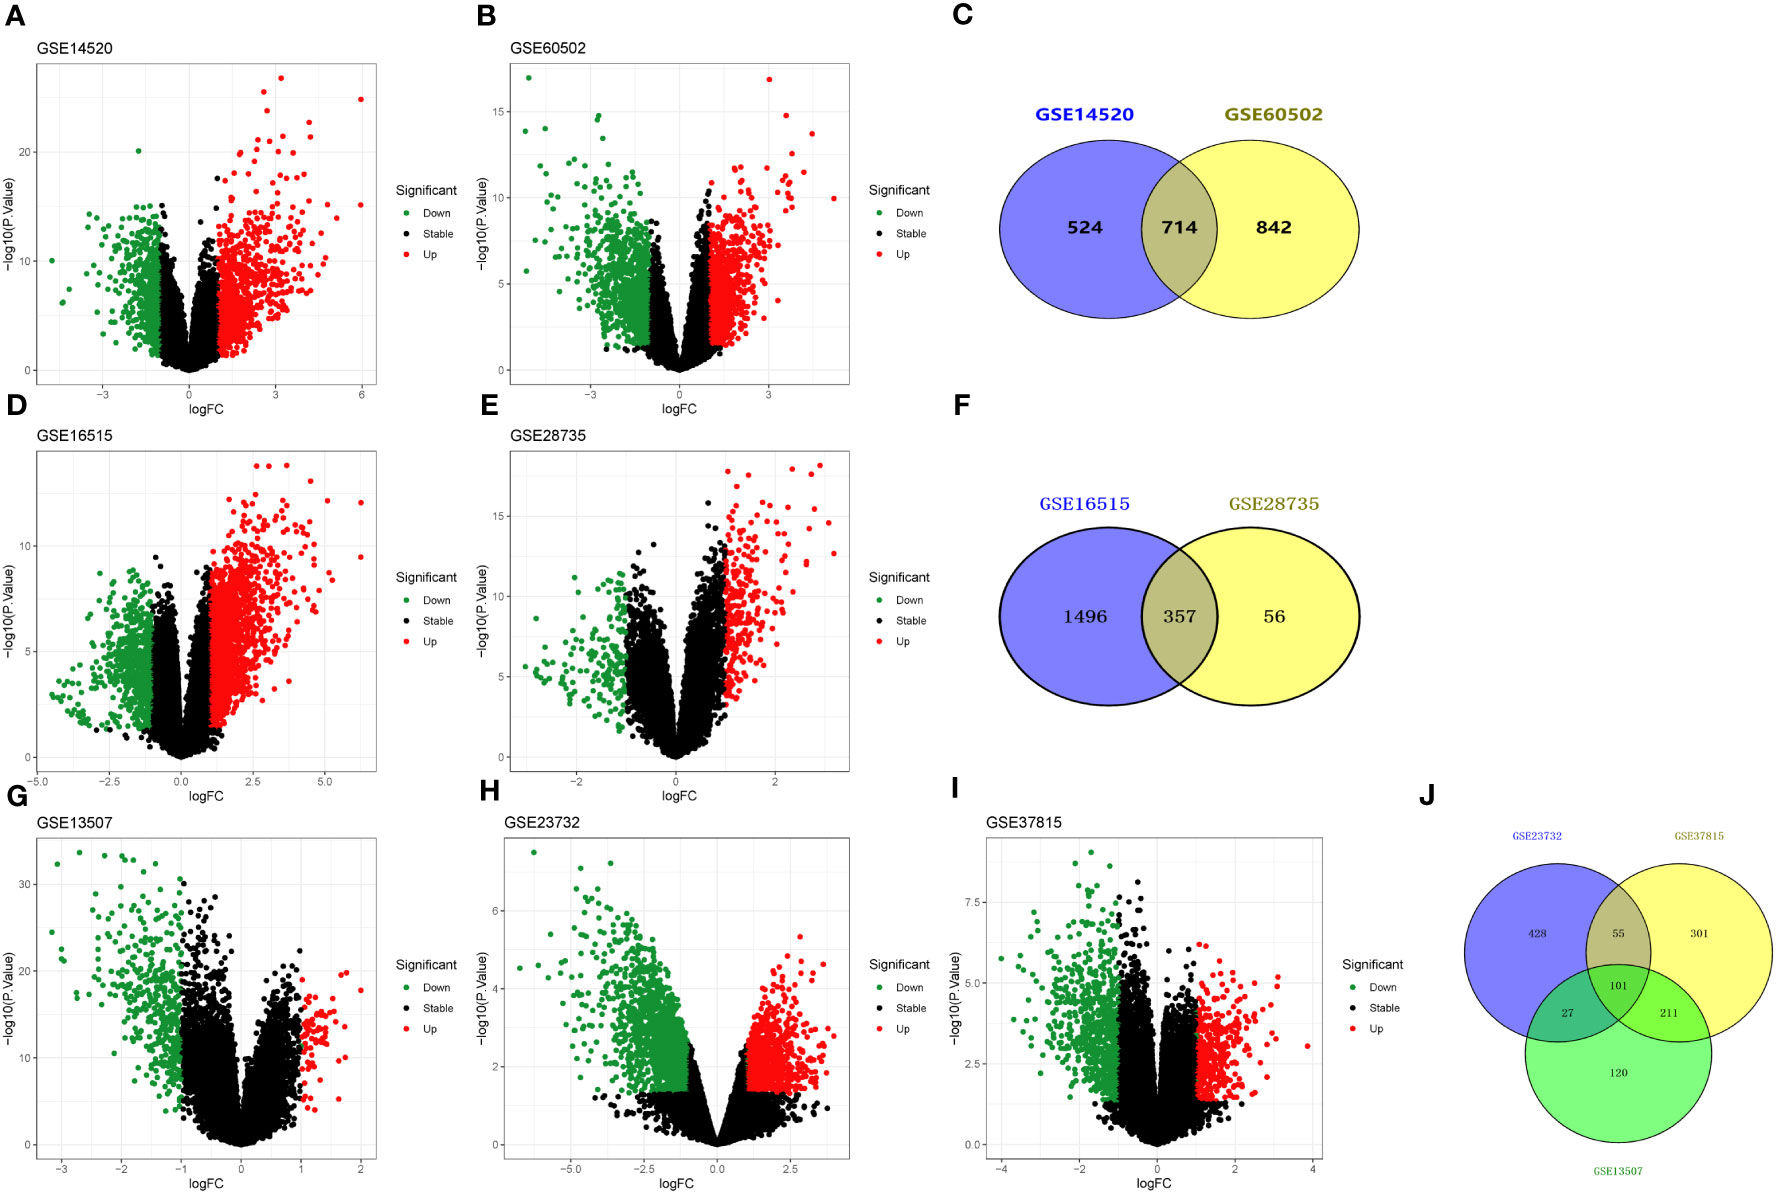
Figure 3 Volcano and Venn diagrams of differentially expressed genes. (A, B) Volcano plot showing DEGs in liver cancer tissues and non-tumor samples in GSE14520 and GSE60502 datasets, respectively. (C) Venn diagram showing the overlapping DEGs from GSE14520 and GSE60502 datasets. (D, E) Volcano plot showing DEGs in pancreatic cancer tissues and non-tumor samples in GSE16515 and GSE28735 datasets, respectively. (F) Venn diagram showing the overlapping DEGs from GSE16515 and GSE28735 datasets. (G–I) Volcano plot showing DEGs in bladder cancer tissues and non-tumor samples in GSE13507, GSE23732, and GSE37815 datasets, respectively. (J) Venn diagram showing the overlapping DEGs from GSE13507, GSE23732, and GSE37815 datasets. Red dots indicate genes highly induced in cancer; green dots indicate genes greatly reduced in cancer; black dots indicate non-DEGs.
Subsequently, mRNA expression profiles in human pancreatic tissues and adjacent non-cancerous tissues were analyzed using the GEO databases (i.e., GSE16515 and GSE28735). In GSE16515, 1853 DEGs (i.e., 1364 up-regulated and 489 down-regulated) had significant changes in pancreatic cancer tissues (Figure 3D). In GSE28735, 413 DEGs (i.e., 256 up-regulated and 157 down-regulated) had significant changes in pancreatic cancer tissues (Figure 3E). Finally, a total of 357 con-DEGs were obtained for further investigation (Figure 3F).
Similarly, mRNA expression profiles in human bladder cancer tissues and adjacent non-cancerous tissues were also analyzed using the GEO databases (GSE13507, GSE23732, and GSE37815). For GSE13507, there were 459 DEGs (i.e., 63 up-regulated and 396 down-regulated) with significant changes in bladder cancer tissues (Figure 3G). For GSE23732, there were 611 DEGs (i.e., 102 up-regulated and 509 down-regulated) significant changes in bladder cancer tissues (Figure 3H). For GSE37815, there were 668 DEGs (i.e., 190 up-regulated and 478 down-regulated) significant changes in bladder urothelial carcinoma tissues (Figure 3I). As a result of the analysis above, a total of 101 genes were used for further investigation (Figure 3J).
To investigate the biological functions of DEGs, functional annotation and pathway enrichment analysis were conducted using the Metascape database. The results were visualized by generating bar graphs with GraphPad Prism 9.0 software. GO (Gene Ontology) analyses are shown in Figures 4A–C, and KEGG analyses are shown in Figures 4D–F. The results of GO analysis of DEG in liver cancer are shown in Figure 4A. The most important biological processes (BPs) of DEGs were “monocarboxylic acid metabolic process”, “response to xenobiotic stimulus”, “small molecule catabolic process”, “response to the hormone”, and “mitotic cell cycle process”. The molecular functions (MFs) are mainly enriched in “oxidoreductase activity”, “protein homodimerization activity”, “kinase binding”, “ATP-dependent activity”, and “amide binding”. The cellular component (CC) analysis revealed that the differentially expressed genes (DEGs) were predominantly associated with cellular components such as “blood microparticle”, “mitochondrial matrix”, “secretory granule lumen”, “spindle”, and “external side of the plasma membrane”. KEGG pathway analysis shows that the DEGs are significantly involved in several key pathways, including the “pathway in cancer”, “drug metabolism-cytochrome P450 pathway”, “complement and coagulation cascades”, “cell cycle”, and “carbon metabolism” (Figure 4D).
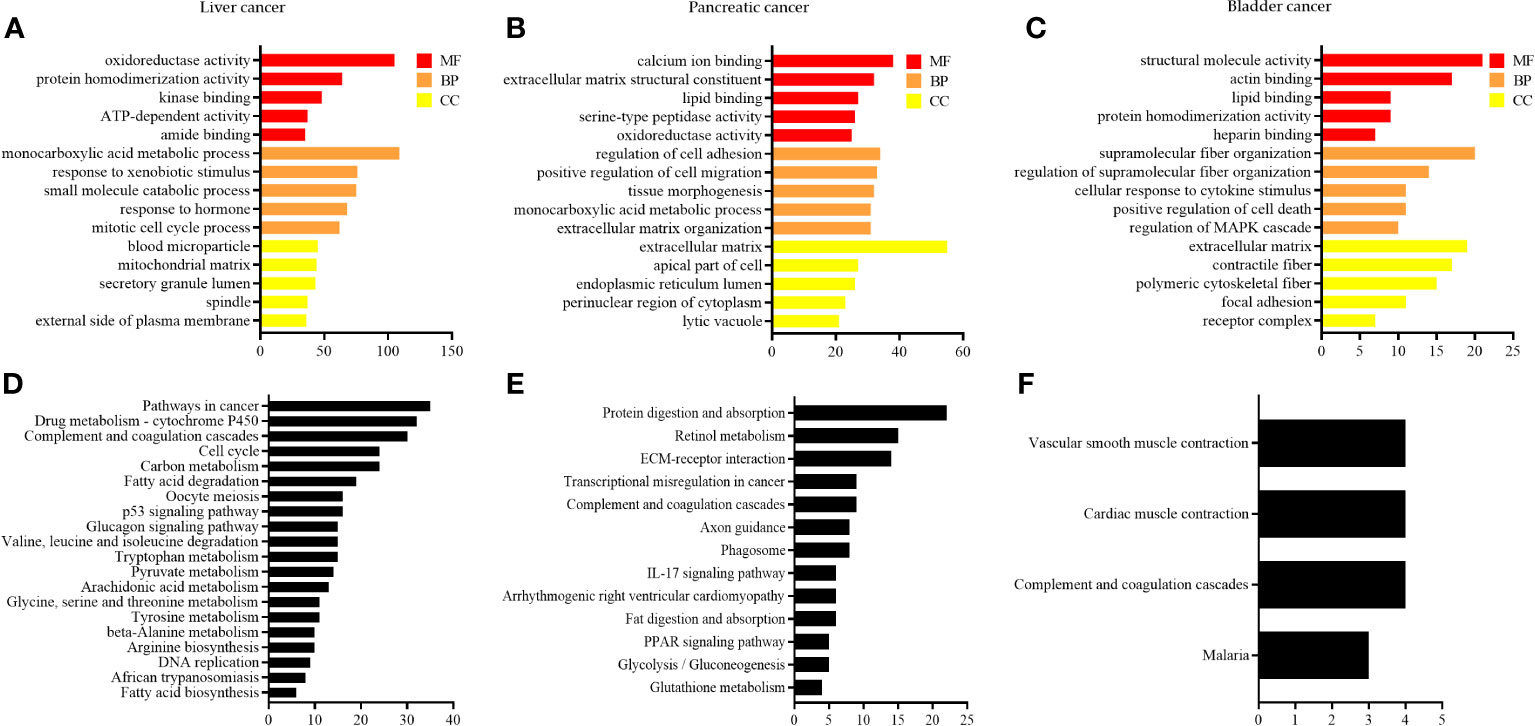
Figure 4 GO and KEGG enrichment analysis of DEGs. (A–C) GO enrichment in liver cancer, pancreatic cancer, and bladder cancer, respectively; and (D–F) KEGG pathway analysis of liver, pancreatic, and bladder cancers, respectively.
The results of GO analysis of DEG in pancreatic cancer are shown in Figure 4B, wherein the most important BPs include “regulation of cell adhesion”, “positive regulation of cell migration”, “tissue morphogenesis”, “monocarboxylic acid metabolic process”, and “extracellular matrix organization”. The main enrichment of MFs is observed in “calcium ion binding”, “extracellular matrix structural constituent”, “lipid binding”, “serine-type peptidase activity”, and “oxidoreductase activity”. The CC consists mainly of the “extracellular matrix”, “apical part of the cell”, “endoplasmic reticulum lumen”, “perinuclear region of cytoplasm”, and “lytic vacuole”. KEGG pathway analysis reveals that the DEGs plays a crucial in the “protein digestion and absorption”, “retinol metabolism”, “ECM-receptor interaction”, “transcriptional mis-regulation in cancer”, and “complement and coagulation cascades” (Figure 4E).
The results of GO analysis of DEG in bladder cancer are shown in Figure 4C, and its most important BPs include “supramolecular fiber organization”, “regulation of supramolecular fiber organization”, “cellular response to cytokine stimulus”, “positive regulation of cell death”, and “regulation of MAPK cascade”. The MFs are mainly enriched in “structural molecule activity”, “actin binding”, “lipid binding”, “protein homodimerization activity”, and “heparin-binding”. The CC consists mainly of the “extracellular matrix”, “contractile fiber”, “polymeric cytoskeletal fiber”, “focal adhesion”, and “receptor complex”. KEGG pathway analysis reveals that the DEGs plays a significant role in the “vascular smooth muscle contraction”, “cardiac muscle contraction”, “complement and coagulation cascades”, and “malaria” (Figure 4F).
using the STRING database, a protein-protein interaction (PPI) network consisting of 714 conserved genes in hepatocellular carcinoma was constructed. The network comprised of 656 nodes and 1461 edges (Figure 5A). By considering the degree of connectivity in the PPI network, CytoNCA identified CDK1, TOP2A, ASPM, BUB1, NUSAP1, CDC20, DLGAP5, BUB1B, KIF20A, and CCNB2 as the top ten genes. These genes were tentatively regarded as potential key genes associated with hepatocellular carcinoma, emphasizing the need for further investigation (Figure 5B).
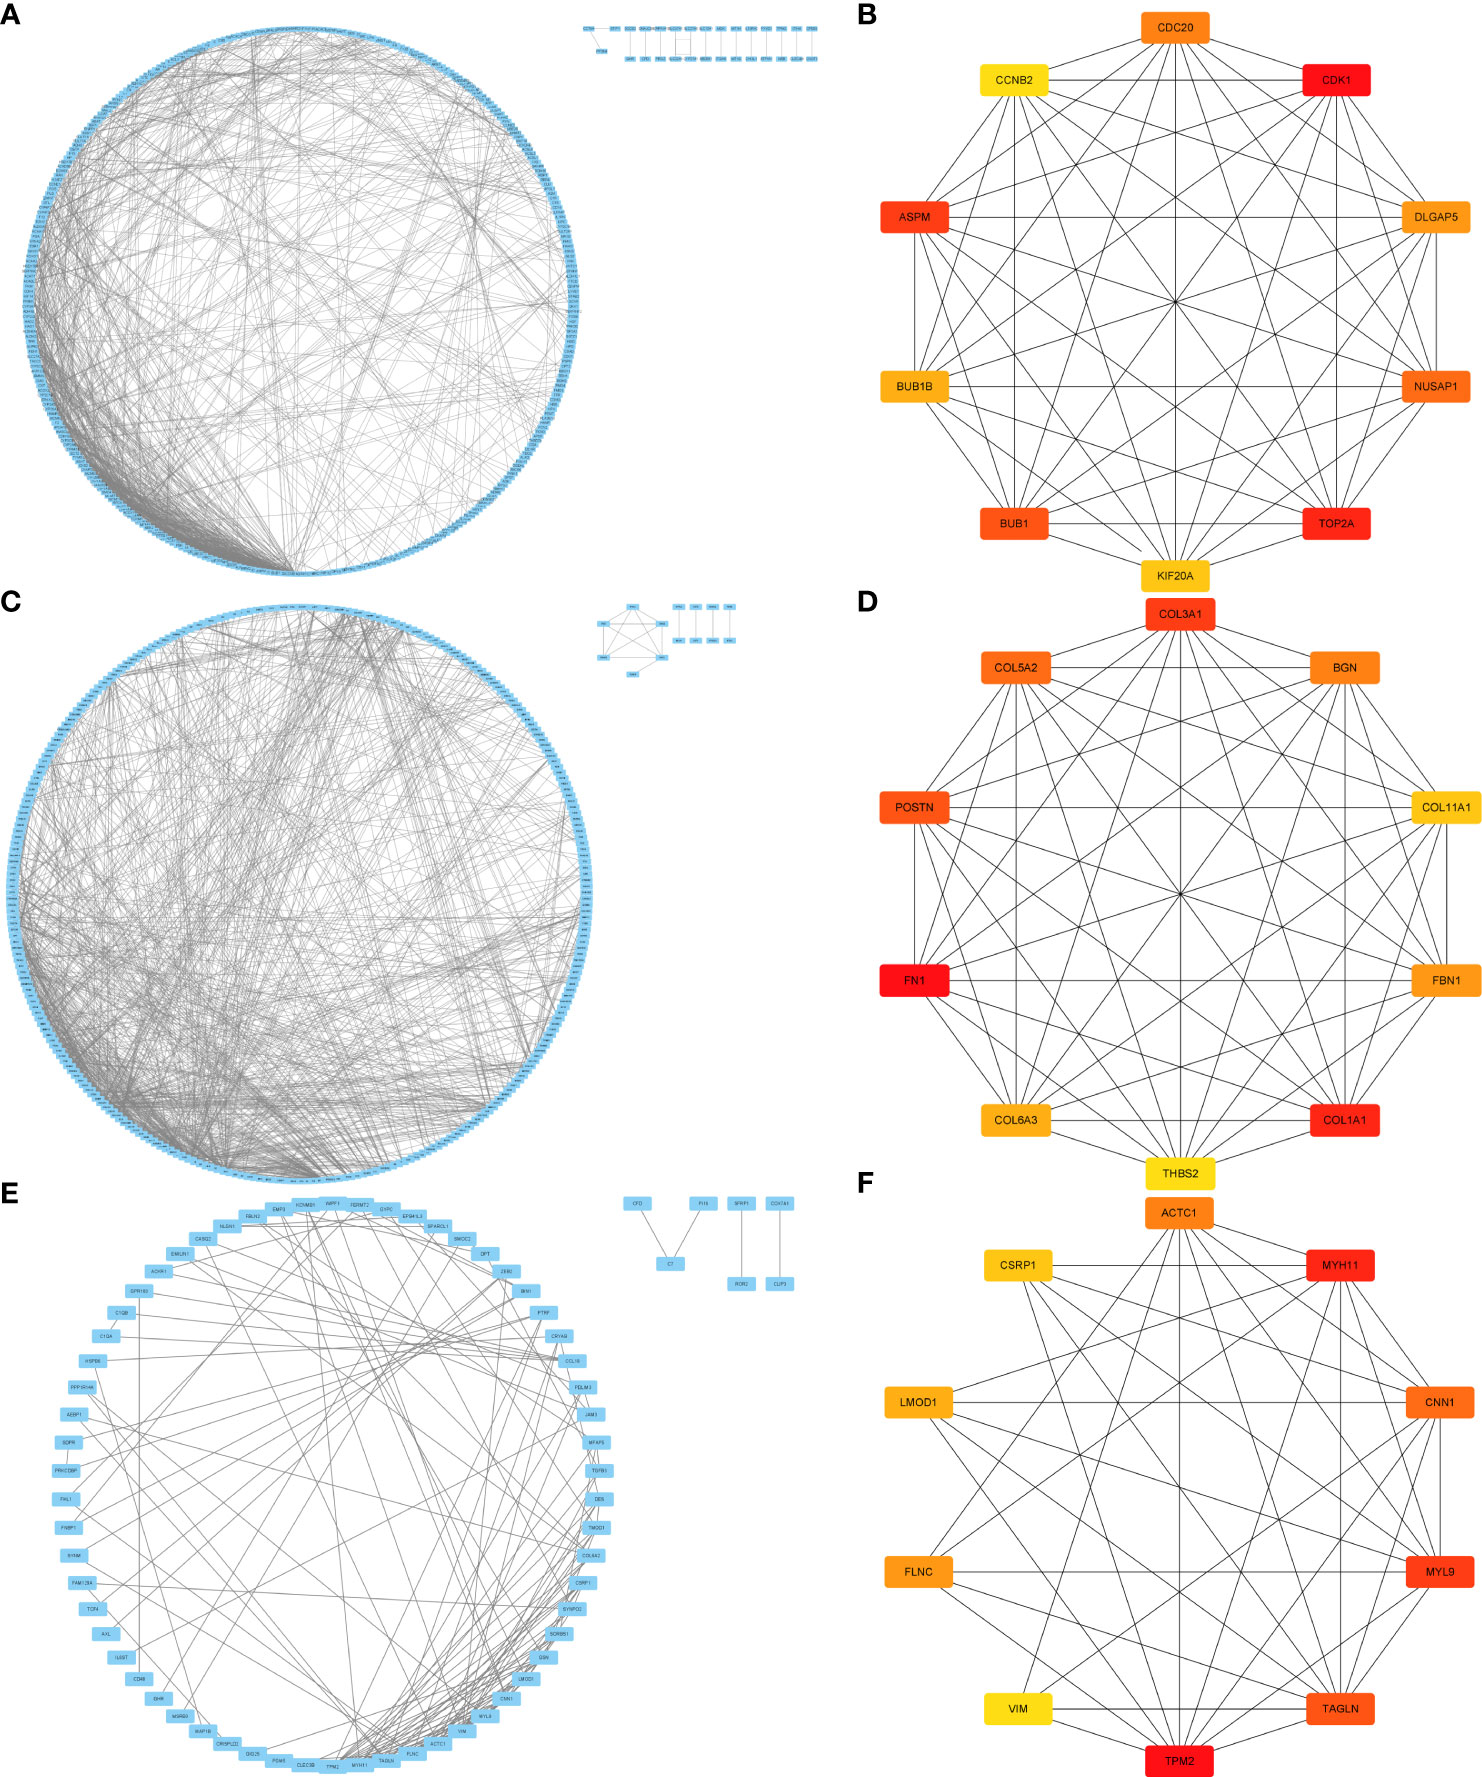
Figure 5 PPI and key target screening of differentially expressed genes. (A, C, E) are the PPI figures for liver cancer, pancreatic cancer, and bladder cancer, respectively; (B, D, F) are the key targets of liver cancer, pancreatic cancer, and bladder cancer.
Similarly, a PPI network was established based on 357 conserved genes in pancreatic cancer, revealing a network with 86 nodes and 1133 edges (Figure 5C). Applying the degree of connectivity analysis, CytoNCA identified ASPM, TOP2A, DLGAP5, TPX2, CENPF, KIF23, MELK, LAMC2, LAMA3, and ANLN as the top ten genes. These genes were provisionally considered as potential key genes associated with pancreatic cancer, warranting further investigation (Figure 5D).
Furthermore, a PPI network was constructed based on 101 conserved genes in bladder cancer, consisting of 101 nodes and 131 edges (Figure 5E). Based on the degree of connectivity, CytoNCA identified TPM2, MYH11, MYL9, TAGLN, CNN1, ACTC1, FLNC, LMOD1, CSRP1, and VIM as the top ten genes. These genes were preliminarily regarded as potential key genes associated with bladder cancer, necessitating further investigation (Figure 5F).
The GEPIA2.0 database was used to verify the mRNA expression levels of key genes in tumor and normal tissues, and the results are shown in Figure 6. The expression levels of relevant potential key genes were markedly elevated in liver cancer and pancreatic cancer tissues compared to normal tissues (Figures 6A, B); conversely, the expression levels of these genes were significantly decreased in bladder cancer tissues compared to normal tissues (Figure 6C).
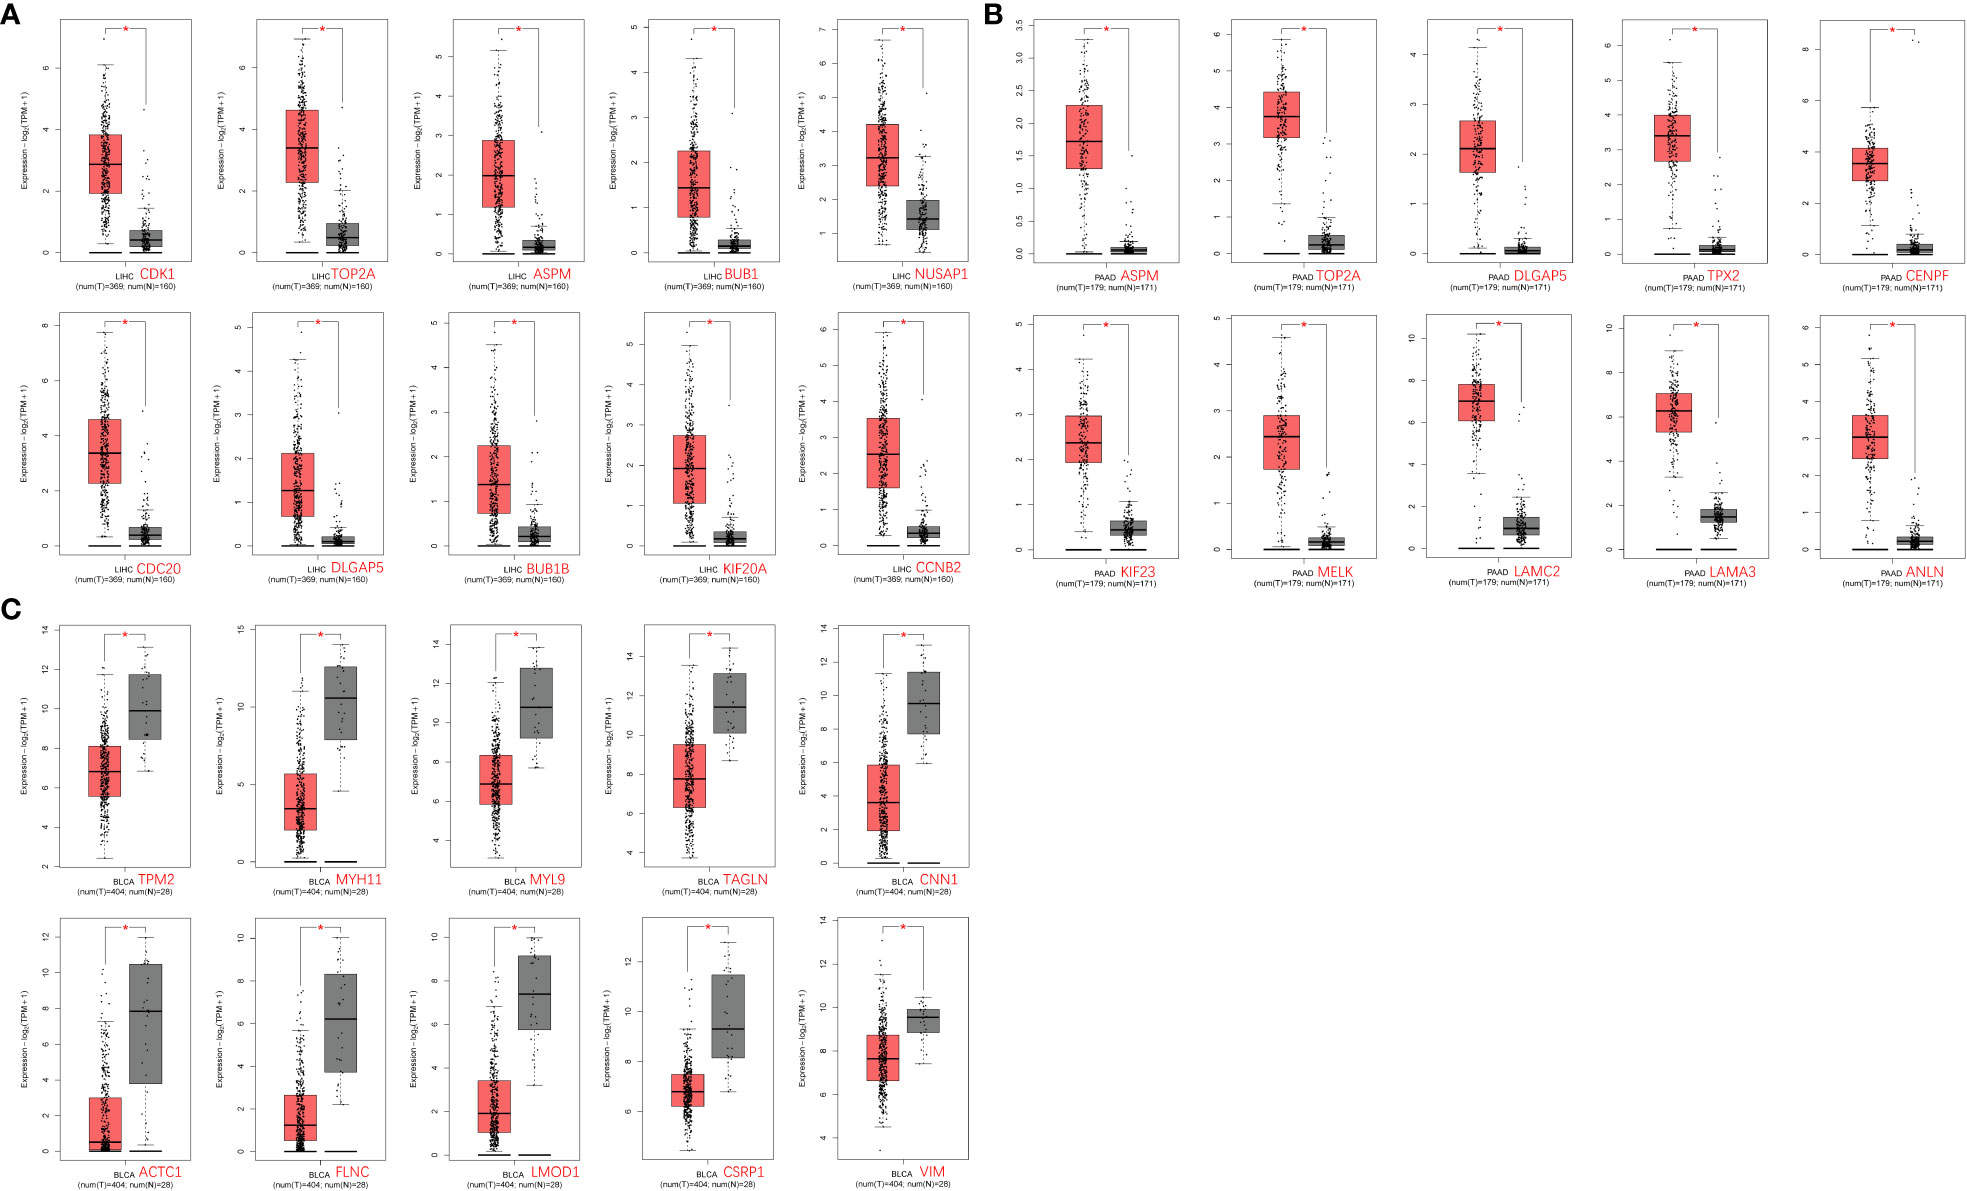
Figure 6 Differential expression analysis of key genes in tumors in the GEPIA2.0 database. (A) Liver cancer tissue; (B) Pancreatic cancer tissue; and (C) Bladder cancer tissue.
To investigate whether the variation in mRNA expression levels of key genes affects the correlation between overall survival (OS) in cancer patients, further analysis was conducted. The GEPIA2.0 online platform was utilized to conduct Kaplan-Meier survival analysis, to explore the potential associations between key genes and overall survival (OS) in tumor patients. The analysis revealed that a majority of the genes exhibited a significant decrease in survival rate (p < 0.05, Figure 7). High levels of expression of CDK1 (p = 0.00022), TOP2A (p = 0.003), ASPM (p= 0.00072), BUB1 (p = 0.0012), NUSAP1 (p = 0.0067), CDC20 (p = 6.8E-06), DLGAP5 (p= 0.00049), BUB1B (p = 0.0031), and KIF20A (p = 0.0037) were found to be significantly associated with the OS in patients with liver cancer (p < 0.05); while CCNB2 (p = 0.053) expression was not relevant to survival, as shown in Figure 7A.
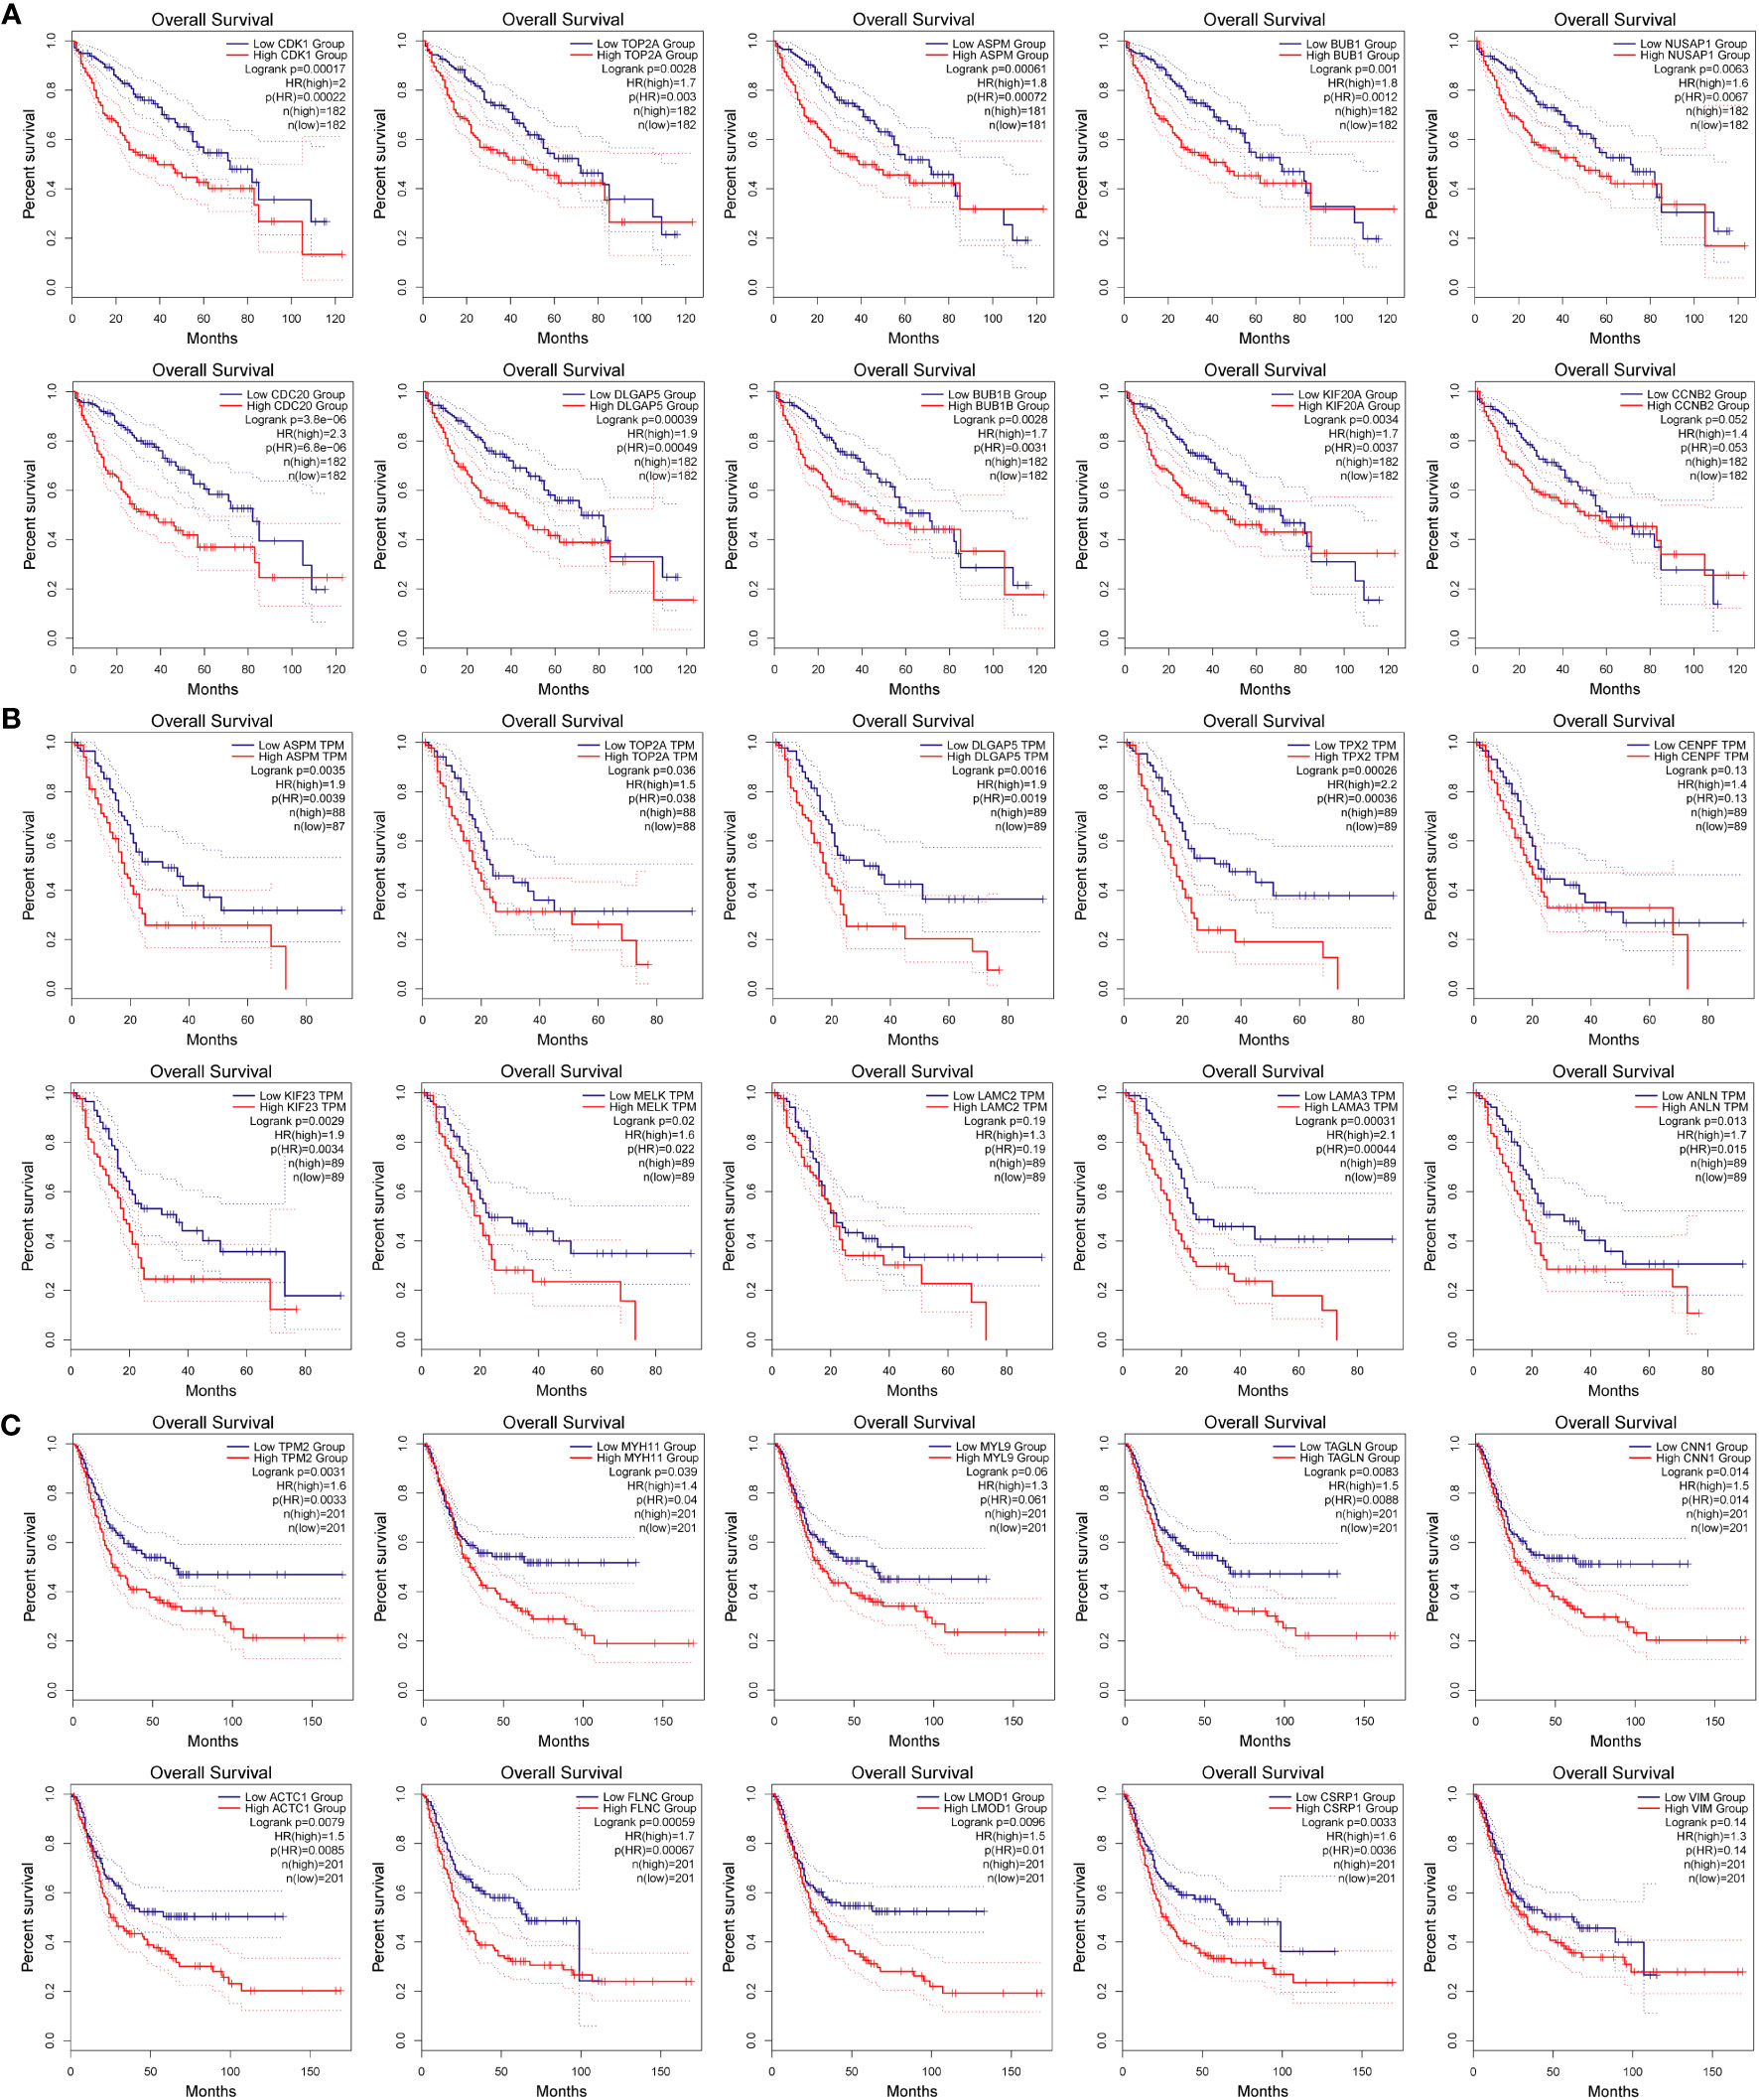
Figure 7 Relationship between target gene expression and survival of tumor patients. (A–C) are the total survival time of hepatocellular carcinoma, pancreatic cancer, and bladder cancer, respectively.
High levels of expression of ASPM (p = 0.0039), TOP2A (p = 0.038), DLGAP5 (p = 0.0019), TPX2 (p = 0.00036), KIF23 (p = 0.0034), MELK (p = 0.022), LAMA3 (p = 0.00044), and ANLN (p = 0.015) were significantly correlated with the OS of patients with pancreatic cancer, while CENPF (p = 0.13) and LAMC2 (p = 0.19) expression were not relevant to survival, as shown in Figure 7B.
High levels of expression of TPM2 (p = 0.0033), MYH11 (p = 0.04), TAGLN (p = 0.0088), CNN1 (p = 0.014), ACTC1 (p = 0.0085), FLNC (p = 0.00067), LMOD1 (p = 0.01), and CSRP1 (p = 0.0036) were found to be significantly associated with OS in patients with bladder cancer, while MYL9 (p = 0.061) and VIM (p = 0.14), as shown in Figure 7C.
The study investigated the association between the expression of key genes and six types of infiltrating immune cells, namely B cells, CD8+ T cells, CD4+ T cells, macrophages, neutrophils, and dendritic cells, in order to determine their potential as independent predictors of cancer treatment and prognosis.
As shown in Table 1 and Figure 8, CDK1, TOP2A, ASPM, BUB1, NUSAP1, CDC20, DLGAP5, BUB1B, and KIF20A expression were positively correlated with infiltration of B cells, CD4+ T cells, macrophages, neutrophils, and dendritic cells. CDK1, TOP2A, ASPM, BUB1, NUSAP1, DLGAP5, and BUB1B expression were positively correlated with infiltration of CD8+ T cells.
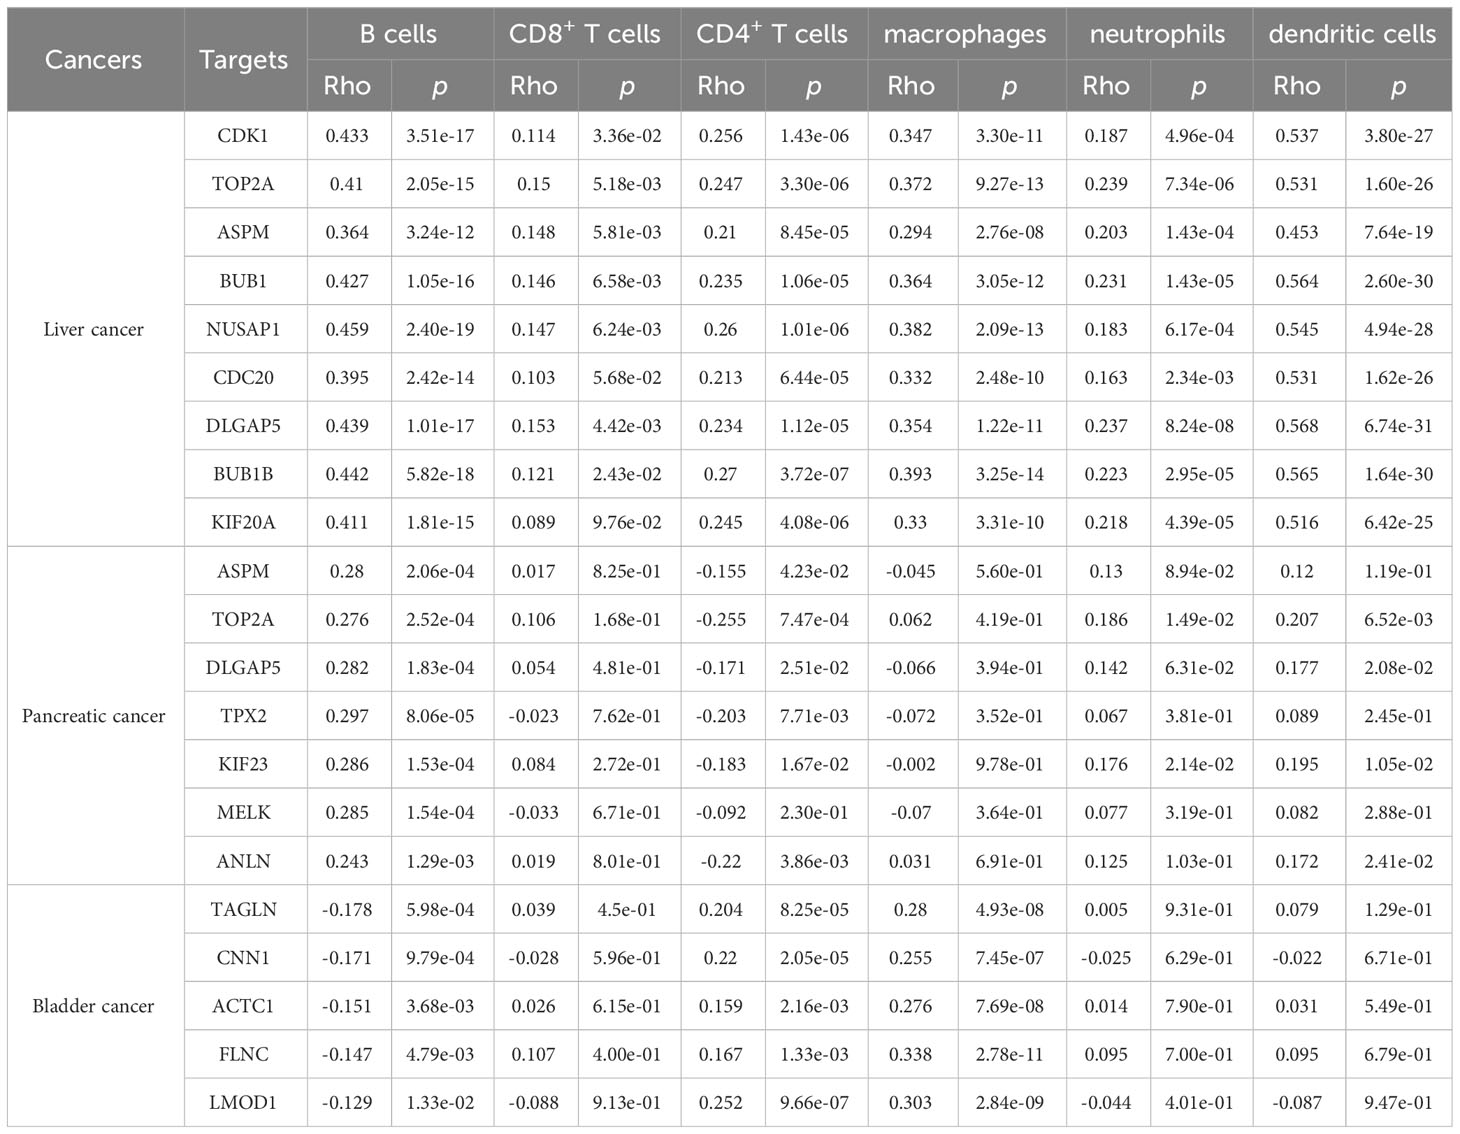
Table 1 Analysis of key gene expression in various immune cells in liver, pancreatic, and bladder cancers.
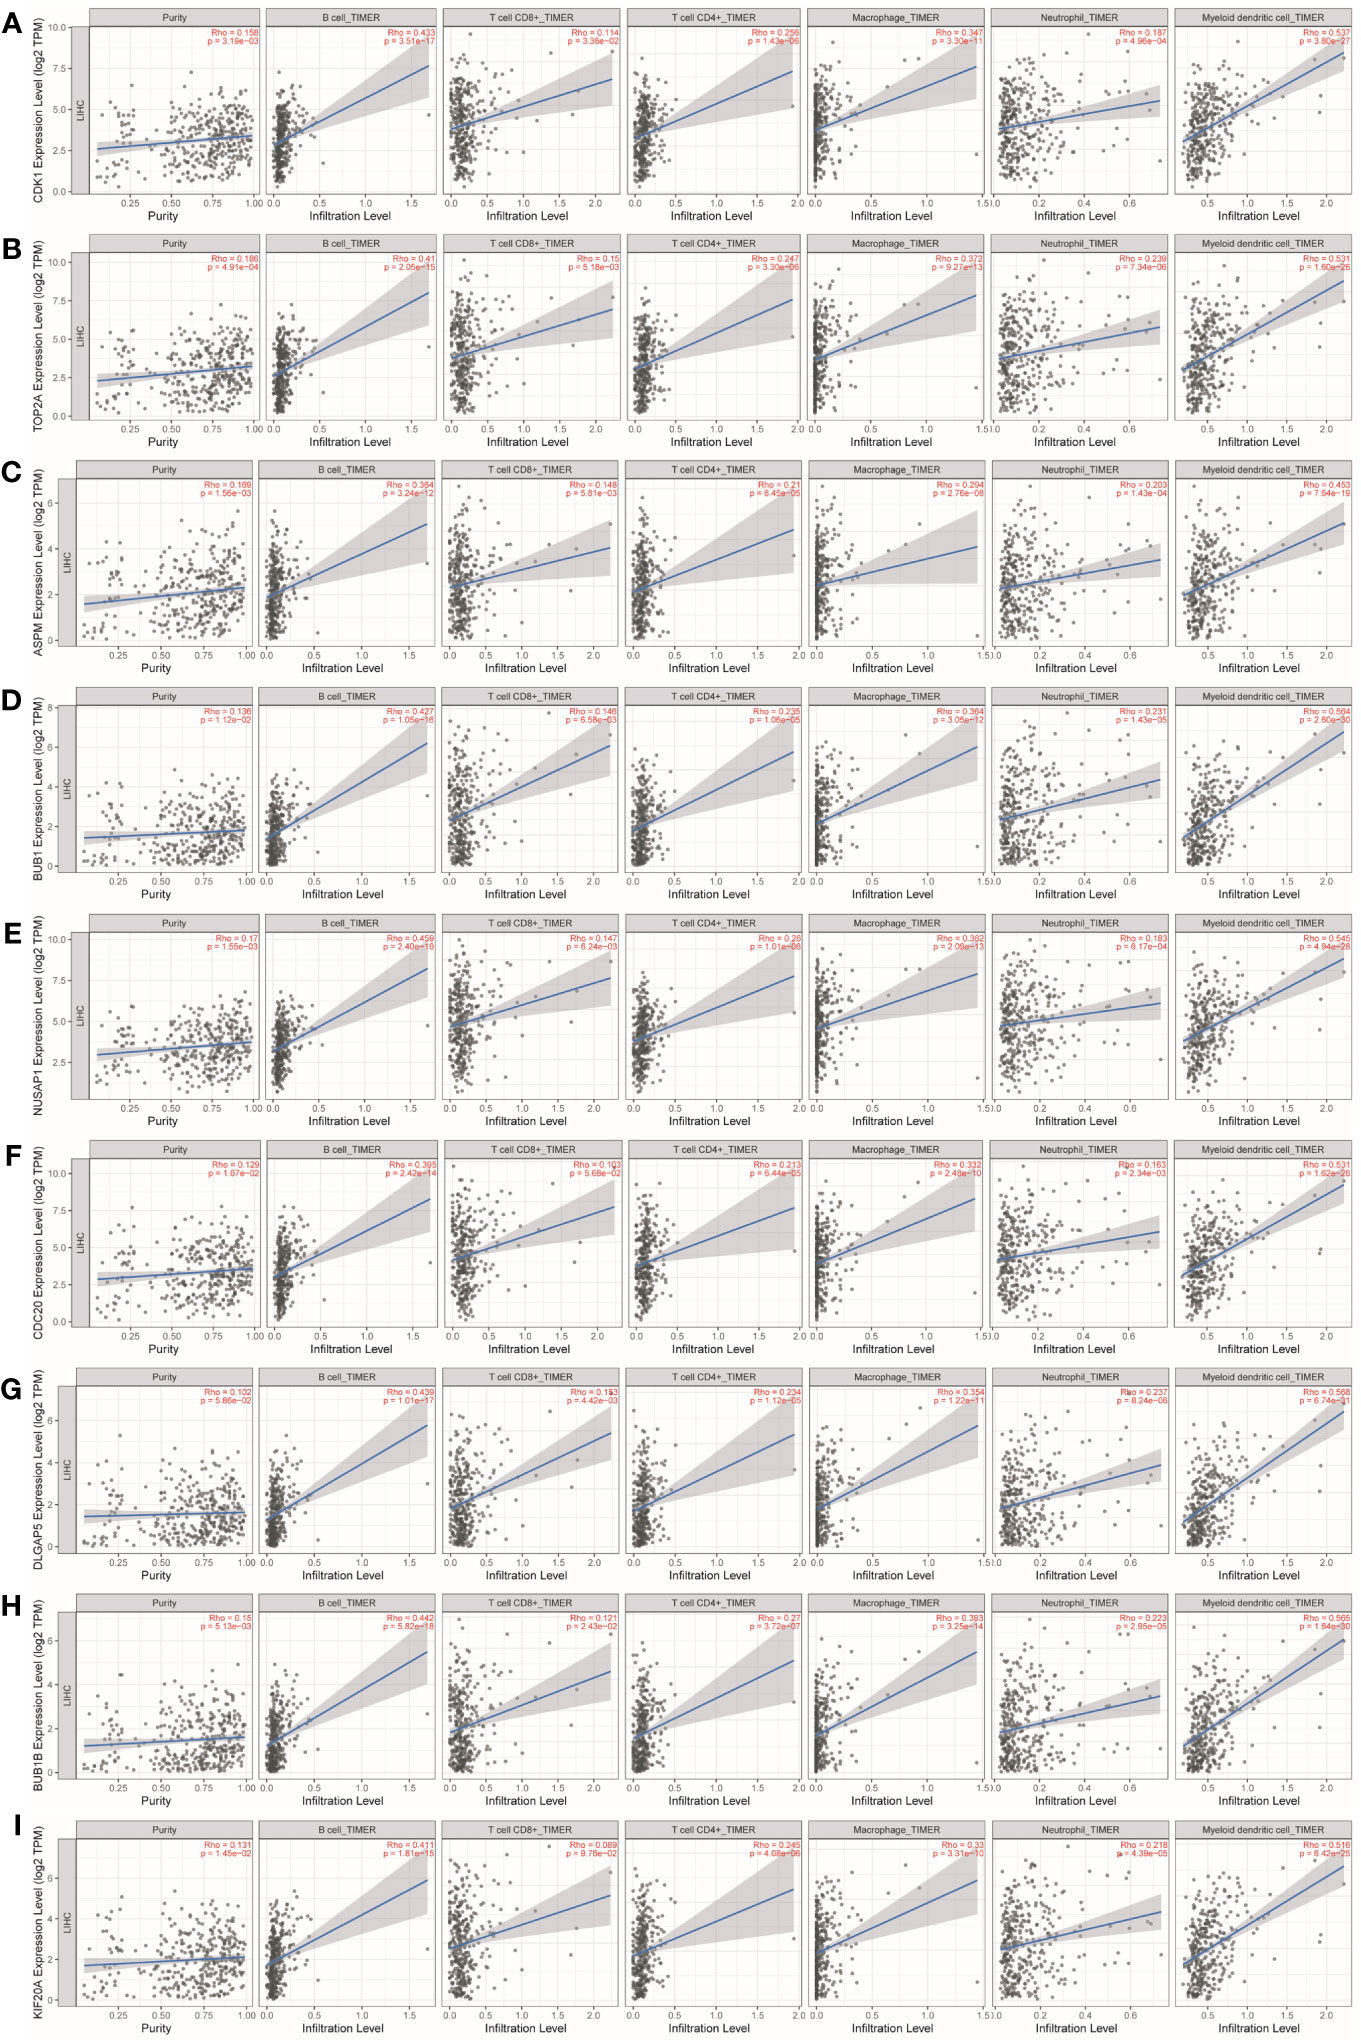
Figure 8 Analysis of key gene expression in various immune cells in liver cancer. The correlation between the expression of (A) CDK1, (B) TOP2A, (C) ASPM, (D) BUB1, (E) NUSAP1, (F) CDC20, (G) DLGAP5, (H) BUB1B, and (I) KIF20A and the degree of immune invasion in liver cancer was investigated using the TIMER database (http://timer.cistrome.org). The Rho value, which indicates Pearson’s correlation coefficient, was used to evaluate the relationship between the genes and immune cells. When |Rho| > 0.1 and p < 0.05, it was considered that a correlation existed between the genes and immune cells. In general, the shape of the curve varied depending on the Rho value. When Rho < 0.5, the curve was elliptical; when Rho = 0.5, the curve was parabolic; and when Rho > 0.5, the curve was hyperbolic. These findings provide insights into the potential roles of these key genes in immune invasion in liver cancer.
As shown in Table 1 and Figure 9, ASPM, TOP2A, DLGAP5, TPX2, KIF23, MELK, and ANLN were positively correlated with infiltration of B cells. ASPM, TOP2A, DLGAP5, TPX2, KIF23, and ANLN were negatively correlated with infiltration of CD4+ T cells. TOP2A and KIF23 were positively correlated with infiltration of neutrophils. TOP2A, DLGAP5, KIF23, and ANLN were positively correlated with infiltration of dendritic cells.
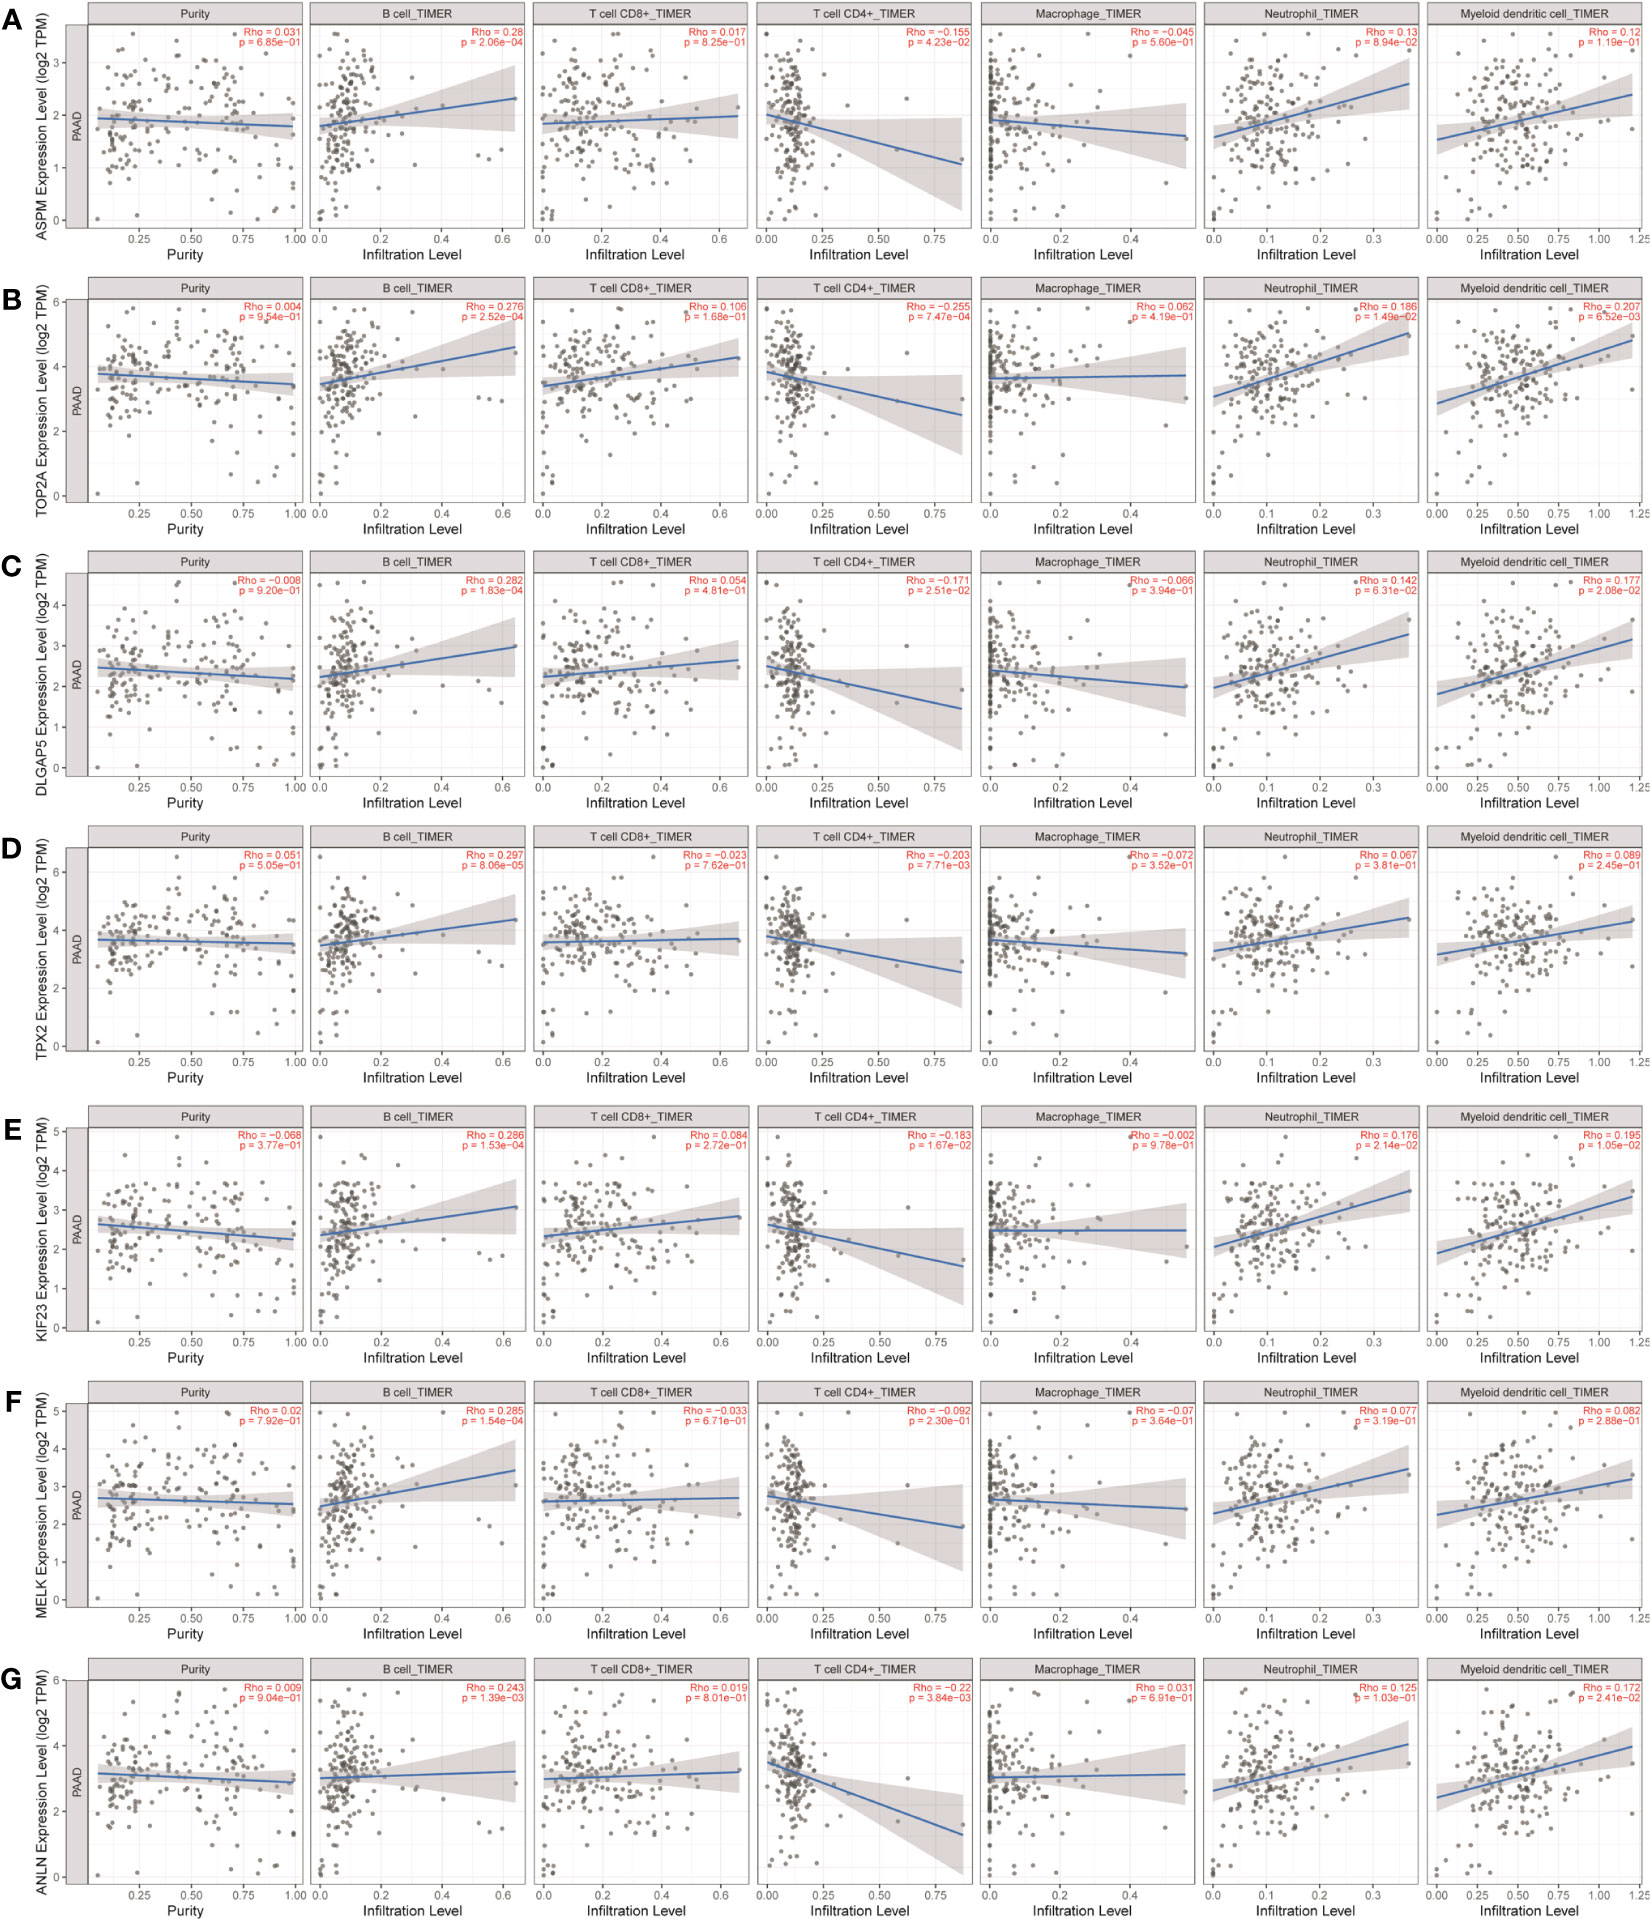
Figure 9 Analysis of key gene expression in various immune cells in pancreatic cancer. The relationship between the expression of (A) ASPM, (B) TOP2A, (C) DLGAP5, (D) TPX2, (E) KIF23, (F) MELK, and (G) ANLN and the degree of immune invasion in pancreatic cancer was analyzed using the TIMER database (http://timer.cistrome.org). The Rho value, which indicates Pearson’s correlation coefficient, was used to evaluate the relationship between the genes and immune cells. When |Rho| > 0.1 and p < 0.05, it was considered that a correlation existed between the genes and immune cells. The shape of the curve varied depending on the Rho value, with smaller Rho values resulting in smoother curves, while larger Rho values resulted in fuller curves. Elliptical curves were observed when Rho < 0.5, parabolic curves when Rho = 0.5, and hyperbolic curves when Rho > 0.5. These findings provide insights into the potential roles of these key genes in immune invasion in pancreatic cancer.
As shown in Table 1 and Figure 10, TAGLN, CNN1, ACTC1, FLNC, and LMOD1 were negatively correlated with infiltration of B cells. TAGLN, CNN1, ACTC1, FLNC, and LMOD1 were positively correlated with infiltration of CD4+ T cells, and macrophages.
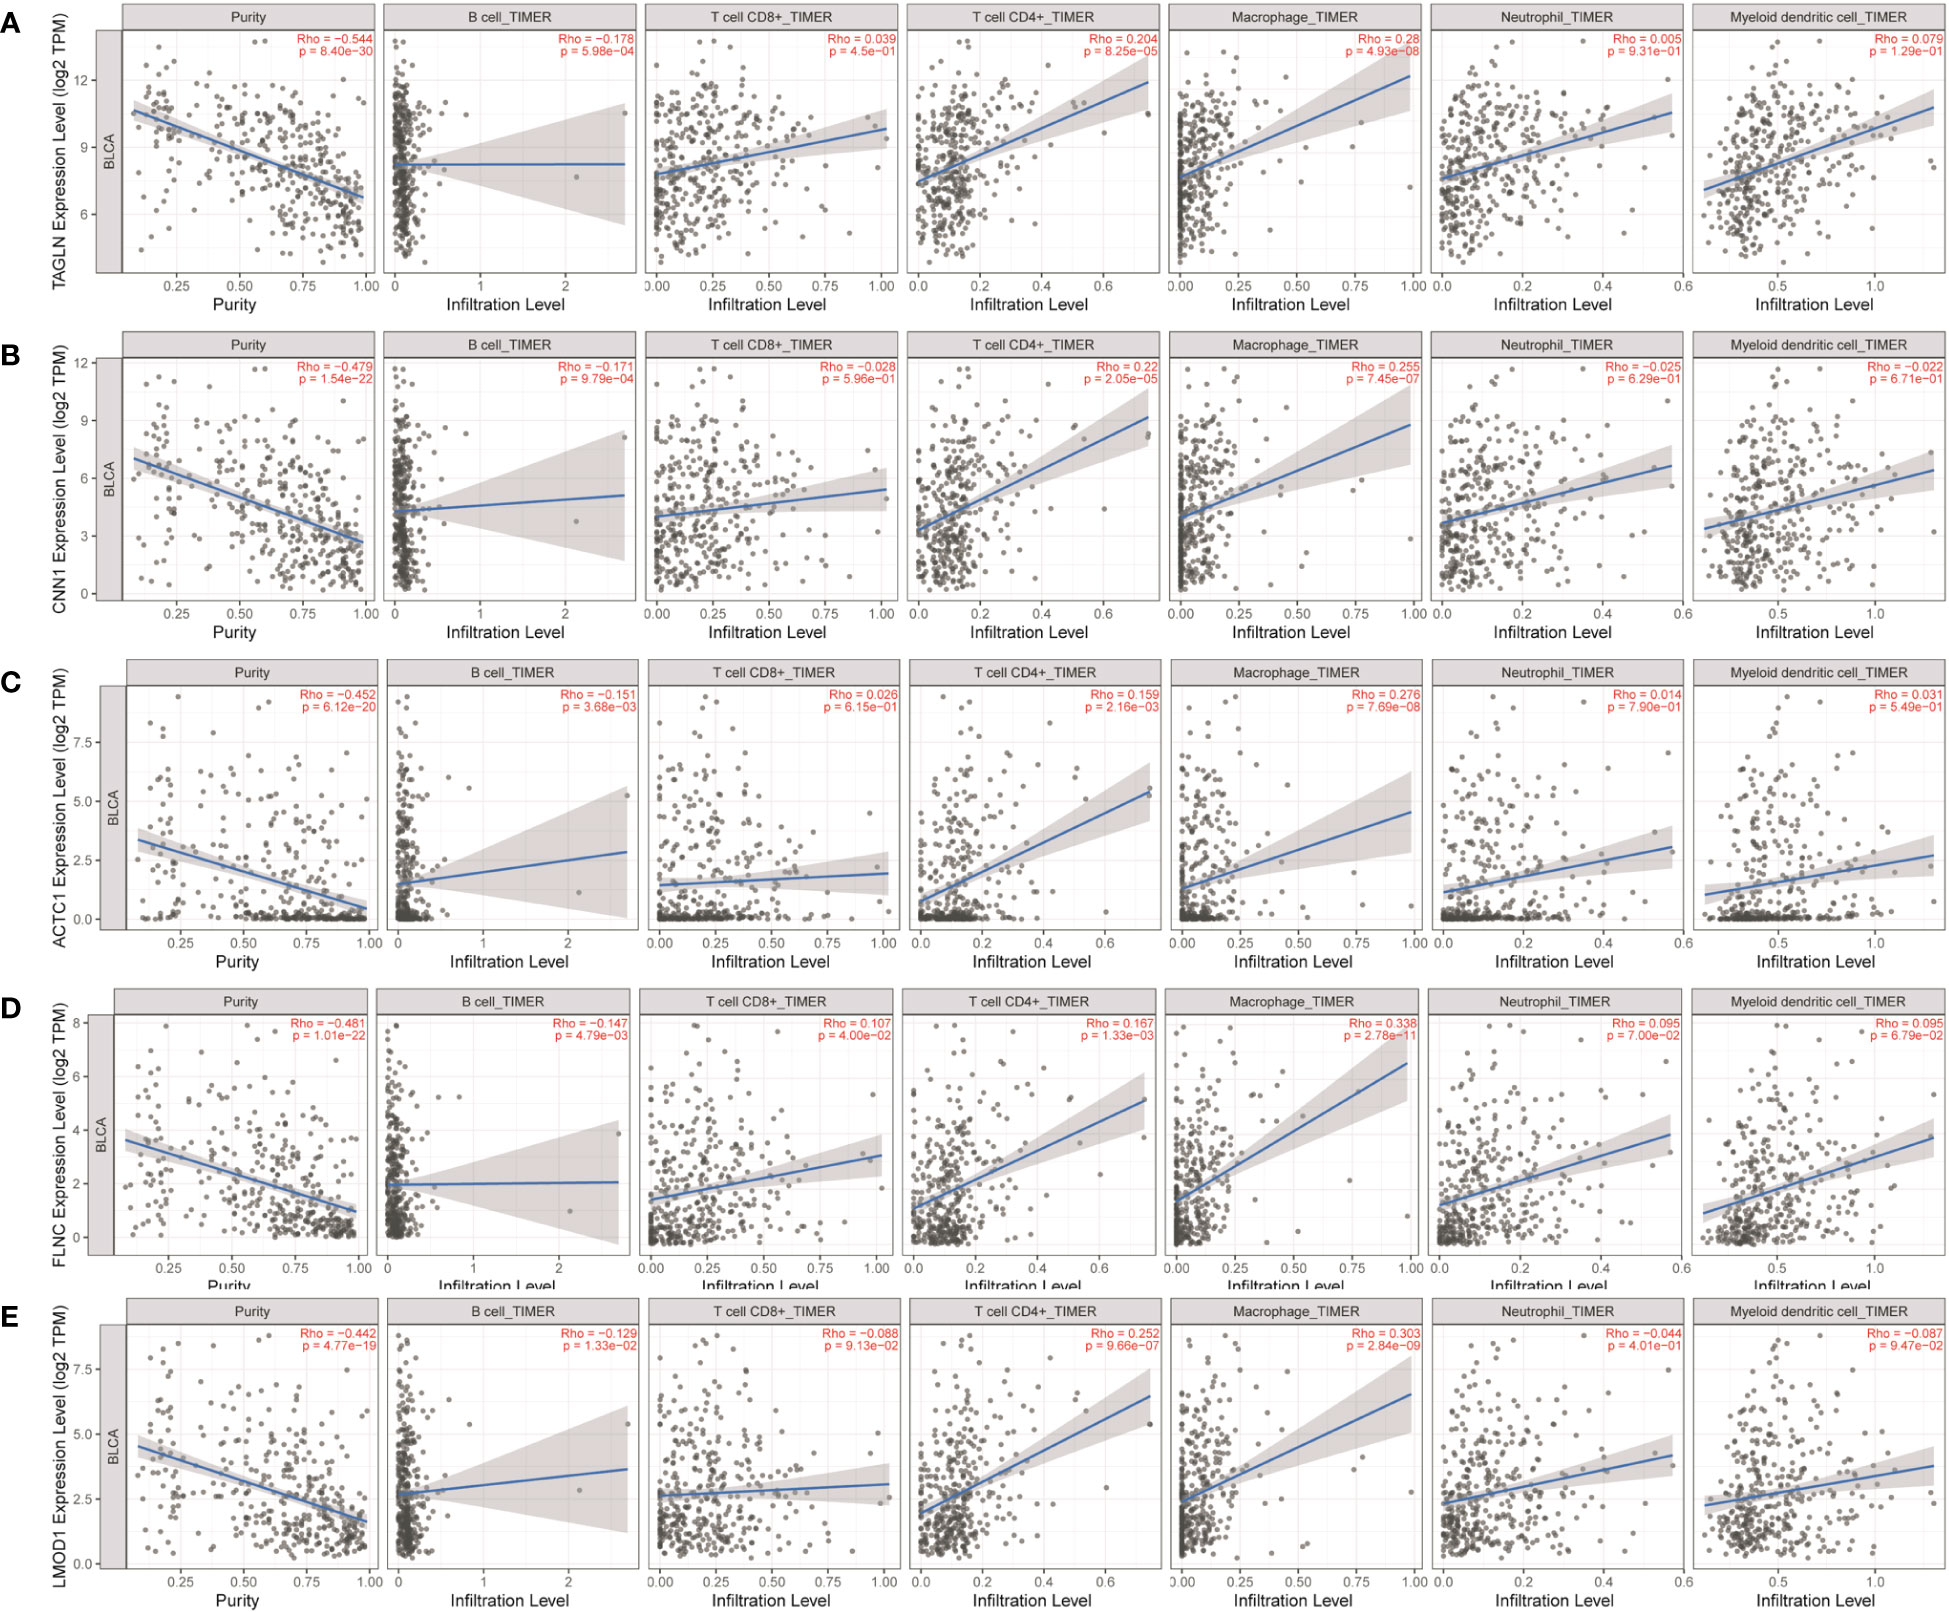
Figure 10 Analysis of key gene expression in various immune cells in bladder cancer. The relationship between the expression of (A) TAGLN, (B) CNN1, (C) ACTC1, (D) FLNC, and (E) LMOD1 and the degree of immune invasion in bladder cancer was analyzed using the TIMER database (http://timer.cistrome.org). The Rho value, which indicates Pearson’s correlation coefficient, was used to evaluate the relationship between the genes and immune cells. When |Rho| > 0.1 and p < 0.05, it was considered that a correlation existed between the genes and immune cells. The shape of the curve varied depending on the Rho value, with smaller Rho values resulting in smoother curves, while larger Rho values resulted in fuller curves. Elliptical curves were observed when Rho < 0.5, parabolic curves when Rho = 0.5, and hyperbolic curves when Rho > 0.5. These findings provide insights into the potential roles of these key genes in immune invasion in bladder cancer.
Molecular docking can be used to explore the optimal binding mode between compounds and targets. Therefore, to further investigate interactions between Frondoside A with its target molecules, CDK1, ASPM, TOP2A, BUB1, CDC20, KIF20A, TPX2, KIF23, MELK, and FLNC molecules were used as molecular docking targets, and the molecular binding free energies listed in Table 2. Our results show that the interaction between Frondoside A saponins and key targets via hydrogen-bonding indicated high stability and the binding free energy of the Frondoside A and the ten key proteins were all < -5 kcal/mol. Of these, the affinity by CDK1 performed the best (-10.7 kcal/mol). The 2D docking diagrams of Frondoside A with the receptor targets were visualized using PyMOL software as shown in Figure 11.
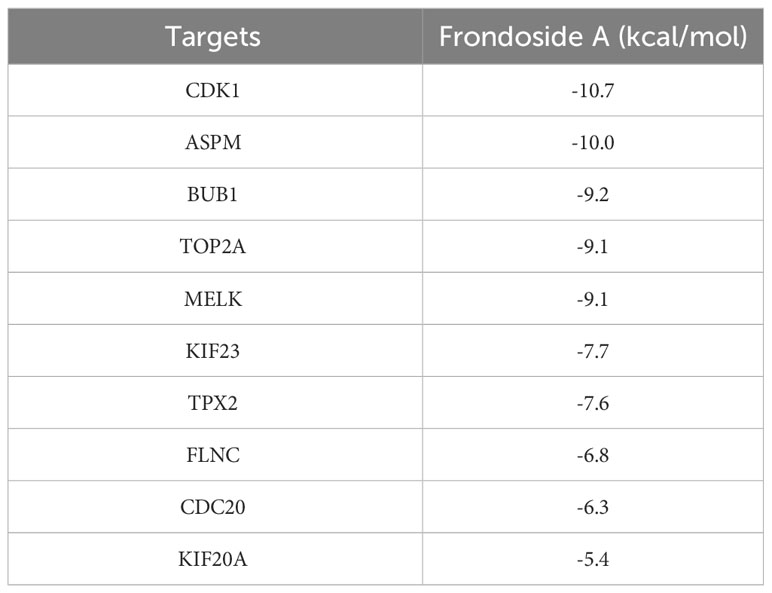
Table 2 Binding Free energy of Frondoside A and targets.
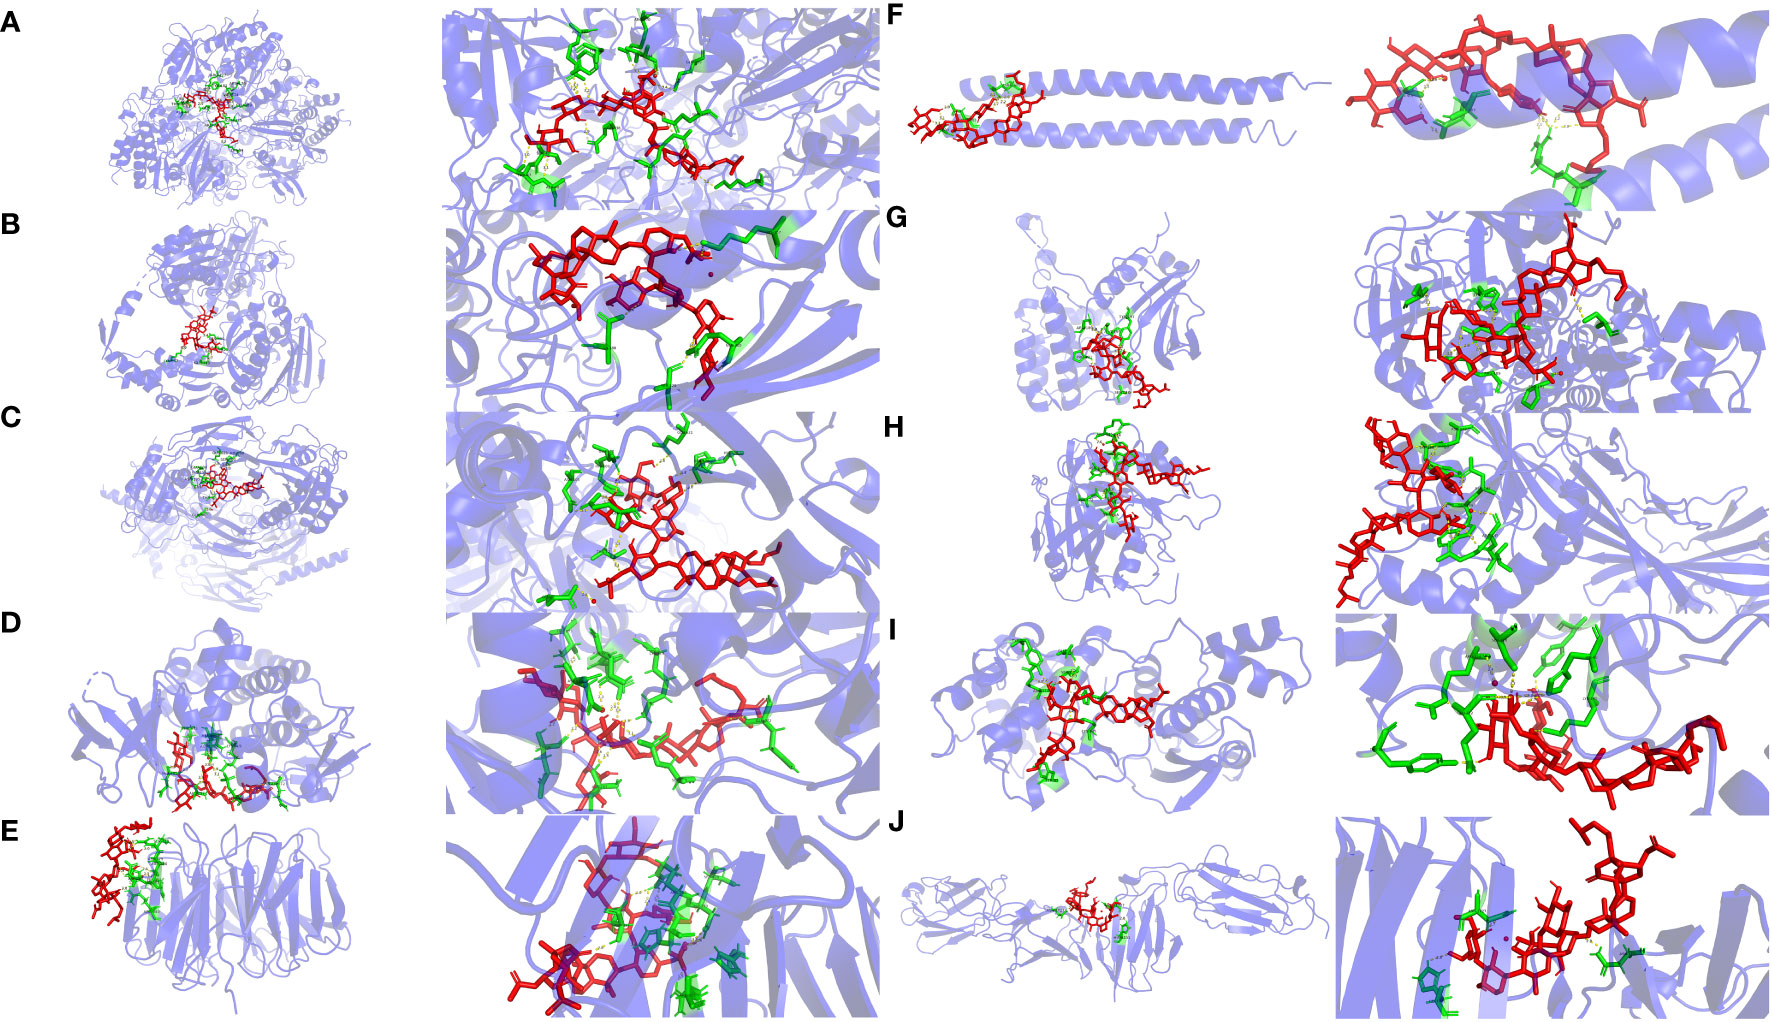
Figure 11 Molecular docking diagrams of Frondoside A and key genes. The yellow, red, green, and light blue represent the hydrogen bond, Frondoside A, amino acid residues, and target protein, respectively. (A) CDK1, (B) TOP2A, (C) ASPM, (D) BUB1, (E) CDC20, (F) KIF20A, (G) TPX2, (H) KIF23, (I) MELK, and (J) FLNC.
As shown in Figure 11A, Frondoside A and CDK1 amino acid residues [LYS-34 (2.3 Å),ARG-36 (3.1 Å and 3.4 Å),GLU-163 (2.6 Å),GLU-209 (3.4 Å),GLN-235 (3.0 Å),ARG-170 (3.1 Å),VAL-174 (2.3 Å),GLU-38(2.9 Å),TYR-181 (3.3 Å),ARG-127 (3.2 Å),THR-47 (3.0 Å) and SER-46 (2.3 Å,3.1 Å and 3.2 Å)] formed fifteen hydrogen bonds at different distances, and Frondoside A-CDK1 had the shortest hydrogen bond with VAL-174 (2.3 Å) and SER-46 (2.3 Å,3.1 Å and 3.2 Å).
As shown in Figure 11B, Frondoside A formed six hydrogen bonds at different distances with amino acid residues of TOP2A [ASN-380 (3.4 Å), SER-320 (2.6 Å), GLN-310 (2.7 Å and 3.0 Å) and LYS-357(3.0 Å and 3.3 Å)] and the hydrogen bond between Frondoside A-TOP2A and SER-320 (2.6A) was the shortest.
As shown in Figure 11C, Frondoside A formed ten hydrogen bonds at different distances with amino acid residues of ASPM [GLU-68 (2.6 Å),THR-72 (3.1 Å and 3.3 Å),ASN-105 (3.1Å),HIS-109 (3.2 Å),GLU-108 (2.3 Å),GLN-609 (2.8 Å),GLU-621 (2.8Å),SER-600 (3.0Å) and HIS-598 (3.4 Å)] and the hydrogen bond between Frondoside A-ASPM and GLU-108 (2.3 Å) was the shortest.
As shown in Figure 11D, Frondoside A formed twelve hydrogen bonds at different distances with amino acid residues of BUB1 [GLN-972 (2.7 Å),ALA-797 (2.4 Å and 2.6 Å),ASP-921(2.0 Å and 3.4 Å), LYS-919 (1.9 Å),SEP-969 (3.1 Å),ASN-922 (2.3 Å),ASP-946 (2.2 Å),GLU-795 (2.2 Å and 2.2 Å) and THR-873 (2.2 Å)] and the hydrogen bond between Frondoside A- BUB1 and LYS-919 (1.9 Å) was the shortest.
As shown in Figure 11E, Frondoside A formed ten hydrogen bonds at different distances with amino acid residues of CDC20 [ASP-397 (2.0 Å), ARG-383 (1.9Å), HIS-381 (2.9 Å), ASP-397 (2.2 Å,2.6 Å and 3.2Å), ARG-380 (2.4 Å,2.5 Å and 2.6 Å), SER-378 (2.0 Å)] and the hydrogen bond between Frondoside A- CDC20 and ARG-383 (1.9Å) was the shortest.
As shown in Figure 11F, Frondoside A formed ten hydrogen bonds at different distances with amino acid residues of KIF20A [ARG-609 (2.1 Å,2.2 Å,2.5 Å,2.7 Å and 2.8 Å), GLU-603 (2.0 Å) and GLY-600 (3.0Å,3.1 Å,3.1 Å and 3.6 Å)] and the hydrogen bond between Frondoside A- KIF20A and GLU-603 (2.0 Å) was the shortest.
As shown in Figure 11G, Frondoside A formed ten hydrogen bonds at different distances with amino acid residues of TPX2[SER-266 (3.0 Å), PRO-191 (2.3Å), TYR-197 (2.2 Å and 3.2Å), ARG-189 (3.0 Å and 3.2Å), ARG-195 (2.8 Å,2.9 Å and 3.4 Å) and SER-20 (3.1 Å)] and the hydrogen bond between Frondoside A- TPX2 and TYR-197 (2.2 Å and 3.2Å) was the shortest.
As shown in Figure 11H, Frondoside A formed nine hydrogen bonds at different distances with amino acid residues of KIF23 [ASN-172 (3.3 Å and 3.3Å), TRP-168 (3.0Å), ASN-148 (3.0Å), TRP-149 (2.4Å), ARG-145 (2.6 Å,3.3 Å and 3.1 Å) and ILE-144 (3.3 Å)] and the hydrogen bond between Frondoside A- KIF23 and TYR-197 TRP-149 (2.4Å) was the shortest.
As shown in Figure 11I, Frondoside A formed nine hydrogen bonds at different distances with amino acid residues of MELK [TYR-97 (3.2 Å), LYS-145 (3.1Å), HIS-68 (2.9 Å and 3.2Å), SER-118 (3.3Å), ARG-114 (2.4 Å and 3.5 Å), TYR-269 (2.2 Å) and GLU-272 (3.5 Å)] and the hydrogen bond between Frondoside A- MELK and TYR-269 (2.2 Å) was the shortest.
As shown in Figure 11J, Frondoside A formed three hydrogen bonds at different distances with amino acid residues of FLNC [ASN-1727 (2.9 Å), ASN-1727 (2.7Å) and HIS-1731 (2.98Å)] and the hydrogen bond between Frondoside A- FLNC and ASN-1727 (2.7Å) was the shortest.
Conventional chemotherapeutic drugs currently in use have given rise to drug resistance due to diverse mechanisms of action. Therefore, new and effective therapeutic agents are urgently needed to treat cancer (14). The targeting of cancer growth, survival, migration, and metastasis pathways using drugs with minimal or no toxicity to normal cells is of significant importance (32). Frontside A has been shown to have anticancer activities in many cancer models, such as bladder cancer, lung cancer, breast cancer (33–36). In the present study, Frondoside A has been demonstrated to exhibit concentration-dependent inhibitory effects on the viability of cancer cells. Frondoside A has been observed to significantly reduce cell migration of HepG2, Panc02, and UM-UC-3 cells in a time-dependent manner at IC50 concentrations. Moreover, the inhibitory effects of Frondoside A on cell migration were found to be superior to those of EPI. It is important to note that the development of anti-tumor therapeutic agents that induce apoptosis and inhibit tumor invasion or metastasis are highly desirable (37). The effects of Frondoside A on cell viability or proliferation have been tested using multiple different methods in many different cancers (14, 38, 39). Frondoside A has demonstrated potent growth inhibitory effects on human pancreatic cancer cells, exhibiting an EC50 of approximately 1 µM (38). The observed inhibition of proliferation is accompanied by a significant increase in apoptosis (14, 38). Frondoside A exhibits significant cytotoxicity against urothelial carcinoma cells, with IC50 values ranging from 0.55 to 2.33 μM (33, 40). Consistent with our findings, Frondoside A, a marine-derived compound, has demonstrated potential as a therapeutic agent for the treatment of liver, pancreatic, and bladder cancers. While the precise mechanism underlying the anti-cancer effects of Frondoside A remains unclear (14), and the effect of Frondoside A on cell cycle and apoptosis of HepG2, Panc02, and UM-UC-3 require further investigation.
Recently, a study has reported that metformin can induce G2/M arrest and significantly inhibit the proliferation of HCC cells (41). Additionally, metformin has been found to effectively downregulate the expression of CDK1 (41). Several studies have reported significant upregulation of TOP2A mRNA and protein expression in hepatocellular carcinoma (HCC), suggesting that TOP2A is overexpressed in this cancer type and may serve as a potential biomarker for HCC (42). ASPM overexpression has been recognized as a molecular marker that correlates with heightened invasive and metastatic potential in hepatocellular carcinoma (HCC) (43, 44). In contrast, upregulation of BUB1 significantly promoted cell proliferation, while downregulation of BUB1 expression inhibited the proliferation of liver cancer cell lines (45–47). Nucleolar and spindle-associated protein 1 (NUSAP1) is a member of the NUSP1 family of nucleolar-spindle-associated proteins and is involved in spindle microtubule organization (48). Li (49, 50) et al. studied the impact of CDC20 on the progression of hepatocellular carcinoma (HCC) and found that CDC20 expression was elevated in HCC samples. Transfection with CDC20 small interfering RNA in HCC cells led to reduced cellular proliferation and increased cell numbers in the G2/M phase. DLGAP5 (also known as HURP or KI-AA0008) is a cell-cycle-regulated protein that plays a role in tumor development (51). BUB1B, a crucial mitotic spindle checkpoint, is overexpressed in adrenocortical carcinomas (52) and promotes tumor proliferation while inducing radio resistance in glioblastoma (53, 54). KIF20A accumulates in the nucleus during the G2 phase of the cell cycle and promotes both normal and pathological hepatocyte proliferation (55).
ASPM-iII has been shown to selectively regulate cyclin E expression levels and cell cycle progression in PDAC cells (56). TOP2A expression is upregulated in pancreatic cancer tissues compared to non-tumor tissues, and its upregulation is significantly associated with tumor metastasis and shorter survival in pancreatic cancer patients (57–59). Knockdown of TOP2A in pancreatic cancer cell lines inhibits cell proliferation and migration. DLGAP5 expression is significantly elevated in pancreatic cancer tissues and is correlated with patients’ survival and progression-free survival (60). Knockdown of DLGAP5 inhibits pancreatic cancer cell proliferation, invasion, and migration (61). TPX2 has been identified as a prognostic biomarker of KARS-mutant PDAC (62). Knockdown of KIF23 can inhibit pancreatic cell proliferation (63). Silencing of MELK significantly reduces pancreatic cancer development (64), as MELK promotes CDK1 involvement in the cell cycle and cell progression in cancers (65). ANLN expression is significantly upregulated in pancreatic cancer tissues and cell lines and is associated with tumor size, differentiation, TNM stage, lymph node metastasis, distant metastasis, and poor prognosis in pancreatic cancer. ANLN knockdown inhibits several cell-cell adhesions-related genes, including the gene encoding LIM and SH3 protein 1 (LASP1). LASP1 upregulation partially reverses the tumor-suppressive effect of ANLN downregulation on pancreatic cancer cell progression. ANLN contributes to pancreatic cancer progression by regulating the EZH2/miR-218-5p/LASP1 signaling axis (66, 67).
Consistent with our study, previous studies have reported these key genes (TAGLN, CNN1, ACTC1, LMOD1) play important roles in bladder cancer. TAGLN is a recognized actin-binding protein that modulates the dynamics of the actin cytoskeleton (68–70). CNN1 was significantly lowly expressed in BC tissues and cells (70). ACTC1 is responsible for encoding cardiac actin, and a c.G301A mutation in this gene has been shown to be associated with hypertrophic cardiomyopathy, which, in some instances, leads to sudden cardiac death (71). Previous studies showed that ACTC1 is related to cancer prognosis (72, 73), ACTC1 expression is significantly upregulated in glioblastoma and inhibits migration of cancer cells (74), and ACTC1 correlates with the prognosis of glioblastoma and can be used as a novel prognostic marker in glioma (72). LMOD1 belongs to the LMOD family of proteins, which exhibit a striking similarity to actin-capping proteins referred to as Tropomodulins (TMODs) (75). LMOD1, also known as Leiomodin 1, displays widespread expression in a majority of tissues, with particularly elevated levels in the thyroid, skeletal muscle, eye muscle, and ovary (76). Dysregulated expression of LMOD1 may potentially be linked to various pathological conditions (77). LMOD1 was found to be a new gastric cancer biomarker and therapeutic target that induces EMT by regulating the FAK-Akt/mTOR pathway (78).
Molecular docking was used in this study to investigate the mechanism and provide valuable guidance for drug screening and design in future experiments. Based on our molecular investigations, the free energies of Frondoside A and the critical proteins were observed to be below -5 kcal/mol, indicating favorable binding of the aforementioned active ingredients to their respective targets. Studies have shown that Frondoside A can down-regulate CDC20 gene expression, which inhibits the proliferation and migration of cancer cells and promotes cycle arrest and cell apoptosis (79, 80). In addition, Zhang and colleagues have shown that TOP2A deletion can significantly inhibit the proliferation and migration of cancer cells and induce cell apoptosis (81–83). Furthermore, down-regulated expression of CDK1 not only inhibits proliferation and migration of hepatocellular carcinoma cells, but also induces cycle arrest and specific apoptosis of hepatocellular carcinoma cells (84, 85). Finally, overexpression of CNN1 has been shown to inhibit the proliferation, invasion and metastasis of bladder cancer cells (86). Therefore, it is likely that that Frondoside A inhibits the proliferation and metastasis of cancer cells by down-regulating CDK1, CDC20, TOP2A and up-regulating CNN1.It should be noted that the free binding energy between Frondoside A and CDK1 was the lowest, measuring -10.7 kcal/mol. This indicates that Frondoside A may inhibit the development of liver cancer through its effect on the cell cycle (39). The specific mechanisms need to be further investigated.
In addition, Frondoside A may affect immune infiltration by modulating certain targets. These targets may involve activation, recruitment, or inhibition of immune cells. For example, Frondoside A may inhibit the expression of certain pro-inflammatory cytokines in order to reduce the inflammatory response and immune cell infiltration. Alternatively, it may act directly on immune cells, such as T cells or macrophages, affecting their activation and function. This effect may help to improve the tumor microenvironment and enhance anti-tumor effects. However, further studies are needed to validate this hypothesis and determine the specific molecular mechanisms.
The integration of bioinformatics and molecular docking analyses has enhanced our comprehension of the underlying molecular mechanisms through which Frondoside A exerts its effects in hepatocellular carcinoma, pancreatic cancer, and bladder cancer. Our findings suggest that Frondoside A holds great promise as a potential therapeutic candidate for the treatment of these cancers due to its multi-targeted and multi-mechanistic approach.
The original contributions presented in the study are included in the article/Supplementary Material. Further inquiries can be directed to the corresponding author.
GL: Data curation, Formal analysis, Investigation, Methodology, Resources, Software, Validation, Visualization, Writing – original draft. SZ: Data curation, Software, Validation, Visualization, Writing – review & editing. RL: Data curation, Software, Validation, Visualization, Writing – review & editing. XC: Writing – review & editing. LY: Conceptualization, Funding acquisition, Project administration, Supervision, Writing – review & editing.
The author(s) declare financial support was received for the research, authorship, and/or publication of this article. This research was funded by the Innovation Team Project of Guangdong Universities (2022KCXTD017). XC is supported by the grant of Guangdong International High-end Talents Exchange Project (Overseas famous experts, YKHZZ [2021] No. 1480). The funders had no role in the study design, the data collection and analysis, the decision to publish, or the preparation of the manuscript.
The authors would like to thank Prof. Zonghe Yu in South China Agricultural University and Prof. Peng Luo in South China Sea Institute of Oceanology, Chinese Academy of Science for providing the sea cucumber samples.
The authors declare that the research was conducted in the absence of any commercial or financial relationships that could be construed as a potential conflict of interest.
The author(s) declared that they were an editorial board member of Frontiers, at the time of submission. This had no impact on the peer review process and the final decision.
All claims expressed in this article are solely those of the authors and do not necessarily represent those of their affiliated organizations, or those of the publisher, the editors and the reviewers. Any product that may be evaluated in this article, or claim that may be made by its manufacturer, is not guaranteed or endorsed by the publisher.
The Supplementary Material for this article can be found online at: https://www.frontiersin.org/articles/10.3389/fonc.2023.1307838/full#supplementary-material
1. Sung H, Ferlay J, Siegel RL, Laversanne M, Soerjomataram I, Jemal A, et al. Global cancer statistics 2020: GLOBOCAN estimates of incidence and mortality worldwide for 36 cancers in 185 countries. CA Cancer J Clin (2021) 71(3):209–49. doi: 10.3322/caac.21660
2. Xia C, Dong X, Li H, Cao M, Sun D, He S, et al. Cancer statistics in China and United States, 2022: profiles, trends, and determinants. Chin Med J (Engl) (2022) 135(5):584–90. doi: 10.1097/CM9.0000000000002108
3. Duffy MJ. Use of biomarkers in screening for cancer. Adv Exp Med Biol (2015) 867:27–39. doi: 10.1007/978-94-017-7215-0_3
4. Tímár J, Uhlyarik A. On-target side effects of targeted therapeutics of cancer. Pathol Oncol research: POR (2022) 28:1610694. doi: 10.3389/pore.2022.1610694
5. Dasari S, Tchounwou P. Cisplatin in cancer therapy: molecular mechanisms of action. Eur J Pharmacol (2014) 740:364–78. doi: 10.1016/j.ejphar.2014.07.025
6. Rocha-Martin J, Harrington C, Dobson AD, O'Gara F. Emerging strategies and integrated systems microbiology technologies for biodiscovery of marine bioactive compounds. Mar Drugs (2014) 12(6):3516–59. doi: 10.3390/md12063516
7. Khalifa SAM, Elias N, Farag MA, Chen L, Saeed A, Hegazy MF, et al. Marine natural products: A source of novel anticancer drugs. Mar Drugs (2019) 17(9):1-2, 11-17. doi: 10.3390/md17090491
8. Nobili S, Lippi D, Witort E, Donnini M, Bausi L, Mini E, et al. Natural compounds for cancer treatment and prevention. Pharmacol Res (2009) 59(6):365–78. doi: 10.1016/j.phrs.2009.01.017
9. Ang KK, Holmes MJ, Higa T, Hamann MT, Kara UA. In vivo antimalarial activity of the beta-carboline alkaloid manzamine A. Antimicrob Agents Chemother (2000) 44(6):1645–9. doi: 10.1128/AAC.44.6.1645-1649.2000
10. Haque N, Parveen S, Tang T, Wei J, Huang Z. Marine natural products in clinical use. Mar Drugs (2022) 20(8):1–2. doi: 10.3390/md20080528
11. Correia-da-Silva M, Sousa E, Pinto MMM, Kijjoa A. Anticancer and cancer preventive compounds from edible marine organisms. Semin Cancer Biol (2017) 46:55–64. doi: 10.1016/j.semcancer.2017.03.011
12. Pangestuti R, Arifin Z. Medicinal and health benefit effects of functional sea cucumbers. J Tradit Complement Med (2018) 8(3):341–51. doi: 10.1016/j.jtcme.2017.06.007
13. Janakiram NB, Mohammed A, Rao CV. Sea cucumbers metabolites as potent anti-cancer agents. Mar Drugs (2015) 13(5):2909–23. doi: 10.3390/md13052909
14. Adrian TE, Collin P. The anti-cancer effects of frondoside A. Mar Drugs (2018) 16(2):2. doi: 10.3390/md16020064
15. Edgar R, Domrachev M, Lash AE. Gene Expression Omnibus: NCBI gene expression and hybridization array data repository. Nucleic Acids Res (2002) 30(1):207–10. doi: 10.1093/nar/30.1.207
16. Zhou Y, Zhou B, Pache L, Chang M, Khodabakhshi AH, Tanaseichuk O, et al. Metascape provides a biologist-oriented resource for the analysis of systems-level datasets. Nat Commun (2019) 10(1):1523. doi: 10.1038/s41467-019-09234-6
17. Szklarczyk D, Gable AL, Nastou KC, Lyon D, Kirsch R, Pyysalo S, et al. The STRING database in 2021: customizable protein-protein networks, and functional characterization of user-uploaded gene/measurement sets. Nucleic Acids Res (2021) 49(D1):D605–12. doi: 10.1093/nar/gkaa1074
18. Tang Z, Li C, Kang B, Gao G, Li C, Zhang Z. GEPIA: a web server for cancer and normal gene expression profiling and interactive analyses. Nucleic Acids Res (2017) 45(W1):W98–w102. doi: 10.1093/nar/gkx247
19. Li T, Fu J, Zeng Z, Cohen D, Li J, Chen Q, et al. TIMER2.0 for analysis of tumor-infiltrating immune cells. Nucleic Acids Res (2020) 48(W1):W509–w514. doi: 10.1093/nar/gkaa407
20. Brown NR, Korolchuk S, Martin MP, Stanley WA, Moukhametzianov R, Noble MEM, et al. CDK1 structures reveal conserved and unique features of the essential cell cycle CDK. Nat Commun (2015) 6:6769. doi: 10.1038/ncomms7769
21. Hou X, Hagemann N, Schoebel S, Blankenfeldt W, Goody RS, Erdmann KS, et al. A structural basis for Lowe syndrome caused by mutations in the Rab-binding domain of OCRL1. EMBO J (2011) 30(8):1659–70. doi: 10.1038/emboj.2011.60
22. Lin Z, Jia L, Tomchick DR, Luo X, Yu H. Substrate-specific activation of the mitotic kinase Bub1 through intramolecular autophosphorylation and kinetochore targeting. Structure (2014) 22(11):1616–27. doi: 10.1016/j.str.2014.08.020
23. Miserey-Lenkei S, Bousquet H, Pylypenko O, Bardin S, Dimitrov A, Bressanelli G, et al. Coupling fission and exit of RAB6 vesicles at Golgi hotspots through kinesin-myosin interactions. Nat Commun (2017) 8(1):1254. doi: 10.1038/s41467-017-01266-0
24. Lambert JP, Picaud S, Fujisawa T, Hou H, Savitsky P, Uusküla-Reimand L, et al. Interactome rewiring following pharmacological targeting of BET bromodomains. Mol Cell (2019) 73(3):621–638.e17. doi: 10.1016/j.molcel.2018.11.006
25. Zorba A, Buosi V, Kutter S, Kern N, Pontiggia F, Cho YJ, et al. Molecular mechanism of Aurora A kinase autophosphorylation and its allosteric activation by TPX2. Elife (2014) 3:e02667. doi: 10.7554/eLife.02667
26. Makyio H, Ohgi M, Takei T, Takahashi S, Takatsu H, Katoh Y, et al. Structural basis for Arf6-MKLP1 complex formation on the Flemming body responsible for cytokinesis. EMBO J (2012) 31(11):2590–603. doi: 10.1038/emboj.2012.89
27. Huang HT, Seo HS, Zhang T, Wang Y, Jiang B, Li Q, et al. MELK is not necessary for the proliferation of basal-like breast cancer cells. Elife (2017) 6:2–3. doi: 10.7554/eLife.26693
28. Burley SK, Bhikadiya C, Bi C, Bittrich S, Chen L, Crichlow GV, et al. RCSB Protein Data Bank: powerful new tools for exploring 3D structures of biological macromolecules for basic and applied research and education in fundamental biology, biomedicine, biotechnology, bioengineering and energy sciences. Nucleic Acids Res (2021) 49(D1):D437–d451. doi: 10.1093/nar/gkaa1038
29. Baugh EH, Lyskov S, Weitzner BD, Gray JJ. Real-time pyMOL visualization for rosetta and pyRosetta. PloS One (2011) 6(8):e21931. doi: 10.1371/journal.pone.0021931
30. Yao YX, Xu YL, Liu BW, Yang H, Li SY, Zhazo LL, et al. Identification and verification of effective components of Huanghuai for dysfunctional uterine bleeding based on network pharmacology and molecular docking. Chin Herb Med (2021) 13(2):177–88. doi: 10.1016/j.chmed.2020.08.003
31. Gaillard T. Evaluation of autoDock and autoDock vina on the CASF-2013 benchmark. J Chem Inf Model (2018) 58(8):1697–706. doi: 10.1021/acs.jcim.8b00312
32. Pathak K, Pathak MP, Saikia R, Gogoi U, Sahariah JJ, Zothantluanga JH, et al. Cancer chemotherapy via natural bioactive compounds. Curr Drug Discovery Technol (2022) 19(4):e310322202888. doi: 10.2174/1570163819666220331095744
33. Ru R, Chen G, Liang X, Cao X, Yuan L, Meng M. Sea cucumber derived triterpenoid glycoside frondoside A: A potential anti-bladder cancer drug. Nutrients (2023) 15(2):6, 15-17. doi: 10.3390/nu15020378
34. Dyshlovoy SA, Rast S, Hauschild J, Otte K, Alsdorf WH, Madanchi R, et al. Frondoside A induces AIF-associated caspase-independent apoptosis in Burkitt lymphoma cells. Leuk Lymphoma (2017) 58(12):2905–15. doi: 10.1080/10428194.2017.1317091
35. Xue Y, Fu Y, Zhao F, Gui G, Li Y, Rivero-Hinojosa S, et al. Frondoside A inhibits an MYC-driven medulloblastoma model derived from human-induced pluripotent stem cells. Mol Cancer Ther (2021) 20(6):1199–209. doi: 10.1158/1535-7163.MCT-20-0603
36. Sulaiman S, Arafat K, Al-Azawi AM, AlMarzooqi NA, Lootah SNAH, Attoub S. Butein and frondoside-A combination exhibits additive anti-cancer effects on tumor cell viability, colony growth, and invasion and synergism on endothelial cell migration. Int J Mol Sci (2021) 23(1):7-9. doi: 10.3390/ijms23010431
37. Wargasetia TL, Widodo. Mechanisms of cancer cell killing by sea cucumber-derived compounds. Invest New Drugs (2017) 35(6):820–6. doi: 10.1007/s10637-017-0505-5
38. Al Shemaili J, Parekh KA, Newman RA, Hellman B, Woodward C, Adem A, et al. Pharmacokinetics in mouse and comparative effects of frondosides in pancreatic cancer. Mar Drugs (2016) 14(6):1–5. doi: 10.3390/md14060115
39. Dyshlovoy SA, Menchinskaya ES, Venz S, Rast S, Amann K, Hauschild J, et al. The marine triterpene glycoside frondoside A exhibits activity in vitro and in vivo in prostate cancer. Int J Cancer (2016) 138(10):2450–65. doi: 10.1002/ijc.29977
40. Dyshlovoy S, Madanchi R, Hauschild J, Otte K, Alsdorf WH, Schumacher U, et al. The marine triterpene glycoside frondoside A induces p53-independent apoptosis and inhibits autophagy in urothelial carcinoma cells. BMC Cancer (2017) 17(1):93. doi: 10.1186/s12885-017-3085-z
41. Zhou J, Han S, Qian W, Gu Y, Li X, Yang K. Metformin induces miR-378 to downregulate the CDK1, leading to suppression of cell proliferation in hepatocellular carcinoma. Onco Targets Ther (2018) 11:4451–9. doi: 10.2147/OTT.S167614
42. Badr E, Elmongy EI, Mostafa RG, El-Sayed IE, Abd El-Ati Gad Allah AE, Khairy Ahmed A, et al. The role of LINC01564, RAMS11, CBX4 and TOP2A in hepatocellular carcinoma. Biomedicines (2022) 11(1):10. doi: 10.3390/biomedicines11010056
43. Drozdov I, Bornschein J, Wex T, Valeyev NV, Tsoka S, Malfertheiner P. Functional and topological properties in hepatocellular carcinoma transcriptome. PloS One (2012) 7(4):e35510. doi: 10.1371/journal.pone.0035510
44. Kim S, Hwang S, Song GW, Jung DH, Moon DB, Yang JD, et al. Identification of key genes and carcinogenic pathways in hepatitis B virus-associated hepatocellular carcinoma through bioinformatics analysis. Ann hepato-biliary-pancreatic Surg (2022) 26(1):58–68. doi: 10.14701/ahbps.21-108
45. Zhu LJ, Pan Y, Chen XY, Hou PF. BUB1 promotes proliferation of liver cancer cells by activating SMAD2 phosphorylation. Oncol Lett (2020) 19(5):3506–12. doi: 10.3892/ol.2020.11445
46. Kakar M, Mehboob MZ, Akram M, Shah M, Shakir Y, Ijaz HW, et al, et al. Identification of differentially expressed genes associated with the prognosis and diagnosis of hepatocellular carcinoma by integrated bioinformatics analysis. BioMed Res Int (2022) 2022:4237633. doi: 10.1155/2022/4237633
47. Agarwal R, Narayan J, Bhattacharyya A, Saraswat M, Tomar AK. Gene expression profiling, pathway analysis and subtype classification reveal molecular heterogeneity in hepatocellular carcinoma and suggest subtype specific therapeutic targets. Cancer Genet (2017) 216-217:37–51. doi: 10.1016/j.cancergen.2017.06.002
48. Raemaekers T, Ribbeck K, Beaudouin J, Annaert W, Van Camp M, Stockmans I, et al. NuSAP, a novel microtubule-associated protein involved in mitotic spindle organization. J 1Cell Biol (2003) 162(6):1017–29. doi: 10.1083/jcb.200302129
49. Li J, Gao JZ, Du JL, Huang ZX, Wei LX. Increased CDC20 expression is associated with development and progression of hepatocellular carcinoma. Int J Oncol (2014) 45(4):1547–55. doi: 10.3892/ijo.2014.2559
50. Nair G, Hema Sree GNS, Saraswathy GR, Marise VLP, Krishna Murthy TP. Application of comprehensive bioinformatics approaches to reconnoiter crucial genes and pathways underpinning hepatocellular carcinoma: a drug repurposing endeavor. Med Oncol (Northwood London England) (2021) 38(12):145. doi: 10.1007/s12032-021-01576-w
51. Bassal S, Nomura N, Venter D, Brand K, McKay MJ, van der Spek PJ. Characterization of a novel human cell-cycle-regulated homologue of Drosophila dlg1. Genomics (2001) 77(1-2):5–7. doi: 10.1006/geno.2001.6570
52. Passaia BDS, Dias MH, Kremer JL, Antonini SRR, de Almeida MQ, Fragoso MCBV, et al. TCF21/POD-1, a transcritional regulator of SF-1/NR5A1, as a potential prognosis marker in adult and pediatric adrenocortical tumors. Front Endocrinol (Lausanne) (2018) 9:38. doi: 10.3389/fendo.2018.00038
53. Ma Q, Liu Y, Shang L, Yu J, Qu Q. The FOXM1/BUB1B signaling pathway is essential for the tumorigenicity and radioresistance of glioblastoma. Oncol Rep (2017) 38(6):3367–75. doi: 10.3892/or.2017.6032
54. Lee E, Pain M, Wang H, Herman JA, Toledo CM, DeLuca JG, et al. BUB1BSensitivity to inhibition defines an alternative classification of glioblastoma. Cancer Res (2017) 77(20):5518–29. doi: 10.1158/0008-5472.CAN-17-0736
55. Gasnereau I, Boissan M, Margall-Ducos G, Couchy G, Wendum D, Bourgain-Guglielmetti F, et al. KIF20A mRNA and its product MKlp2 are increased during hepatocyte proliferation and hepatocarcinogenesis. Am J Pathol (2012) 180(1):131–40. doi: 10.1016/j.ajpath.2011.09.040
56. Hsu CC, Liao WY, Chan TS, Chen WY, Lee CT, Shan YS, et al. The differential distributions of ASPM isoforms and their roles in Wnt signaling, cell cycle progression, and pancreatic cancer prognosis. J Pathol (2019) 249(4):498–508. doi: 10.1002/path.5341
57. Roche S, Liao WY, Chan TS, Chen WY, Lee CT, Shan YS, et al. Establishment and characterisation by expression microarray of patient-derived xenograft panel of human pancreatic adenocarcinoma patients. Int J Mol Sci (2020) 21(3):1–14. doi: 10.3390/ijms21030962
58. Tanaka T, Okada R, Hozaka Y, Wada M, Moriya S, Satake S, et al. miR-30c-5pMolecular pathogenesis of pancreatic ductal adenocarcinoma: impact of and regulation on oncogenic genes. Cancers (2020) 12(10):1–16. doi: 10.3390/cancers12102731
59. Kisling S, Natarajan G, Pothuraju R, Shah A, Batra SK, Kaur S. Implications of prognosis-associated genes in pancreatic tumor metastasis: lessons from global studies in bioinformatics. Cancer metastasis Rev (2021) 40(3):721–38. doi: 10.1007/s10555-021-09991-1
60. Chhatriya B, Mukherjee M, Ray S, Saha B, Lahiri S, Halder S, et al. Transcriptome analysis identifies putative multi-gene signature distinguishing benign and Malignant pancreatic head mass. J Trans Med (2020) 18(1):420. doi: 10.1186/s12967-020-02597-1
61. Ke MJ, Ji LD, Li YX. Bioinformatics analysis combined with experiments to explore potential prognostic factors for pancreatic cancer. Cancer Cell Int (2020) 20:382. doi: 10.1186/s12935-020-01474-7
62. Gomes-Filho SM, Dos Santos EO, Bertoldi ERM, Scalabrini LC, Heidrich V, Dazzani B, et al. Aurora A kinase and its activator TPX2 are potential therapeutic targets in KRAS-induced pancreatic cancer. Cell Oncol (Dordr) (2020) 43(3):445–60. doi: 10.1007/s13402-020-00498-5
63. Gao CT, Ren J, Yu J, Li SN, Guo XF, Zhou YZ. KIF23 enhances cell proliferation in pancreatic ductal adenocarcinoma and is a potent therapeutic target. Ann Transl Med (2020) 8(21):1394. doi: 10.21037/atm-20-1970
64. Chung CH, Miller A, Panopoulos A, Hao E, Margolis R, Terskikh A, et al. Maternal embryonic leucine zipper kinase regulates pancreatic ductal, but not β-cell, regeneration. Physiol Rep (2014) 2(9):5–6. doi: 10.14814/phy2.12131
65. Ganguly R, Mohyeldin A, Thiel J, Kornblum HI, Beullens M, Nakano I. MELK-a conserved kinase: functions, signaling, cancer, and controversy. Clin Transl Med (2015) 4:11. doi: 10.1186/s40169-014-0045-y
66. Wang A, Dai H, Gong Y, Zhang C, Shu J, Luo , et al. ANLN-induced EZH2 upregulation promotes pancreatic cancer progression by mediating miR-218-5p/LASP1 signaling axis. J Exp Clin Cancer Res (2019) 38(1):347. doi: 10.1186/s13046-019-1340-7
67. Idichi T, Seki N, Kurahara H, Yonemori K, Osako Y, Arai T, et al. miR-217Regulation of actin-binding protein ANLN by antitumor inhibits cancer cell aggressiveness in pancreatic ductal adenocarcinoma. Oncotarget (2017) 8(32):53180–93. doi: 10.18632/oncotarget.18261
68. Pashaei E, Guzel E, Ozgurses ME, Demirel G, Aydin N, Ozen M. A meta-analysis: identification of common mir-145 target genes that have similar behavior in different GEO datasets. PloS One (2016) 11(9):e0161491. doi: 10.1371/journal.pone.0161491
69. Zaravinos A, Lambrou GI, Boulalas I, Delakas D, Spandidos DA. Identification of common differentially expressed genes in urinary bladder cancer. PloS One (2011) 6(4):e18135. doi: 10.1371/journal.pone.0018135
70. Liu Y, Wu X, Wang G, Hu S, Zhang Y, Zhao S. CALD1, CNN1, and TAGLN identified as potential prognostic molecular markers of bladder cancer by bioinformatics analysis. Med (Baltimore) (2019) 98(2):e13847. doi: 10.1097/MD.0000000000013847
71. Frank D, Wu X, Wang G, Hu S, Zhang Y, Zhao S. Cardiac α-actin (ACTC1) gene mutation causes atrial-septal defects associated with late-onset dilated cardiomyopathy. Circ Genom Precis Med (2019) 12(8):e002491. doi: 10.1161/CIRCGEN.119.002491
72. Ohtaki S, Wanibuchi M, Kataoka-Sasaki Y, Sasaki M, Oka S, Noshiro S, et al. ACTC1 as an invasion and prognosis marker in glioma. J Neurosurg (2017) 126(2):467–75. doi: 10.3171/2016.1.JNS152075
73. Jiang J, Bi Y, Liu XP, Yu D, Yan X, Yao J, et al. To construct a ceRNA regulatory network as prognostic biomarkers for bladder cancer. J Cell Mol Med (2020) 24(9):5375–86. doi: 10.1111/jcmm.15193
74. Wanibuchi M, Ohtaki S, Ookawa S, Kataoka-Sasaki Y, Sasaki M, Oka S, et al. Actin, alpha, cardiac muscle 1 (ACTC1) knockdown inhibits the migration of glioblastoma cells in vitro. J Neurol Sci (2018) 392:117–21. doi: 10.1016/j.jns.2018.07.013
75. Chereau D, Boczkowska M, Skwarek-Maruszewska A, Fujiwara I, Hayes DB, Rebowski G, et al. Leiomodin is an actin filament nucleator in muscle cells. Science (2008) 320(5873):239–43. doi: 10.1126/science.1155313
76. Fagerberg L, Hallström BM, Oksvold P, Kampf C, Djureinovic D, Odeberg J, et al. Analysis of the human tissue-specific expression by genome-wide integration of transcriptomics and antibody-based proteomics. Mol Cell Proteomics (2014) 13(2):397–406. doi: 10.1074/mcp.M113.035600
77. Conley CA. Leiomodin and tropomodulin in smooth muscle. Am J Physiol Cell Physiol (2001) 280(6):C1645–56. doi: 10.1152/ajpcell.2001.280.6.C1645
78. Tan Y, Chen Q, Pan S, An W, Xu H, Xing Y, et al. LMOD1, an oncogene associated with Lauren classification, regulates the metastasis of gastric cancer cells through the FAK-AKT/mTOR pathway. BMC Cancer (2022) 22(1):474. doi: 10.1186/s12885-022-09541-0
79. Al Shemaili J, Mensah-Brown E, Parekh K, Thomas SA, Attoub S, Hellman B, et al. Studies on the mechanism of action of frondoside A in pancreatic cancer. Pancreatology (2013) 13(2):e13. doi: 10.1016/j.pan.2012.12.097
80. Zhao S, Zhang Y, Lu X, Ding H, Han B, Song X, et al. CDC20 regulates the cell proliferation and radiosensitivity of P53 mutant HCC cells through the Bcl-2/Bax pathway. Int J Biol Sci (2021) 17(13):3608–21. doi: 10.7150/ijbs.64003
81. Pei YF, Yin XM, Liu XQ. TOP2A induces Malignant character of pancreatic cancer through activating β-catenin signaling pathway. Biochim Biophys Acta Mol Basis Dis (2018) 1864(1):197–207. doi: 10.1016/j.bbadis.2017.10.019
82. Zhang R, Xu J, Zhao J, Bai JH. Proliferation and invasion of colon cancer cells are suppressed by knockdown of TOP2A. J Cell Biochem (2018) 119(9):7256–63. doi: 10.1002/jcb.26916
83. Du Y, Zhang X, Zhang H, Chen Y, Zhu S, Shu J, et al. Propofol modulates the proliferation, invasion and migration of bladder cancer cells through the miR−145−5p/TOP2A axis. Mol Med Rep (2021) 23(6):1–7. doi: 10.3892/mmr.2021.12078
84. Yang F, Yuan C. KNTC1 knockdown inhibits proliferation and metastases of liver cancer. 3 Biotech (2023) 13(9):309. doi: 10.1007/s13205-023-03722-9
85. Zhao J, Han SX, Ma JL, Ying X, Liu P, Li J, et al. The role of CDK1 in apoptin-induced apoptosis in hepatocellular carcinoma cells. Oncol Rep (2013) 30(1):253–9. doi: 10.3892/or.2013.2426
Keywords: Frondoside A, antitumor, integrated bioinformatical analysis, molecular docking, therapeutic target genes
Citation: Liu G, Zhang S, Lin R, Cao X and Yuan L (2023) Anti-tumor target screening of sea cucumber saponin Frondoside A: a bioinformatics and molecular docking analysis. Front. Oncol. 13:1307838. doi: 10.3389/fonc.2023.1307838
Received: 05 October 2023; Accepted: 23 November 2023;
Published: 08 December 2023.
Edited by:
Dong Joon Kim, China-US (Henan) Hormel Cancer Institute, ChinaReviewed by:
Xiaomeng Xie, China-US (Henan) Hormel Cancer Institute, ChinaCopyright © 2023 Liu, Zhang, Lin, Cao and Yuan. This is an open-access article distributed under the terms of the Creative Commons Attribution License (CC BY). The use, distribution or reproduction in other forums is permitted, provided the original author(s) and the copyright owner(s) are credited and that the original publication in this journal is cited, in accordance with accepted academic practice. No use, distribution or reproduction is permitted which does not comply with these terms.
*Correspondence: Lihong Yuan, eWxoQGdkcHUuZWR1LmNu
Disclaimer: All claims expressed in this article are solely those of the authors and do not necessarily represent those of their affiliated organizations, or those of the publisher, the editors and the reviewers. Any product that may be evaluated in this article or claim that may be made by its manufacturer is not guaranteed or endorsed by the publisher.
Research integrity at Frontiers
Learn more about the work of our research integrity team to safeguard the quality of each article we publish.