
94% of researchers rate our articles as excellent or good
Learn more about the work of our research integrity team to safeguard the quality of each article we publish.
Find out more
ORIGINAL RESEARCH article
Front. Oncol., 30 November 2023
Sec. Hematologic Malignancies
Volume 13 - 2023 | https://doi.org/10.3389/fonc.2023.1302356
This article is part of the Research TopicCytogenetics, Genomics and Epigenomics in Myelodysplastic Neoplasm and Acute Myeloid Leukemia: From Biology to TreatmentView all 6 articles
 Peng Ke1,2†
 Jundan Xie1,2†Ting Xu1,2†Meiyu Chen1,2Yusha Guo1,2Ying Wang1,2Huiying Qiu1,2Depei Wu1,2
 Zhao Zeng1,2*Suning Chen1,2*
 Xiebing Bao1,2*
Background: Satisfactory responses can be obtained for acute myeloid leukemia (AML) treated by Venetoclax (VEN)-based therapy. However, there are still quite a few AML patients (AMLs) resistant to VEN, and it is critical to understand whether VEN-resistance is regulated by senescence.
Methods: Here, we established and validated a signature for predicting AML prognosis based on VEN resistance-related senescence genes (VRSGs). In this study, 51 senescence genes were identified with VEN-resistance in AML. Using LASSO algorithms and multiple AML cohorts, a VEN-resistance senescence prognostic model (VRSP-M) was developed and validated based on 6-senescence genes.
Results: According to the median score of the signature, AMLs were classified into two subtypes. A worse prognosis and more adverse features occurred in the high-risk subtype, including older patients, non-de novo AML, poor cytogenetics, adverse risk of European LeukemiaNet (ELN) 2017 recommendation, and TP53 mutation. Patients in the high-risk subtype were mainly involved in monocyte differentiation, senescence, NADPH oxidases, and PD1 signaling pathway. The model’s risk score was significantly associated with VEN-resistance, immune features, and immunotherapy response in AML. In vitro, the IC50 values of ABT-199 (VEN) rose progressively with increasing expression of G6PD and BAG3 in AML cell lines.
Conclusions: The 6-senescence genes prognostic model has significant meaning for the prediction of VEN-resistance, guiding personalized molecularly targeted therapies, and improving AML prognosis.
Acute myeloid leukemia (AML) is one of the most common hematological malignant cancers, which is far more common in elderly patients (1, 2). Traditional chemotherapy era, elderly AML patients (AMLs) have a much poorer prognosis, with a 5-year survival rate of only 5% after the diagnosis (3). With the recent advent of molecularly targeted therapies, such as B-cell lymphoma 2 (BCL-2) inhibitor, survival of older AMLs has been improved (4, 5).
The BCL-2 protein is a key regulator of the mitochondrial apoptotic pathway and plays an important role in the survival and persistence of AML blasts (6, 7). Targeting BCL-2, Venetoclax (VEN) showed an efficient strategy to promote caspase-dependent cell death in AML (4, 8). In accordance with these studies, VEN has been approved for the treatment of newly-diagnosed elderly AMLs. VEN-based therapy can induce approximately 70% therapeutic responses in older AMLs. However, a significant minority of AMLs lack therapeutic response to initial induction or re-induction of VEN Monotherapy (9). The short duration of response and development of resistance have become major concerns. Previous studies have found that key contributing factors to VEN resistance include dependencies on alternative anti-apoptotic BCL-2 family proteins, selection of the activating kinase mutations, TP53 mutation, and BAX variants (10–14). More research is needed to explore the mechanisms of VEN resistance in AML and try to find strategies to overcome the resistance.
Senescence is the natural consequence of telomere shortening at the chromosome ends upon extensive replication, but it can also be induced by DNA damage and imbalances in cellular signaling networks (15, 16). Cellular senescence response may suppress cancer progression in vivo (17–19), but could also variously stimulate tumor progression in some conditions, as well as associated with various age-related diseases (20–22). The elimination of senescent cells can delay multiple age-related symptoms, and reduce incidences of spontaneous tumorigenesis and cancer-related mortality (23). Therefore, tumor cells can undergo senescence as an evolutionary process, including both tumor-intrinsic characteristics and extrinsic immune pressure (24, 25). However, a comprehensive understanding of the influences of senescence on VEN-resistance in AML is still lacking. In this study, we developed a VEN-resistance senescence prognostic model (VRSP-M) across multiple AML cohorts. The prognostic signature has significant meaning for the prediction of VEN-resistance, guiding personalized molecularly targeted therapies, and improving AML prognosis.
The profiles of TCGA AML (n=151) were downloaded from the website of UCSC Xena (https://gdc.xenahubs.net) and exploited to build a prognostic signature for AML based on VRSGs (VEN resistance-related senescence genes). Human-related senescence genes (HRSGs, n=279, Supplementary Table S1) were acquired from the HAGR website (https://genomics.senescence.info/cells/). Ex vivo data from Beat AML cohort (26) was used to identify VRSGs and a total of 343 AMLs were enrolled to validate the relationship between prognostic signature and clinical manifestation. To test the applicability, we further verified the effects of a predictive model in non-APL (acute promyelocytic leukemia) AML (GSE106291, n=250) and normal karyotype AML (GSE71014, n=104). The inclusion criteria of Beat AML contained: expression profiles at time of the initial diagnosis, complete data of survival and ELN stratification, but excluding duplicated cases. For other three datasets, all patients with survival and expressed information were included in this study. All the data used in this study were obtained from the public program, and all processes complied with the publication guidelines. Therefore, ethical approval of local ethics committees is not required.
From the drug response of beat AML in Ex vivo, samples with the lowest 20% of area-under-the-curve values (AUCs) were deemed to be sensitive to VEN, while those with the highest 20% AUCs were considered as VEN-resistance. A total of 3023 differential expression genes (DEGs) were identified between VEN-resistant and -sensitive samples through the DEseq2 method (|log2FC| ≥1.0 and adjusted P value < 0.05, Supplementary Table S2). The intersections of DEGs with HRSGs were identified as VRSGs (n=51).
According to the median expressed levels of VRSGs and univariate Cox analysis, 18 of 51 VRSGs were proved to be associated with AML prognosis in the modeling set (Supplementary Table S3, P<0.05). Of 18 VRSGs, the Least Absolute Shrinkage and Selection Operator (LASSO) algorithm was performed to screen the optimal senescence genes to develop VRSP-M in TCGA-AML through “glmnet” R packet. A 10-fold cross-validation method was employed to hold stability, and the minimum criteria was chosen as the optimal penalty value (λ) (set.seed, 2021). The risk score was calculated using the expression of model’s genes as follows:
To evaluate and validate VRSP-M in the modeling and validation datasets, AMLs could be divided into high- and low-risk subtypes according to the median score. Survival analyses were applied to distinguish the difference between these two groups by “survival” package. Curves of receiver operating characteristic (ROC) and AUCs were used to assess the accuracy of the prognostic model using the “timeROC” package. Then Beat AML and GSE106291 were combined after removing batch effects by the “SVA” package. A subset containing 80% samples of the combined dataset was re-sampled 100 times and used to examine the robustness of the VRSP-M for predicting OS of AML patients.
A previous study demonstrated that a monocytic clone of AML could confer VEN-resistance (27), so its markers were obtained to assess the enrichment of monocyte differentiation. Moreover, the SenMayo set (28) was also used to estimate the degree of enrichment in the senescence pathway. Therefore, four gene sets were acquired to inquire into the biological function of VRSP-M, including c2.cp.kegg.v7.5.1.symbols.gmt, c2.cp.reactome.v7.5.1.symbols.gmt, monocyte differentiation (Supplementary Table S4), and the SenMayo gene set (Supplementary Table S5). A value of false discovery rate (FDR) < 0.05, adjusted P < 0.05, and |NES| (normalized enrichment score) >1.5 were considered as significant enrichment in gene set enrichment analysis (GSEA).
Using the “GSVA” and “GSEABase” R packages, the different components of immune cells between the high- and low-risk subtypes were reckoned and compared using single-sample gene set enrichment analysis (ssGSEA). The gene set was collected from the previous study (29), containing 28 types of immune cells. Then xCell (30) and ESTIMATE (31) algorithms were further utilized to impute the weights of M2 macrophages, immune and stromal score, respectively.
The correlation with Spearman method was performed to check the link between the risk score of VRSP-M and eight immune checkpoints (SIGLEC15, TIGIT, CD274, HAVCR2, PDCD1, CTLA4, LAG3, and PDCD1LG2). We also predicted whether high-risk subtype could benefit from blockade therapy of immune checkpoints using the algorithm of Tumor Immune Dysfunction and Exclusion (TIDE) (32).
Using one dataset of CRISPR-Cas9 screens (GSE216087) (33), we checked whether model’s VRSGs dysregulated in AML cells after single-VEN treatment. When sgRNAs depleted significantly on OCI-AML2 cells after VEN treatment, it meant that knockdown of these genes increased sensitivity to VEN, and high expression of these genes could decrease sensitivity to VEN and contribute to resistance.
To identify which model’s VRSGs could be an effective biomarker of VEN-resistance, we first applied ABT-199 (venetoclax) to search molecular biomarkers of treatment response to VEN using a software of computational analysis of resistance (CARE) (34), the score of which indicates the correlation between gene alteration and drug efficacy. A higher positive score suggests better drug response, while a negative score demonstrates drug resistance. Furthermore, we also got data on CRISPR loss-of-function from previous VEN-resistance research (13). The negatively selected gene indicated that higher expression confers resistance to VEN. Then we verified in vitro.
AML cell lines, including HL-60, MOLM13, MV4-11, THP-1 OCI-AML3, and K562, were purchased from the American Type Culture Collection (Manassas, United States). All of them were cultured in RPMI 1640 with 10% FBS (Gibco, United States) as well as antibiotics (1% penicillin-streptomycin). All cells were kept at 37°C in an incubator with 5% CO2.
The total RNA was extracted using RNA Isolator Total RNA Extraction Reagent (R401-01, Vazyme, China), and reverse transcribed to cDNAs using the PrimeScript™ RT Master Kit (RR036A, Takara, Japan). Quantitative real-time PCR (qRT-PCR) was performed using 2x SYBR Green qPCR Master Mix (B21202, Bimake, United States) with 7500 real-time PCR system (Applied Biosystems, United States). The sequences of gene-specific primers are summarized in Supplementary Table S6. Gene expression levels were quantified with the 2-ΔCt method and GAPDH was used as endogenous control.
Protein preparation and western blot assay were performed as described previously (35). BAG3 Ab (sc-136467, United States) was purchased from Santa Cruz Biotechnology, and GAPDH Ab (ab8245, United States) was obtained from Abcam. G6PD Ab (AF6945, China) and secondary Abs, such as HRP goat anti-mouse IgG (A0216, China) and goat anti-rabbit IgG (A0208, China), were bought from Beyotime Biotechnology.
The cytotoxic effects of ABT-199 on AML cell lines were determined by a Cell Counting Kit-8 (CCK-8; B34304, Bimake, United States) assay. ABT-199 was diluted in 100 µl of growth medium to designated doses, and leukemia cells were added to the 96-well plate (1×10⁴ cells per well in 100 µl). Cultured leukemia cells were incubated in the presence of the drug for 48 hours at 37°C in a humidified 5% CO2-95% air incubator. Then, 10 μL of the CCK-8 reagent was added into each well, and optical densities at the wavelength of 450 nm were measured using the Synergy HTX Multimode Reader (BioTek, United States). The percentage of surviving cells was calculated according to the absorbance ratio of the test well and control well. IC50 values were calculated and visualized using GraphPad Prism software v9.0 (GraphPad, La Jolla, CA) based on the percent of live cells.
Categorical variables were compared by Chi-square or Fisher’s exact test, and continuous variables were checked using the non-parametric test. Survival differences were quantified through the log-rank method or Cox regression analysis, and visualized using Kaplan-Meier curves. All analyses were conducted using the statistical software R (version 4.1) (http://www.R-project.org). The P-value of two-sided was set at the 0.05 significance level.
The flow chart is presented in Figure 1. A total of 3023 DEGs were found differently between VEN-sensitivity and -resistance (Figure 2A). Fifty-one genes were identified as VRSGs (Figure 2B), and 18 of which were verified with AML prognosis (Figure 2C). Through the LASSO method, 6 of 18 prognosis-related VRSGs were selected to construct VRSP-M to predict overall survival (OS) in TCGA AML (Figures 3A, B). The risk score of each patient was determined based on the following formula (EXP indicated the expression of each gene):
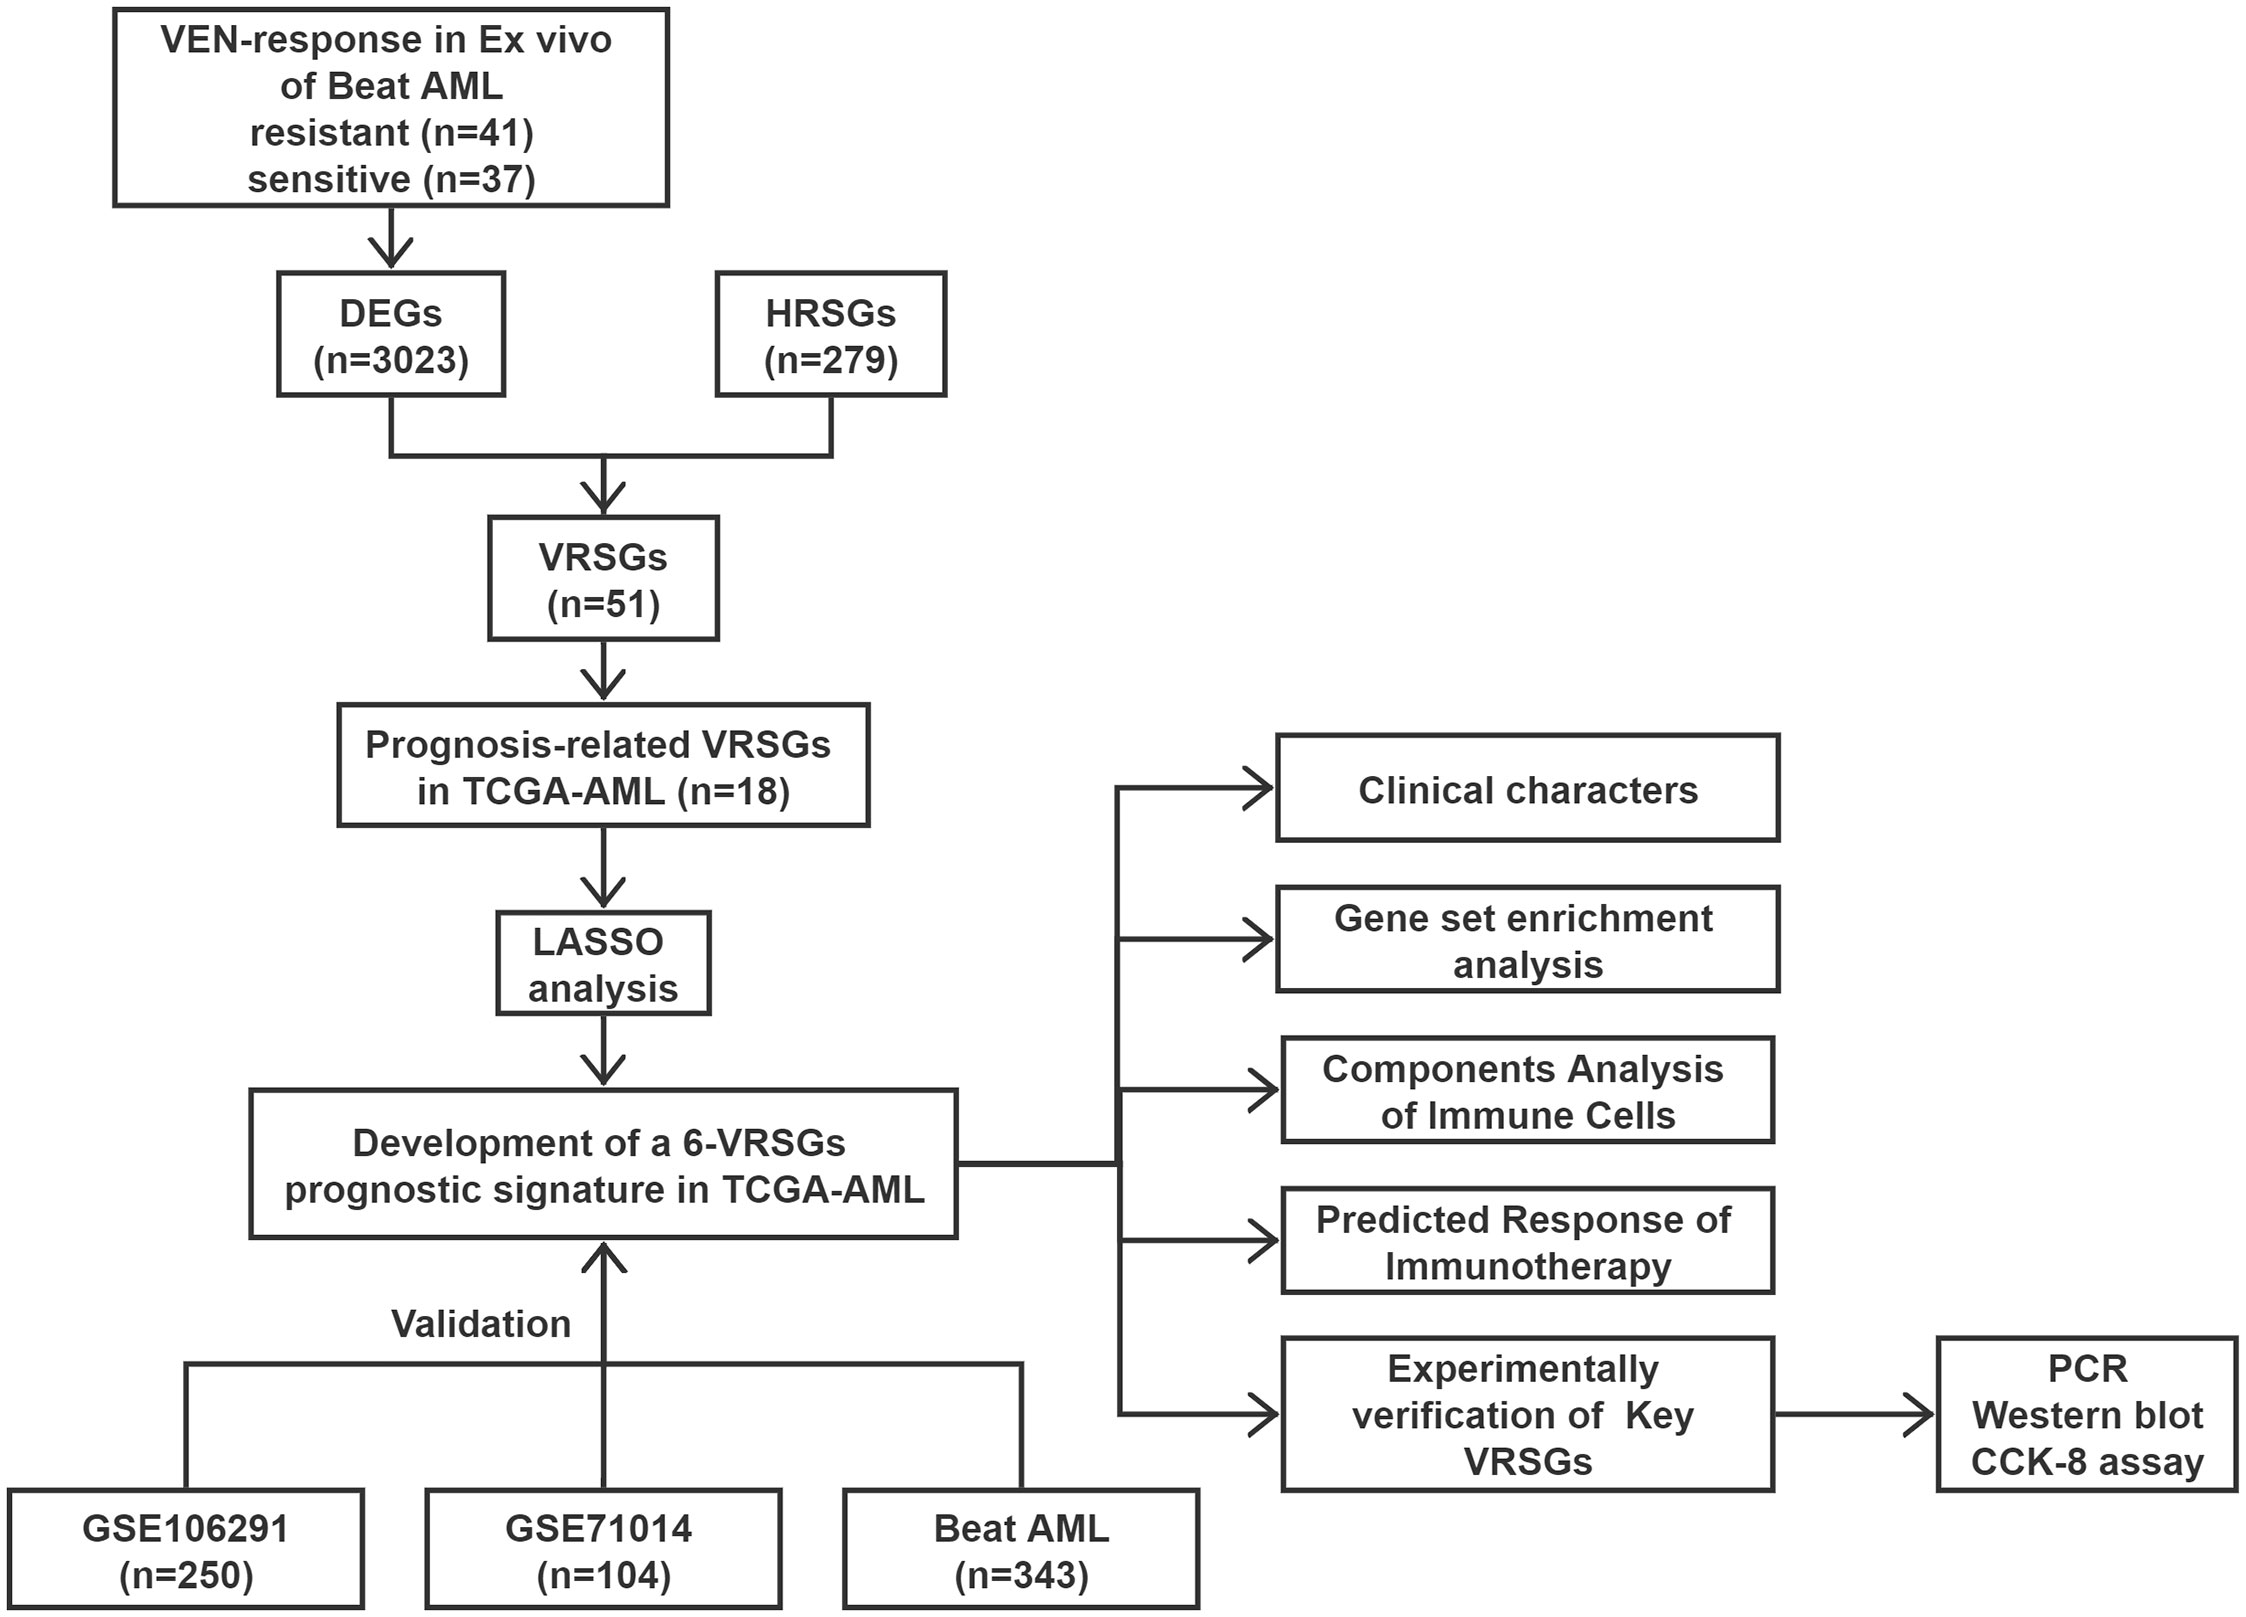
Figure 1 Work flow of the current study.
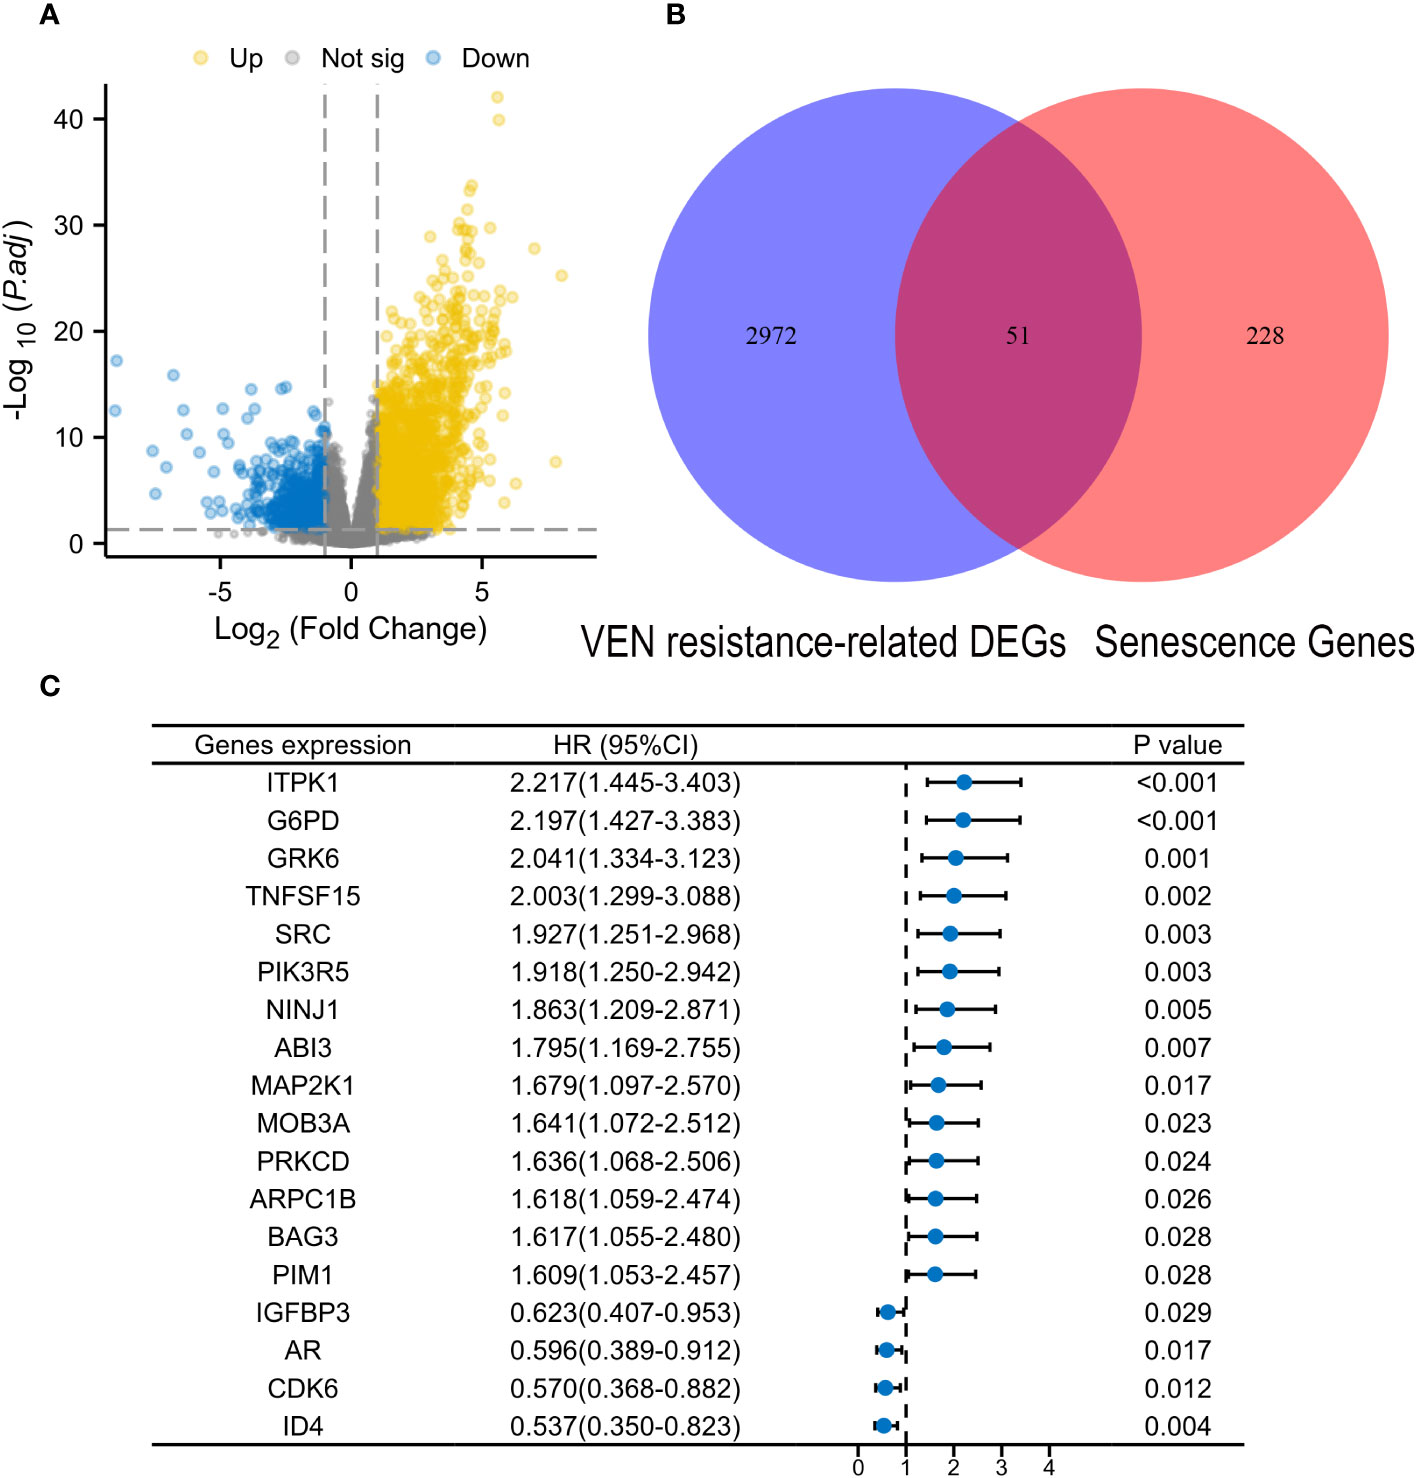
Figure 2 Identification of Venetoclax (VEN) resistance-related senescence genes (VRSGs). (A) Volcano map of differential expression genes (DEGs) between VEN-resistant and -sensitive samples through DEseq2 method. (B) Intersections of VEN-resistant related DEGs and Human related senescence genes (HRSGs). (C) Eighteen VRSGs were confirmed with AML prognosis in the modeling set using univariate Cox regression analysis.
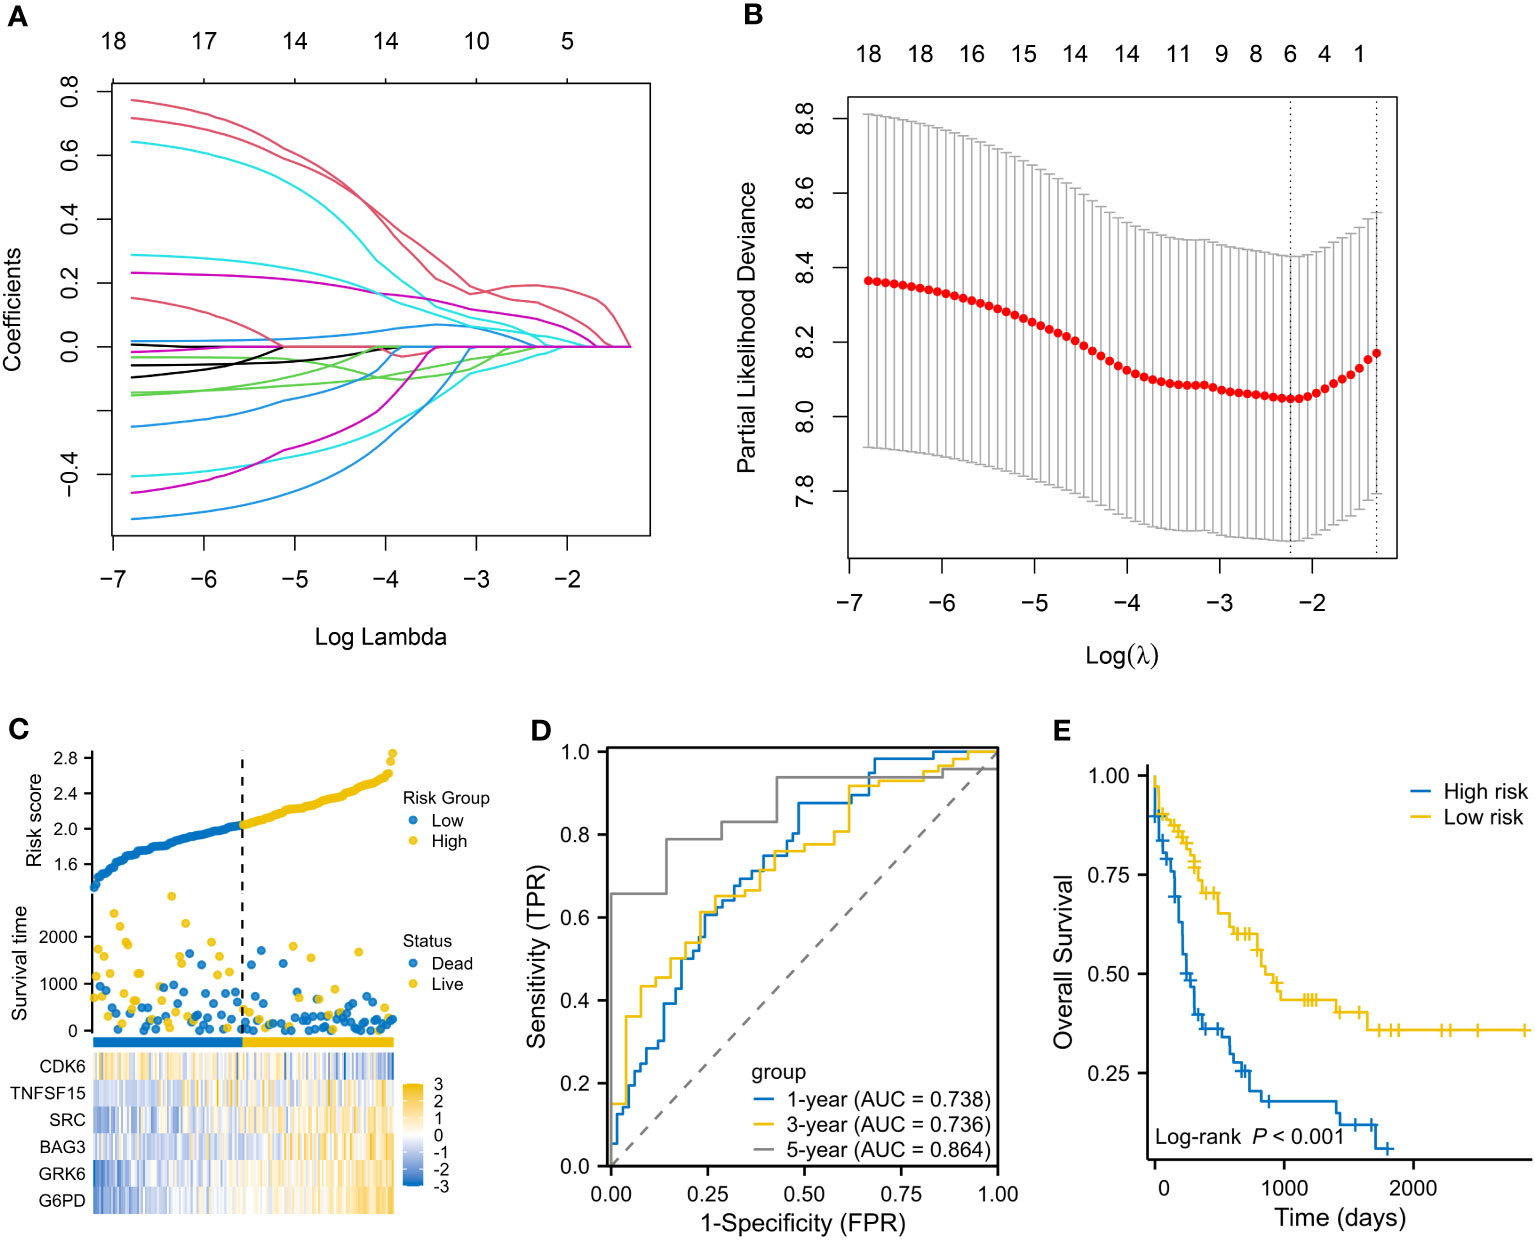
Figure 3 Establishment of a VEN-resistance senescence prognostic model (VRSP-M). (A, B) Selecting key genes of the eighteen VRSGs for constructing VRSP-M using LASSO (least absolute shrinkage and selection operator) analysis. (C) The distribution of risk score, survival status and heatmap of 6-VRSGs in VRSP-M. (D) Curves of ROC (receiver operator characteristic) based on the VRSP-M in the modeling set. AUC, the area under the curve. (E) Curve of overall survival (OS) analysis with Kaplan-Meier method in the modeling set.
The distribution of risk score, survival status, and expression of 6-VRSGs are shown in Figure 3C. Associated with the elevated risk scores, mortality risk increased, while the survival time decreased. AUCs at 1, 3, and 5 years were 0.738, 0.736, and 0.864 (Figure 3D), which indicates that VRSP-M had better accuracy than random choice. Moreover, AMLs with high-risk scores presented a worse OS (P < 0.001, Figure 3E).
Table 1 summarizes the clinical characteristics in high- and low-risk subtypes in TCGA-AML. AMLs with high risk were older than those in the low-risk subtype, with median ages of 62 and 51 years respectively (Figure 4A, P < 0.001). More AMLs with intermediate or poor cytogenetic risk were located in the high-risk subtype (Figure 4B, P<0.001). In the distribution of the French-American-British (FAB) subtype, M5 possessed the highest risk score, while M3 had the lowest score (Figure 4C). Furthermore, GSEA analysis also confirmed the enrichment of monocyte differentiation for the high-risk subtype (Figure 4D, NES = 2.475).
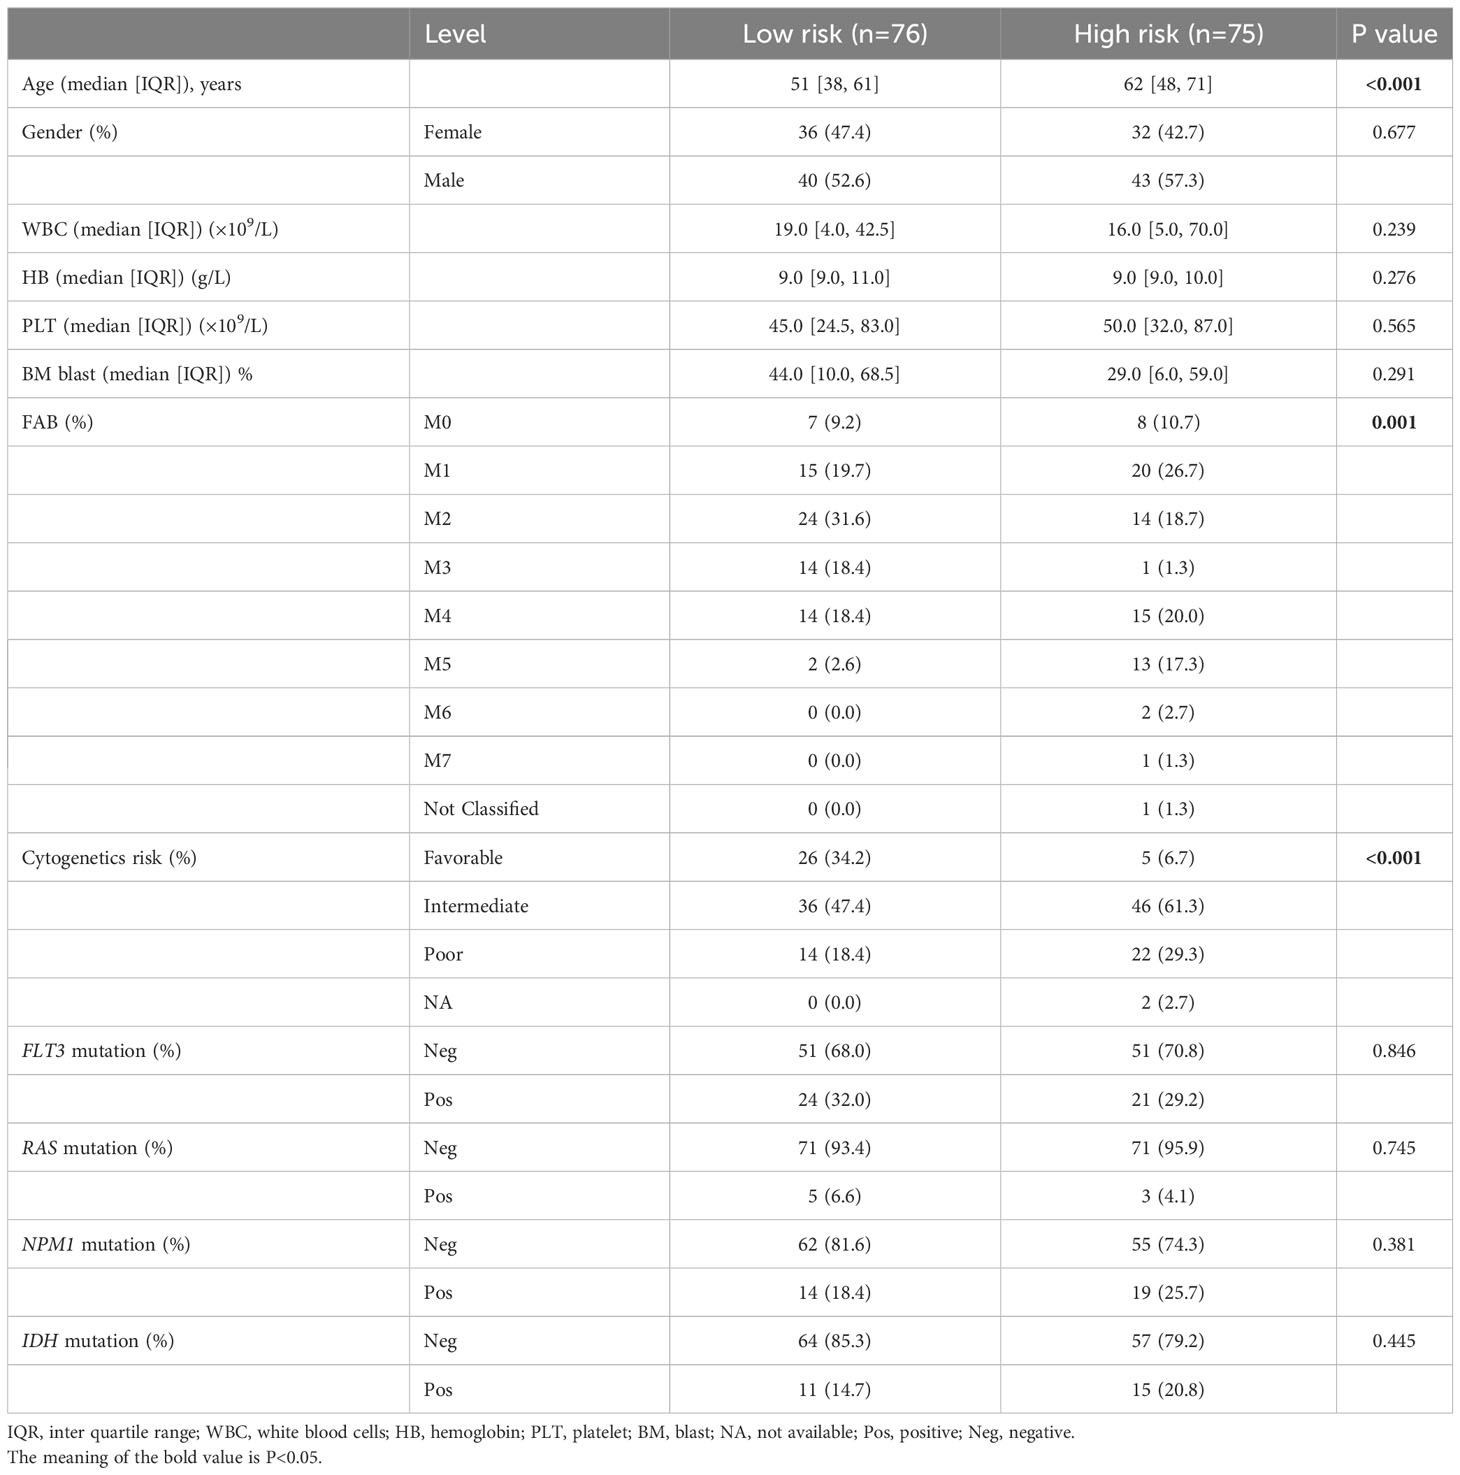
Table 1 Clinical characteristics of AML patients in TCGA cohort.
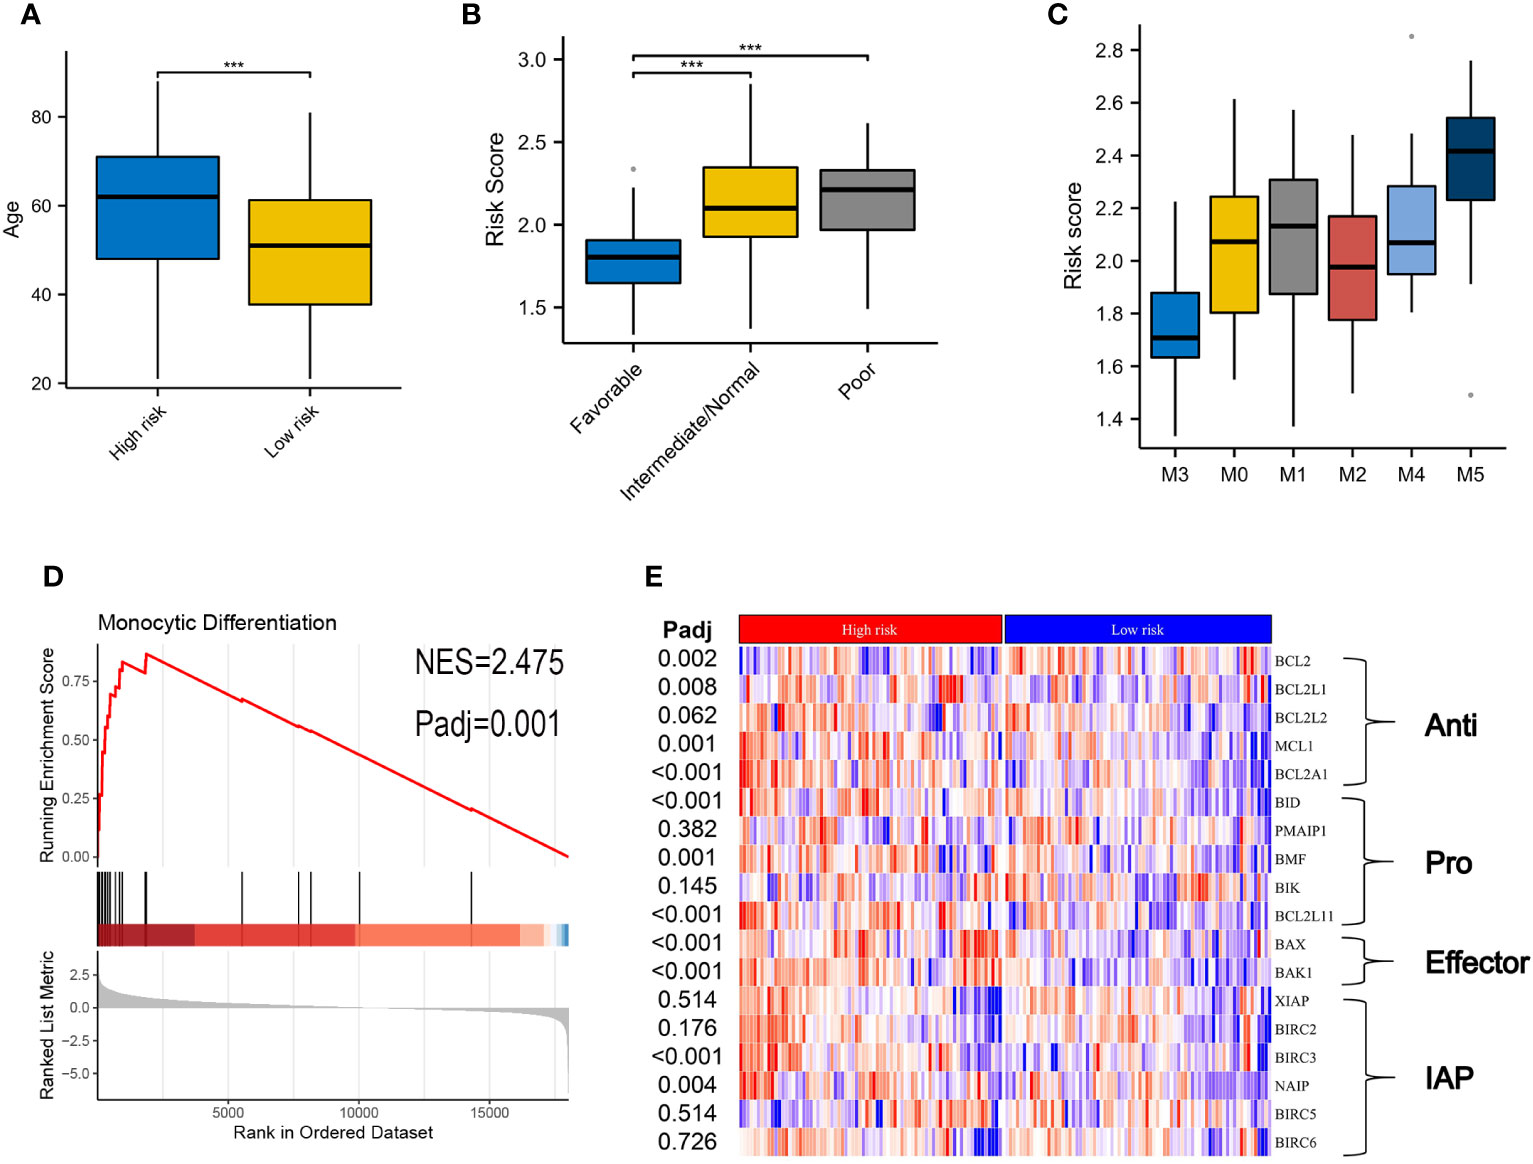
Figure 4 Correlation of clinical features and VRSP-M in the modeling set. (A) Difference of age distribution between high- and low-risk subtypes based on VRSP-M. (B, C) Distribution of risk score between different risk of cytogenetics and French-American-British (FAB) subtype, including M0, M1, M2, M3, M4 and M5. *** indicate P<0.001. (D) Curve of gene set enrichment analysis (GSEA) between high- and low-risk subtypes in monocyte differentiation. (E) Coexpression of key genes in apoptosis pathways, the difference was compared by non-parametric test. IAP, inhibitor of apoptosis proteins.
The different expressions of key genes in apoptosis pathways may help to explain why the high-risk subtype was more likely to be resistant to VEN (Figure 4E). The BCL2 expression in the high-risk subtype was significantly lower than that in the low-risk subtype, but opposite results occurred in the expression of BCL2L1, BCL2A1, and MCL1. In addition, although the high-risk subtype possessed a high expression of pro-apoptotic genes (BID, BMF, BCL2L11) and apoptosis receptor (BAX, BAK1), the inhibitor of apoptotic genes (BIRC3, NAIP) was also higher in high-risk subtype than those in the low-risk group (adjusted P < 0.05).
Three AML cohorts were used to verify the performance of 6-genes VRSP-M. In the Beat AML cohort, the clinical features are depicted in Table 2. A higher proportion of M5 subtype, non-de novo AML, and adverse risk of ELN recommendation was presented in AMLs with high-risk scores (P < 0.05). When taking genetic mutations into account, patients with no mutation data were excluded from the analysis. AMLs with high-risk scores were frequently accompanied by mutations of DNMT3A (P = 0.005), NRAS (P = 0.007), KARS (P = 0.066), and TP53 (P = 0.040), while the proportion of FLT3-ITD mutation in low-risk subtype was significantly higher than that in high-risk subtype (P = 0.002).
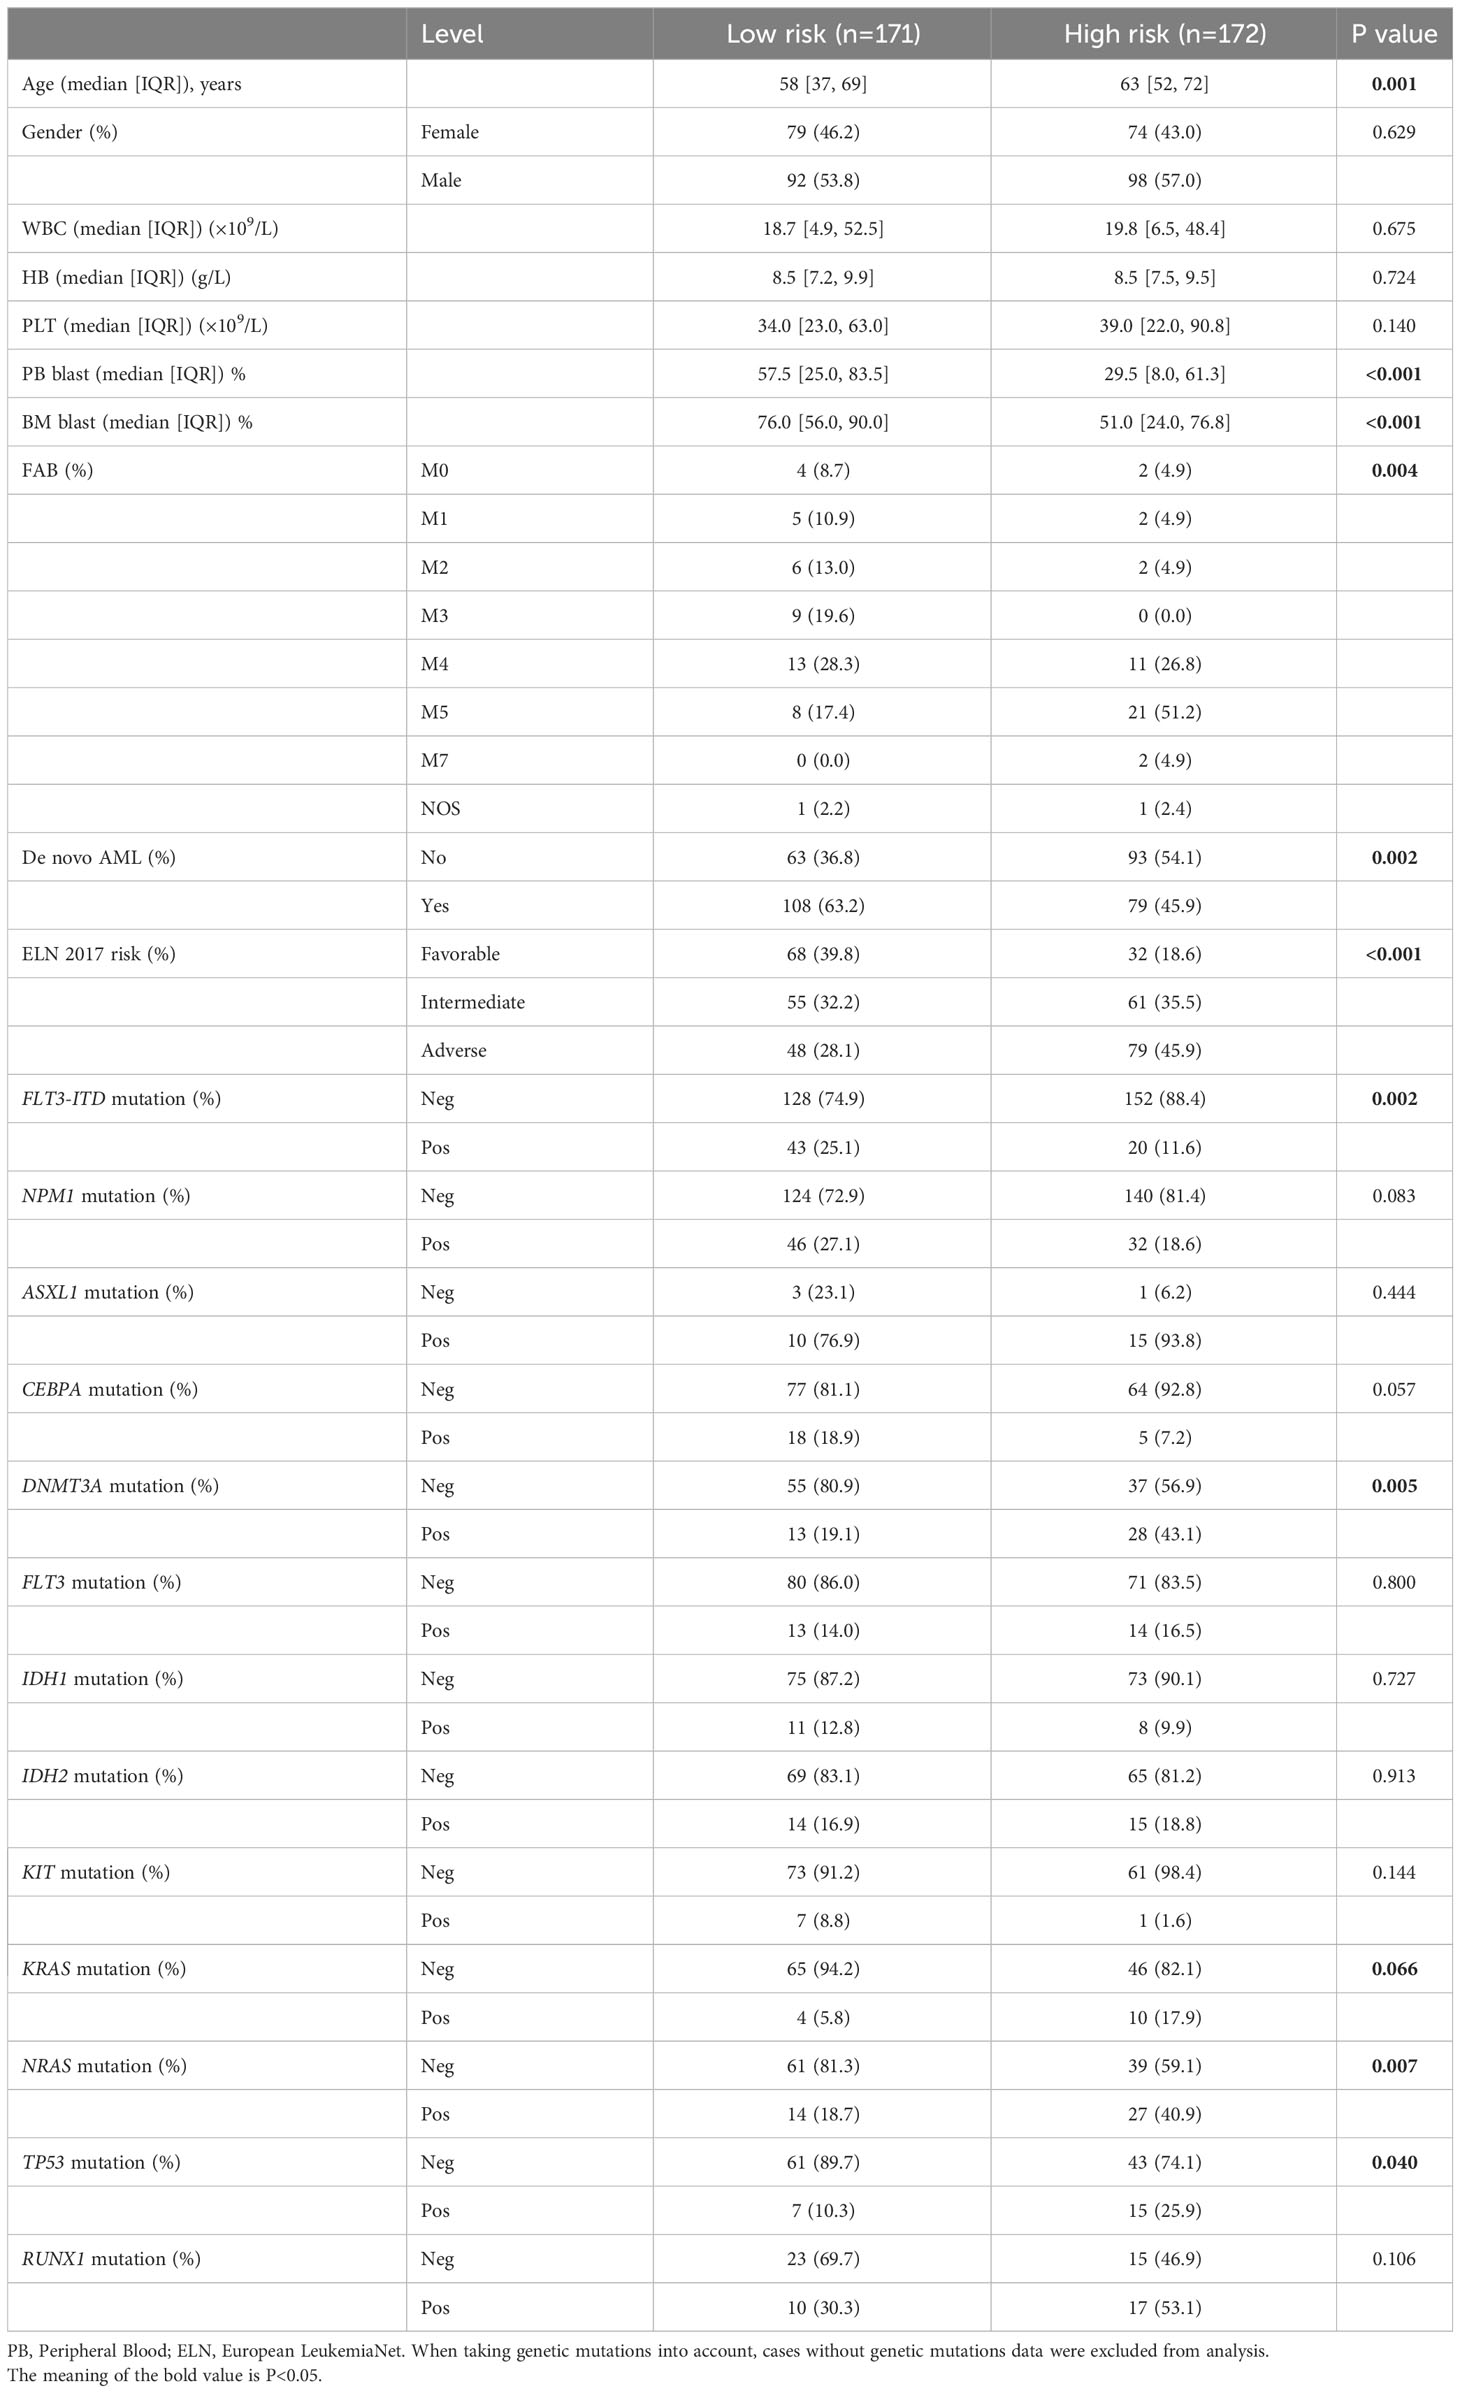
Table 2 Clinical characteristics of AML patients in Beat cohort.
Consistent with the results in the modeling set, as risk scores increased, death risk also went up in three validation cohorts (Figures 5A–C). A worse OS was confirmed for the high-risk subtype (Figures 5D–F), and the VRSP-M also had the ability to predict AML prognosis (Figures 5G–I). Similarly, patients with high-risk scores were mainly involved in monocyte differentiation (Figures 5J–L). Leukemia heterogeneity may limit the practicability of prognostic signatures. Thus, we combined Beat AML and GSE106291 after removing batch effects by the SVA package. To check the robustness of this 6-genes prognostic signature, a total of 100 re-sampling tests were conducted randomly in 80% samples of the combined dataset. The results indicated that the P values were less than 0.05 in each Kaplan-Meier and univariate Cox analysis (Table S7), indicating a high performance for OS prediction in AML.
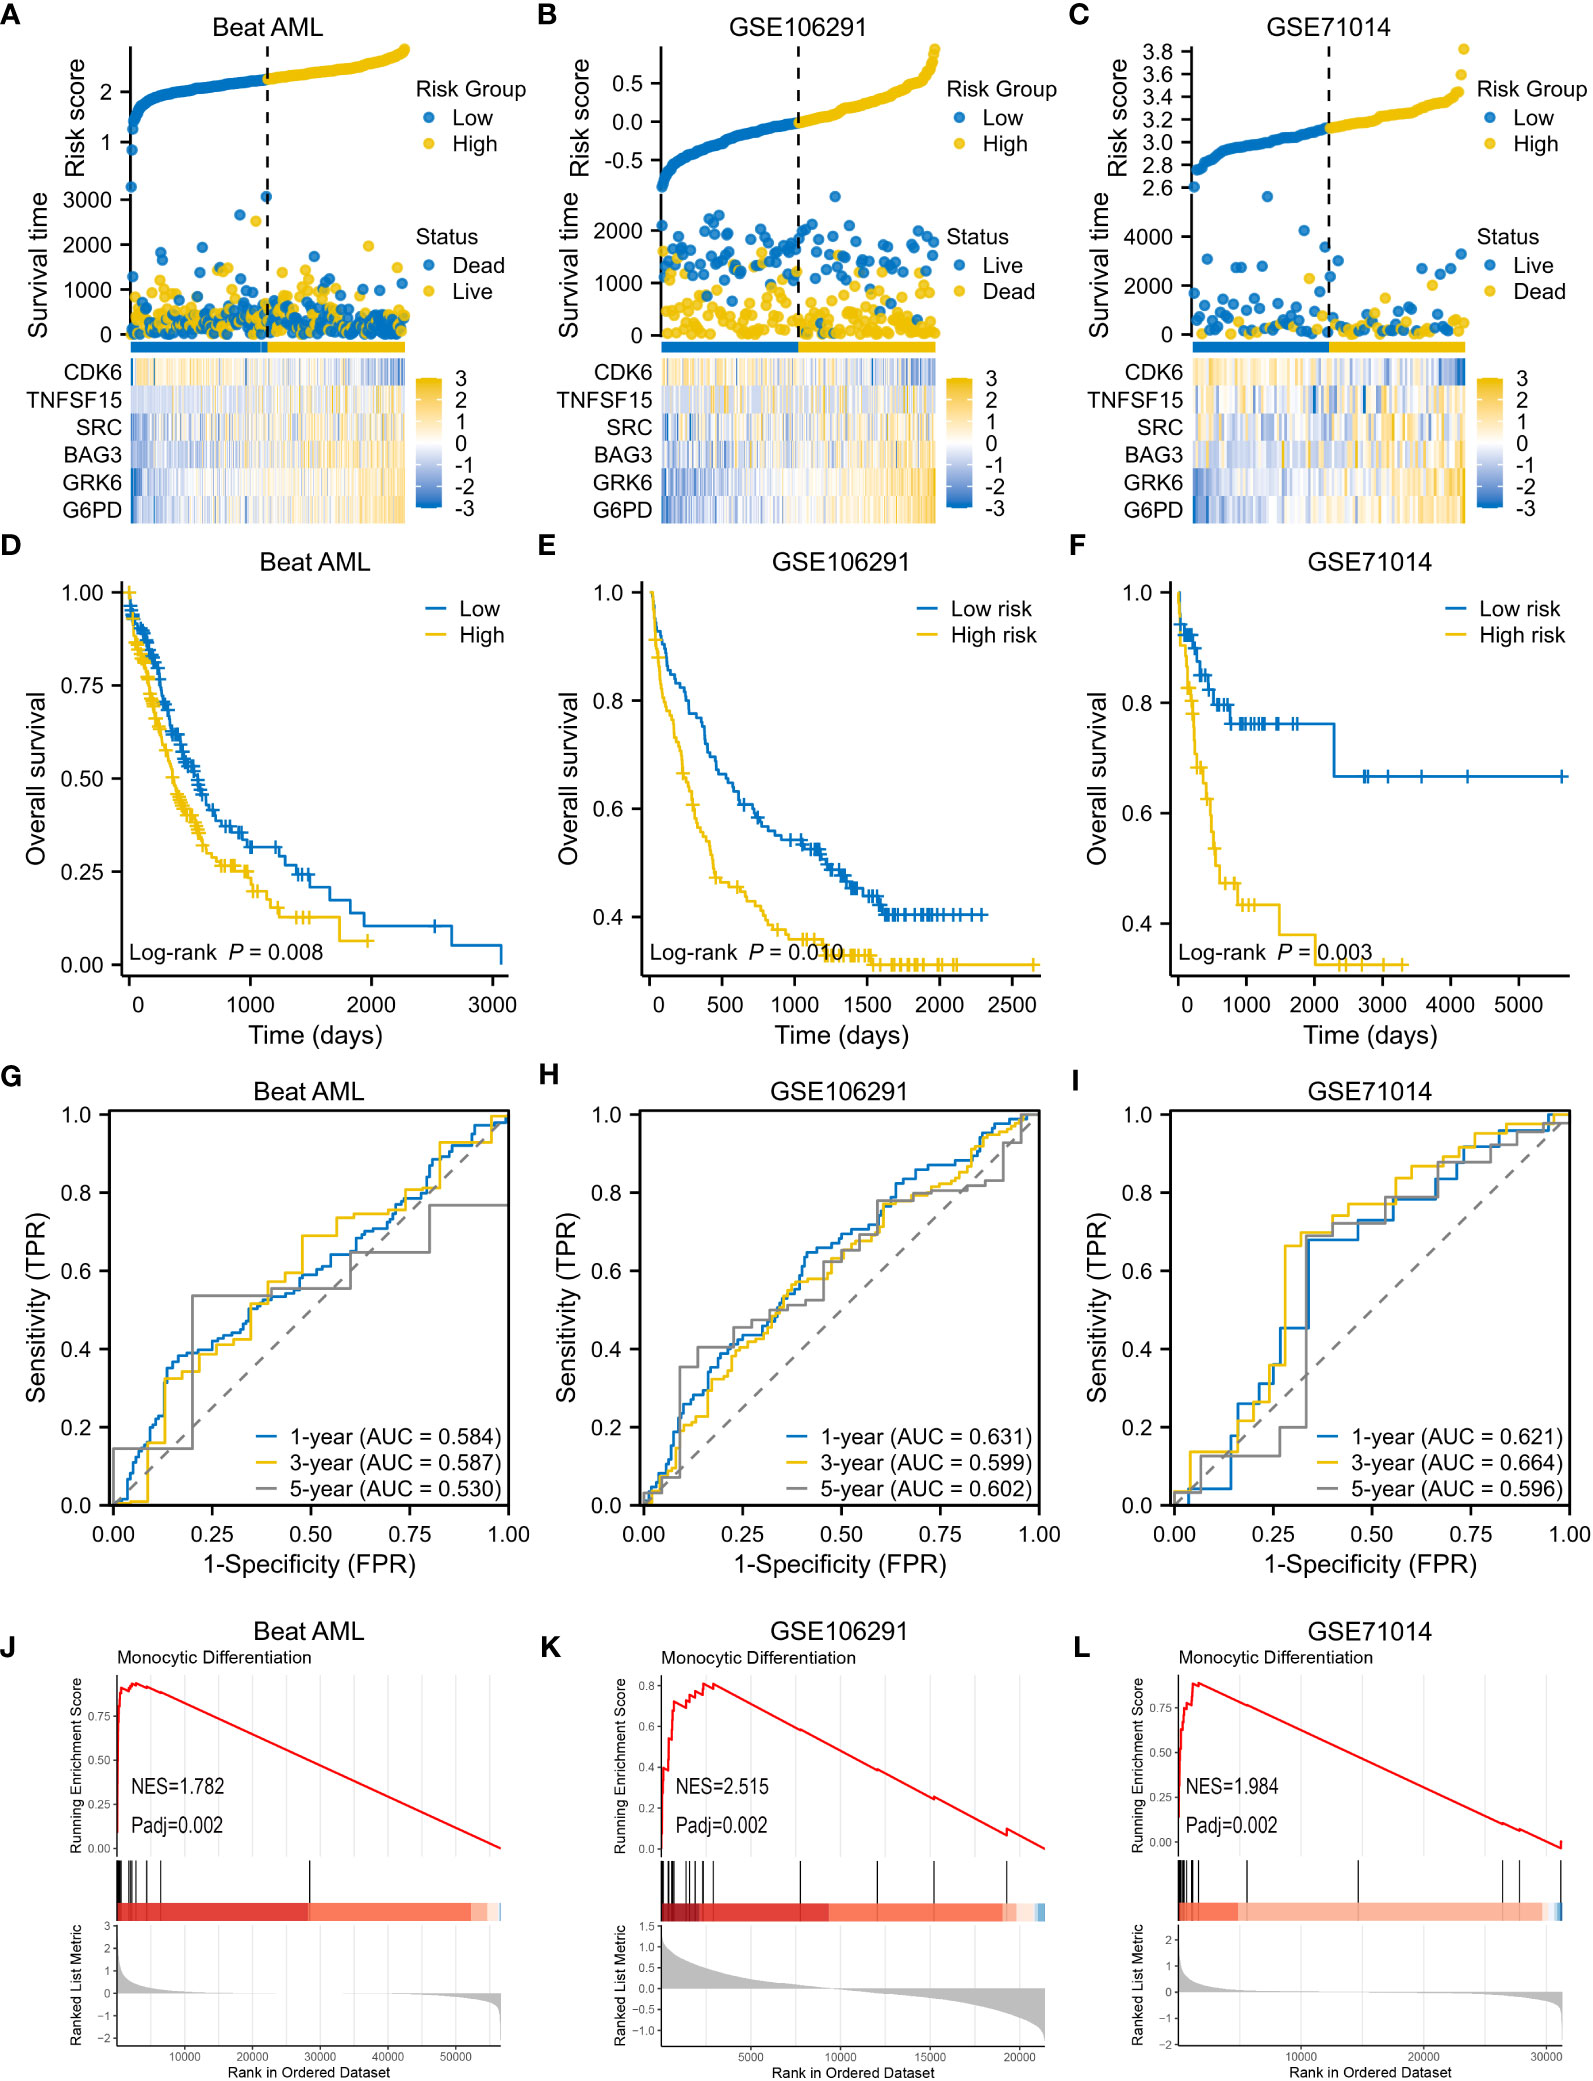
Figure 5 Validation of VRSP-M in three independent AML cohorts. (A–C) The distribution of risk score, survival status and heatmap of 6-VRSGs in three validation sets. (D–F) Curves of survival analysis in Beat AML, GSE106291, and GSE71014. (G–I) Curves of ROC analysis in Beat AML, GSE106291, and GSE71014. (J–L) GSEA analysis of monocyte differentiation between high- and low-risk subtypes.
GSEA analyses were performed to better investigate the potential function of VRSP-M. The high-risk subtype was highly enriched in the senescence pathway (Figure 6A). KEGG results revealed that high-risk subtype enriched in Lysosome, Hematopoietic cell lineage, Cell adhesion molecules, and many immune-related pathways, such as cytotoxicity mediated by natural killer cell, interaction of cytokine and cytokine receptor, chemokine and T cell receptor signaling pathway (Figure 6B). Moreover, the main items of Reactome analysis were interactions between lymphoid and non-lymphoid cell, NADPH oxidases, interleukin 10 and PD1 signaling (Figure 6C).
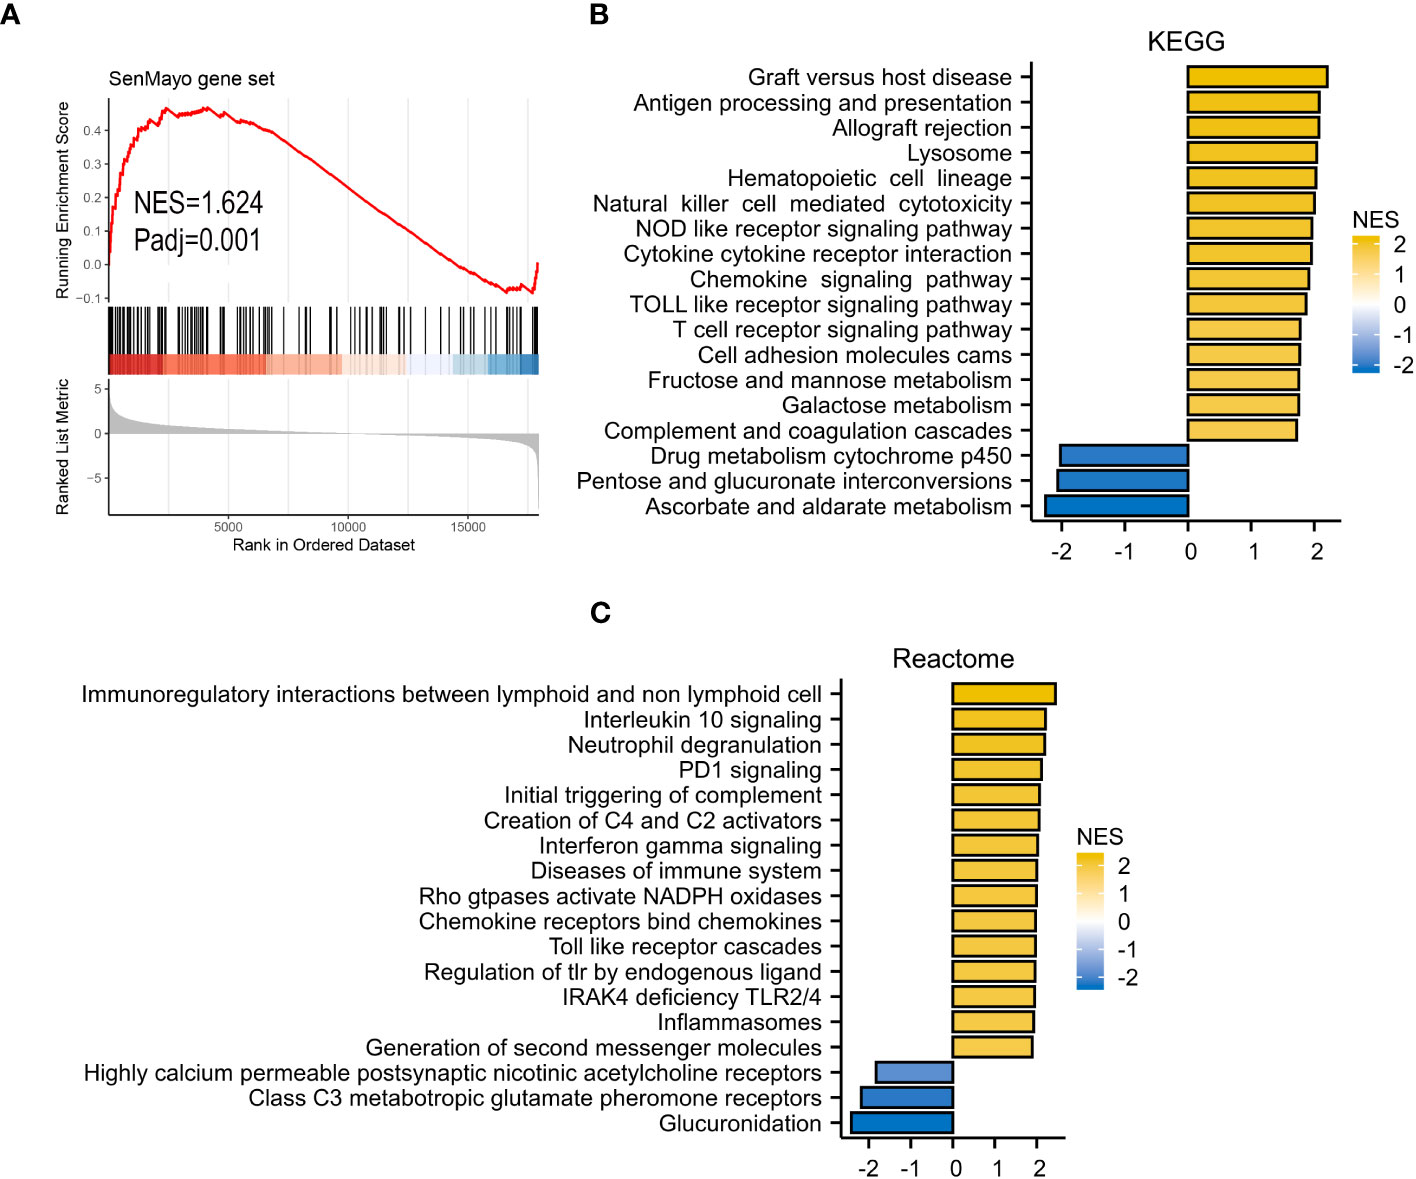
Figure 6 GSEA analysis. (A) SenMayo gene set. (B), KEGG (Kyoto Encyclopedia of Genes and Genomes) gene set. (C) Reactome gene set.
Many enriched items of immune-related pathways prompted us to explore the immune features associated with VRSP-M. We found that patients with high-risk score were often accompanied with a higher immune cell infiltration, including various subtypes of immune activated and immunosuppressive cells (Figure 7A). The high-risk AMLs both had a higher immune and stromal score (Figure 7B). In addition, as well as Myeloid-derived suppressor cells (MDSCs) (Figure 7A), a higher proportion of M2 macrophage cells was also observed in patients with high-risk score (Figure 7C).
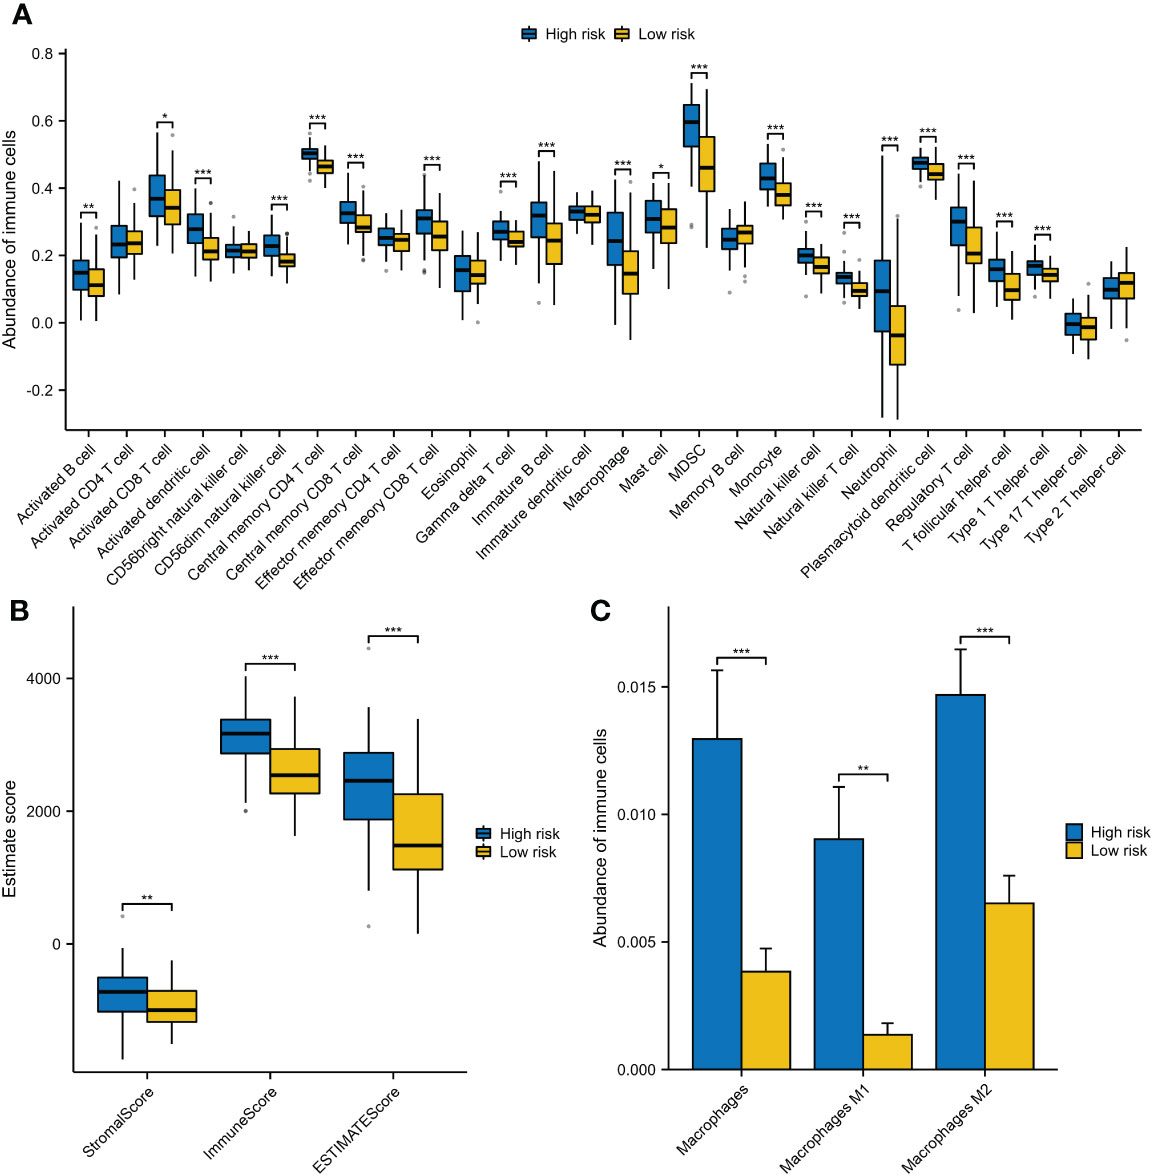
Figure 7 The different components of immune cells between high- and low-risk subtypes of VRSP-M. (A) The difference of 28 types of immune cells, evaluating by single-sample gene set enrichment analysis (ssGSEA). (B) The difference of immune and stromal score, calculated by ESTIMATE method. (C) Subtypes of macrophages between high- and low-risk AMLs, estimated by xCell algorithm. * indicate P<0.05, ** indicate P<0.01, *** indicate P<0.001.
On account of the above discoveries, we speculated that PD1 plays a vital role in VRSP-M. The results showed that the risk score of the VRSP-M was positively correlated with CTLA4 (R=0.402), PDCD1 (R=0.398), HAVCR2 (R=0.328), PDCD1LG2 (R=0.283), CD274 (R=0.281), LAG3 (R=0.324), and T cell dysfunction (R=0.551), but negatively related with TIDE score (R= -0.489) and T cell exclusion (R= -0.491) (Figures 8A–D, P < 0.001). With a lower TIDE score (Figure 8E, P < 0.001), the high-risk subtype had a higher number of responders from immunotherapy (53.3% vs. 21.1%, P < 0.001) (Figure 8F). According to the expression of PDCD1 and VRSP-M’s risk score, AMLs were divided into four groups. Patients both with a high level of risk score and PDCD1 presented a worse prognosis (Figure 8G, P < 0.001). These results indicated that patients with high-risk scores may benefit from the blocking therapy of immune checkpoints.
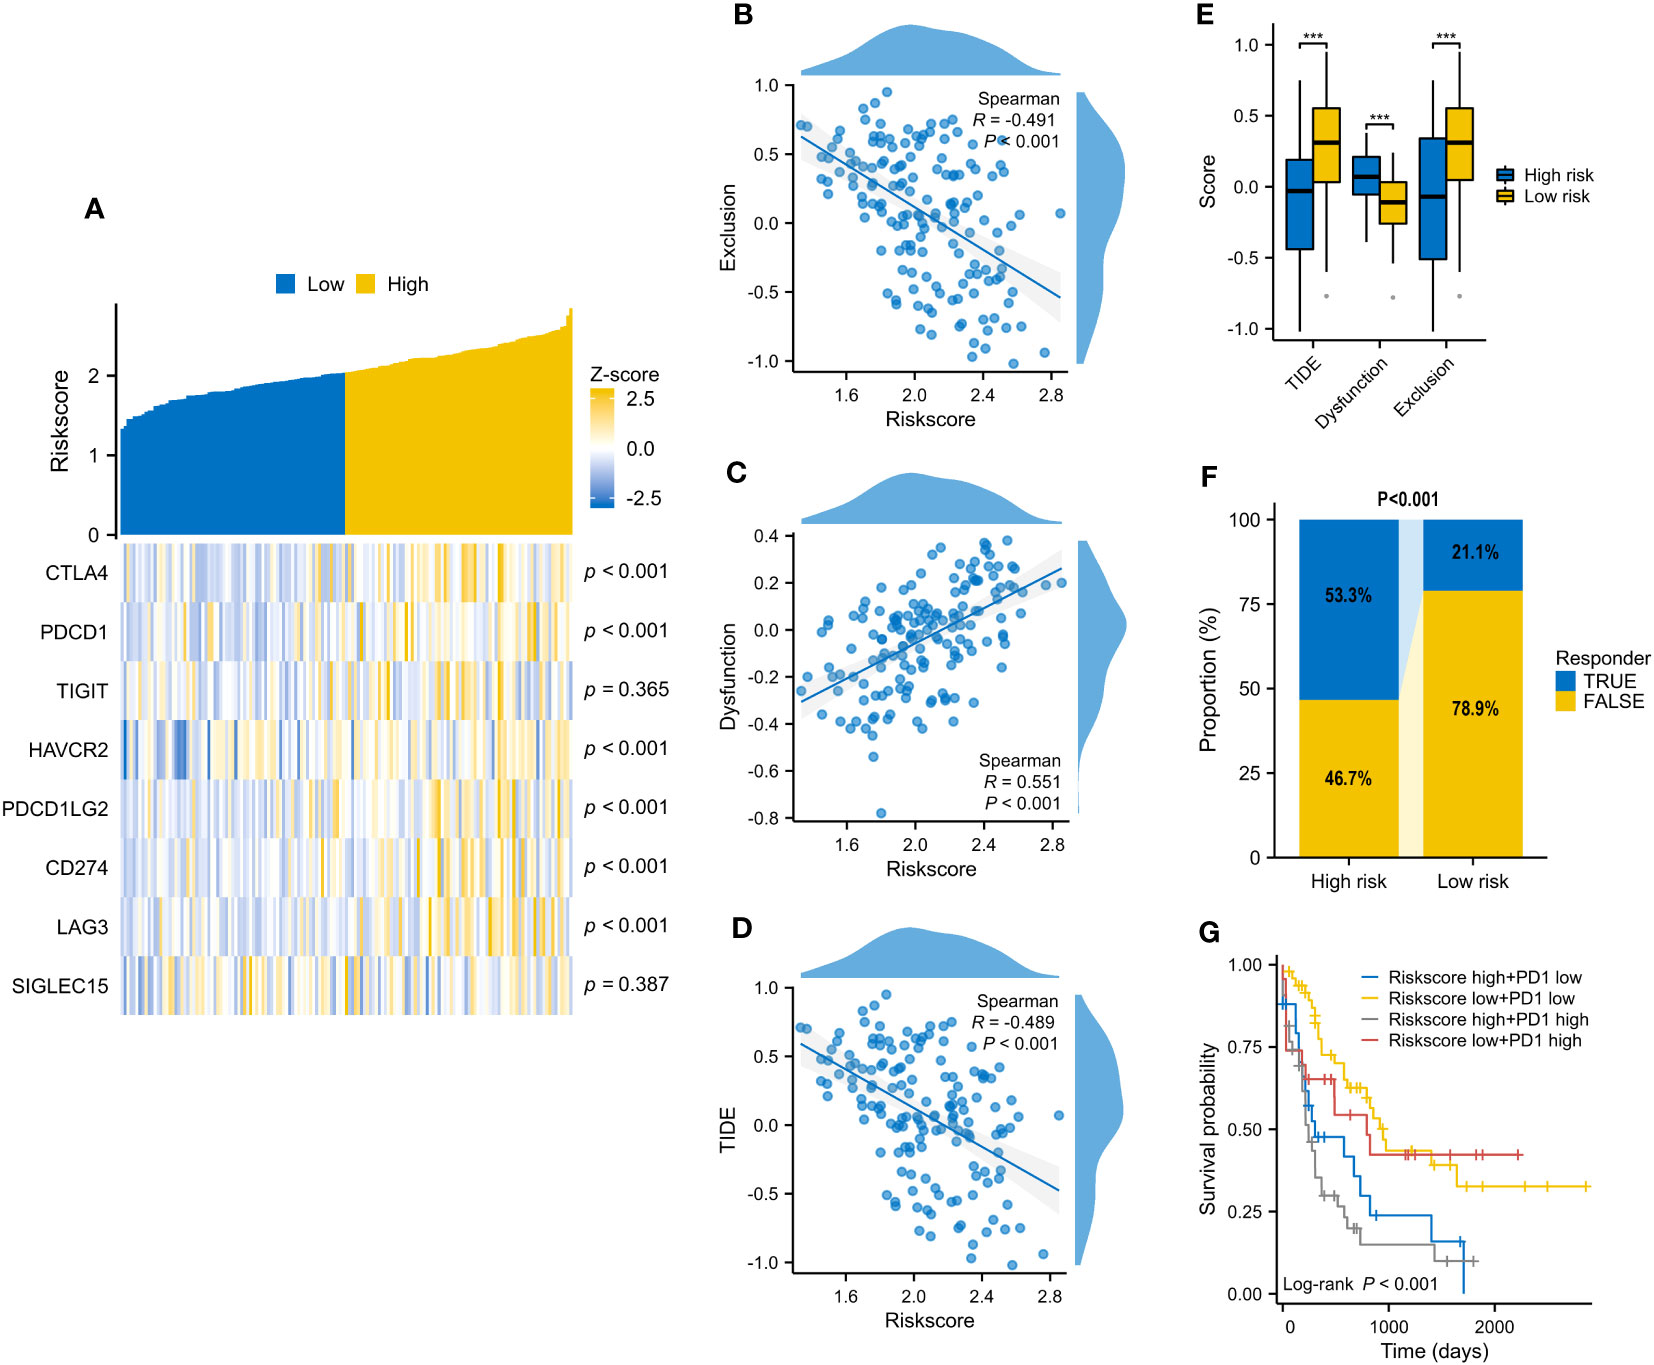
Figure 8 The correlation of VRSP-M’s risk score with 8 immune checkpoints and predicted response of immunotherapy. (A–D) The relationship of VRSP-M’s risk score with expression of 8 immune checkpoints, Exclusion, Dysfunction, and TIDE score, tested by Spearman method. (E, F) The difference of Exclusion, Dysfunction, TIDE score, and predicted response of immunotherapy between high- and low-risk subtypes. (G) Survival analysis of classification based on PDCD1 expression and VRSP-M’s risk score. *** indicate P<0.001.
In this signature, five senescence genes (except CDK6) were positively associated with higher VRSP-M scores. We then checked whether these five genes were dysregulated in AML cells using another dataset of CRISPR-Cas9 screens (GSE216087). The results indicated that four sgRNAs (except GRK6) were depleted significantly on OCI-AML2 cells after single-VEN treatment (Figure S1), suggesting that overexpression of these genes could confer VEN-resistance.
In ex vivo data from the Beat AML sample, the risk score was proved to be positively associated with VEN-resistance (Figures 9A, B). Using CARE software, 2 of 6 model’s genes had a negative score as follows: G6PD (-5.460, P < 0.001) and BAG3 (-2.780, P = 0.006) (Figure 9C). Additionally, G6PD also presented a negative CRISPR score both at day 8 (-0.524, P = 0.034) and day 16 (-2.441, P = 0.004) post co-culture of VEN, compared with control.
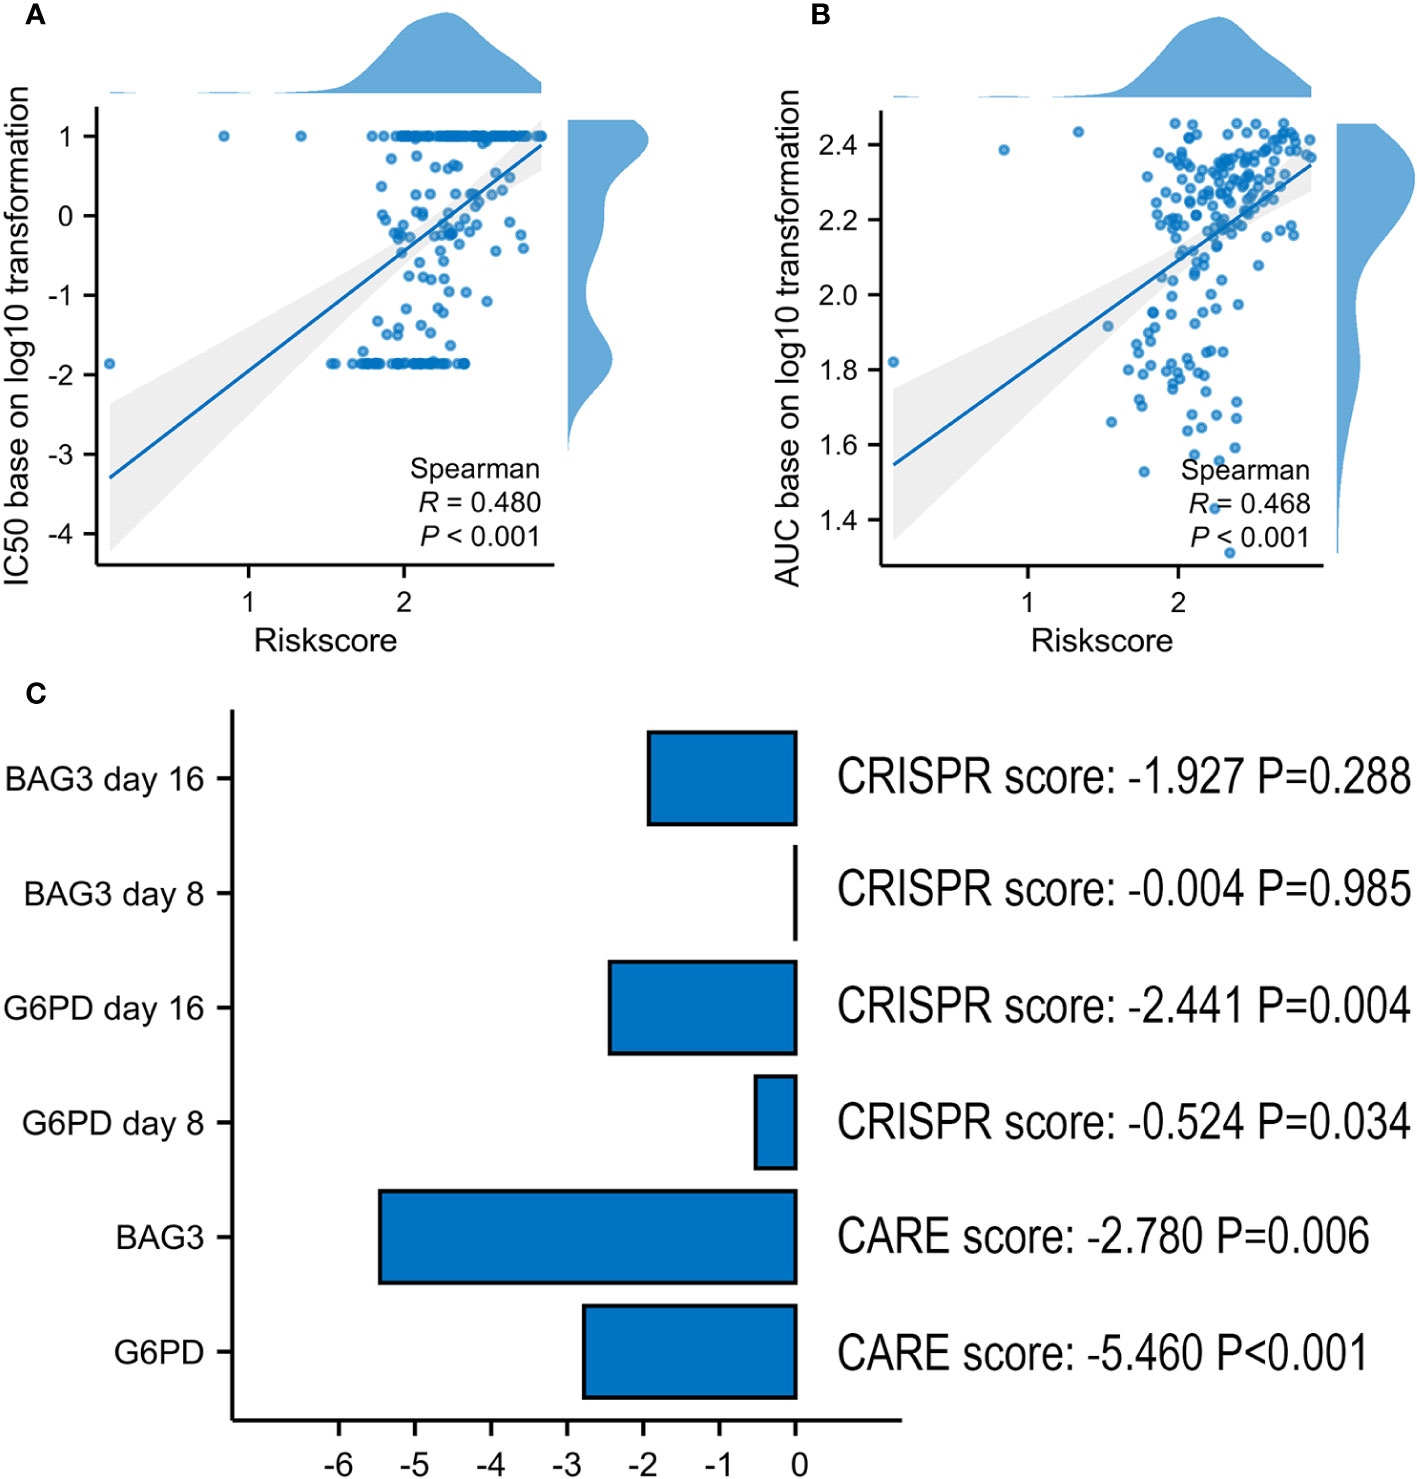
Figure 9 Screening Marker genes from VRSP-M. (A, B) The correlation analysis of VRSP-M’s risk score with IC50 values (log10 transformation) and AUC values (log10 transformation) of VEN in Ex vivo data from Beat AML sample, tested by Spearman method. (C) The importance of G6PD and BAG3 in VEN-resistance, and the scores were evaluated using by CARE algorithm and CRISPR data.
Whereafter, a method of CCK-8 assay was used to examine the viability of AML cell lines treated with ABT-199 for 48 hours and determined the IC50 values. The IC50 values ranged from <10 nmol/L to >1000 nmol/L (Figure 10A). The expression levels of G6PD and BAG3 were further tested in these AML cell lines, such as HL-60, MOLM13, MV4-11, and so on. The results indicated that G6PD expression was positively correlated with the IC50 of ABT-199 (Figure 10B). Except for OCI-AML3, the expression of BAG3 was also positively correlated with VEN-resistance (Figure 10C). The expression of G6PD and BAG3 were also verified in these AML cell lines using Western blot. As shown in Figures 10D, E, the IC50 levels of ABT-199 rose progressively with increasing protein levels of G6PD and BAG3. These findings indicate that G6PD and BAG3 may be effective markers for VEN-resistance in AML.
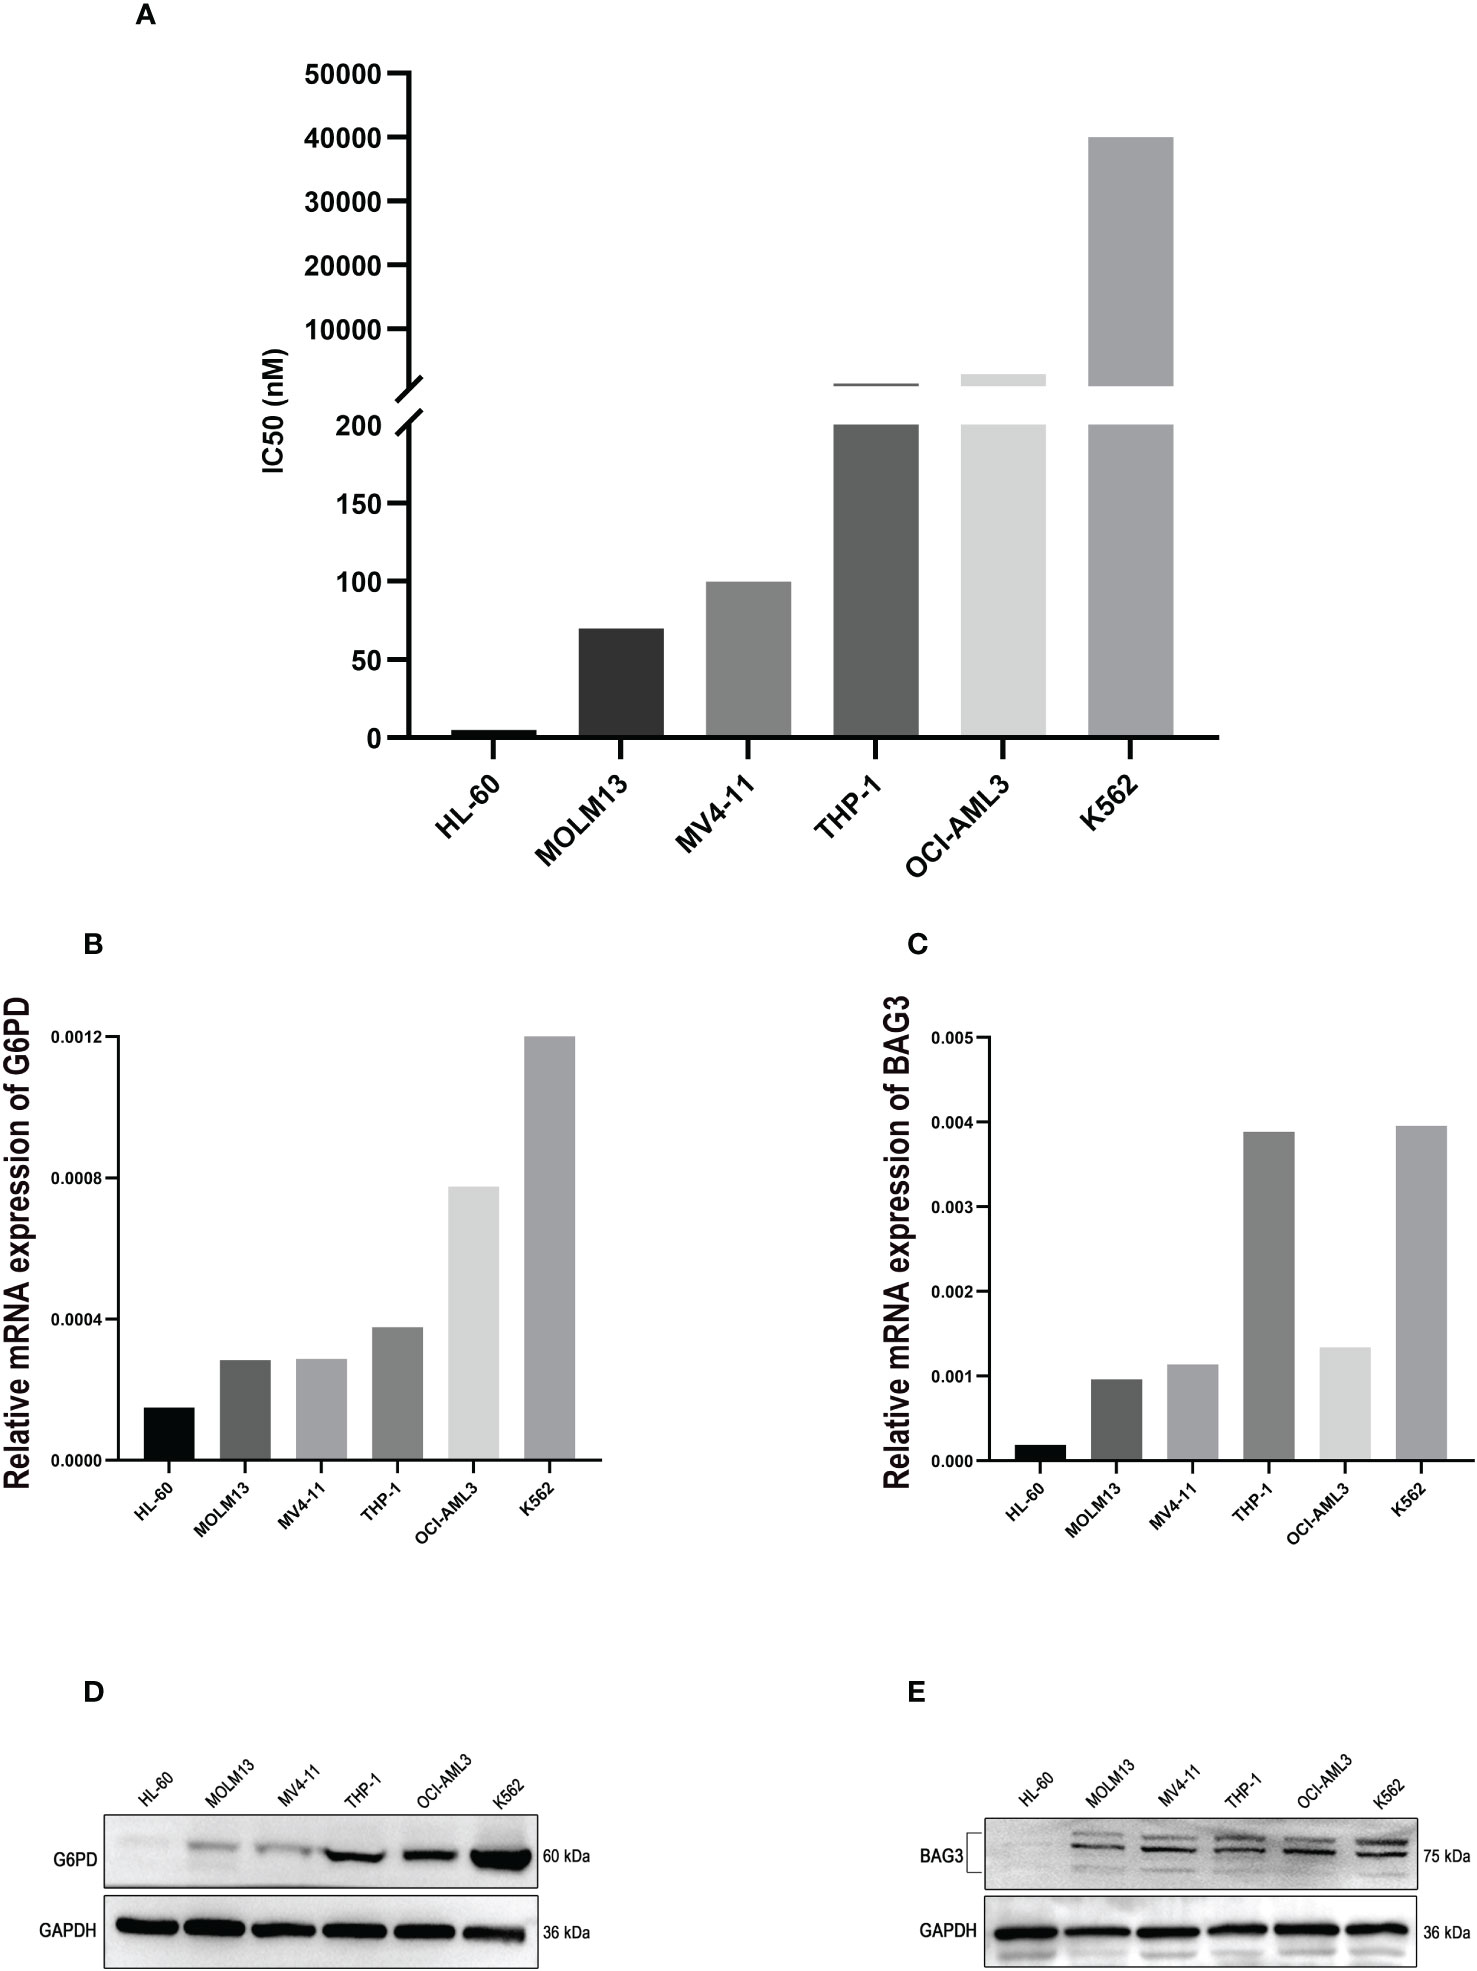
Figure 10 The experimental verification of the Key Markers. (A) The IC50 values of ABT-199 (Venetoclax) in different AML cell lines, tested by CCK-8 assay. (B, C) The mRNA levels of G6PD and BAG3 expression in different AML cell lines, using PCR method. (D, E) Protein levels of G6PD and BAG3 in different AML cell lines, tested by Western blot.
Senescence is a complex stress response that can be grouped into different categories including genome-based failures and signaling dysfunction. However, the role of cellular senescence in cancer is controversial. In some conditions, the response of cellular senescence suppresses cancer progression (17, 18), conversely, which variously stimulates tumor progression in other ways (20–22). However, it is not quite clear whether senescence could induce VEN-resistance in AML. To better understand it, a VRSP-M was developed and validated using multiple AML cohorts, which can distinguish the prognosis of AMLs.
In this prognostic model, G6PD, BAG3, SRC, TNFSF15, and GRK6 act as risk factors, whereas CDK6 is a protective factor. Moreover, G6PD possesses the highest weight on AML prognosis, and was also proven to be an effective molecular marker of VEN-resistance. Previous studies have indicated that G6PD overexpression was associated with a poor prognosis in certain types of cancer, including AML, hepatocellular carcinoma, invasive breast carcinoma, and mesothelioma (36). G6PD could promote cancer progression through its effects on some metabolic pathways (37, 38). Decreasing proliferation of leukemia and other cancer cells, knockdown of G6PD significantly increased apoptosis of tumor cells which are also more susceptible to oxidative stress (39, 40). Acting as an effector of ATM (Ataxia telangiectasia mutated), G6PD often participates in the development of various cancers through metabolic programming and DNA repair pathways (41). As an essential enzyme in the pentose phosphate pathway (PPP), G6PD could produce more materials by this pathway to meet the high anabolic needs of tumor cells, which may make the cancers more resistant to chemotherapy. Playing an important role in AML resistance to the FLT3 inhibitor, the inactivation of G6PD increases the sensitivity of AML to FLT3 inhibitors (42). Under various stresses, multiple tumors turn metabolism to the PPP to get enough reductants to fight against reactive oxygen species (ROS) by activating G6PD rapidly. Otherwise, G6PD can also affect cancers by regulating ROS. Modulation of G6PD was proven to affect bladder cancer via ROS accumulation and the AKT pathway in vitro (43), and knockdown of G6PD reduces ROS accumulation and enhances apoptosis of bladder cancer cells. In addition, G6PD also facilitates clear cell renal cell carcinoma invasion through the ROS−MAPK axis pathway (44).
Up-regulated ROS level induced by G6PD activation not only leads to out of control of cell growth and apoptosis of cancer, by also affects the immune microenvironment. In our study, high-risk AMLs also activate the signal of NADPH oxidases, and excessive activation of NOX (non-phagocytic cell oxidase) in cancer cells results in a large amount of ROS production. Accumulation of ROS leads to apoptosis in normal cells and mediates cellular senescence (45), which may be one of the reasons for the activation of NADPH oxidases in the high-risk subtype. Otherwise, excessive ROS also maintains the proliferation of tumor cells due to the protection of anti-oxidative stress with NADPH (39, 46–48). In fact, overexpression of G6PD could protect leukemic cells against oxidative stress by increasing NADPH production. On the other hand, not only leading to DNA damage and genomic instability, excessive of ROS could regulate signal transduction in the tumor environment, all of these are beneficial to the growth and progress of tumors (49, 50). Previous study has demonstrated that elevated ROS level induced by VEN can enhance the anti-leukemia effect of T cells (51). However, many studies also confirmed that ROS could induce the polarization of macrophages to M2 subtypes (52–56). Acting as a double-edged sword, ROS not only enhances T cells’ anti-leukemia effect, but stimulates other immune cells, such as M2 macrophages and MDSCs. Hence, cellular senescence often triggers an immune response in the tumor microenvironment, facilitating tumor formation and progression (57, 58), which might lead to a higher immune and stromal score in our high-risk AMLs. Moreover, a higher infiltration of MDSCs and M2 Macrophages in the high-risk subtype could prevent immune clearance of leukemia cells, and lead to poorer prognosis (59).
Shaping an unfavorable immune microenvironment, immunosenescence is also an urgent problem to be solved in the treatment of cancers. Mainly involved in PD1 signaling and strongly related to many immune checkpoints, a high-risk score of the VRSP-M was positively correlated with T cell dysfunction but negatively with T cell exclusion. T-cell dysfunction in cancer displays functional unresponsiveness, including senescence, exhaustion, anergy, and self-tolerance that is increasingly recognized as major hurdles for the success of cancer immunotherapy (60–62). So, potential approach to enhance anti-leukemia is to improve T and NK dysfunction, such as PD-1 inhibitor, chimeric antigen receptor T-cell therapy, and NK or γδ T-based adoptive immunotherapies (63–65). While the blocking-up of immune checkpoints has led to breakthroughs in several solid cancer therapies, research in AML remains limited (66). In the real world, AMLs have limited benefits from anti-PD-1 therapy (67, 68), which may be due to many AMLs often accompanied by T cell exclusion. The resistance to immunotherapy in AML, such as PD-1 blockade, remains one of the major challenges impeding its application in the future. So, a higher predictive response of immunotherapy in the high-risk subtype may bring a new perspective towards AML therapy, and VEN combined with blocking therapy of immune checkpoints is worthy of further exploration.
Considering VEN-resistance from the perspective of gene interaction, patients in the high-risk group presented a lower BCL2 expression, but higher levels of BCL2L1, BCL2A1, and MCL1. This means that the high-risk score often causes VEN-resistance by interacting with anti-apoptosis proteins, which is one of the main causes of VEN-resistance (9, 69, 70). Of other 5 senescence genes, as the co-variants of BCL-2, BAG3 works together with BAG1 to maintain the viability of myeloid cells, dysregulation of which could lead to physiological abnormalities (71). Notably, previous studies have indicated that BAG3 is associated with a poor AML prognosis (72), and involved in resistance to chemotherapy (73). Bound to the DR3 receptor, TNFSF15 often plays pro-inflammatory roles and regulates cytokine release (74). Furthermore, the TNFSF15/DR3 axis is involved in promoting apoptosis through Caspase pathways, but could also activate inhibitors of apoptosis proteins by regulating NF-κB pathways and inhibiting apoptosis (75). It is noteworthy that persistent inflammation could also promote the progression and resistance of tumors (76). Abnormal activation of SRC protein, one of the non-receptor tyrosine kinases, is closely related to the tumors’ progression. Overexpression of which could lead to increased Src kinase activity, and play an important role in human cancer, including cell proliferation, differentiation, survival, and mortality (77). Besides, up-regulated GRK6 level is also associated with the progression and prognosis of colorectal carcinoma (78), and its role in AML is worth further exploration. Interestingly, AMLs sensitive to VEN-therapy are enriched in various gene sets of leukemic stem cells (LSCs), while the major enrichment of VEN-resistant AMLs is monocytic differentiation (27). As an essential regulatory molecule for activating LSCs (79), CDK6 is up-regulated significantly in VEN-sensitive AMLs. Consistent with these results, CDK6 levels are negatively associated with the risk score of VRSP-M, and high-risk AMLs are also enriched in the monocytic phenotype. In both mice and humans, aging is often accompanied by alteration of the monocyte function and increased production of classical monocytes expressing MHC II, which may help to explain why our high-risk subtype was mainly involved in monocyte differentiation and resistant to VEN-therapy (80).
In the context of oncogenes and clinical characteristics, patients in the high-risk subtype were frequently accompanied by mutations of NRAS, KARS, and TP53. Of note, AML with RAS mutation was associated with VEN-resistance and monocytic phenotype (27, 81). As one of the most common proto-oncogenes in AML, a gain of function in KRAS/NRAS could activate the pathway of RAS/MAPK, and further lead to overexpression and increased stability of MCL-1 protein, which also plays a major role in VEN-resistance. Furthermore, RAS regulatory genes such as PTPN11 usually co-mutate with KRAS/NRAS mutation, which have been reported refractory to VEN monotherapy in AML (12, 82). In addition, a higher TP53 mutation may also help explain why the high-risk AML subtype exhibited a lower response to VEN and a poor prognosis (4, 83, 84). In general, our results demonstrate that more adverse prognostic features were presented in the high-risk group, including older patients, non-de novo AML, poor cytogenetics or adverse ELN risk, and TP53 mutation. All these results support why high-risk patients in our results have worse survival.
Our study provides a new perspective and potential therapeutic targets based on senescence aid to explore pathogenesis of VEN-resistance in AML; however, there are still several limitations in the current study. More independent AML cohorts are needed to validate it. Moreover, further investigation is needed to explore the underlying mechanisms. The risk score of the prognostic model is significantly associated with VEN-resistance, immune features, and immunotherapy response in AML. We also verified that G6PD and BAG3 could be effective biomarkers of VEN-resistance in vitro. In conclusion, the 6-senescence genes prognostic model has significant meaning for the prediction of VEN-resistance, guiding personalized molecularly targeted therapies, and improving AML prognosis.
The original contributions presented in the study are included in the article/Supplementary Material. Further inquiries can be directed to the corresponding authors. The GDC TCGA-LAML cohort for this study can besought out on the UCSC Xena website (https://gdc.xenahubs.net), datasets of GSE71014 and GSE106291, GSE71014, and GSE216087 can be downloaded from the GEO website (https://www.ncbi.nlm.nih.gov/geo/), and Beat AML cohort can be obtained from the Beat AML program.
Ethical approval was not required for this study in accordance with the local legislation and institutional requirements because only commercially available established cell lines were used.
PK: Data curation, Writing – original draft. JX: Data curation, Writing – original draft. TX: Data curation, Writing – original draft. MC: Formal Analysis, Software, Writing – original draft. YG: Formal Analysis, Software, Writing – original draft. YW: Formal Analysis, Software, Writing – original draft. HQ: Formal Analysis, Software, Writing – original draft. DW: Formal Analysis, Software, Writing – original draft. ZZ: Project administration, Writing – review & editing. SC: Project administration, Writing – review & editing. XB: Project administration, Writing – review & editing.
The author(s) declare financial support was received for the research, authorship, and/or publication of this article. This study was supported by a grant from the National Key R&D Program of China (2019YFA0111004), the National Natural Science Foundation of China (82170158), the Natural Science Foundation of the Jiangsu Higher Education Institutions of China (21KJD320002), and the Translational Research Grant of NCRCH (2021WSB01).
We acknowledge the contributions of the TCGA researchers, GEO, and the Beat AML program study.
The authors declare that the research was conducted in the absence of any commercial or financial relationships that could be construed as a potential conflict of interest.
All claims expressed in this article are solely those of the authors and do not necessarily represent those of their affiliated organizations, or those of the publisher, the editors and the reviewers. Any product that may be evaluated in this article, or claim that may be made by its manufacturer, is not guaranteed or endorsed by the publisher.
The Supplementary Material for this article can be found online at: https://www.frontiersin.org/articles/10.3389/fonc.2023.1302356/full#supplementary-material
1. Kelly LM, Gilliland DG. Genetics of myeloid leukemias. Annu Rev Genomics Hum Genet (2002) 3:179–98. doi: 10.1146/annurev.genom.3.032802.115046
2. Almeida AM, Ramos F. Acute myeloid leukemia in the older adults. Leuk Res Rep (2016) 6:1–7. doi: 10.1016/j.lrr.2016.06.001
3. Alibhai SM, Leach M, Minden MD, Brandwein J. Outcomes and quality of care in acute myeloid leukemia over 40 years. Cancer (2009) 115(13):2903–11. doi: 10.1002/cncr.24373
4. Dinardo CD, Pratz K, Pullarkat V, Jonas BA, Arellano M, Becker PS, et al. Venetoclax combined with decitabine or azacitidine in treatment-naive, elderly patients with acute myeloid leukemia. Blood (2019) 133(1):7–17. doi: 10.1182/blood-2018-08-868752
5. Dombret H, Seymour JF, Butrym A, Wierzbowska A, Selleslag D, Jang JH, et al. International phase 3 study of azacitidine vs conventional care regimens in older patients with newly diagnosed AML with >30% blasts. Blood (2015) 126(3):291–9. doi: 10.1182/blood-2015-01-621664
6. Vo TT, Ryan J, Carrasco R, Neuberg D, Rossi DJ, Stone RM, et al. Relative mitochondrial priming of myeloblasts and normal HSCs determines chemotherapeutic success in AML. Cell (2012) 151(2):344–55. doi: 10.1016/j.cell.2012.08.038
7. Konopleva M, Letai A. BCL-2 inhibition in AML: an unexpected bonus? Blood (2018) 132(10):1007–12. doi: 10.1182/blood-2018-03-828269
8. Pan R, Hogdal LJ, Benito JM, Bucci D, Han L, Borthakur G, et al. Selective BCL-2 inhibition by ABT-199 causes on-target cell death in acute myeloid leukemia. Cancer Discovery (2014) 4:362–75. doi: 10.1158/2159-8290.CD-13-0609
9. Konopleva M, Pollyea DA, Potluri J, Chyla B, Hogdal L, Busman T, et al. Efficacy and biological correlates of response in a phase II study of venetoclax monotherapy in patients with acute myelogenous leukemia. Cancer Discov (2016) 6:1106–17. doi: 10.1158/2159-8290.CD-16-0313
10. Bisaillon R, Moison C, Thiollier C, Krosl J, Bordeleau ME, Lehnertz B, et al. Genetic characterization of ABT-199 sensitivity in human AML. Leukemia (2020) 34:63–74. doi: 10.1038/s41375-019-0485-x
11. Maiti A, Rausch CR, Cortes JE, Pemmaraju N, Daver NG, Ravandi F, et al. Outcomes of relapsed or refractory acute myeloid leukemia after frontline hypomethylating agent and venetoclax regimens. Haematologica (2021) 106:894–8. doi: 10.3324/haematol.2020.252569
12. Chyla B, Daver N, Doyle K, McKeegan E, Huang X, Ruvolo V, et al. Genetic biomarkers of sensitivity and resistance to venetoclax monotherapy in patients with relapsed acute myeloid leukemia. Am J Hematol (2018) 93(8):E202–205. doi: 10.1002/ajh.25146
13. Chen X, Glytsou C, Zhou H, Narang S, Reyna DE, Lopez A, et al. Targeting mitochondrial structure sensitizes acute myeloid leukemia to venetoclax treatment. Cancer Discovery (2019) 9:890–909. doi: 10.1158/2159-8290.CD-19-0117
14. Nechiporuk T, Kurtz SE, Nikolova O, Liu T, Jones CL, D’Alessandro A, et al. The TP53 apoptotic network is a primary mediator of resistance to BCL2 inhibition in AML cells. Cancer Discovery (2019) 9:910–25. doi: 10.1158/2159-8290.CD-19-0125
15. Birch J, Gil J. Senescence and the SASP: many therapeutic avenues. Genes Dev (2020) 34:1565–76. doi: 10.1101/gad.343129.120
16. Gorgoulis V, Adams PD, Alimonti A, Bennett DC, Bischof O, Bishop C, et al. Cellular senescence: defining a path forward. Cell (2019) 179:813–27. doi: 10.1016/j.cell.2019.10.005
17. He S, Sharpless NE. Senescence in health and disease. Cell (2017) 169:1000–11. doi: 10.1016/j.cell.2017.05.015
18. Kowald A, Passos JF, Kirkwood TBL. On the evolution of cellular senescence. Aging Cell (2020) 19:e13270. doi: 10.1111/acel.13270
19. Lee S, Schmitt CA. The dynamic nature of senescence in cancer. Nat Cell Biol (2019) 21:94–101. doi: 10.1038/s41556-018-0249-2
20. Wang B, Kohli J, Demaria M. Senescent cells in cancer therapy: friends or foes? Trends Cancer (2020) 6:838–57. doi: 10.1016/j.trecan.2020.05.004
21. Salama R, Sadaie M, Hoare M, Narita M. Cellular senescence and its effector programs. Genes Dev (2014) 28(2):99–114. doi: 10.1101/gad.235184.113
22. Pérez-Mancera PA, Young AR, Narita M. Inside and out: the activities of senescence in cancer. Nat Rev Cancer (2014) 14(8):547–58. doi: 10.1038/nrc3773
23. Baker DJ, Childs BG, Durik M, Wijers ME, Sieben CJ, Zhong J, et al. Naturally occurring p16(Ink4a)-positive cells shorten healthy lifespan. Nature (2016) 530:184–9. doi: 10.1038/nature16932
24. Lasry A, Ben-Neriah Y. Senescence-associated inflammatory responses: aging and cancer perspectives. Trends Immunol (2015) 36(4):217–28. doi: 10.1016/j.it.2015.02.009
25. Berben L, Floris G, Wildiers H, Hatse S. Cancer and aging: two tightly interconnected biological processes. Cancers (Basel) (2021) 13(6):1400. doi: 10.3390/cancers13061400
26. Tyner JW, Tognon CE, Bottomly D, Wilmot B, Kurtz SE, Savage SL, et al. Functional genomic landscape of acute myeloid leukaemia. Nature (2018) 562(7728):526–31. doi: 10.1038/s41586-018-0623-z
27. Pei S, Pollyea DA, Gustafson A, Stevens BM, Minhajuddin M, Fu R, et al. Monocytic subclones confer resistance to venetoclax-based therapy in patients with acute myeloid leukemia. Cancer Discov (2020) 10(4):536–51. doi: 10.1158/2159-8290.CD-19-0710
28. Saul D, Kosinsky RL, Atkinson EJ, Doolittle ML, Zhang X, LeBrasseur NK, et al. A new gene set identifies senescent cells and predicts senescence-associated pathways across tissues. Nat Commun (2022) 13(1):4827. doi: 10.1038/s41467-022-32552-1
29. Charoentong P, Finotello F, Angelova M, Mayer C, Efremova M, Rieder D, et al. Pan-cancer immunogenomic analyses reveal genotype-immunophenotype relationships and predictors of response to checkpoint blockade. Cell Rep (2017) 18(1):248–62. doi: 10.1016/j.celrep.2016.12.019
30. Aran D, Hu Z, Butte AJ. xCell: digitally portraying the tissue cellular heterogeneity landscape. Genome Biol (2017) 18(1):220. doi: 10.1186/s13059-017-1349-1
31. Yoshihara K, Shahmoradgoli M, Martínez E, Vegesna R, Kim H, Torres-Garcia W, et al. Inferring tumour purity and stromal and immune cell admixture from expression data. Nat Commun (2013) 4:2612. doi: 10.1038/ncomms3612
32. Jiang P, Gu S, Pan D, Fu J, Sahu A, Hu X, et al. Signatures of T cell dysfunction and exclusion predict cancer immunotherapy response. Nat Med (2018) 24(10):1550–8. doi: 10.1038/s41591-018-0136-1
33. Eide CA, Kurtz SE, Kaempf A, Long N, Joshi SK, Nechiporuk T, et al. Clinical correlates of venetoclax-based combination sensitivities to augment acute myeloid leukemia therapy. Blood Cancer Discov (2023) 4(6):452–67. doi: 10.1158/2643-3230
34. Jiang P, Lee W, Li X, Johnson C, Liu JS, Brown M, et al. Genome-scale signatures of gene interaction from compound screens predict clinical efficacy of targeted cancer therapies. Cell Syst (2018) 6(3):343–354.e5. doi: 10.1016/j.cels.2018.01.009
35. Li J, Shen Z, Wang Z, Chao H, Xu Y, Zeng Z, et al. CTCF: A novel fusion partner of ETO2 in a multiple relapsed acute myeloid leukemia patient. J Leukoc Biol (2022) 111(5):981–7. doi: 10.1002/JLB.2A0720-441RR
36. Li R, Wang W, Yang Y, Gu C. Exploring the role of glucose-6-phosphate dehydrogenase in cancer (Review). Oncol Rep (2020) 44(6):2325–36. doi: 10.3892/or.2020.7803
37. Spencer NY, Stanton RC. Glucose 6-phosphate dehydrogenase and the kidney. Curr Opin Nephrol Hypertens (2017) 26(1):43–9. doi: 10.1097/MNH.0000000000000294
38. Peiró C, Romacho T, Azcutia V, Villalobos L, Fernández E, Bolaños JP, et al. Inflammation, glucose, and vascular cell damage: the role of the pentose phosphate pathway. Cardiovasc Diabetol (2017) 16(1):25. doi: 10.1186/s12933-017-0502-1
39. Xu SN, Wang TS, Li X, Wang YP. SIRT2 activates G6PD to enhance NADPH production and promote leukaemia cell proliferation. Sci Rep (2016) 6:32734. doi: 10.1038/srep32734
40. Gottschalk S, Anderson N, Hainz C, Eckhardt SG, Serkova NJ. Imatinib (STI571)-mediated changes in glucose metabolism in human leukemia BCR-ABL-positive cells. Clin Cancer Res (2004) 10:6661–8. doi: 10.1158/1078-0432.CCR-04-0039
41. Williams RM, Yates LA, Zhang X. Structures and regulations of ATM and ATR, master kinases in genome integrity. Curr Opin Struct Biol (2020) 61:98–105. doi: 10.1016/j.sbi.2019.12.010
42. Gregory MA, D’Alessandro A, Alvarez-Calderon F, Kim J, Nemkov T, Adane B, et al. ATM/G6PD-driven redox metabolism promotes FLT3 inhibitor resistance in acute myeloid leukemia. Proc Natl Acad Sci USA (2016) 113(43):E6669–78. doi: 10.1073/pnas.1603876113
43. Chen X, Xu Z, Zhu Z, Chen A, Fu G, Wang Y, et al. Modulation of G6PD affects bladder cancer via ROS accumulation and the AKT pathway in vitro. Int J Oncol (2018) 53(4):1703–12. doi: 10.3892/ijo.2018.4501
44. Zhang Q, Han Q, Yang Z, Ni Y, Agbana YL, Bai H, et al. G6PD facilitates clear cell renal cell carcinoma invasion by enhancing MMP2 expression through ROS−MAPK axis pathway. Int J Oncol (2020) 57(1):197–212. doi: 10.3892/ijo.2020.5041
45. Tsai IC, Pan ZC, Cheng HP, Liu CH, Lin BT, Jiang MJ. Reactive oxygen species derived from NADPH oxidase 1 and mitochondria mediate angiotensin II-induced smooth muscle cell senescence. J Mol Cell Cardiol (2016) 98:18–27. doi: 10.1016/j.yjmcc.2016.07.001
46. Cairns RA, Harris IS, Mak TW. Regulation of cancer cell metabolism. Nat Rev Cancer (2011) 11:85–95. doi: 10.1038/nrc2981
47. Hamanaka RB, Chandel NS. Mitochondrial reactive oxygen species regulate cellular signaling and dictate biological outcomes. Trends Biochem Sci (2010) 35:505–13. doi: 10.1016/j.tibs.2010.04.002
48. Maryanovich M, Gross A. A ROS rheostat for cell fate regulation. Trends Cell Biol (2013) 23(3):129–34. doi: 10.1016/j.tcb.2012.09.007
49. Meitzler JL, Antony S, Wu Y, Juhasz A, Liu H, Jiang G, et al. NADPH oxidases:a perspective on reactive oxygen species production in tumor biology. Antioxid Redox Signal (2014) 20:2873–89. doi: 10.1089/ars.2013.5603
50. Weyemi U, Redon CE, Parekh PR, Dupuy C, Bonner WM. NADPH oxidases NOXs and DUOXs as putative targets for cancer therapy. Anticancer Agents Med Chem (2013) 13:502–14.
51. Lee JB, Khan DH, Hurren R, Xu M, Na Y, Kang H, et al. Venetoclax enhances T cell-mediated antileukemic activity by increasing ROS production. Blood (2021) 138(3):234–45. doi: 10.1182/blood.2020009081
52. Zhang Y, Choksi S, Chen K, Pobezinskaya Y, Linnoila I, Liu ZG. ROS play a critical role in the differentiation of alternatively activated macrophages and the occurrence of tumor-associated macrophages. Cell Res (2013) 23(7):898–914. doi: 10.1038/cr.2013.75
53. Kapoor N, Niu J, Saad Y, Kumar S, Sirakova T, Becerra E, et al. Transcription factors STAT6 and KLF4 implement macrophage polarization via the dual catalytic powers of MCPIP. J Immunol (2015) 194(12):6011–23. doi: 10.4049/jimmunol.1402797
54. Shan M, Qin J, Jin F, Han X, Guan H, Li X, et al. Autophagy suppresses isoprenaline-induced M2 macrophage polarization via the ROS/ERK and mTOR signaling pathway. Free Radic Biol Med (2017) 110:432–43. doi: 10.1016/j.freeradbiomed.2017.05.021
55. Aerbajinai W, Ghosh MC, Liu J, Kumkhaek C, Zhu J, Chin K, et al. Glia maturation factor-γ regulates murine macrophage iron metabolism and M2 polarization through mitochondrial ROS. Blood Adv (2019) 3(8):1211–25. doi: 10.1182/bloodadvances.2018026070
56. Griess B, Mir S, Datta K, Teoh-Fitzgerald M. Scavenging reactive oxygen species selectively inhibits M2 macrophage polarization and their pro-tumorigenic function in part, via Stat3 suppression. Free Radic Biol Med (2020) 147:48–60. doi: 10.1016/j.freeradbiomed.2019.12.018
57. Duy C, Li M, Teater M, Meydan C, Garrett-Bakelman FE, Lee TC, et al. Chemotherapy induces senescence-like resilient cells capable of initiating AML recurrence. Cancer Discov (2021) 11(6):1542–61. doi: 10.1158/2159-8290.CD-20-1375
58. Sarode P, Schaefer MB, Grimminger F, Seeger W, Savai R. Macrophage and tumor cell cross-talk is fundamental for lung tumor progression: we need to talk. Front Oncol (2020) 10:324. doi: 10.3389/fonc.2020.00324
59. Yan H, Qu J, Cao W, Liu Y, Zheng G, Zhang E, et al. Identification of prognostic genes in the acute myeloid leukemia immune microenvironment based on TCGA data analysis. Cancer Immunol Immunother (2019) 68(12):1971–8. doi: 10.1007/s00262-019-02408-7
60. Thommen DS, Schumacher TN. T cell dysfunction in cancer. Cancer Cell (2018) 33(4):547–62. doi: 10.1016/j.ccell.2018.03.012
61. Wherry EJ, Kurachi M. Molecular and cellular insights into T cell exhaustion. Nat Rev Immunol (2015) 15(8):486–99. doi: 10.1038/nri3862
62. Schietinger A, Philip M, Krisnawan VE, Chiu EY, Delrow JJ, Basom RS, et al. Tumor-specific T cell dysfunction is a dynamic antigen-driven differentiation program initiated early during tumorigenesis. Immunity (2016) 45(2):389–401. doi: 10.1016/j.immuni.2016.07.011
63. Kasakovski D, Xu L, Li Y. T cell senescence and CAR-T cell exhaustion in hematological Malignancies. J Hematol Oncol (2018) 11(1):91. doi: 10.1186/s13045-018-0629-x
64. Lichtenegger FS, Krupka C, Haubner S, Köhnke T, Subklewe M. Recent developments in immunotherapy of acute myeloid leukemia. J Hematol Oncol (2017) 10(1):142. doi: 10.1186/s13045-017-0505-0
65. Lee JB, Chen B, Vasic D, Law AD, Zhang L. Cellular immunotherapy for acute myeloid leukemia: How specific should it be? Blood Rev (2019) 35:18–31. doi: 10.1016/j.blre.2019.02.001
66. Topalian SL, Taube JM, Anders RA, Pardoll DM. Mechanism-driven biomarkers to guide immune checkpoint blockade in cancer therapy. Nat Rev Cancer (2016) 16(5):275–87. doi: 10.1038/nrc.2016.36
67. Ravandi F, Assi R, Daver N, Benton CB, Kadia T, Thompson PA, et al. Idarubicin, cytarabine, and nivolumab in patients with newly diagnosed acute myeloid leukaemia or high-risk myelodysplastic syndrome: a single-arm, phase 2 study. Lancet Haematol (2019) 6(9):e480–8. doi: 10.1016/S2352-3026(19)30114-0
68. Daver N, Garcia-Manero G, Basu S, Boddu PC, Alfayez M, Cortes JE, et al. Efficacy, safety, and biomarkers of response to azacitidine and nivolumab in relapsed/refractory acute myeloid leukemia: A nonrandomized, open-label, phase II study. Cancer Discov (2019) 9(3):370–83. doi: 10.1158/2159-8290.CD-18-0774
69. Konopleva M, Contractor R, Tsao T, Samudio I, Ruvolo PP, Kitada S, et al. Mechanisms of apoptosis sensitivity and resistance to the BH3 mimetic ABT-737 in acute myeloid leukemia. Cancer Cell (2006) 10(5):375–88. doi: 10.1016/j.ccr.2006.10.006
70. Kasper S, Breitenbuecher F, Heidel F, Hoffarth S, Markova B, Schuler M, et al. Targeting MCL-1 sensitizes FLT3-ITD-positive leukemias to cytotoxic therapies. Blood Cancer J (2012) 2(3):e60. doi: 10.1038/bcj.2012.5
71. Liu Q, Liu J, Huang X. Unraveling the mystery: How bad is BAG3 in hematological Malignancies? Biochim Biophys Acta Rev Cancer (2022) 1877(5):188781. doi: 10.1016/j.bbcan.2022.188781
72. Fu D, Zhang B, Wu S, Zhang Y, Xie J, Ning W, et al. Prognosis and characterization of immune microenvironment in acute myeloid leukemia through identification of an autophagy-related signature. Front Immunol (2021) 12:695865. doi: 10.3389/fimmu.2021.695865
73. Valdez BC, Murray D, Ramdas L, de Lima M, Jones R, Kornblau S, et al. Altered gene expression in busulfan-resistant human myeloid leukemia. Leuk Res (2008) 32(11):1684–97. doi: 10.1016/j.leukres.2008.01.016
74. Xu WD, Li R, Huang AF. Role of TL1A in inflammatory autoimmune diseases: A comprehensive review. Front Immunol (2022) 13:891328. doi: 10.3389/fimmu.2022.891328
75. Bittner S, Ehrenschwender M. Multifaceted death receptor 3 signalingPromoting survival and triggering death. FEBS Lett (2017) 591(17):2543–55. doi: 10.1002/1873-3468.12747
76. Greten FR, Grivennikov SI. Inflammation and cancer: triggers, mechanisms, and consequences. Immunity (2019) 51(1):27–41. doi: 10.1016/j.immuni.2019.06.025
77. Dehm SM, Bonham K. SRC gene expression in human cancer: the role of transcriptional activation. Biochem Cell Biol (2004) 82(2):263–74. doi: 10.1139/o03-077
78. Tao R, Li Q, Gao X, Ma L. Overexpression of GRK6 associates with the progression and prognosis of colorectal carcinoma. Oncol Lett (2018) 15(4):5879–86. doi: 10.3892/ol.2018.8030
79. Scheicher R, Hoelbl-Kovacic A, Bellutti F, Tigan AS, Prchal-Murphy M, Heller G, et al. CDK6 as a key regulator of hematopoietic and leukemic stem cell activation. Blood (2015) 125(1):90–101. doi: 10.1182/blood-2014-06-584417
80. Barman PK, Shin JE, Lewis SA, Kang S, Wu D, Wang Y, et al. Production of MHCII-expressing classical monocytes increases during aging in mice and humans. Aging Cell (2022) 21(10):e13701. doi: 10.1111/acel.13701
81. Hang Q, Riley-Gillis B, Han L, Jia Y, Lodi A, Zhang H, et al. Activation of RAS/MAPK pathway confers MCL-1 mediated acquired resistance to BCL-2 inhibitor venetoclax in acute myeloid leukemia. Signal Transduct Target Ther (2022) 7(1):51. doi: 10.1038/s41392-021-00870-3
82. Chen L, Chen W, Mysliwski M, Serio J, Ropa J, Abulwerdi FA, et al. Mutated Ptpn11 alters leukemic stem cell frequency and reduces the sensitivity of acute myeloid leukemia cells to Mcl1 inhibition. Leukemia (2015) 29(6):1290–300. doi: 10.1038/leu.2015.18
83. Wei AH, Strickland SA Jr, Hou JZ, Fiedler W, Lin TL, Walter RB. Venetoclax combined with low-dose cytarabine for previously untreated patients with acute myeloid leukemia: results from a phase Ib/II study. J Clin Oncol (2019) 37(15):1277–84. doi: 10.1200/JCO.18.01600
Keywords: venetoclax resistance, senescence, prognosis, acute myeloid leukemia, immunotherapy
Citation: Ke P, Xie J, Xu T, Chen M, Guo Y, Wang Y, Qiu H, Wu D, Zeng Z, Chen S and Bao X (2023) Identification of a venetoclax-resistance prognostic signature base on 6-senescence genes and its clinical significance for acute myeloid leukemia. Front. Oncol. 13:1302356. doi: 10.3389/fonc.2023.1302356
Received: 26 September 2023; Accepted: 14 November 2023;
Published: 30 November 2023.
Edited by:
Chung Hoow Kok, University of Adelaide, AustraliaReviewed by:
Chenglong Yu, Monash University, AustraliaCopyright © 2023 Ke, Xie, Xu, Chen, Guo, Wang, Qiu, Wu, Zeng, Chen and Bao. This is an open-access article distributed under the terms of the Creative Commons Attribution License (CC BY). The use, distribution or reproduction in other forums is permitted, provided the original author(s) and the copyright owner(s) are credited and that the original publication in this journal is cited, in accordance with accepted academic practice. No use, distribution or reproduction is permitted which does not comply with these terms.
*Correspondence: Zhao Zeng, emVuZ3poYW9Ac3VkYS5lZHUuY24=; Suning Chen, c3VuaW5nX2NoZW4wMzA3QDE2My5jb20=; Xiebing Bao, YmFvc3V5aXh1ZXllQDE2My5jb20=
†These authors have contributed equally to this work
Disclaimer: All claims expressed in this article are solely those of the authors and do not necessarily represent those of their affiliated organizations, or those of the publisher, the editors and the reviewers. Any product that may be evaluated in this article or claim that may be made by its manufacturer is not guaranteed or endorsed by the publisher.
Research integrity at Frontiers
Learn more about the work of our research integrity team to safeguard the quality of each article we publish.