
95% of researchers rate our articles as excellent or good
Learn more about the work of our research integrity team to safeguard the quality of each article we publish.
Find out more
ORIGINAL RESEARCH article
Front. Oncol. , 17 November 2023
Sec. Gastrointestinal Cancers: Gastric and Esophageal Cancers
Volume 13 - 2023 | https://doi.org/10.3389/fonc.2023.1249172
This article is part of the Research Topic Precise Diagnosis, Functional Mechanisms, and Therapeutic Potentials in Gastrointestinal Cancers, volume II View all 36 articles
 Verena Maria Raters1
 Florian Gebauer2
 Heike Löser3
 Wolfgang Schröder2
 Hans Anton Schlösser2
 Hans Fuchs2
 Christiane Bruns2
 Alexander Quaas3†Thomas Zander1*†
Background: Staging, especially clinical lymph node staging in esophageal adenocarcinoma has only moderate sensitivity and specificity. Therefore, we evaluated combined molecular markers to predict prognosis.
Patients and methods: 890 tumor tissue samples were obtained from patients who underwent surgery for esophageal adenocarcinoma with curative intent. These were stained by tissue micro array for 48 markers which are associated with tumorigenesis and correlated with clinical data (TNM-staging, overall survival) by multivariate Cox regression.
Results: Two markers (preserved Y chromosome and high grade of (CD3+) T-cell infiltration) were found to be significantly and independently associated with better overall survival. We formed a score (called CY score) from the two markers. The more markers are positive and thus the higher the score (ranging from 0 to 2), the better the overall survival, independently of UICC. Moreover, we developed a combination score of the UICC and CY score based on cluster analysis. Patients with a UICC stage of III with the presence of both traits (CY=2) can be assigned to a better prognosis group (group II), whereas patients with a UICC stage of I without both traits (CY=0) must be assigned to a worse prognosis group (group II). Therefore, patients in stage I with adverse molecular signature might benefit of multimodal therapy.
Conclusion: In summary, the CY score adds prognostic information to the UICC stage based on tumor biology in esophageal adenocarcinoma and warrants further evaluations in independent clinical cohorts.
Esophageal cancer is a common cancer with a high mortality ranking seventh in terms of incidence and sixth in mortality worldwide (1). In developed countries the incidence of esophageal cancer is rising (2). Whereas very early in the disease endoscopic treatment can lead to cure, surgical resection often combined with chemotherapy or radiochemotherapy was established for locally advanced tumors. Even with these intensive therapeutic regimens the overall survival of patients with esophageal cancer remains poor (3, 4). More recently, also immunotherapy has been introduced in the curative first line setting (5).
Using comprehensive genomic analysis, esophageal cancer has been subdivided in different molecular subtypes, but the prognostic value of these subgroups still remains to be determined (6, 7). In addition, several molecular markers have been evaluated concerning their prognostic value, but none of these has entered clinical routine (preserved Y chromosome (8); HER2 (9); KRas and PIK3CA (10); Integrin alpha-5 (11); ini1, BRM, BRG1 and ARID domain-containing protein 1A (12); Mesothelin (13); GATA-6 (14); XIAP (15); Claudin-18 (16); p53 (17); Mdm2 (18)). In this project we evaluated the potential of combined molecular markers to predict prognosis of esophageal adenocarcinoma.
893 tumor tissue samples were obtained from patients who underwent surgery for adenocarcinoma of the esophagus with curative intent at the University Hospital Cologne, Germany between 1996 and 2019 and gave informed consent in accordance with The Code of Ethics of the World Medical Association (Declaration of Helsinki) and the local ethics committee (13-091) (Table 1). All tumors were classified according to the UICC system of the 7th edition. The tumor tissue samples were stained by tissue micro array (TMA) for 48 markers known to be associated with various aspects of tumorigenesis (proliferation, migration and invasion, immunomodulation, angiogenesis, metabolism, chromatin remodeling, and inflammation). For the following analyses, the 44 markers for which > 30% (n ≥ 270) TMA samples could be evaluated were included: Programmed cell death 1 ligand 1 (PD-L1), T-cell immunoglobulin mucin receptor 3 (TIM-3), Lymphocyte activation gene 3 protein (LAG-3), Receptor tyrosine-protein kinase erbB-2 (HER2), cellular tumor antigen p53, Scavenger receptor class B member 1 (CD36), Carcinoembryonic antigen-related cell adhesion molecule 8 (CD66b), Proliferation marker protein Ki-67, E3 ubiquitin-protein ligase Mdm2, Antigen-presenting major histocompatibility complex class I (MHC-1), High mobility group protein B1 (HMGB1), DNA mismatch repair protein Mlh1, T-cell surface glycoprotein CD3 cell tumor infiltration, Mesothelin, AT-rich interactive domain-containing protein 1A (ARID domain-containing protein 1A), Pre-mRNA-splicing factor ini1, Probable global transcription activator SNF2L2 (BRM), Transcription activator BRG1, Aldo-keto reductase family 1 (AKR1), Claudin-18, Hepatocyte growth factor receptor (MET), Myc proto-oncogene protein, GTPase KRas, Transcription factor GATA-6, Phosphatidylinositol 4,5-bisphosphate 3-kinase catalytic subunit alpha isoform (PIK3CA), preserved Y chromosome, Integrin alpha-5, Integrin beta-1, Integrin beta-4, Phosphatidylinositol 3,4,5-trisphosphate 3-phosphatase and dual-specificity protein phosphatase (PTEN), Fructose-1,6-bisphosphatase 1 (FBP1), Trimethylation of histone H3 lysine 27 (H3K27m3), Ubiquilin-4 (UBQLN4), Tumor-associated calcium signal transducer 2 (TROP-2), F-box/WD repeat-containing protein 7 (FBXW7), G1/S-specific cyclin-D1 (Cyclin D1), Cyclin-dependent kinase inhibitor 2A (CDKN2A/p16), U3 small nucleolar ribonucleoprotein protein IMP3, Cadherin-1 (E-cadherin), Carbonic anhydrase 9, E3 ubiquitin-protein ligase XIAP, Immunoglobulin superfamily DCC subclass member 4 (NOPE) on cancer cells, Hematopoietic progenitor cell antigen CD34 quantity and Gremlin-1 (GREM1) RNA.
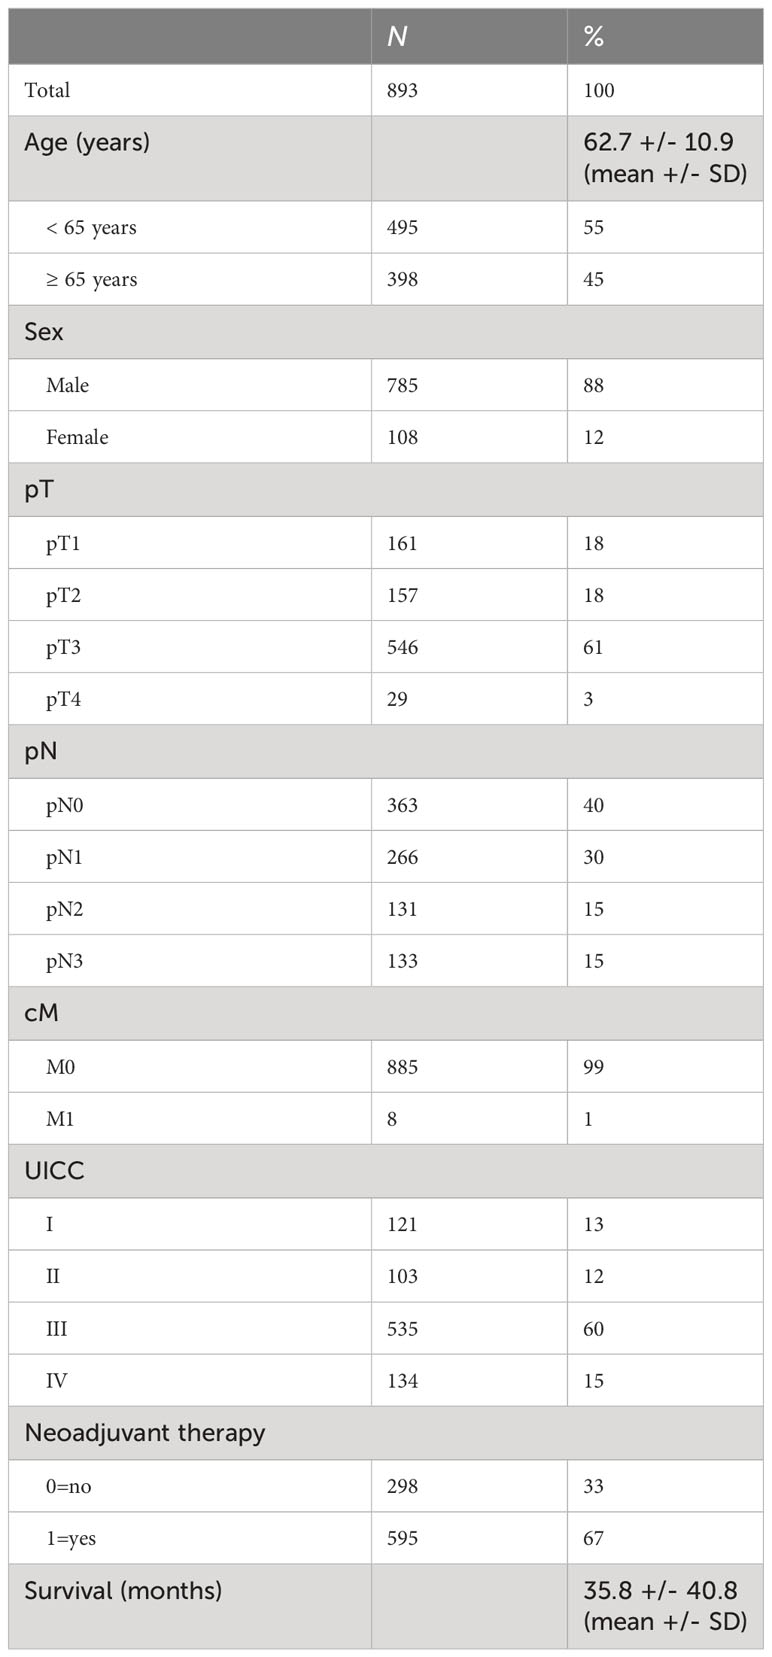
Table 1 Clinical data of tumor samples.
In detail, the tumor tissue samples were fixed in 4% buffered formalin at room temperature for at least 24 hours (maximum 72 hours). Tumor tissue microarrays (TMA) were constructed as previously described (19, 20). In brief, tissue cylinders with a diameter of 1.2 mm were punched from selected tumor tissue blocks using an in−house developed semi−automated precision instrument and embedded in empty recipient paraffin blocks. The Paraffin blocks were cut into 4 μm−thick sections, which were transferred onto an adhesive coated slide system. Freshly cut TMA sections were immunostained in one day and in one experiment. Slides were deparaffinized using standard protocols with Dewax (Leica Microsystems, Inc.) and 100% ethanol, and exposed to heat−induced antigen retrieval for 5 min in an autoclave at 121˚C and pH 9 (Tris−EDTA−buffer) or pH 6 (citrate buffer). The TMA slides were stained with the following antibodies (clone, buffer, dilution, manufacturer) or FISH probes (probe name, manufacturer):
AKR1 (EPR14421, EDTA, 1:500, abcam, UK), ARID domain-containing protein 1A (EPR13501, EDTA, 1:1000, abcam, UK), BRM (D9E8B, EDTA, 1:50, Cell Signaling Technology, MA, USA), BRG1 (EPNCIR111A, EDTA, 1:300, abcam, UK), Carbonic anhydrase IX (EPR4151, EDTA, 1:100, abcam, UK), CD3 (SP7, citrate, 1:50, Thermo Fisher Scientific, MA, USA), CD34 quantity (QB End10, citrate, 1:700, Cell Marque, CA, USA), CD36 (D8L9T, citrate, 1:200, Cell Signaling Technology, MA, USA), CD66b (G10F5, EDTA, 1:200, Novus Biologicals, CO, USA), CDKN2A/p16 (ZytoLight ® SPEC CDKN2A/CEN 9 Dual Color Probe, Zytomed, Germany), Claudin-18 (ERP19202, EDTA, 1:200, abcam, UK), c-Myc (Y69, citrate, 1:100, abcam, UK), Cyclin D1 (ZM178, citrate, 1:400, Zeta Corporation, CA, USA), E-Cadherin (M3612, EDTA, 1:50, Dako, CA, USA), FBP1 (EPR4619, EDTA, 1:100, abcam, UK), FBXW7 (SP237, EDTA, 1:500, abcam, UK), GATA-6 (GATA6-20-GR Probe, Empire Genomics, NY, USA), Grem1 (ab22138, EDTA, 1:400, abcam, UK), H3K27m3 (C36B11, EDTA, 1:100, Cell Signaling Technology, MA, USA), HER2 (4b5, EDTA, not diluted, Roche, Switzerland), HMGB1 (D3E5, EDTA, 1:500, Cell Signaling Technology, MA, USA), IMP3 (M3626, EDTA, 1:100, Agilent, Dako, CA, USA), ini1 (BCIR1, EDTA, 1:50, Zytomed Systems, Germany), Integrin alpha-5 (EPR7854, EDTA, 1:300, abcam, UK), Integrin beta-1 (A4, EDTA, 1:100, Santa Cruz Biotechnology, Germany), Integrin beta-4 (D8P6C, EDTA, 1:100, Cell Signaling Technology, MA, USA), Ki-67 (SP6, EDTA, 1:100, Cell Marque, CA, USA), KRas (9.13, citrate, 1:100, Thermo Fisher Scientific, MA, USA), LAG-3 (D2G40, EDTA, 1:300, Cell Signaling Technology, MA, USA), Mdm2 (Ab-1/IF2, EDTA, 1:50, Calbiochem, NJ, USA), Mesothelin (5B2, EDTA; 1:50, Novocastra, Switzerland), MET (SP44, EDTA, not diluted, Roche, Switzerland), MHC-1 (EPR1394Y, citrate, 1:300, abcam, UK), Mlh1 (M1, EDTA, not diluted, Roche, Switzerland), NOPE-Ca (RNAscope® 2.5 LS Probe- Hs-IGDCC4, ACD, CA, USA), p53 (DO-7, citrate, 1:800, Dako, CA, USA), PD-L1 (E1L3N, EDTA, 1:400, Cell Signaling Technology, MA, USA), PIK3CA (6D9, EDTA, 1:1000, abnova, Taiwan), PTEN (138 G 6, EDTA, 1:300, Cell Signaling Technology, MA, USA), TIM-3 (D5D5R, EDTA, 1:100, Cell Signaling Technology, MA, USA), TROP-2 (ERP20043, EDTA, 1:1000, abcam, UK), UBQLN4 (RNAscope® 2.5 LS Probe- Hs-UBQLN4, ACD, CA, USA), XIAP (ab21278, citrate, 1:1000, abcam, UK), preserved Y chromosome (long and short arm) (Vysis LSI SRY Spectrum Orange Probe and Vysis CEP Y (DYZ1) Spectrum Green Probe, Abbott Molecular, Germany).
The staining was evaluated and quantified by a pathologist and the open-source software QuPath and classified as negative or positive staining for the marker. The two evaluation strategies were compared with very high concordance of results. In the case of discordance, the pathologist determined the division into negative/positive.
Concerning CD3 cell infiltration into the tumor, we used two different evaluation strategies: a semiquantitative method in which a pathologist (AQ) estimated the extent of T lymphocytes in the stroma and divided the extent into the two groups “low” and “high” and a digital method using the freely available software QuPath. QuPath standardized the amount of CD3 positive cells in the tissue to 1 mm2 in absolute numbers, the median was then taken to divide into the two groups “low” and “high”. This was then compared to the primary semiquantitative assessment with very high concordance of results. In the case of discordance, the pathologist determined the division into “low” and “high”.
Clinical data (especially age, sex, survival time, survival status, last follow-up, date of surgery, whether neoadjuvant therapy had been given, state at the time of surgery (pathological tumor extent (y)pT, pathological nodal state (y)pN, clinical metastasis state (cM) and UICC-stage) were collected prospectively according to a standardized protocol.
For statistical analysis, IBM SPSS Statistics for Windows (Version 27) was used.
First, univariate Cox regression was used to test the correlation of each marker with survival time. Significant markers with a p-value (according to Bonferroni correction for multiple comparison) ≤ 0.001 were tested in multivariate Cox regression. A score (called CY score) was formed from the two remaining markers (detection of preserved Y chromosome and high grade of CD3 cell infiltration). A score value of 0 indicates that no marker is positive (loss of Y chromosome and low CD3 cell infiltration), 1 indicates that one marker is positive (either preserved Y chromosome or high CD3 cell infiltration), and 2 indicates that both markers are positive (preserved Y chromosome and high grade of CD3 cell infiltration). The calculation of the score was possible in 620 cases since there staining for both markers was available. To test the correlation of each marker (detection of preserved Y chromosome and CD3 cell infiltration) as well as of the CY score with survival time, a Kaplan-Meier curve was calculated comparing groups using the log-rank test. In addition, a multivariate Cox regression including UICC was calculated. In the next step, the correlation of the markers (detection of preserved Y chromosome and CD3 cell infiltration) and CY score with (y)pT, (y)pN and (y)UICC were tested by calculating the Spearman coefficient and cross tabulation, respectively.
To check for CY score validity in subgroups, Cox regression of the CY score was calculated for patients with a lower versus higher UICC stage (UICC stage 1 and 2 versus 3 and 4), for patients having undergone neoadjuvant chemotherapy or not, for younger versus older patients (< versus ≥ 65 years) and for male versus female patients.
Furthermore, the UICC stage was combined with the CY score. Therefore, the strata of the UICC stage were substratified based on the three groups of the CY score. Using cluster analysis with Ward’s method and squared Euclidean distance as the proximity measure, these were reassembled into new groups of at least two substrata based on their similarity with respect to 0.5-, 1-, 1.5-, 2-, 2.5-, 3-, 3.5-, 4-, 4.5-, 5-, 5.5-, 6-, 6.5- and 7-year survival. To test the discriminatory power of the new CY-UICC score, a Kaplan-Meier curve was calculated comparing groups using the log-rank test.
All tests were two-sided; p values < 0.05 were considered statistically significant. Significance was marked as follows: * for p ≤ 0.05, ** for p ≤ 0.01 and *** for p ≤ 0.001.
As a first step, we examined which of the 44 markers correlated with prolonged overall survival (Table 2).
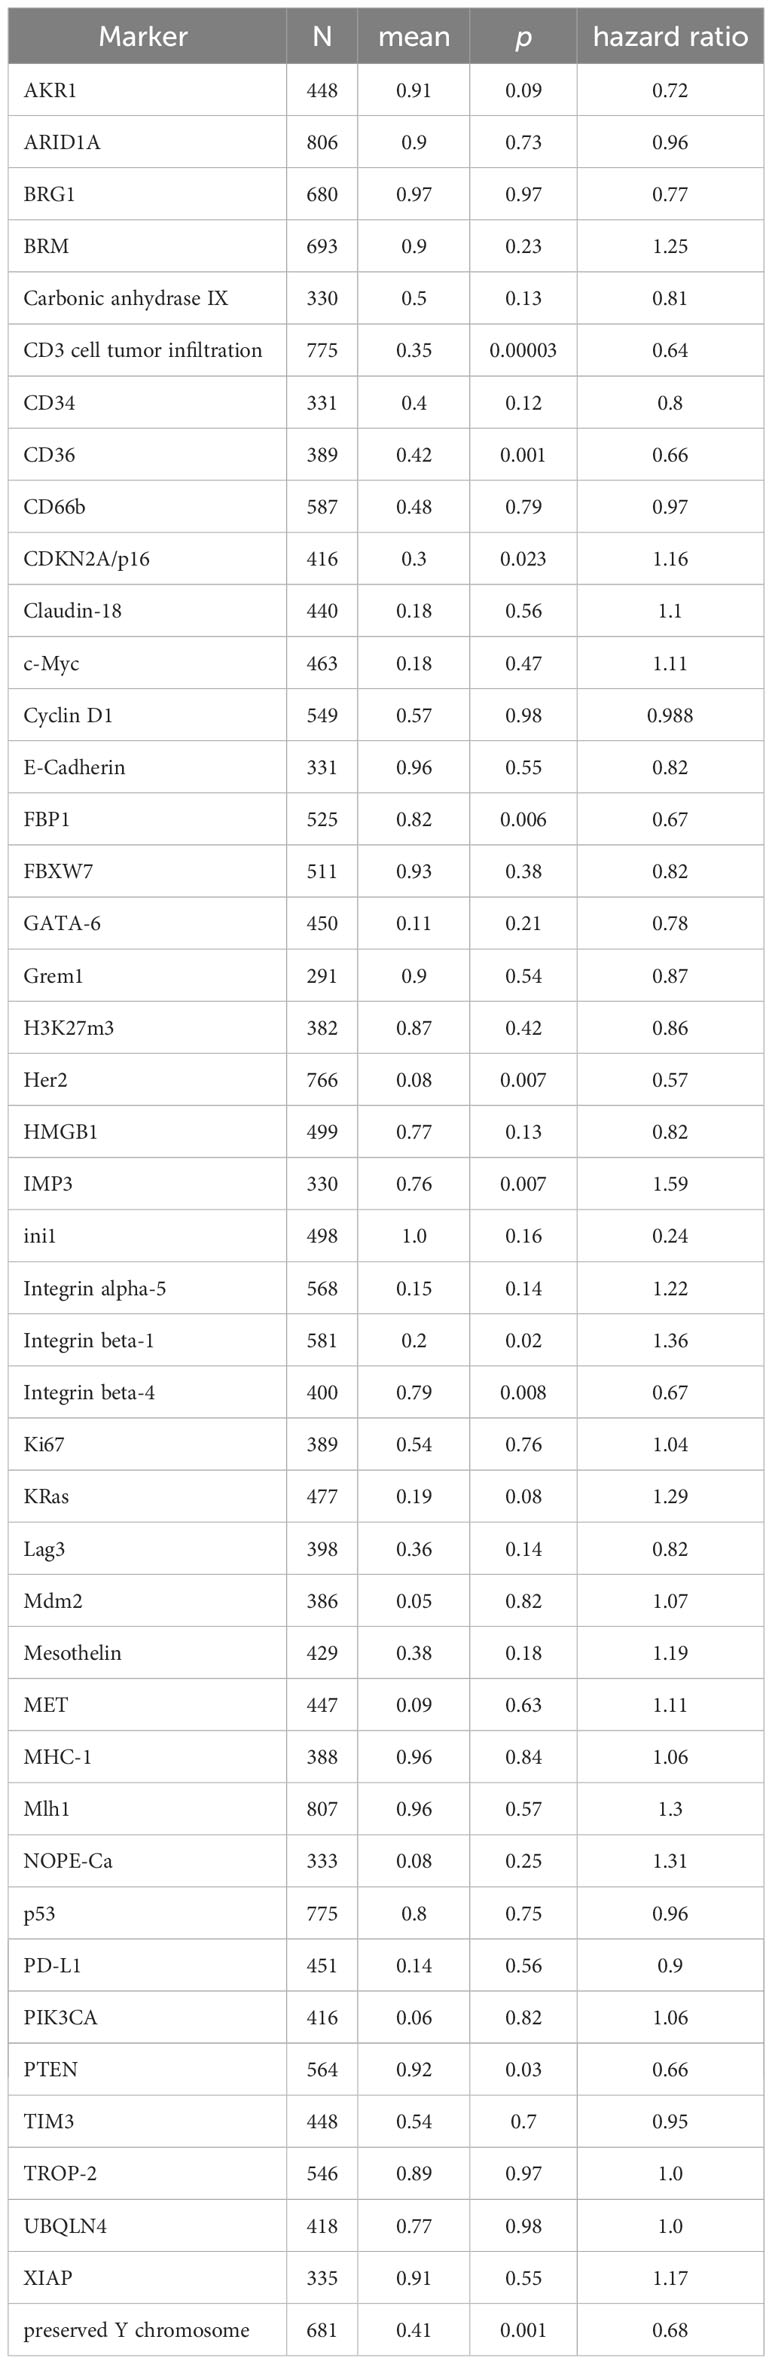
Table 2 Marker: analyzable TMAs (n), mean of marker expression between 0 (negative) and 1 (positive), p value and hazard ratio of univariate Cox regression of the marker and overall survival.
Then, a multivariate Cox regression was performed on the markers that correlated significantly with prolonged overall survival. The markers high CD3 cell infiltration into the tumor (p = 0.003, HR 0.69) and preserved Y chromosome (p = 0.005, HR 0.72) were found to stay significant and remained significant after adding UICC to the multivariate survival analysis.
A score was formed from these two markers. Here, 0 corresponds to no positive marker (loss of Y chromosome and low infiltration of CD3 cells), 1 to one positive marker, and 2 to both markers being positive (Y chromosome preserved and high CD3-cell infiltration into the tumor). Higher CY scores were significantly associated with better survival (CY=0 vs. 1 p=0.0002, CY=1 vs. 2 p=0.00001) (Figure 1). This was also true when controlling for UICC stage in a multivariate COX regression (p=0.00007).
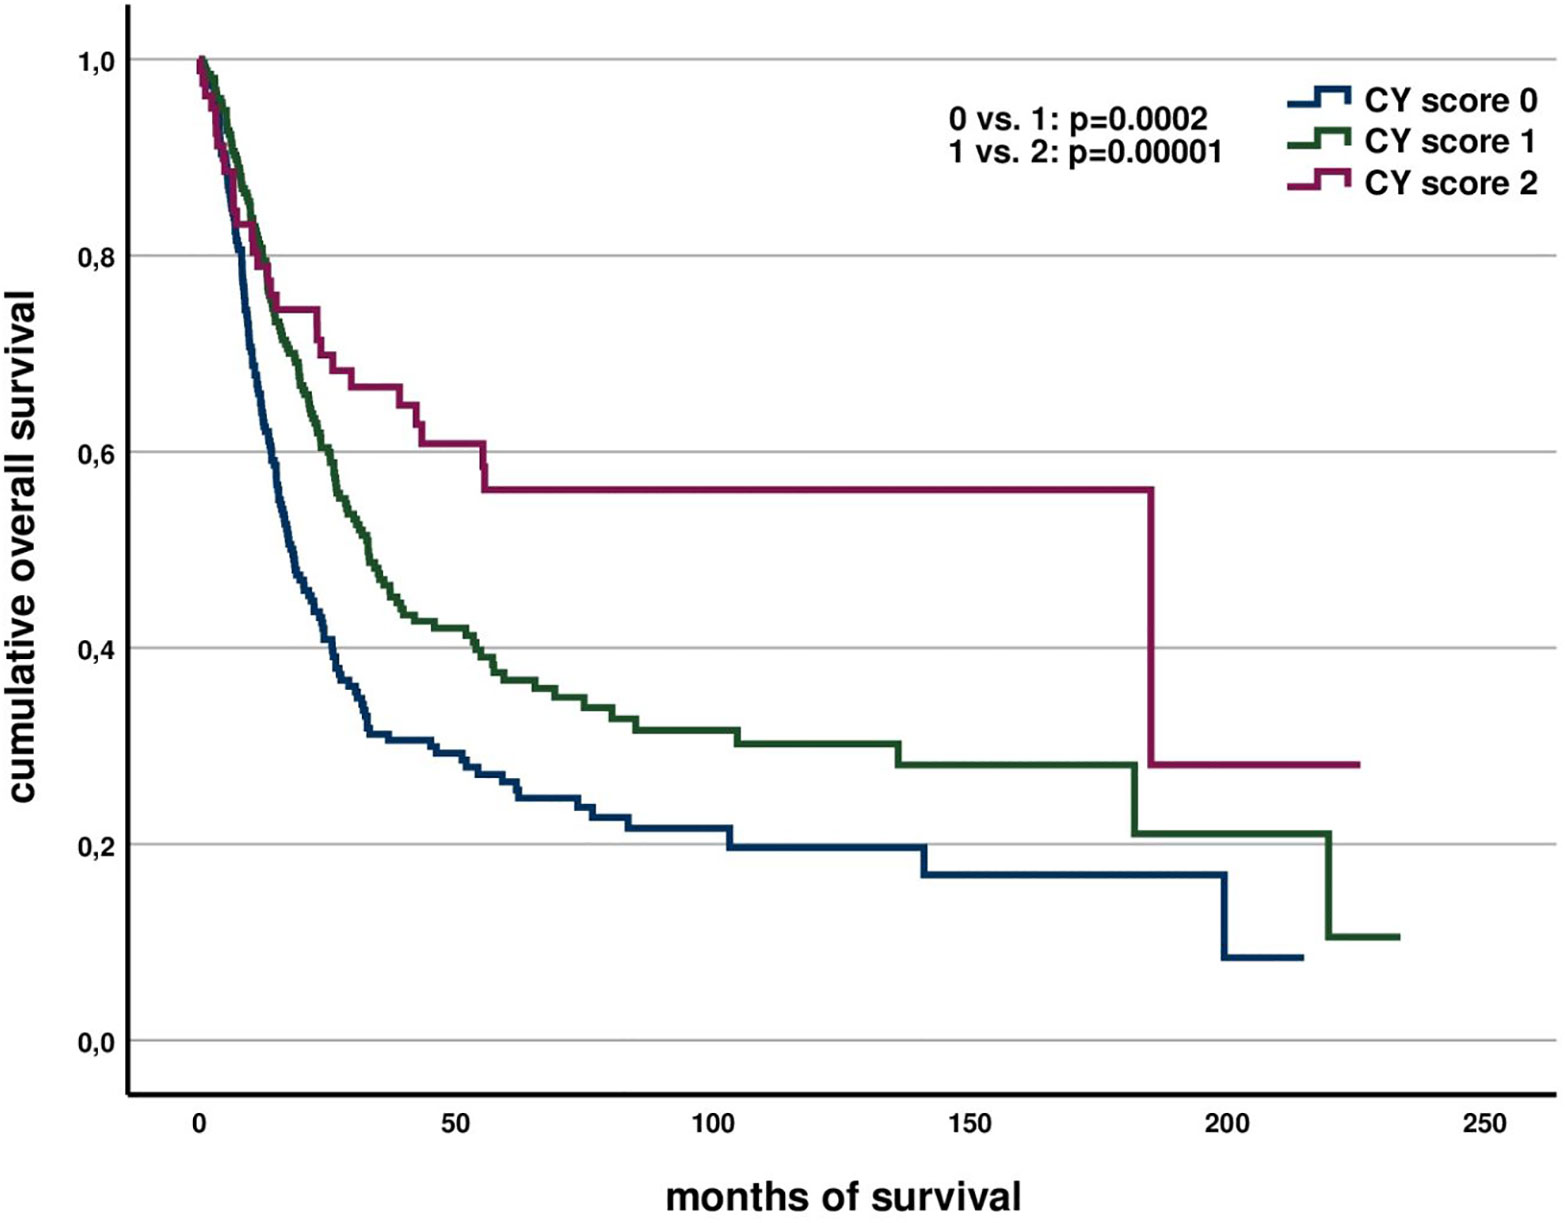
Figure 1 Association of CY score with overall survival.
Correlation of the individual markers and the CY score with other clinical parameters demonstrated an association of high CD3 cell tumor infiltration and preserved Y chromosome with longer survival, a low pN and a low UICC. A high CY score additionally correlates with a smaller pT. All these associations are only to be seen in treatment-naïve patients (see Table 3). Histologic grading, treatment effect (Cologne regression score), lymphovascular invasion and margin status did not show a significant association with the CY score.
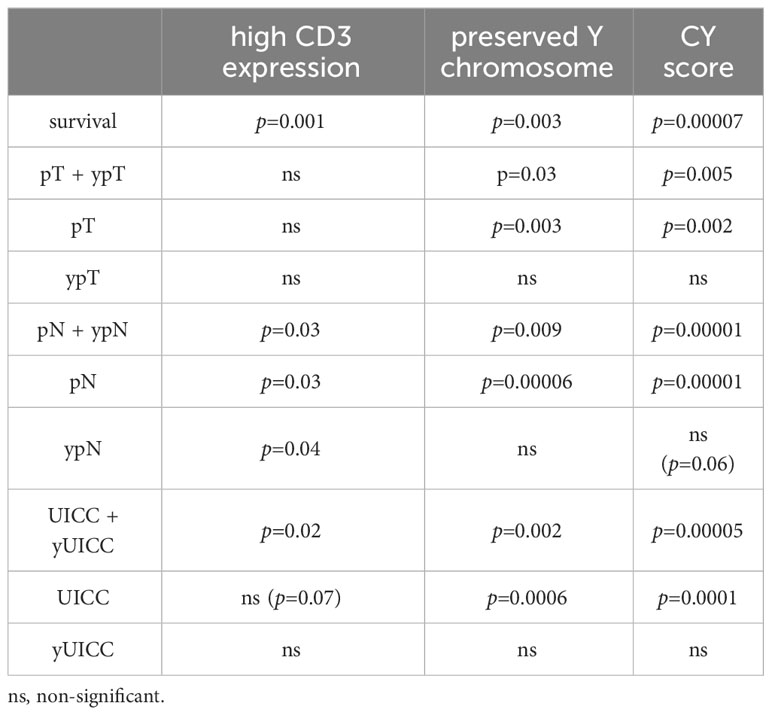
Table 3 Association of markers with clinical data.
Concerning the validity of the CY score for prognosis of survival in subgroups, it is valid for patients with low (p=0.039) versus high (p=0.00016) UICC stage, for patients having undergone neoadjuvant therapy (p=0.002) or not (p=0.0003) and for younger (<65 years) (p=0.001) and older patients (p=0.00006). Concerning female patients, a subgroup analysis was not possible since in the analyzed cohort the score had been able to be calculated in too few women (n=28).
Substratifying the UICC stage using the three groups of the CY score and clustering these substrata by survival over time results in a new combination score. This newly formed combination score (CY-UICC score) is composed according to Figure 2.
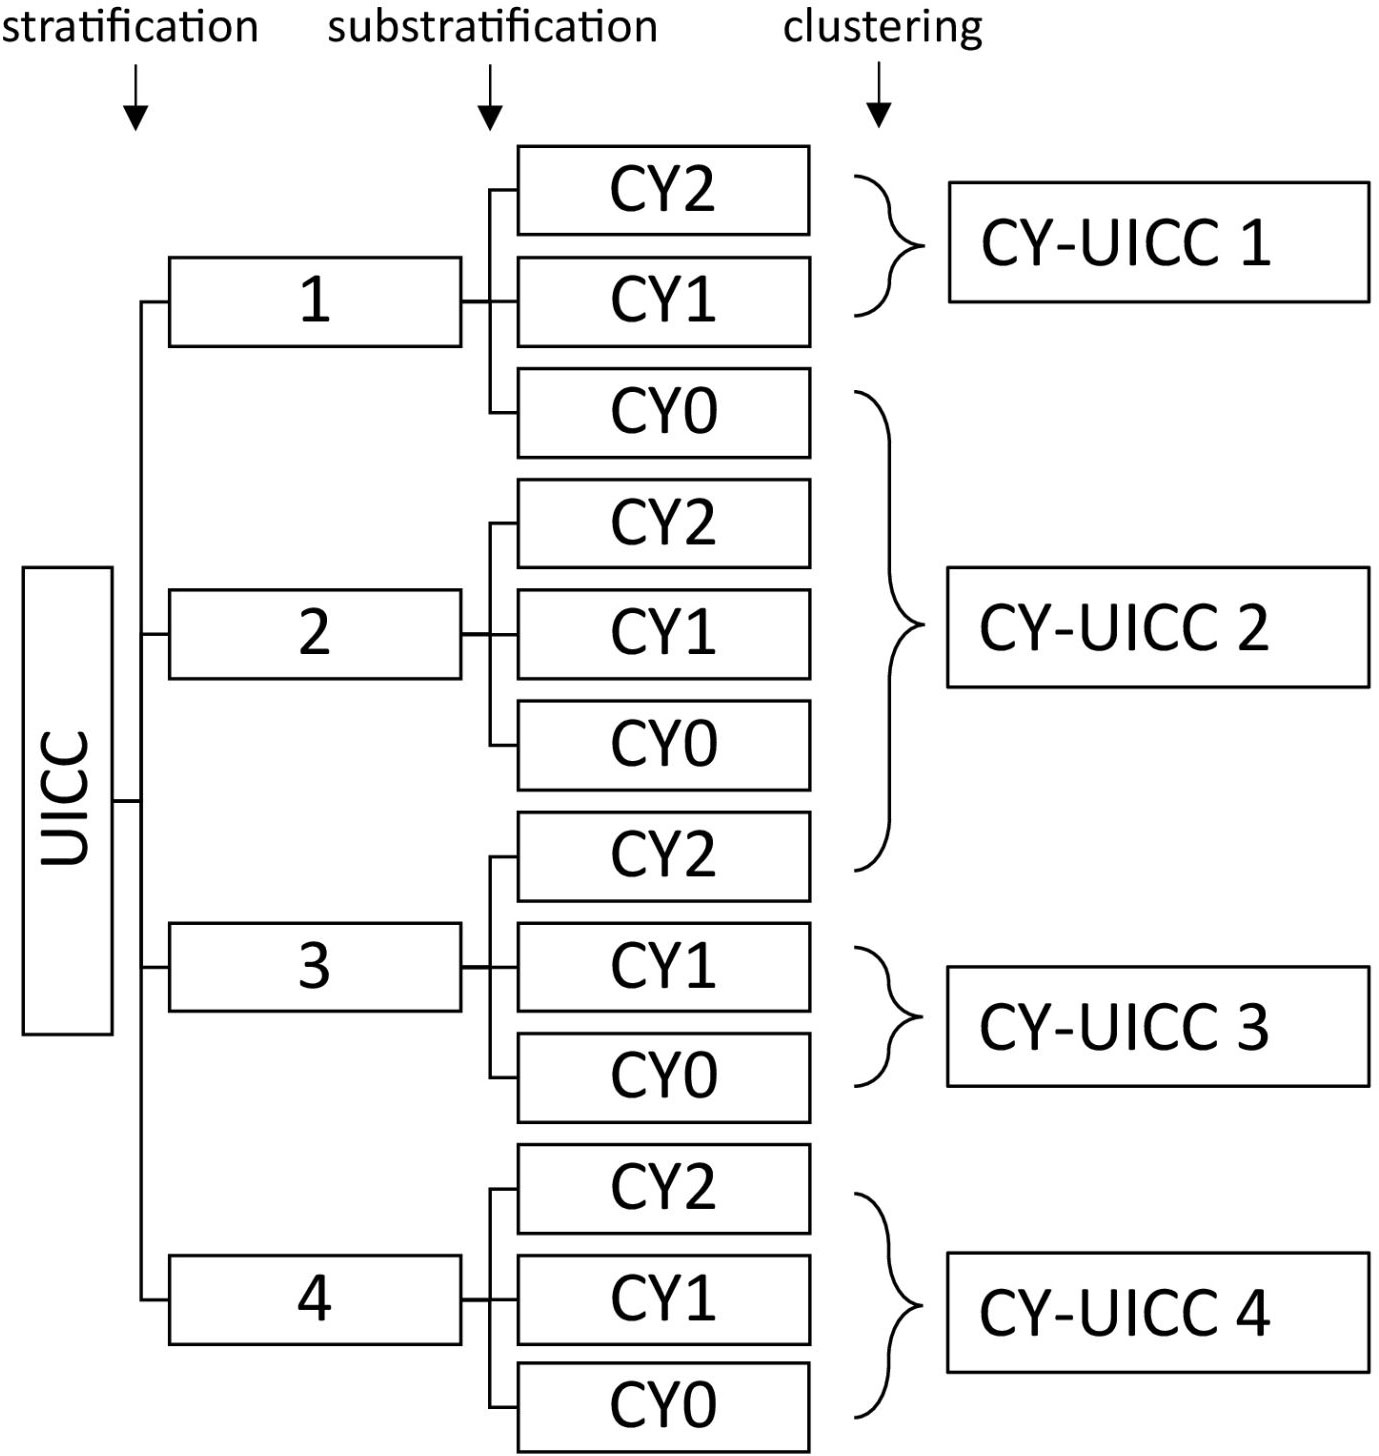
Figure 2 Clustering groups to form the CY-UICC score.
The CY-UICC score significantly separates four different prognostic groups (group 1 vs. 2 p= 0.007, 2 vs. 3 p=0.001, 3 vs. 4 p=0.000000002) (see Figure 3). Median overall survival in the groups is 70.2 months (CY-UICC score 1), 42.5 months (CY-UICC score 2), 30.0 months (CY-UICC score 3) and 16.1 months (CY-UICC score 4), respectively.
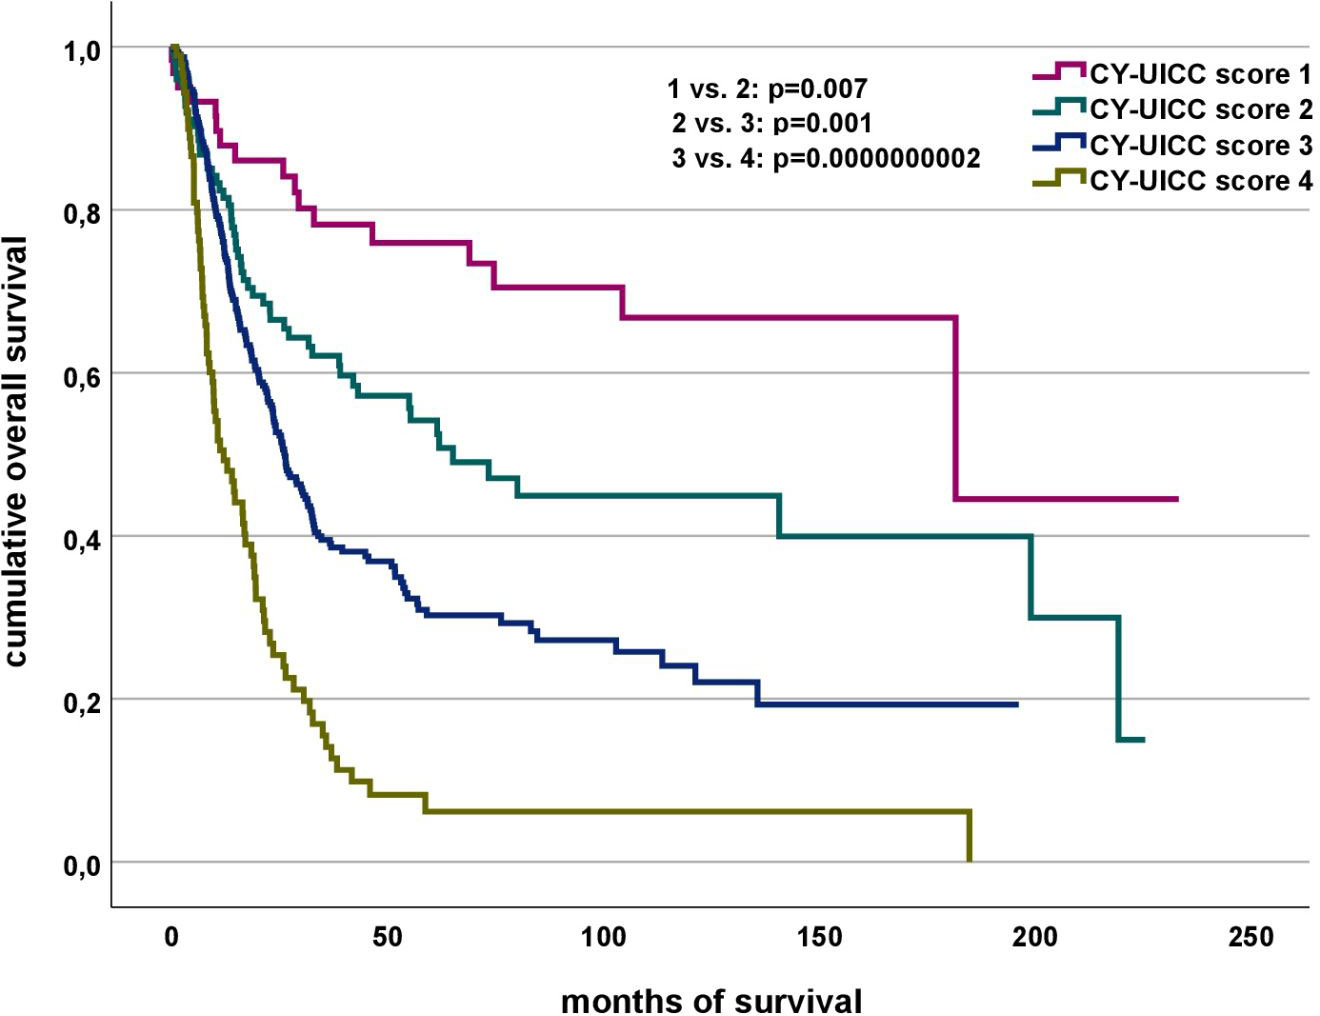
Figure 3 Association of CY-UICC score and overall survival.
Clustering of the CY-UICC score groups shows that considering the CY score, patients with a UICC stage of 3 with the presence of both traits (CY=2) can be assigned to a better prognosis group (group 2), whereas patients with a UICC stage of 1 without both traits (CY=0) must be assigned to a worse prognosis group (group 2) (see Figure 2). Figure 4 compares overall survival of the newly developed CY-UICC score and UICC.
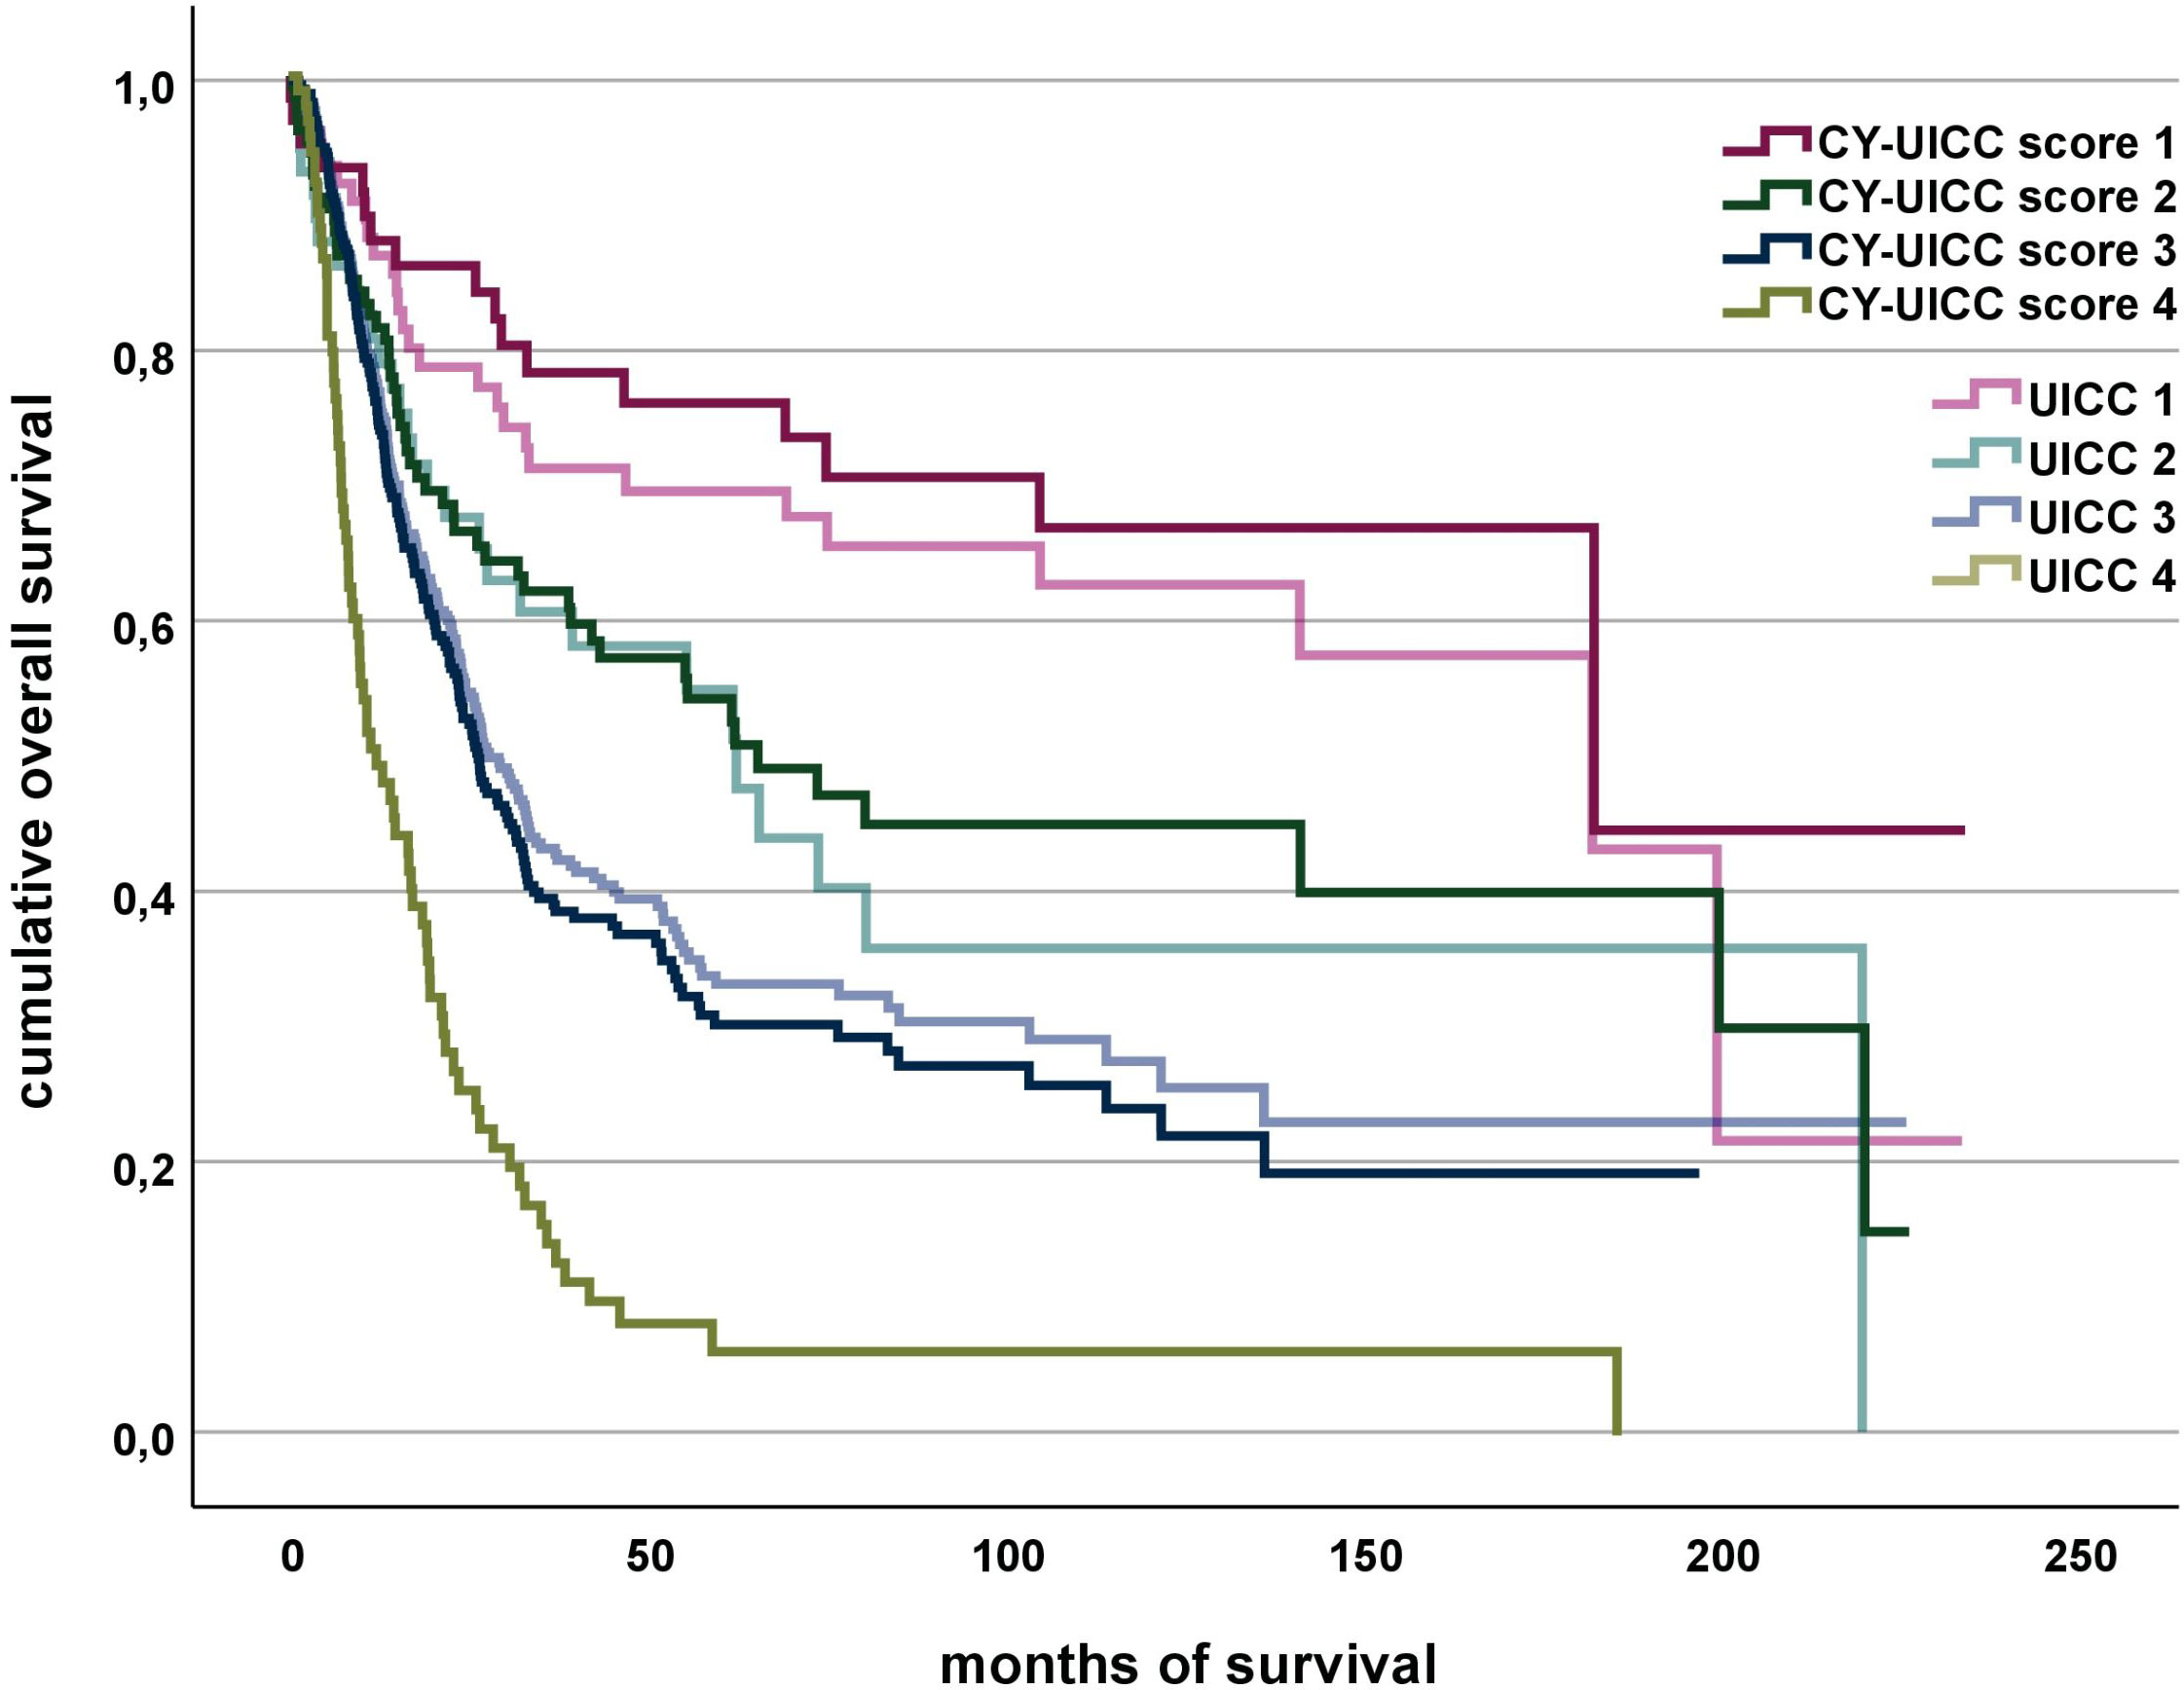
Figure 4 Association of CY-UICC score vs. UICC and overall survival. The groups of CY-UICC score 4 and UICC 4 are identical.
We have shown that a preserved Y chromosome and high CD3 cell infiltration in the tumor are important markers for prolonged overall survival in esophageal adenocarcinoma.
Y chromosome loss (LoY) is associated with aging in men and occurs more frequently in men who smoke (21). LoY is associated with a higher risk for developing non-hematological cancer in general (22). Specifically, we have shown that LoY is a common phenomenon in esophageal adenocarcinoma and is associated with shorter overall survival (8). The functional effect leading to decreased survival in esophageal cancer has not been fully elucidated until yet. It might be a marker for general chromosomal instability and is detectable already in precursing Barrett´s esophagus (23). Furthermore, LoY was shown to be associated with an epigenetic phenotype with methylation of genes being involved in cell proliferation and cell cycle regulation (21). Additionally, the loss of function of genes of the nonrecombinant region of Y were shown to play a role in cell cycle regulation and behave as dosage-sensitive tumor suppressors (24).
Tumor infiltrating lymphocytes (TIL) are involved in immune editing of tumor cells. By elimination of (immunogenic) tumor cells, they reduce tumor growth and at the same time support the eventual outgrowth of less immunogenic tumor cells by selection pressure (25, 26).
Overall, high lymphocyte infiltration of the tumor is associated with longer survival. CD3 cell tumor infiltration is known as good prognostic factor concerning survival in ductal breast cancer (27), non-small cell lung cancer (NSCLC) (28), intestinal-type gastric cancer (29), hepatocellular carcinoma (HCC) (30), gastrointestinal stromal tumor (GIST) (31), ovarian cancer (32), bladder cancer (33), oral squamous cell carcinoma (34) and nasopharyngeal carcinoma (35). For colon cancer, it was even shown that immune cell density in the tumor was of more prognostic importance than UICC classification (36).
In this paper, we have shown that using the CY score adds prognostic information to the UICC stage, most probably by resembling tumor biology (especially immunogenicity and genetic stability). Limitations of the study are its monocentric and retrospective character, a strength its large sample size for this comparably rare type of cancer. Staging, especially clinical lymph node staging is difficult, as sensitivity and specificity of lymph node detection in CT scans and endoscopic ultrasound have low sensitivity (52 - 81%) and specificity (73 - 87%) (37–39). As guidelines recommend multimodal therapy for patients with esophageal cancer in UICC stage II/III, lymph node staging is performed even though diagnostic techniques have limitations. Here, we show that patients in UICC stage I with adverse molecular signature (CY score 0) clinically behave like UICC stage II patients and might benefit from multimodal therapy. UICC stage III patients with a favorable tumor biology (CY score 2) have a better prognosis compared to UICC stage III patients with a less favorable tumor biology. UICC stage IV patients with a good tumor biology (CY score 2) are a very rare event (CY-UICC=2 n=8 vs. CYUICC=1 n=46 and CYUICC=0 n=48) and in these cases the protective effect of the good tumor biology probably cannot outweigh the adverse stage IV cancer features.
In summary, the CY score adds prognostic information to the UICC stage and warrants further evaluations in independent clinical cohorts.
The raw data supporting the conclusions of this article will be made available by the authors, without undue reservation.
The studies involving humans were approved by ethics committee of the University Hospital of Cologne (13-091). The studies were conducted in accordance with the local legislation and institutional requirements. The participants provided their written informed consent to participate in this study.
VR: Conceptualization, Methodology, Formal analysis, Writing - original Draft, FG: Data curation, HL: Investigation, WS: Resources, HS: Resources, HF: Resources, CB: Resources, AQ: Conceptualization, Supervision, Investigation, Writing- Reviewing and Editing, TZ: Conceptualization, Supervision, Writing- Reviewing and Editing. All authors contributed to the article and approved the submitted version.
We acknowledge support for the Article Processing Charge from the DFG (German Research Foundation, 491454339).
The authors declare that the research was conducted in the absence of any commercial or financial relationships that could be construed as a potential conflict of interest.
All claims expressed in this article are solely those of the authors and do not necessarily represent those of their affiliated organizations, or those of the publisher, the editors and the reviewers. Any product that may be evaluated in this article, or claim that may be made by its manufacturer, is not guaranteed or endorsed by the publisher.
1. Sung H, Ferlay J, Siegel RL, Laversanne M, Soerjomataram I, Jemal A, et al. Global cancer statistics 2020: GLOBOCAN estimates of incidence and mortality worldwide for 36 cancers in 185 countries. CA Cancer J Clin (2021) 71:209–49. doi: 10.3322/caac.21660
2. Arnold M, Laversanne M, Brown LM, Devesa SS, Bray F. Predicting the future burden of esophageal cancer by histological subtype: international trends in incidence up to 2030. Am J Gastroenterol (2017) 112:1247–55. doi: 10.1038/ajg.2017.155
3. van Hagen P, Hulshof MCCM, van Lanschot JJB, Steyerberg EW, van Berge Henegouwen MI, Wijnhoven BP, et al. Preoperative chemoradiotherapy for esophageal or junctional cancer. N Engl J Med (2012) 366:2074–84. doi: 10.1056/NEJMoa1112088
4. Al-Batran S-E, Hofheinz RD, Pauligk C, Kopp H-G, Haag GM, Luley KB, et al. Histopathological regression after neoadjuvant docetaxel, oxaliplatin, fluorouracil, and leucovorin versus epirubicin, cisplatin, and fluorouracil or capecitabine in patients with resectable gastric or gastro-esophageal junction adenocarcinoma (FLOT4-AIO): results from the phase 2 part of a multicenter, open-label, randomized phase 2/3 trial. Lancet Oncol (2016) 17:1697–708. doi: 10.1016/S1470-2045(16)30531-9
5. Kelly RJ, Ajani JA, Kuzdzal J, Zander T, van Cutsem E, Piessen G, et al. Adjuvant nivolumab in resected esophageal or gastroesophageal junction cancer. N Engl J Med (2021) 384:1191–203. doi: 10.1056/NEJMoa2032125
6. Ignatova EO, Kozlov E, Ivanov M, Mileyko V, Menshikova S, Sun H, et al. Clinical significance of molecular subtypes of gastrointestinal tract adenocarcinoma. World J Gastrointest Oncol (2022) 14:628–45. doi: 10.4251/wjgo.v14.i3.628
7. Integrated genomic characterization of esophageal carcinoma. Nature (2017) 541:169–75. doi: 10.1038/nature20805
8. Loeser H, Wölwer CB, Alakus H, Chon S-H, Zander T, Buettner R, et al. Y chromosome loss is a frequent event in barrett's adenocarcinoma and associated with poor outcome. Cancers (Basel) (2020) 12(7):1743. doi: 10.3390/cancers12071743
9. Plum PS, Gebauer F, Krämer M, Alakus H, Berlth F, Chon S-H, et al. HER2/neu (ERBB2) expression and gene amplification correlates with better survival in esophageal adenocarcinoma. BMC Cancer (2019) 19:38. doi: 10.1186/s12885-018-5242-4
10. Essakly A, Loeser H, Kraemer M, Alakus H, Chon S-H, Zander T, et al. PIK3CA and KRAS amplification in esophageal adenocarcinoma and their impact on the inflammatory tumor microenvironment and prognosis. Transl Oncol (2020) 13:157–64. doi: 10.1016/j.tranon.2019.10.013
11. Loeser H, Scholz M, Fuchs H, Essakly A, Damanakis AI, Zander T, et al. (ITGAV) expression in esophageal adenocarcinoma is associated with shortened overall-survival. Sci Rep (2020) 10:18411. doi: 10.1038/s41598-020-75085-7
12. Schallenberg S, Bork J, Essakly A, Alakus H, Buettner R, Hillmer AM, et al. Loss of the SWI/SNF-ATPase subunit members SMARCF1 (ARID1A), SMARCA2 (BRM), SMARCA4 (BRG1) and SMARCB1 (INI1) in oesophageal adenocarcinoma. BMC Cancer (2020) 20:12. doi: 10.1186/s12885-019-6425-3
13. Moentenich V, Comut E, Gebauer F, Tuchscherer A, Bruns C, Schroeder W, et al. Mesothelin expression in esophageal adenocarcinoma and squamous cell carcinoma and its possible impact on future treatment strategies. Ther Adv Med Oncol (2020) 12:1758835920917571. doi: 10.1177/1758835920917571
14. Plum PS, Löser H, Zander T, Essakly A, Bruns CJ, Hillmer AM, et al. GATA binding protein 6 (GATA6) is co-amplified with PIK3CA in patients with esophageal adenocarcinoma and is linked to neoadjuvant therapy. J Cancer Res Clin Oncol (2021) 147:1031–40. doi: 10.1007/s00432-020-03486-2
15. Schiffmann LM, Göbel H, Löser H, Schorn F, Werthenbach JP, Fuchs HF, et al. Elevated X-linked inhibitor of apoptosis protein (XIAP) expression uncovers detrimental prognosis in subgroups of neoadjuvant treated and T-cell rich esophageal adenocarcinoma. BMC Cancer (2019) 19:531. doi: 10.1186/s12885-019-5722-1
16. Moentenich V, Gebauer F, Comut E, Tuchscherer A, Bruns C, Schroeder W, et al. Claudin 18.2 expression in esophageal adenocarcinoma and its potential impact on future treatment strategies. Oncol Lett (2020) 19:3665–70. doi: 10.3892/ol.2020.11520
17. Melling N, Norrenbrock S, Kluth M, Simon R, Hube-Magg C, Steurer S, et al. p53 overexpression is a prognosticator of poor outcome in esophageal cancer. Oncol Lett (2019) 17:3826–34. doi: 10.3892/ol.2019.10020
18. Michalk M, Meinrath J, Künstlinger H, Koitzsch U, Drebber U, Merkelbach-Bruse S, et al. MDM2 gene amplification in esophageal carcinoma. Oncol Rep (2016) 35:2223–7. doi: 10.3892/or.2016.4578
19. Simon R, Mirlacher M, Sauter G. Tissue microarrays. Biotechniques (2004) 36:98–105. doi: 10.2144/04361RV01
20. Helbig D, Ihle MA, Pütz K, Tantcheva-Poor I, Mauch C, Büttner R, et al. Oncogene and therapeutic target analyses in atypical fibroxanthomas and pleomorphic dermal sarcomas. Oncotarget (2016) 7:21763–74. doi: 10.18632/oncotarget.7845
21. Wright DJ, Day FR, Kerrison ND, Zink F, Cardona A, Sulem P, et al. Genetic variants associated with mosaic Y chromosome loss highlight cell cycle genes and overlap with cancer susceptibility. Nat Genet (2017) 49:674–9. doi: 10.1038/ng.3821
22. Forsberg LA, Rasi C, Malmqvist N, Davies H, Pasupulati S, Pakalapati G, et al. Mosaic loss of chromosome Y in peripheral blood is associated with shorter survival and higher risk of cancer. Nat Genet (2014) 46:624–8. doi: 10.1038/ng.2966
23. Cestari R, Villanacci V, Rossi E, Della Casa D, Missale G, Conio M, et al. Fluorescence in situ hybridization to evaluate dysplasia in Barrett's esophagus: a pilot study. Cancer Lett (2007) 251:278–87. doi: 10.1016/j.canlet.2006.11.033
24. Cáceres A, Jene A, Esko T, Pérez-Jurado LA, González JR. Extreme downregulation of chromosome Y and cancer risk in men. J Natl Cancer Inst (2020) 112:913–20. doi: 10.1093/jnci/djz232
25. Dunn GP, Old LJ, Schreiber RD. The three Es of cancer immunoediting. Annu Rev Immunol (2004) 22:329–60. doi: 10.1146/annurev.immunol.22.012703.104803
26. Dunn GP, Bruce AT, Ikeda H, Old LJ, Schreiber RD. Cancer immunoediting: from immunosurveillance to tumor escape. Nat Immunol (2002) 3:991–8. doi: 10.1038/ni1102-991
27. Rathore AS, Kumar S, Konwar R, Makker A, Negi M, Goel MM. CD3+, CD4+ & CD8+ tumor infiltrating lymphocytes (TILs) are predictors of favorable survival outcome in infiltrating ductal carcinoma of breast. Indian J Med Res (2014) 140:361–9.
28. Tian C, Lu S, Fan Q, Zhang W, Jiao S, Zhao X, et al. Prognostic significance of tumor-infiltrating CD8+ or CD3+ T lymphocytes and interleukin-2 expression in radically resected non-small cell lung cancer. Chin Med J (Engl) (2015) 128:105–10. doi: 10.4103/0366-6999.147828
29. Mansuri N, Birkman E-M, Heuser VD, Lintunen M, Ålgars A, Sundström J, et al. Association of tumor-infiltrating T lymphocytes with intestinal-type gastric cancer molecular subtypes and outcome. Virchows Arch (2020) 478:707–17. doi: 10.1007/s00428-020-02932-3
30. Gabrielson A, Wu Y, Wang H, Jiang J, Kallakury B, Gatalica Z, et al. Intratumoral CD3 and CD8 T-cell densities associated with relapse-free survival in HCC. Cancer Immunol Res (2016) 4:419–30. doi: 10.1158/2326-6066.CIR-15-0110
31. Rusakiewicz S, Semeraro M, Sarabi M, Desbois M, Locher C, Mendez R, et al. Immune infiltrates are prognostic factors in localized gastrointestinal stromal tumors. Cancer Res (2013) 73:3499–510. doi: 10.1158/0008-5472.CAN-13-0371
32. Zhang L, Conejo-Garcia JR, Katsaros D, Gimotty PA, Massobrio M, Regnani G, et al. Intratumoral T cells, recurrence, and survival in epithelial ovarian cancer. N Engl J Med (2003) 348:203–13. doi: 10.1056/NEJMoa020177
33. Sjödahl G, Lövgren K, Lauss M, Chebil G, Patschan O, Gudjonsson S, et al. Infiltration of CD3+ and CD68+ cells in bladder cancer is subtype specific and affects the outcome of patients with muscle-invasive tumors. Urol Oncol (2014) 32:791–7. doi: 10.1016/j.urolonc.2014.02.007
34. Spanier G, Ugele I, Nieberle F, Symeou L, Schmidhofer S, Brand A, et al. The predictive power of CD3+ T cell infiltration of oral squamous cell tumors is limited to non-diabetic patients. Cancer Lett (2021) 499:209–19. doi: 10.1016/j.canlet.2020.11.029
35. Al-Rajhi N, Soudy H, Ahmed SA, Elhassan T, Mohammed SF, Khoja HA, et al. CD3+T-lymphocyte infiltration is an independent prognostic factor for advanced nasopharyngeal carcinoma. BMC Cancer (2020) 20:240. doi: 10.1186/s12885-020-06757-w
36. Galon J, Costes A, Sanchez-Cabo F, Kirilovsky A, Mlecnik B, Lagorce-Pagès C, et al. Type, density, and location of immune cells within human colorectal tumors predict clinical outcome. Science (2006) 313:1960–4. doi: 10.1126/science.1129139
37. Puli S-R, Reddy J-B, Bechtold M-L, Antillon D, Ibdah J-A, Antillon M-R. Staging accuracy of esophageal cancer by endoscopic ultrasound: a meta-analysis and systematic review. World J Gastroenterol (2008) 14:1479–90. doi: 10.3748/wjg.14.1479
38. van Vliet EPM, Heijenbrok-Kal MH, Hunink MG, Kuipers EJ, Siersema PD. Staging investigations for oesophageal cancer: a meta-analysis. Br J Cancer (2008) 98:547–57. doi: 10.1038/sj.bjc.6604200
Keywords: esophageal adenocarcinoma, Y chromosome loss, CD3 cell infiltration, UICC staging, prognosis
Citation: Raters VM, Gebauer F, Löser H, Schröder W, Schlösser HA, Fuchs H, Bruns C, Quaas A and Zander T (2023) Combined score of Y chromosome loss and T-cell infiltration improves UICC based stratification of esophageal adenocarcinoma. Front. Oncol. 13:1249172. doi: 10.3389/fonc.2023.1249172
Received: 28 June 2023; Accepted: 02 November 2023;
Published: 17 November 2023.
Edited by:
Qun Zhang, Nanjing Medical University, ChinaReviewed by:
Mehdi Montazer, Mashhad University of Medical Sciences, IranCopyright © 2023 Raters, Gebauer, Löser, Schröder, Schlösser, Fuchs, Bruns, Quaas and Zander. This is an open-access article distributed under the terms of the Creative Commons Attribution License (CC BY). The use, distribution or reproduction in other forums is permitted, provided the original author(s) and the copyright owner(s) are credited and that the original publication in this journal is cited, in accordance with accepted academic practice. No use, distribution or reproduction is permitted which does not comply with these terms.
*Correspondence: Thomas Zander, dGhvbWFzLnphbmRlckB1ay1rb2Vsbi5kZQ==
†These authors have contributed equally to this work
Disclaimer: All claims expressed in this article are solely those of the authors and do not necessarily represent those of their affiliated organizations, or those of the publisher, the editors and the reviewers. Any product that may be evaluated in this article or claim that may be made by its manufacturer is not guaranteed or endorsed by the publisher.
Research integrity at Frontiers
Learn more about the work of our research integrity team to safeguard the quality of each article we publish.