 Hubert Beaumont
 Antoine Iannessi
95% of researchers rate our articles as excellent or good
Learn more about the work of our research integrity team to safeguard the quality of each article we publish.
Find out more
ORIGINAL RESEARCH article
Front. Oncol. , 04 October 2023
Sec. Cancer Imaging and Image-directed Interventions
Volume 13 - 2023 | https://doi.org/10.3389/fonc.2023.1239570
This article is part of the Research Topic Imaging-Based Methodologies for Evaluating Drugs in Clinical Trials View all 3 articles
Background: In lung clinical trials with imaging, blinded independent central review with double reads is recommended to reduce evaluation bias and the Response Evaluation Criteria In Solid Tumor (RECIST) is still widely used. We retrospectively analyzed the inter-reader discrepancies rate over time, the risk factors for discrepancies related to baseline evaluations, and the potential of machine learning to predict inter-reader discrepancies.
Materials and methods: We retrospectively analyzed five BICR clinical trials for patients on immunotherapy or targeted therapy for lung cancer. Double reads of 1724 patients involving 17 radiologists were performed using RECIST 1.1. We evaluated the rate of discrepancies over time according to four endpoints: progressive disease declared (PDD), date of progressive disease (DOPD), best overall response (BOR), and date of the first response (DOFR). Risk factors associated with discrepancies were analyzed, two predictive models were evaluated.
Results: At the end of trials, the discrepancy rates between trials were not different. On average, the discrepancy rates were 21.0%, 41.0%, 28.8%, and 48.8% for PDD, DOPD, BOR, and DOFR, respectively. Over time, the discrepancy rate was higher for DOFR than DOPD, and the rates increased as the trial progressed, even after accrual was completed. It was rare for readers to not find any disease, for less than 7% of patients, at least one reader selected non-measurable disease only (NTL). Often the readers selected some of their target lesions (TLs) and NTLs in different organs, with ranges of 36.0-57.9% and 60.5-73.5% of patients, respectively. Rarely (4-8.1%) two readers selected all their TLs in different locations. Significant risk factors were different depending on the endpoint and the trial being considered. Prediction had a poor performance but the positive predictive value was higher than 80%. The best classification was obtained with BOR.
Conclusion: Predicting discordance rates necessitates having knowledge of patient accrual, patient survival, and the probability of discordances over time. In lung cancer trials, although risk factors for inter-reader discrepancies are known, they are weakly significant, the ability to predict discrepancies from baseline data is limited. To boost prediction accuracy, it would be necessary to enhance baseline-derived features or create new ones, considering other risk factors and looking into optimal reader associations.
In RECIST BICR trials with double reads there is large variability in tumor measurement and localization.
Discrepancy rates can be modeled over time.
Few discrepancies can be predicted from baseline evaluations.
In 2004, the Food and Drug Administration recommended double radiology reads for clinical trials with blinded independent central review (BICR) to minimize evaluation bias (1). Due to the variabilities in observers’ evaluations, diagnostic results can be discordant (2). In such situations, a third radiologist, the “adjudicator”, is required so that a final decision can be made (3). The rate of discordance (a.k.a. the adjudication rate), which is the number of discordant evaluations out of the total number of patients in the trial, is the preferred high-level indicator that summarizes the overall reliability of assessments of trials (4). The monitoring of observers’ variability through the adjudication rate requires a burdensome process, which all stakeholders aim to make cost-effective (5, 6), with the goal of minimizing inter-reader discordances.
The Response Evaluation Criteria In Solid Tumor (RECIST) (7) is widely used and accepted by regulatory authorities for evaluating the efficacy of oncology therapies in clinical trials with imaging. The very purpose of RECIST is to assign each patient to one of the classes of response to therapy: progressive disease (PD), stable disease (SD) or responders (partial or complete response [PR, CR]) (7). When categorized as PD, patients must be withdrawn from the study and their treatment stopped. Depending on the development phase of the drug (8), different trial endpoints can be derived from the RECIST assessments. Indeed, in phase 2, the study endpoint generally relates to response (responder vs non-responder) while in phase 3, it relates to progression. Each of these trial endpoints have their own statistical features linked to their respective kind of inter-reader discrepancy (KoD). Therefore, for a given trial, the most relevant KoD to monitor can differ from another trial.
During trials, patients undergo a sequential radiological RECIST 1.1 evaluation with a probability of discrepancy occurring at each radiological timepoint response (RTPR). We can hypothesize that each of the KoDs has a different likelihood of occurrence over time. We can also assume that “at-risk-periods” and “at-risk-factors” exist for discrepancies occurring during patient follow-up. From an operational standpoint, confirming these assumptions would be particularly relevant for BICR trials with double reads (3, 9).
Clinical trials can often take a long time to complete, during which changes may arise from various sources: readers may become more experienced, tumor shapes may complexify, or operational parameters may have unintended impacts. Thus, it is essential to assess the broad trends while the trial is in progress to gain insight into any potential changes that may have occurred and their effects on the trial’s ultimate results.
The issue around RECIST subjectivity has been widely discussed (10, 11) and there is consensus on risk factors related to disease evaluation at baseline. These risk factors can be grouped into tumor selection (12) and quantification (13). However, it is still unclear which of these risk factors most impact the response and how they interact with each other to allow prediction at baseline as to which reads are more likely to become discrepant at follow-up. In addition, a data-driven approach using machine learning (ML) could be an opportunity to test whether baseline-derived features are predictors of inter-reader discordances.
We conducted a retrospective analysis of inter-reader discrepancies in five BICR RECIST lung trials with double reads with three primary objectives: 1) to investigate the discrepancy rate over time, aiming to identify influential high-level factors, 2) to identify risk factors for discrepancies related to RECIST-derived features at baseline, and 3) to use confirmed risk factors for discrepancies to evaluate predictive models.
Our retrospective analysis included results from five BICR clinical trials (Trials 1-5) that evaluated immunotherapy or targeted therapy for lung cancer (Table 1). The selected BICR trials were conducted between 2017 and 2021 with double reads with adjudication based on RECIST 1.1 guidelines. All data were fully blinded regarding study sponsor, study protocol number, therapeutic agent, subject demographics, and randomization. For these five trials, a total of 1724 patients were expected, involving 17 radiologists. The central reads were all performed using the same radiological reading platform (iSee; Median Technologies, France).
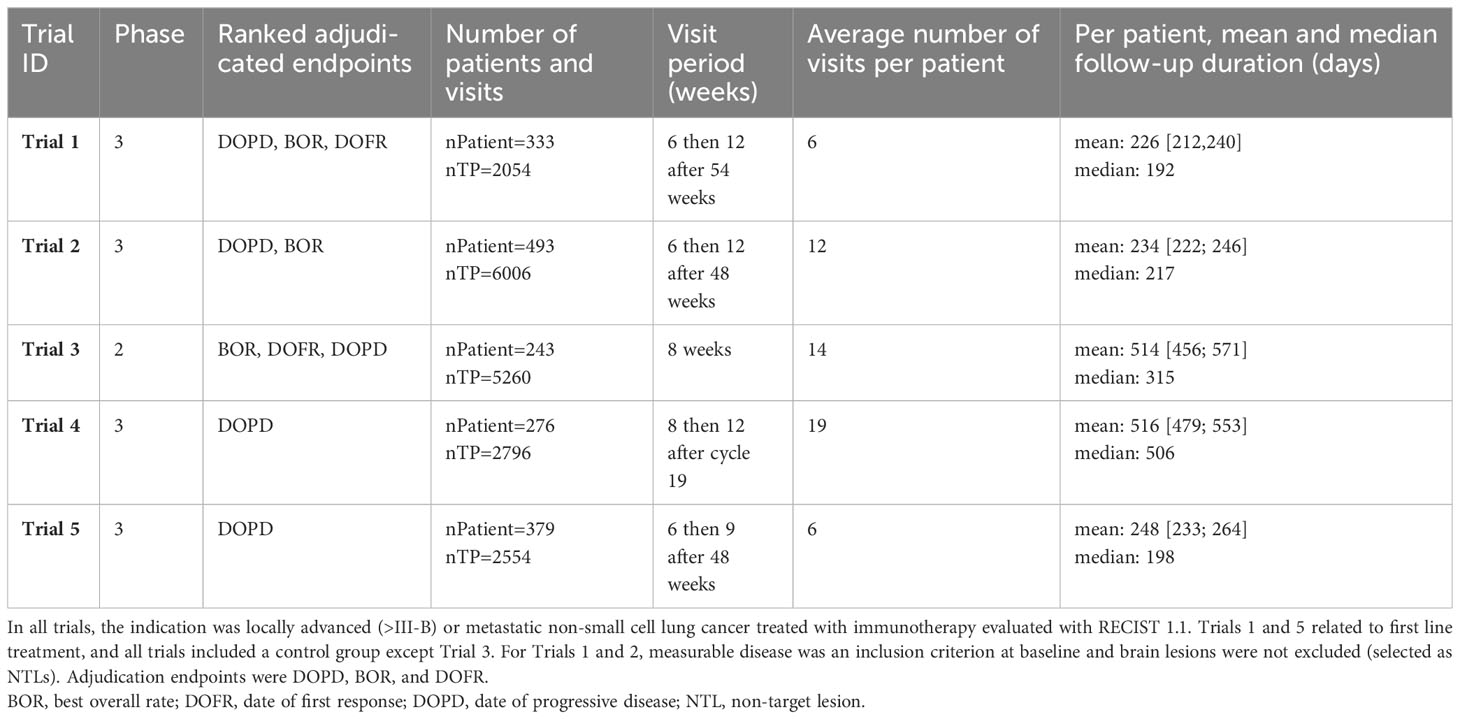
Table 1 Description of included trials.
Two independent radiologists performed the review of each image and determined the RTPR in accordance with RECIST 1.1. According to the trial’s endpoints (response or progression), specific KoDs triggered adjudications that were pre-defined in an imaging review charter. The adjudicator reviewed the response assessments from the two primary readers and endorsed the outcome of one of the readers, providing rationale to endorse the adjudicator’s assessment.
We considered four KoDs related to the standard endpoints used on trials:
A. Two related to event or time-to-event of disease progression:
1. Progressive disease declared (PDD): Discrepant PD detection when only one of the readers declared PD during the follow-up.
2. Date of progressive disease (DOPD): Discrepant dates of PD detection as either one reader did not detect PD at all during the follow-up or both readers declared a PD but at different dates.
B. Two related to event or time-to-event of disease response:
3. Best overall response (BOR): Discrepant reporting of the best among all overall responses (CR was best, followed by PR, SD, and then PD) during follow-up. To simplify the analysis, we adopted the definition of BOR from the RECIST group (7) but without response confirmation and minimal SD duration definition. This definition is also known as best time point response.
4. Date of first response (DOFR): Discrepant CR or PR of detection date as either one of the readers declared no CR or PR during the follow-up or both readers detected a first CR or PR but at different dates.
One example of patient follow-up with corresponding KoDs is provided in Table 2.
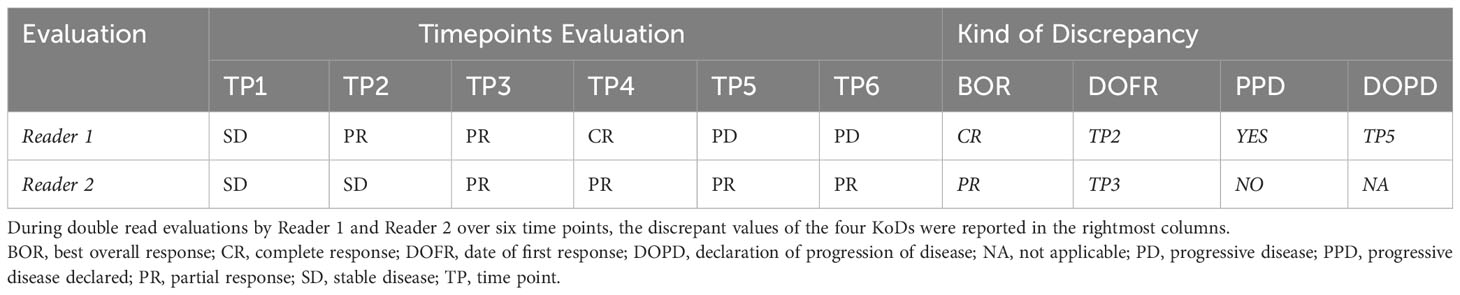
Table 2 Example of KoDs.
For each trial and KoD, our study addressed the distribution of the discrepancies, the risk factors for discrepancies, and their predictions:
a) The rate of discrepant patients
At trial completion (or near completion for Trial 1), we measured the ratio of the number of patients for whom a KoD was detected during their follow-up to the number of patients.
b) The rate of discrepant patients over time
The temporal discrepancy rate can be written as the cumulative function of the distribution of probability for discrepancy at each time point PDisc(t) multiplied by the survival curve Surv(t) (or drop out curve) and convolved by the function of the number of patients included at each time point PatIncl(t) (Equation 1).
For each KoD and for each trial, we analyzed the rate of discrepancies over time. This rate can be simply calculated as the ratio of the number of discrepant patients included from the beginning of the study to the number of patients included from the start of the study during the same period (Equation 2).
Where t is the time, t=0 at trial onset (first patient in).
c) The proportion of discrepancies occurring at each follow-up time
For each KoD and each trial, we computed the average proportion of discrepant patients occurring between two time points (Equation 3). These proportions, which are functions of the progression free survival (PFS) curve (therefore of the survival curve) and the probability of KoD occurrence during an interval of time, are displayed along with the proportions of patients still evaluated until this time point.
Where FU is an interval in patient follow-up time and t ranging [Baseline; FUmax] is the maximum follow-up duration measured in the study.
d) The probability of discrepancy during follow-up
For each KoD and each trial, as presented earlier in Equation 1, we provided the probability of a patient having a discrepant diagnosis during a given follow-up interval. We computed this probability as the ratio of the number of discrepant diagnoses to the number of patients that were evaluated during this follow-up interval of time (Equation 4).
Where FU is a given follow-up time point.
Our discrepancy analysis considered only patients who underwent at least one follow-up visit after baseline, for a clearer display, we resampled curves in a standardized time-frame of one month.
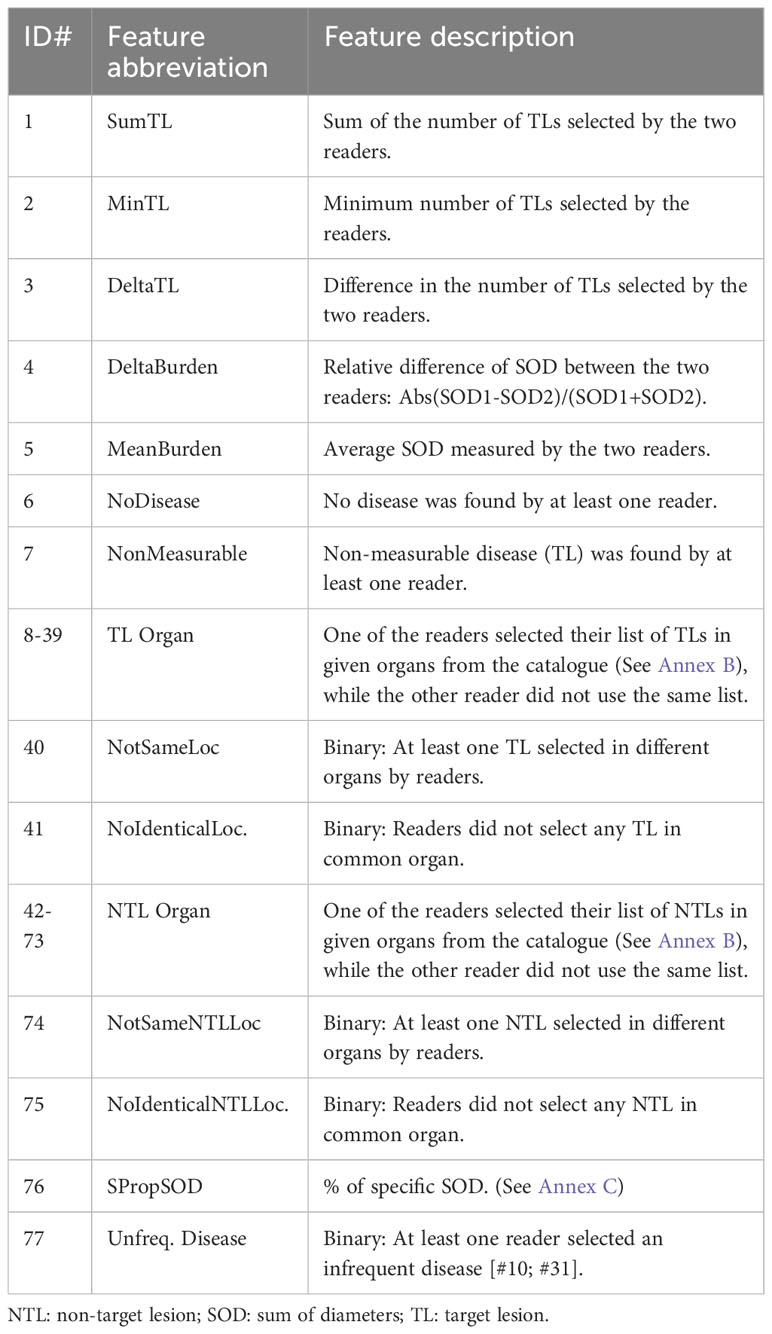
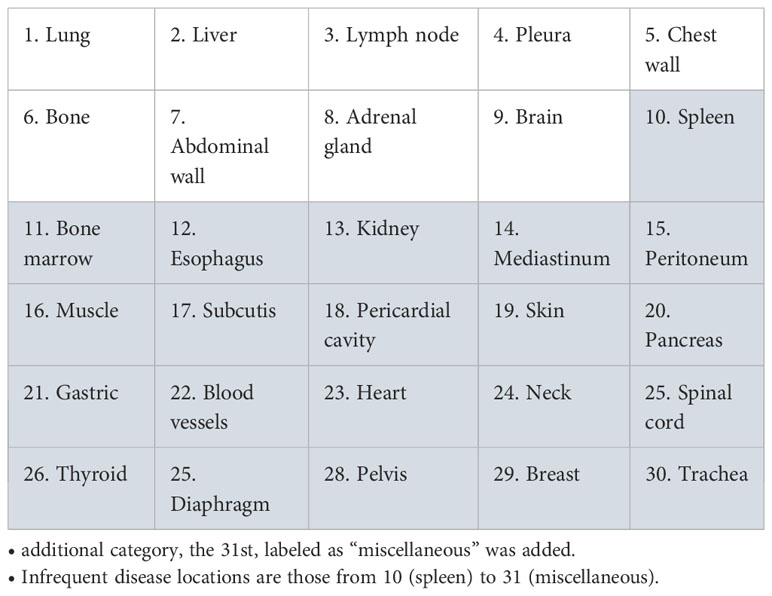
We wanted to identify the variabilities in the RECIST process of selection and/or measurement performed at baseline (Figure 1) which were likely to entail discrepancy in responses (Figure 2). For this aim, we arbitrarily considered risk factors likely 1) to quantify measurement variability at baseline in computing the Delta Burden between the two readers as the relative difference of their SOD (Abs(SOD1-SOD2)/(SOD1+SOD2)) and in measuring SPropSOD (Annex C); 2) to quantify the variability in TL selection at baseline in reporting when the two readers did not select their TLs in exactly the same organs, when they selected TLs in totally different organs, or when one of the reader selected a TL in a particularly infrequent location. We also reported when, at least, one of the readers did not select any TL at baseline. At least, we considered a risk factor when the two readers did not select all their NTL in the same organs. Comprehensive description of all the risk factors are provided in Annex A. By means of odds ratios (ODDs), we performed a univariate analysis testing associations between KoDs and a set of predefined features (14) (Annex A) derived from risk factors. These features applied to target lesions (TLs) and non-target lesions (NTLs) and were stratified according to the different diseased organs (See Annex B).
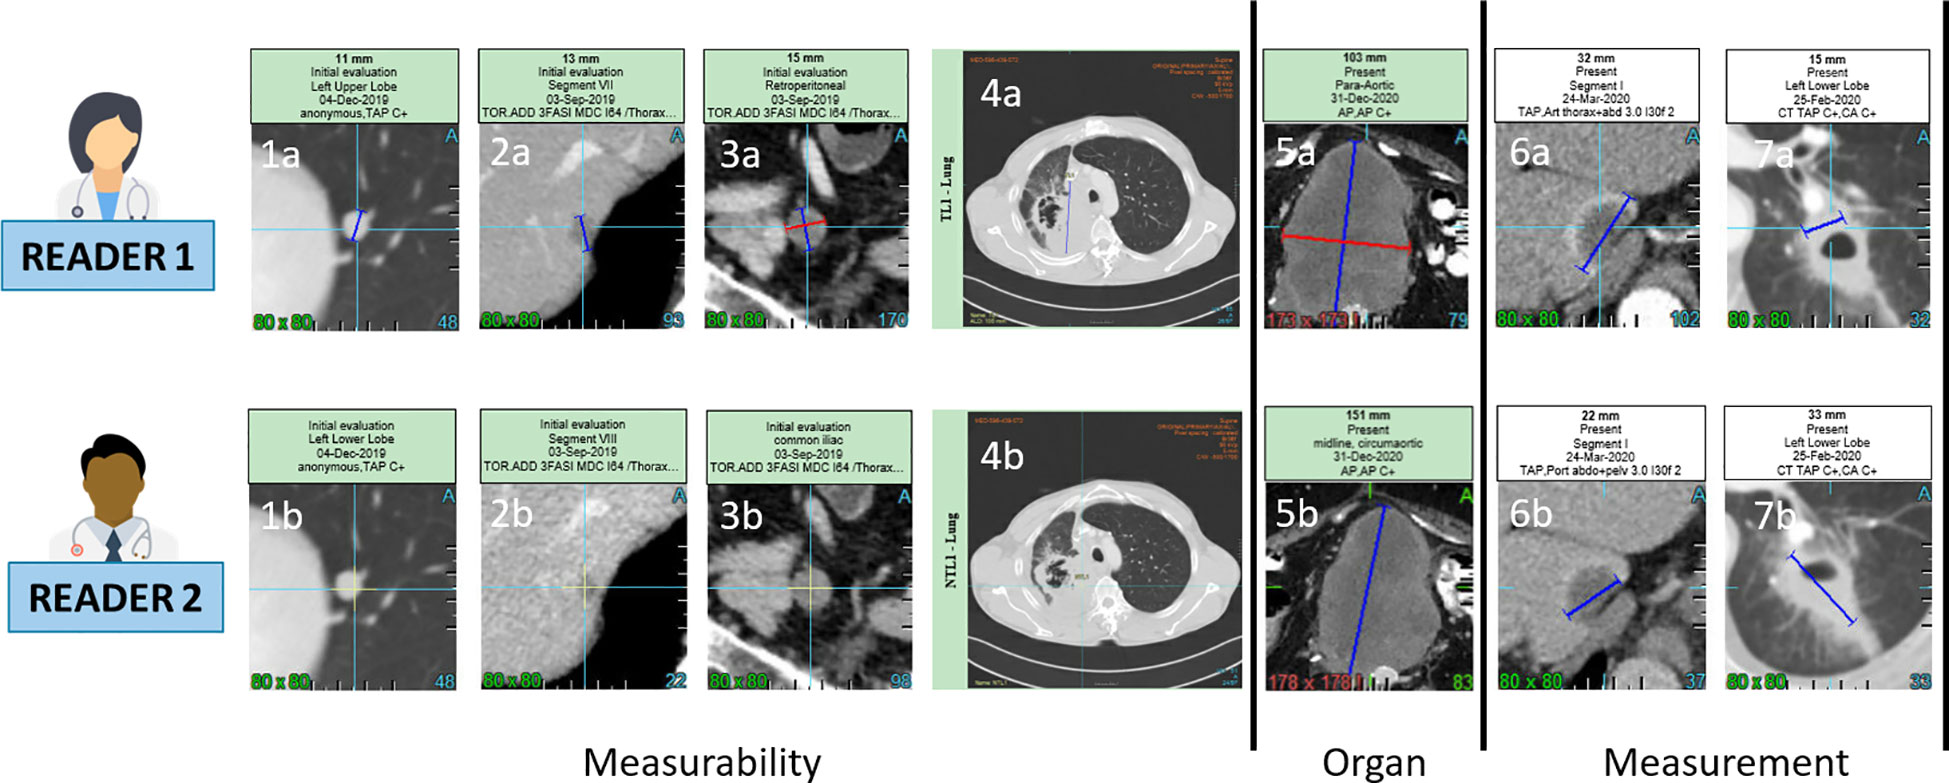
Figure 1 Inter-observer discrepancies at baseline. For a same lesion, two radiologist might consider non measureable a lesion due to its size not meeting the RECIST 1.1 measurability criteria of 1cm long axis for non lymph-node lesions (1a,1b,2a,2b) and 1.5cm short axis for lymph node (3a,3b). The measureability criteria can also be challenged for large lesions with ill defined margins and non robust measurement (4a,4b). Two radiologist might consider one same disease lesion belonging to lymph-node or not lymph-node organ resulting in a large measurement discrepancy due to the different method of measurement for the two type of organs (5a,5b). Measurement discrepancy can also be linked to the selected series for measurement such as arterial versus portal phase (6a,6b) or to the type of lesions such as cavitary lesions (7a,7b).
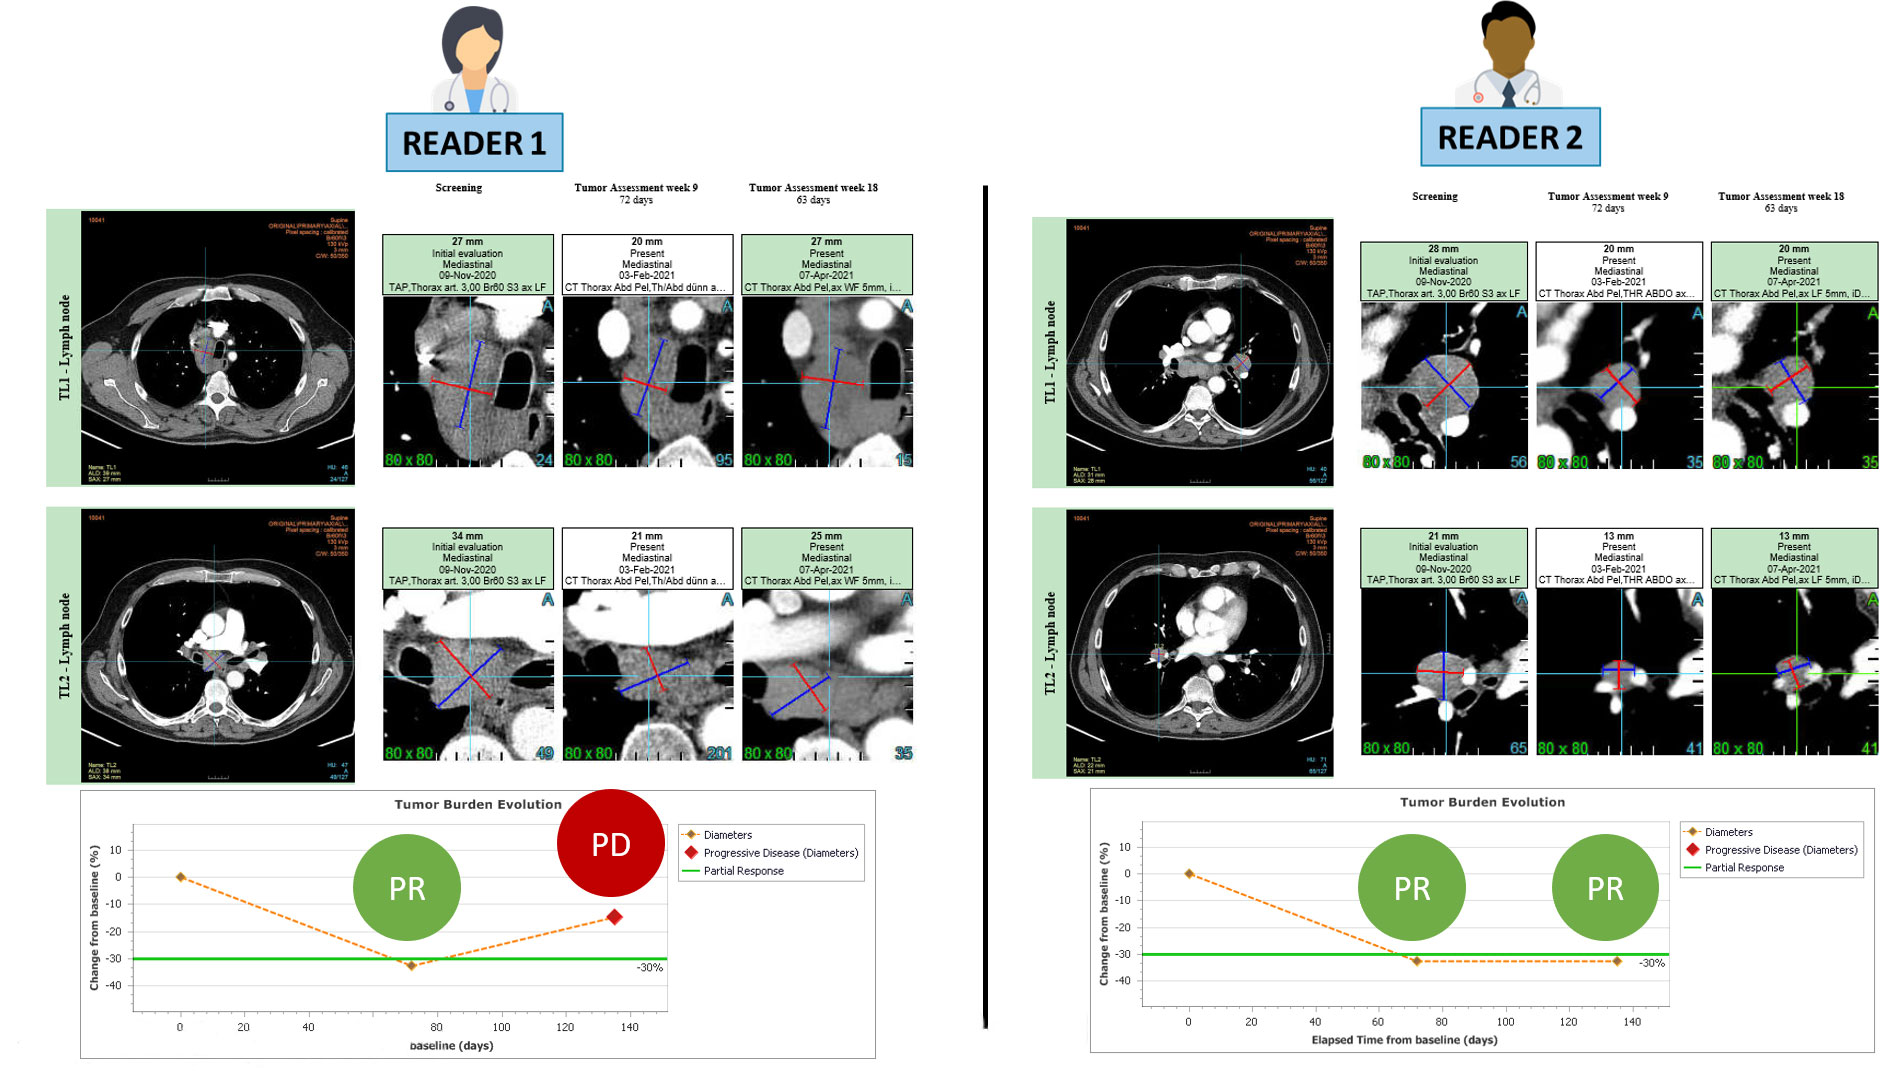
Figure 2 RECIST 1.1 inter-reader variability at baseline leading to endpoint discrepancy. The patient is presented at baseline with involvement of several mediastinal and hilar lymph nodes. Both readers followed RECIST 1.1 guidelines and accurately selected 2 large lymph nodes for measurement without any errors. During the follow-up period, both readers observed a partial response, with the first response documented in week 9. However, at week 18, the readers disagreed on the assessment of disease progression.
Since the association of a risk factor with a given outcome must be strong (ODD>10) to make classification effective (15), we used previously identified risk factors to train a ML model. After features reduction and classification, we documented the performances of two classification systems.
All statistics were performed using base version and packages from R CRAN freeware.
Confidence Intervals (CIs) of discrepancies rates were computed by Clopper-Pearson exact CI method (16). We used “PropCIs” package. Multiple comparisons of continuous variables were performed using the Dunnett-Tukey-Kramer method for unequal sample size (17) with “DTK” package. Multiple comparisons of proportions were performed using Marascuilo test (18).
We derived the proportions of detected KoDs from the 95th percentile of patient follow-up duration in trials and the 95th percentile of follow-up duration until the first occurrence of KoDs. ODDs were computed using “fmsb” package (19), with associated p-values for significant associations.
Continuous variables were analyzed using two samples non-parametric Wilcoxon test (discrepant versus non-discrepant patient groups).
A predictive model of discrepant patient evaluation was trained and tested in a cross-validation with 80:20 split setting. We reported classification accuracy when McNemar’s test indicated no significant bias in assessments due to imbalance in the data. We also reported the Area Under the Curve (AUC).
We evaluated the classification performances using two different algorithms: 1) a random forest (RF) algorithm (20) from the “caret” package after recursive feature elimination (21) and 2) a deep learning (DL) algorithm from the “h2o” package (22) after grid search. CIs were computed for AUC, accuracy (Acc), sensitivity (Se), specificity (Sp), positive predictive value (PPV), and negative predictive value (NPV) using the bootstrap method from the “DescTools” package.
Table 3 provides a summary of the KoD rates obtained at the end of each trial. Per KoD, Marascuilo tests yielded no significant inter-trial differences (p>0.05). The average discrepancy rates were 21.0% [19.1; 23.0%], 41.0% [38.7; 43.4%], 28.8 [26.6; 30.9], 48.8% [46.4; 51.2%] for PDD, DOPD, BOR, DOFR, respectively. When combining the data from all five trials, a multiple comparison test showed that there were significant differences between the two KoDs related to time (DOPD and DOFR) and the two KoDs related to the event (PDD and BOR). The discrepancy rate for PDD was lower than for the other KoDs.
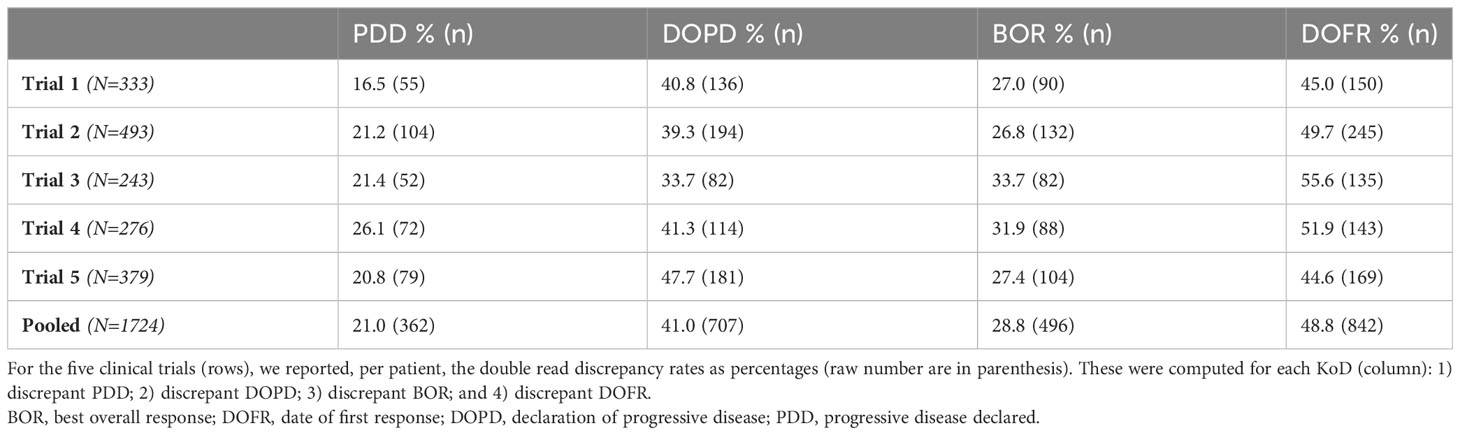
Table 3 Discrepancy rates at end of trial.
Figure 3 displays the discrepancy rates over time for the five trials and the different KoDs, showing that, most of the time, DOFR was higher than DOPD. We observed that the rates of all KoDs increased as the trial progressed, even long after the completion of patient accrual. The KoD curves did not always feature smooth variations, and the curves of accrual displayed different shapes. It seems that a significant patient recruitment immediately from the start of the study will guarantee early meaningful KoD curves.
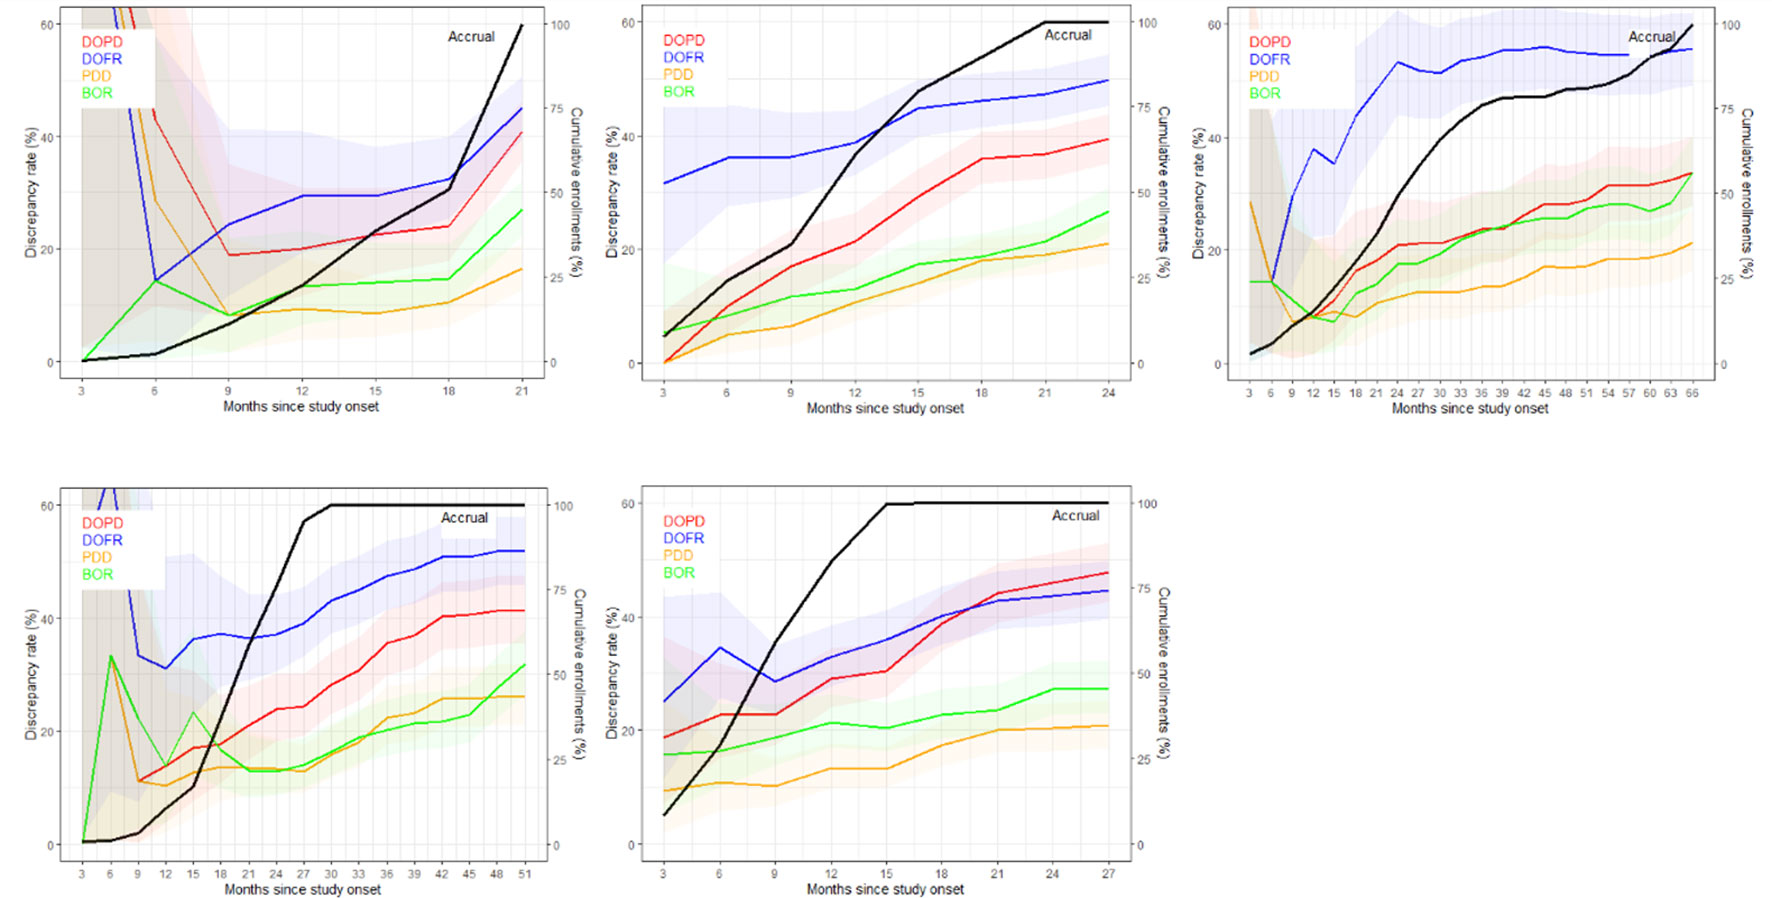
Figure 3 The discrepancy rate over time. The discrepancy rates for the four KoDs are displayed along with the proportion of accrued patients. Curves for DOPD, PDD, DOFR, and BOR KoDs are displayed in red, orange, blue, and green, respectively, with corresponding 95% CIs. The black curve is the cumulative proportion of accrued patients. The five trials are represented from top left to bottom right: a) Trial 1, b) Trial 2, c) Trial 3, d) Trial 4, and e) Trial 5 Time scale is one month.
As depicted in Figure 4, the ratio of KoD occurrence and the proportion of patients remaining at this time point followed a steady downward trend over time. At the outset of follow-up, proportionally more DOFR and BOR occurred than DOPD and PDD. Additionally, Figure 4 demonstrates that the decrease in the proportion of KoD occurrence had distinct patterns. For some trials (Trials 1, 2, and 5), the decrease had a tendency similar to the proportion of patients still present at this time, while for others, this was not the case (Trials 3 and 4).
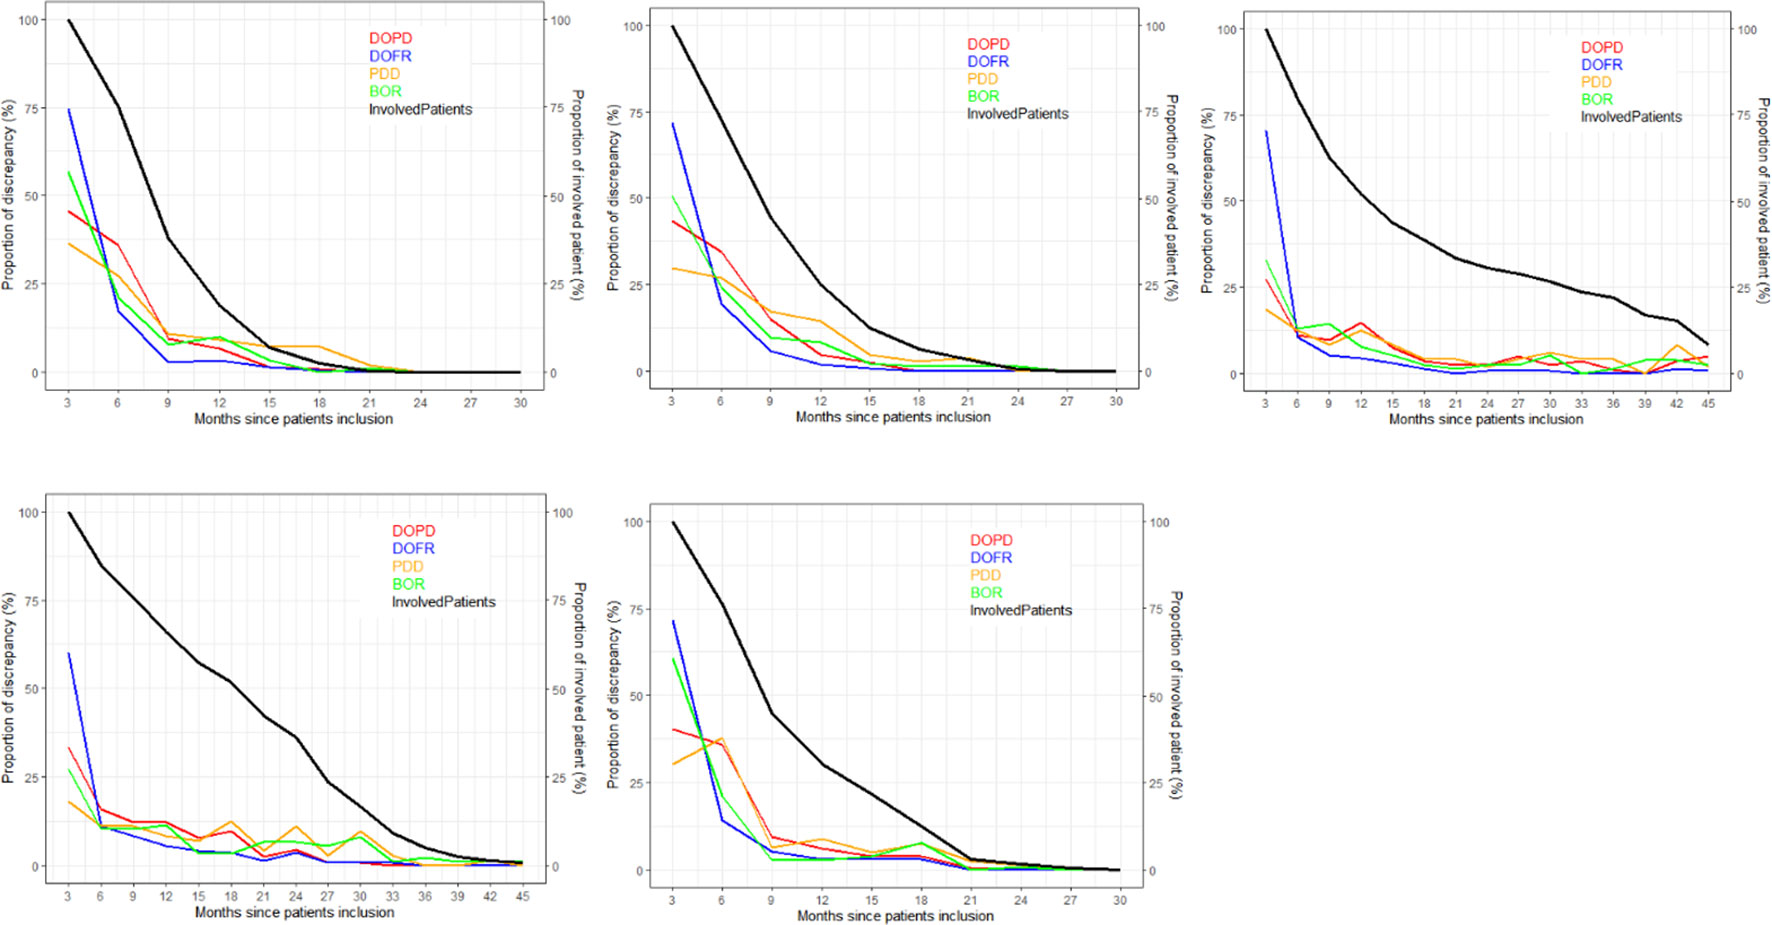
Figure 4 Proportion of discrepancies as distributed during follow-ups. For each trial and KoD, we computed the proportion of discrepancies (Equation 3) occurring at each follow-up. The DOPD, PDD, DOFR, and BOR KoDs are displayed in red, orange, blue, and green, respectively. The black curve displays the proportion of patients evaluated at this time point. BOR, best overall response; DOFR, date of first response; DOPD, declaration of progressive disease; KoD, kind of inter-reader discrepancy; PDD, progressive disease declared.
In Figure 5, we present the probability of KoDs occurring in relation to consecutive time points.
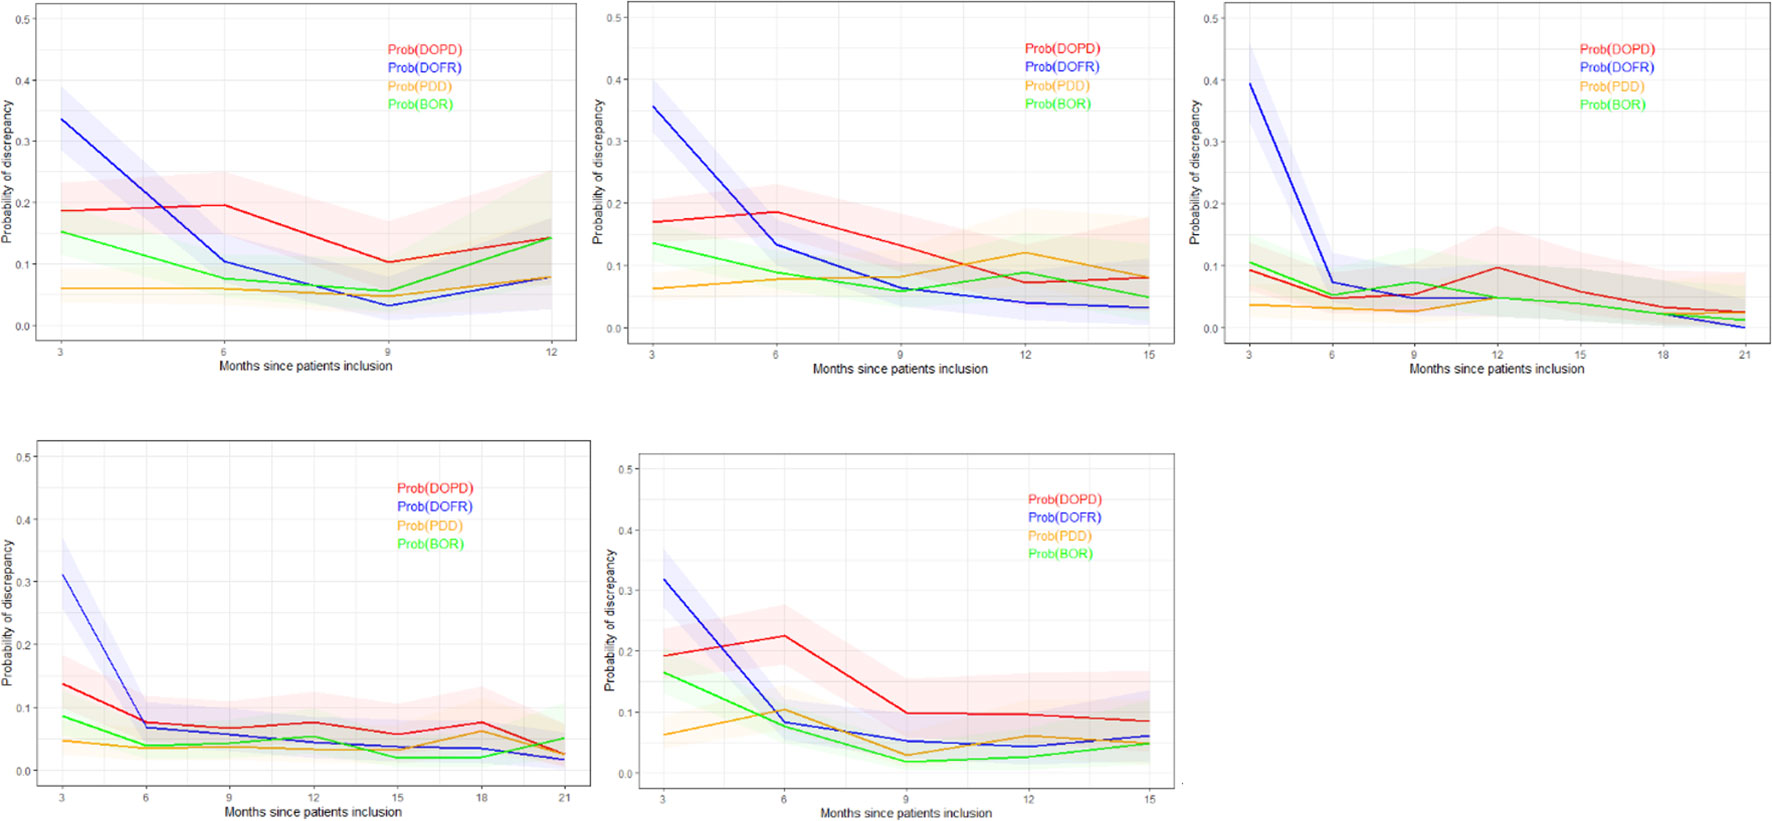
Figure 5 Probability of discrepancy over patients follow-up. The probability of discrepancy for the four KoDs is displayed. Probabilities of DOPD, PDD, DOFR, and BOR KoD occurrence are displayed in red, orange, blue, and green, respectively, with corresponding 95% CIs. The five trials are represented from top left to bottom right: a) Trial 1, b) Trial 2, c) Trial 3, d) Trial 4, and e) Trial 5. BOR, best overall response; CI, confidence interval; DOFR, date of first response; DOPD, declaration of progressive disease; KoD, kind of inter-reader discrepancy; PDD, progressive disease declared.
In Figure 5, we can see that the probability of discrepancies occurring with DOFR was significantly higher at the beginning of follow-up, but became closer to the other KoDs at the following time point.
After 6 months, the probabilities of Trial 3 and 4 KoDs were generally less than 10%. They were higher for other trials. DOFR was the most likely KoD in the initial part of the patient evaluation, and the ordering of KoDs was stable when considering phase 3 studies i.e., DOFR > DOPD > BOR > PDD.
Regarding progression-related KoDs, the probability of PDD at the patient level was quite stable over cycles while the probability of DOPD tended to decrease over cycles. PDD was also globally lower than the KoDs of response at the beginning of evaluations.
We found that for a single trial (Trial 3), one reader did not identify any disease in two patients out of 243 (0.8%), without any evidence that there was a significant risk factor of discrepancy, particularly for DOPD (p=0.68) or DOFR (p=0.1).
Except for Trial 3, classification of disease as non-measurable by at least one reader occurred in less than 7% of patients. It was very common for readers to select some of their TLs and NTLs in different organs, ranging from 36.0-57.9% and 60.5-73.5% of patients, respectively, but rarely (4.0-8.1%) did the two readers select all of their TLs in different locations.
We did not identify any set of risk factors which was relevant to all trials for a given KoD.
As summarized in Table 4, significant risk factors varied depending on the KoD and the trial examined. Analysis of pooled data revealed significant risk factors associated with BOR, whereas DOPD had a single risk factor (non-measurable disease reported by one reader) that could be identified at baseline. PDD had none. One or more readers choosing an infrequent disease location was not a risk factor for discrepancy.
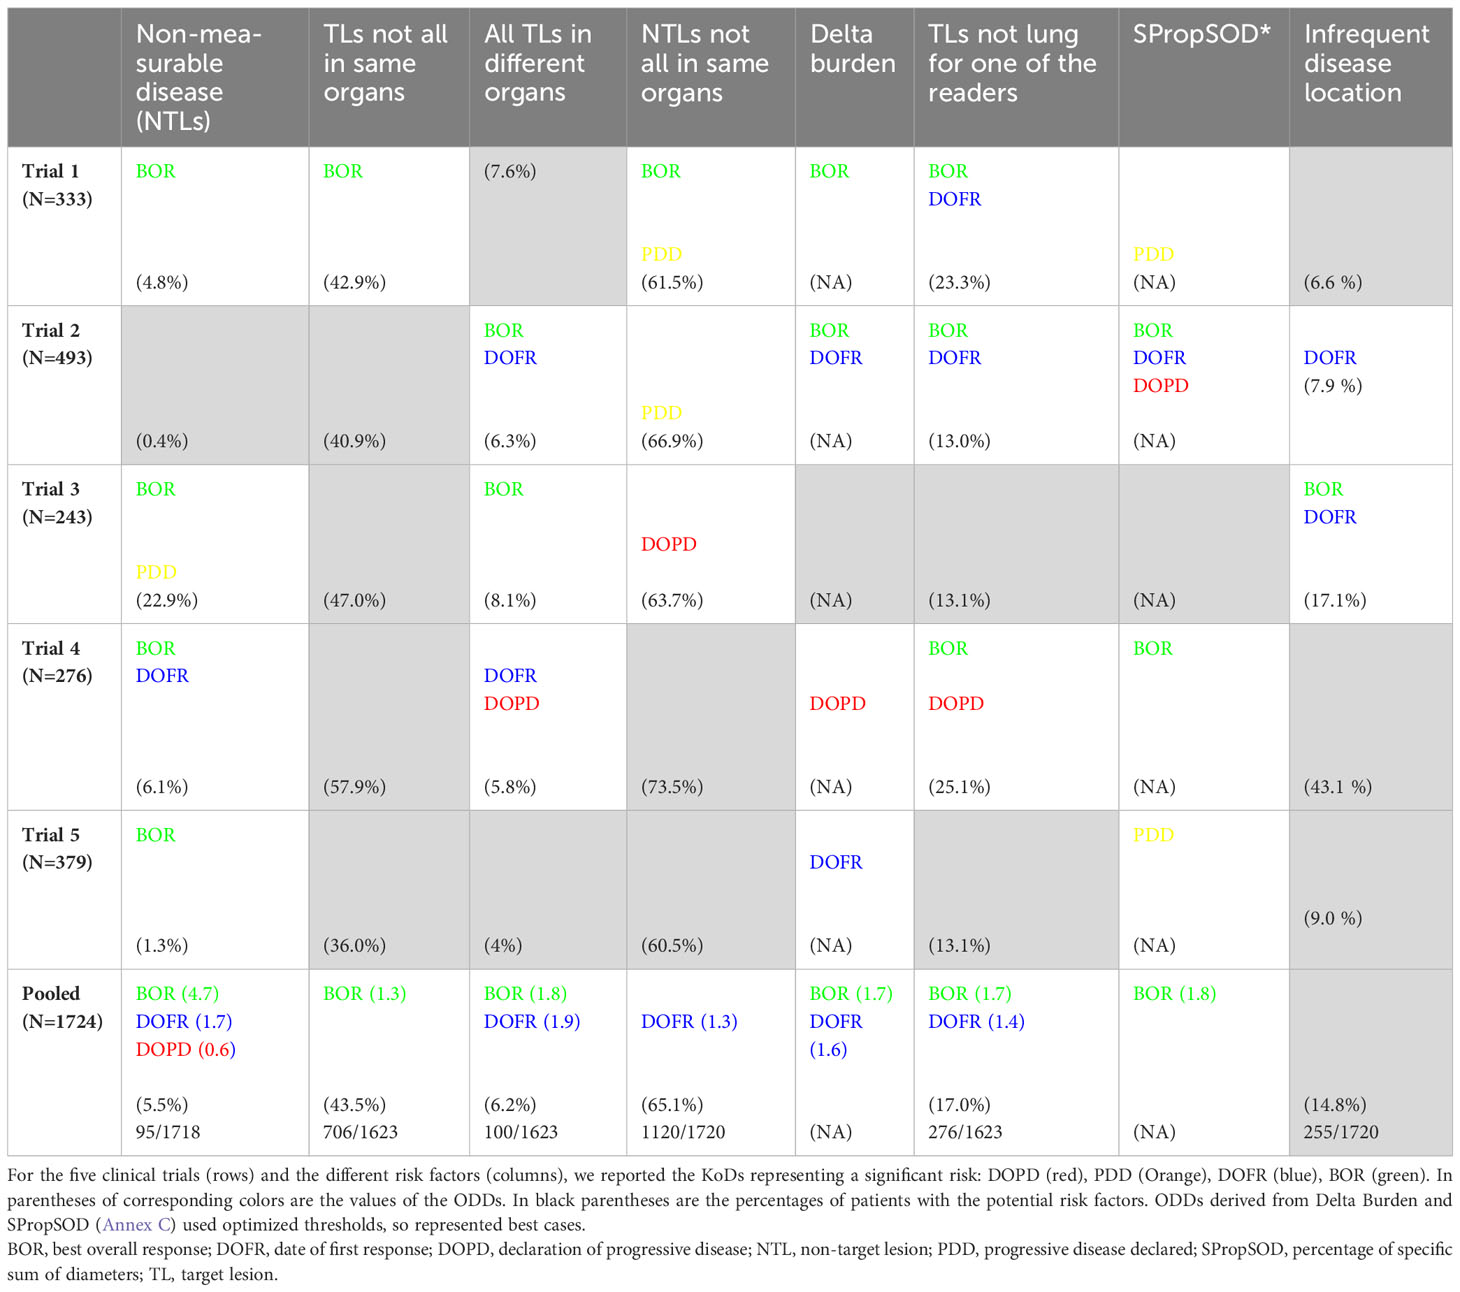
Table 4 Risks factors and occurrence of discrepancy.
Our risk factors analysis showed that progression-related KoDs were marginally impacted by baseline evaluation. Therefore, our evaluation of predictive models focused mainly on the response-related KoDs of DOFR and BOR.
Based on our features set (14), and a pre-processing of feature selection for RF algorithm, classification performances for response-related KoDs are summarized in Table 5. For each independent clinical trial or in pooled data, feature selection did not improve classification performances.
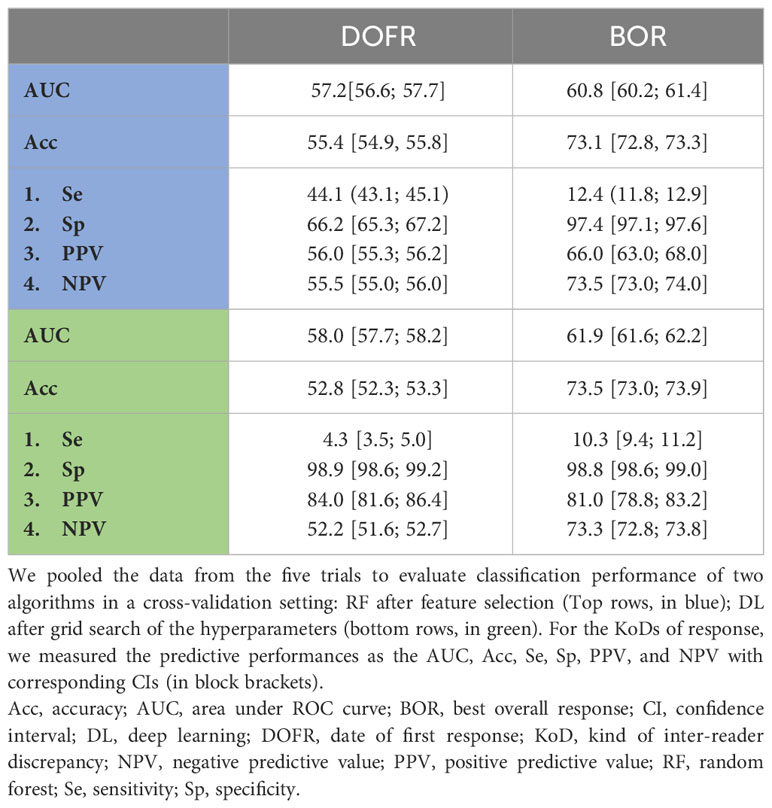
Table 5 Prediction of response KoDs derived from baseline features.
Using the validation dataset of pooled data, DL outperformed the RF algorithm. Performances with DL were poor but with a PPV higher than 80% for all the KoDs. The best classification performances were obtained with BOR based on AUC. For DOPD, AUCs was 57.3 [57.1; 57.5].
At completion of trials, discrepancy rates based on DOPD or DOFR were comparable across trials with respective average values of 41.0% and 48.8%. Over time, the rates of KoDs steadily increased as the trials progressed, even after the end of patient accrual. The discrepancy rates for the time-related endpoints, DOPD and DOFR, were always higher than their event-related PDD and BOR counterparts. A higher proportion for DOPD was expected as the counting of DOPD occurrences encompassed those of PDD. Translated into clinical study endpoints, these observations mean that discrepancy rates for overall response rate are generally higher than for PFS.
Assuming part of the discrepancies was attributable to a delayed event detection by one of the readers, it could be expected that the proportion of DOFR would be higher than DOPD at an earlier stage, as progressive patients were withdrawn from the trial; the only room for patient response was then before progression.
As Figures 3–5 show, the number of recruited patients, PatIncl(t), at each time point is an operational-related function that can significantly vary between trials and is difficult to predict. The survival curve, Surv(t) (and the PFS curve), however, is dependent on the drug and/or disease, and can be predicted to some degree. The likelihood of a discrepancy occurring at each time point is more of a measure of the reading process, which is partially dependent on the readers’ abilities and the complexity of the observed disease. To predict the rate of discrepancies over time, one must be able to completely regulate the trials, the drugs, and the readers’ performances. The mathematical formulation of the temporal discrepancy rate (Equation 1) helps us understand the intricacies of trials by breaking down the components that interact with one another. When the rate of discrepancies increases, it can be difficult to determine if the cause is a pattern of patient recruitment or if readers are simply more prone to making mistakes.
Regarding our risk factor analysis, we found that at least one reader not detecting disease when it was likely present was very rare and not a major concern. Selecting non-measurable disease (i.e., NTLs only) was more prevalent and was considered a significant risk when pooling the five trials.
The analysis of discrepancies between DOPD and DOFR showed that readers often selected TLs (43.5% of patients) or NTLs (65.3%) in different organs without being critical of discrepancies. When all the data were pooled, most of the risk factors were significant for BOR. Selecting non-measurable disease was the only risk factor for DOPD discrepancies. The selection of infrequent disease by any reader was not a risk factor regardless of the KoD.
Feature selection did not improve RF classification performance. DL slightly outperformed the RF algorithm but with globally poor classification performance. Best performances (AUC based) were reached in detecting BOR (61.9).
The discrepancy rates we found at end of trial agree with the literature (8, 23). Considering the naïve assumption of equiprobability between the four RECIST classes of response, the ranking of our measured discrepancies rates DR(DOFR) > DR(DOPD) are consistent with the basic rules of combinatory probabilities.
Most discrepancies occurring earlier for DOFR than for DOPD can be explained by the fact that a genuine response can only take place before a progression (except for pseudo progressions), because patients are withdrawn from trials after a PD.
As we observed in Figure 2, the ranking of KoD rates could change over time (crossing curves). This indicates that the probability of inter-reader discrepancy is not a stationary process in time (24). This factor should be considered when it comes to improving the modeling of trial monitoring, as illustrated by Equation 1, and when designing new metrics. The probability of PDD at each cycle seemed the most stable and lower than other KoDs.
The NTL category only determines three events: CR, PD, and stability (Not CR/Not PD). The PR event is only determined by measurable disease. In support of this finding, Raskin et al. (25) showed that NTLs were an important factor for detecting PD, while Park et al. (26) revealed that selecting metastasis-only lesions as TLs may be more effective for determining response in kidney disease.
In our observations, for more than 5% of patients, at least one reader did not detect any measurable disease, so only NTLs were selected. Under these conditions, it is not surprising to observe a significant correlation with the occurrence of a response-related KoD (Table 4).
Moreover, the NTL category theoretically includes less defined and smaller lesions, making them more equivocal during the first evaluation of the disease. The high prevalence of selected NTLs in different organs (65% of patients) reflects this uncertainty when capturing the disease at baseline. Lheureux et al. (27) developed a comprehensive discussion about the equivocality associated with RECIST, which is responsible for concerns related to its reliability. Moreover, during follow-up, due to the “under-representation” of this category and the qualitative appreciation of non-measurable disease, RECIST recommends interpreting progression of NTLs by considering the entire disease. Indeed, it is rare to observe a PD event triggered solely by the NTL category. This is reported during paradoxical progression in approximately 10% of progression cases (28). Finally, since the CR event is quite rare in our patients in advanced clinical stage, the influence of a difference in the appreciation of the non-measurable disease ultimately presents little risk in terms of variability on the study’s endpoints. Cases that are ultimately more at risk relate to patients with a low measurable tumor mass compared to the non-measurable disease. However, the detection of these cases is very difficult in the absence of quantification of NTLs [see scenario F in the supplementary appendix of Seymour et al. (29)].
We showed that readers selected TLs in different organs in 36.0% to 57.9% of patients, with no association with DOPD or DOFR discrepancies and poor association with BOR.
In the study by Keil et al. (12), for 39% of patients, readers had chosen different TLs, demonstrating a strong association with DOPD. Keil et al. had different study inclusion criteria, considering breast cancer, a single follow-up, no new target and no NTLs. Their mean number of TLs was 1.8 (2.3 in our study). Keil et al. adopted a strict definition of “same TLs” as those with the same coordinates, whereas ours was for those chosen in the same organ.
Kuhl et al. (30) reported higher discrepancy rates than us (27% for DOPD). Readers selected different sets of TLs in 60% of patients with even a stronger association with readers’ disagreement than Keil et al. Kuhl et al. adopted an even stricter definition of concordant selection than Keil et al. Kuhl et al. also included a broad spectrum of primary cancers.
Our study confirmed findings by Sharma et al. (31) who concluded that there was an association of the variability of SOD at baseline with the variability of the study endpoint. However, our percentage of specific sum of diameters (SPropSOD) analysis did not confirm or contradict other works about dissociated responses (28, 32), probably because this phenomenon is reportedly observed in only around 10% of cases (28).
Regarding discrepancies in targeting the most frequent location, this was poorly associated with variability of responses. We considered five primary lung cancer trials, but for 17% of the patients, at least one reader did not select any lung TL.
Regarding discrepancies in identifying disease (TL or NTL) in infrequent locations, surprisingly we found no risk factors associated, although some authors discuss the controversial use of RECIST outside the most targeted disease locations (33).
Several studies (34, 35) have documented that more than half of discrepancies in reporting progressing disease are triggered by debatable detection of new lesions. Thus, they are not concerned with baseline evaluations, preventing prediction from baseline. Unlike Keil et al. (12), we did not measure a systematic risk factor associated with TL selection. The only exception was in a specific trial (Trial 4), when readers selected all of their TLs from completely different organs.
According to Corso et al. (20), feature selection does not improve classification performances. For all the KoDs, DL outperformed RF. Overall, classification performance was low. Specifically regarding detection of DOPD, our findings were consistent with studies that reported that the majority of DOPD discrepancies were due to the misdetection of new lesions (34), which is not linked to baseline. The best classification performances were obtained for BOR, albeit with poor performances.
Even though certain studies suggest that baseline selection and measurement have considerable influence on the accuracy of response assessment (12, 13), we found that, while they existed, these correlations were weak and heterogeneous. Therefore, additional root causes of variability could be studied, such as follow-up management (e.g., measurement variability of tumor burden or perception of NTL change), readers’ associations, or fluctuating readers’ perception (35). We also need to investigate the gap between selecting “exactly the same TLs” and “TLs in same organs”, as the first definition is reported to have a strong association with variability in literature (36), while we found the second has a weak association. If strong heterogeneity within the same organ is confirmed, the issue of RECIST is no longer its subjectivity but its intrinsic inappropriateness in assessing patient follow-up.
First, we did not document some well-known risk factors for variability linked to image quality, such as variability due to reconstruction parameters (different image selection) or the timing in IV contrast injection. Indeed, we assumed that the imaging charter of the included trial adequately standardized the images so that these risks associated with these factors would be negligible.
Second, we did not analyze the impact of the selection of the same TLs by readers. When designing our study, we did not expect that collecting tumor coordinates would be of interest but assumed that checking the association with TLs in the same organ would be adequate.
Third, we did not investigate the impact of the inter-reader variability in assessing the “measurability” of tumor. Indeed, when a first reader considers a tumor as measurable and candidate to be TL included in his tumor burden, while the second reader considers the same tumor as NTL, the two readers would have a different in sensitivity at detecting responses.
Fourth, our study focused on lung data, therefore cannot be generalized to other diseases. For some other types of cancers CT is not the preferred modality, the disease spread differently, and the tumors feature different phenotypes, thus risk factors and training performances would be different.
Lastly, as we were blinded as to randomization, we were not able to refine our analysis by treatment/control. However, we can assume that KoD statistics and association with variability is different for treatment and control as those statistics are directly linked to the occurrence of the events of response or progression, supposedly different for the two arms.
Throughout the initial cycles of BICR with double reads, the rate of discrepancies is hard to analyze without a benchmark to refer to. This leads researchers to search for other key performance indicators to assess trial reliability and, eventually, take corrective measures as expeditiously as possible.
Even though we were not able to make powerful predictions, our analysis of the baseline data revealed that some inter-reader differences can affect the reliability of trial results. A tracking of baseline assessment during BICR could be a beneficial addition to trial quality control.
The poor predictive performances were probably, in part, obtained because a predictive model cannot avoid including follow up data. Another hypothesis could be that, based only on baseline data, the risk factors, and the features we considered were unable to fully capture the complexity of disagreements. In the future, we can imagine improving the features derived from tumor selection or even creating new ones; considering other risk factors in the classification, such as variability in scan selection or variabilities in involving the first follow-up and optimizing readers’ associations. However, an open question will remain: “How can we manage a baseline assessment with a high probability of becoming discrepant?”. If future technologies can predict discrepancies, it is likely to be a prediction with limited explicability. Moreover, we can question whether the 2 + 1 adjudication paradigm is obsolete, as choosing between two medically justifiable differences (2) does not make sense.
For the discordance rate to be predictable over time, at each time point, we need to know patient accrual, patient survival, and probability of discrepancy. Discrepancies in date of responses occurred more often than those related to progressions. Careful thought should be given to corrective actions based on the analysis of KoD rates if less than 50% of patients have been enrolled.
Several risk factors for inter-reader discrepancies have been confirmed, albeit with relatively weak implications. We found that for around 50% of patients, readers chose tumors in different organs without impacting the variability of responses. The prediction performances of inter-reader discrepancies based on the baseline selection were poor. Baseline-derived features should be improved or new ones designed, other risks factors must be considered for predicting discordances, and optimal reader association must be investigated.
1) The discrepancy rate over time depends on patient accrual, PFS, and the probability of discrepancy during follow-up.
2) At the outset of follow-up, proportionally more DOFR and BOR occurs than DOPD and PDD.
3) The KoD rates are not stabilized in the first half period of total patient inclusion and should be interpreted carefully. Baseline variability evaluation can help to determine risk of study endpoint variability.
4) The inter-reader variability in disease selection at baseline is frequent (50%). The general impact on the variability is more significant for response endpoints.
The data analyzed in this study is subject to the following licenses/restrictions: Data set are proprietary to sponsors. Requests to access these datasets should be directed to https://clinicaltrials.gov.
HB: Conceptualization, methodology, data curation, formal analysis, original draft, writing, review, and editing. AI: Conceptualization, methodology, formal analysis, project administration, original draft, review, and editing. Both authors contributed to the article and approved the submitted version.
The authors declare that no financial support was received for the research, authorship, and/or publication of this article.
We would like to thank José Luis Macias and Sebastien Grosset for their continued support and commitment.
HB and AI are employees at Median Technologies.
All claims expressed in this article are solely those of the authors and do not necessarily represent those of their affiliated organizations, or those of the publisher, the editors and the reviewers. Any product that may be evaluated in this article, or claim that may be made by its manufacturer, is not guaranteed or endorsed by the publisher.
Acc, Accuracy; AUC, Area Under the ROC Curve; BOR, Best Overall Response; BICR, Blinded Independent Central Review; CI, Confidence Interval; CR, Complete Response; DOFR, Date Of First Response; DOPD, Date of Progressive Disease; DR, Discrepancy Rate; KoD, Kind of Inter-Reader Discrepancy; ML, Machine Learning; NPV, Negative Predictive Value; NTL, Non-Target Lesion; ODD, Odds Ratio; PD, Progressive Disease; PDD, Progressive Disease Declared; PFS, Progression Free Survival; PPV, Positive Predictive Value; PR, Partial Response; RECIST, Response Evaluation Criteria In Solid Tumor; RF, Random Forest; RTPR, Radiological Time Point Response; SD, Stable Disease; SOD, Sum Of Diameters; SPropSOD, Percentage of Specific Sum of Diameters; Se, Sensitivity; Sp, Specificity; TL, Target Lesion; ML, Machine Learning; NPV, Negative Predictive Value; NTL, Non-Target Lesion.
1. Lauritzen PM, Andersen JG, Stokke MV, Tennstrand AL, Aamodt R, Heggelund T, et al. Radiologist-initiated double reading of abdominal CT: Retrospective analysis of the clinical importance of changes to radiology reports. BMJ Qual Saf (2016) 25:595–603. doi: 10.1136/bmjqs-2015-004536
2. Beaumont H, Iannessi A, Wang Y, Voyton CM, Cillario J, Liu Y. Blinded independent central review (BICR) in new therapeutic lung cancer trials. Cancers (Basel) (2021) 13:4533. doi: 10.3390/cancers13184533
3. Kahan BC, Feagan B, Jairath V. A comparison of approaches for adjudicating outcomes in clinical trials. Trials (2017) 18:1–14. doi: 10.1186/s13063-017-1995-3
4. Ford R, O’ Neal M, Moskowitz S, Fraunberger J. Adjudication rates between readers in blinded independent central review of oncology studies. J Clin Trials (2016) 6:289. doi: 10.4172/2167-0870.1000289
5. Geijer H, Geijer M. Added value of double reading in diagnostic radiology,a systematic review. Insights Imaging (2018) 9:287–301. doi: 10.1007/s13244-018-0599-0
6. Taylor-Phillips S, Stinton C. Double reading in breast cancer screening: Considerations for policy-making. Br J Radiol (2020) 93(1106):20190610. doi: 10.1259/bjr.20190610
7. Eisenhauer E A, Therasse P, Bogaerts J, Schwartz LH, Sargent D, Ford R, et al. New response evaluation criteria in solid tumours: Revised RECIST guideline (version 1.1). Eur J Cancer (2009) 45:228–47. doi: 10.1016/j.ejca.2008.10.026
8. Schmid AM, Raunig DL, Miller CG, Walovitch RC, Ford RW, O’Connor M, et al. Radiologists and clinical trials: part 1 the truth about reader disagreements. Ther Innov Regul Sci (2021) 55(6):1111–21. doi: 10.1007/s43441-021-00316-6
9. Granger CB, Vogel V, Cummings SR, Held P, Fiedorek F, Lawrence M, et al. Do we need to adjudicate major clinical events? Clin Trials (2008) 5:56–60. doi: 10.1177/1740774507087972
10. Morse B, Jeong D, Ihnat G, Silva AC. Pearls and pitfalls of response evaluation criteria in solid tumors (RECIST) v1.1 non-target lesion assessment. Abdom Radiol (2019) 44:766–74. doi: 10.1007/s00261-018-1752-4
11. Iannessi A, Beaumont H, Liu Y, Bertrand AS. RECIST 1.1 and lesion selection: How to deal with ambiguity at baseline? Insights Imaging (2021) 12(1):36. doi: 10.1186/s13244-021-00976-w
12. Keil S, Barabasch A, Dirrichs T, Bruners P, Hansen NL, Bieling HB, et al. Target lesion selection: an important factor causing variability of response classification in the Response Evaluation Criteria for Solid Tumors 1.1. Invest Radiol (2014) 49:509–17. doi: 10.1097/RLI.0000000000000048
13. Yoon SH, Kim KW, Goo JM, Kim D-W, Hahn S. Observer variability in RECIST-based tumour burden measurements: a meta-analysis. Eur J Cancer (2016) 53:5–15. doi: 10.1016/j.ejca.2015.10.014
14. Iannessi A, Beaumont H. Breaking down the RECIST 1.1 double read variability in lung trials: What do baseline assessments tell us? Front Oncol (2023) 13:988784. doi: 10.3389/fonc.2023.988784
15. Pepe MS, Janes H, Longton G, Leisenring W, Newcomb P. Limitations of the odds ratio in gauging the performance of a diagnostic, prognostic, or screening marker. Am J Epidemiol (2004) 159:882–90. doi: 10.1093/aje/kwh101
16. Clopper CJ, Pearson ES. THE USE OF CONFIDENCE OR FIDUCIAL LIMITS ILLUSTRATED IN THE CASE OF THE BINOMIAL. Biometrika (1934) 26:404–13. doi: 10.1093/biomet/26.4.404
17. Hayter AJ. A proof of the conjecture that the tukey-kramer multiple comparisons procedure is conservative. Ann Stat (1984) 12:590–606. doi: 10.1214/aos/1176346392
18. Marascuilo LA. Extensions of the significance test for one-parameter signal detection hypotheses. Psychometrika (1970) 35:237–43. doi: 10.1007/BF02291265
19. Stang A, Kenneth J. Rothman: epidemiology. An introduction. Eur J Epidemiol (2012) 27:827–9. doi: 10.1007/s10654-012-9732-4
20. Corso F, Tini G, Lo Presti G, Garau N, De Angelis SP, Bellerba F, et al. The challenge of choosing the best classification method in radiomic analyses: Recommendations and applications to lung cancer CT images. Cancers (Basel) (2021) 13:3088. doi: 10.3390/cancers13123088
21. Guyon I, Weston J, Barnhill S, Vapnik V. Gene selection for cancer classification using support vector machines. Mach Learn (2002) 46:389–422. doi: 10.1023/A:1012487302797
22. Aiello S, Eckstrand E, Fu E, Landry M, Aboyoun P. Machine Learning with R and H2O (2022). Available at: http://h2o.ai/resources/.
23. Rosenkrantz AB, Duszak R, Babb JS, Glover M, Kang SK. Discrepancy rates and clinical impact of imaging secondary interpretations: A systematic review and meta-analysis. J Am Coll Radiol (2018) 15:1222–31. doi: 10.1016/j.jacr.2018.05.037
24. Gibson EJ, Begum N, Koblbauer I, Dranitsaris G, Liew D, McEwan P, et al. Cohort versus patient level simulation for the economic evaluation of single versus combination immuno-oncology therapies in metastatic melanoma. J Med Econ (2019) 22:531–44. doi: 10.1080/13696998.2019.1569446
25. Raskin S, Klang E, Amitai M. Target versus non-target lesions in determining disease progression: analysis of 545 patients. Cancer Imaging (2015) 15:2015. doi: 10.1186/1470-7330-15-s1-s8
26. Park I, Park K, Park S, Ahn Y, Ahn JH, Choi HJ, et al. Response evaluation criteria in solid tumors response of the primary lesion in metastatic renal cell carcinomas treated with sunitinib: Does the primary lesion have to be regarded as a target lesion? Clin Genitourin Cancer (2013) 11:276–82. doi: 10.1016/j.clgc.2012.12.005
27. Lheureux S, Wilson MK, O’Malley M, Sinaei M, Oza AM. Non-target progression - The fine line between objectivity and subjectivity. Eur J Cancer (2014) 50:3271–2. doi: 10.1016/j.ejca.2014.08.021
28. Humbert O, Chardin D. Dissociated response in metastatic cancer: an atypical pattern brought into the spotlight with immunotherapy. Front Oncol (2020) 10:566297. doi: 10.3389/fonc.2020.566297
29. Seymour L, Bogaerts J, Perrone A, Ford R, Schwartz LH, Mandrekar S, et al. iRECIST: guidelines for response criteria for use in trials testing immunotherapeutics. Lancet Oncol (2017) 18:e143–52. doi: 10.1016/S1470-2045(17)30074-8
30. Kuhl CK, Alparslan Y, Schmoee J, Sequeira B, Keulers A, Brümmendorf TH, et al. Validity of RECIST version 1.1 for response assessment in metastatic cancer: A prospective, multireader study. Radiology (2019) 290:349–56. doi: 10.1148/radiol.2018180648
31. Sharma M, Singareddy A, Bajpai S, Narang J, O’Connor M, Jarecha R. To determine correlation of inter reader variability in sum of diameters using RECIST 1.1 with end point assessment in lung cancer. J Clin Oncol (2021) 39:e13557–7. doi: 10.1200/JCO.2021.39.15_suppl.e13557
32. Lopci E. Immunotherapy monitoring with immune checkpoint inhibitors based on [18 f]fdg pet/ct in metastatic melanomas and lung cancer. J Clin Med (2021) 10:5160. doi: 10.3390/jcm10215160
33. Morgan RL, Camidge DR. Reviewing RECIST in the era of prolonged and targeted therapy. J Thorac Oncol (2018) 13:154–64. doi: 10.1016/j.jtho.2017.10.015
34. Beaumont H, Evans TL, Klifa C, Guermazi A, Hong SR, Chadjaa M, et al. Discrepancies of assessments in a RECIST 1.1 phase II clinical trial – association between adjudication rate and variability in images and tumors selection. Cancer Imaging (2018) 18:50. doi: 10.1186/s40644-018-0186-0
35. Abramson RG, McGhee CR, Lakomkin N, Arteaga CL. Pitfalls in RECIST data extraction for clinical trials. Acad Radiol (2015) 22(6):779–86. doi: 10.1016/j.acra.2015.01.015
36. Maskell G. Error in radiology—where are we now? Br J Radiol (2019) 92:8–9. doi: 10.1259/bjr.20180845
Considering:
SODi: Tumor burden as reported by reader i
C_SODi: Part of the tumor burden that targets same organs selected by the other reader
S_SODi: Part of the tumor burden that targets organs not selected by other reader Equation 1
The specific SOD can be defined as: Equation 2
So that, when a reader targeted the same organs SPropSOD=0 while when readers targeted completely different organs SPropSOD= 1
Keywords: clinical trial, Interobserver variation, RECIST, computed tomography, lung cancer
Citation: Beaumont H and Iannessi A (2023) Can we predict discordant RECIST 1.1 evaluations in double read clinical trials? Front. Oncol. 13:1239570. doi: 10.3389/fonc.2023.1239570
Received: 13 June 2023; Accepted: 05 September 2023;
Published: 04 October 2023.
Edited by:
Jayasree Chakraborty, Memorial Sloan Kettering Cancer Center, United StatesReviewed by:
Joao Santos, Memorial Sloan Kettering Cancer Center, United StatesCopyright © 2023 Beaumont and Iannessi. This is an open-access article distributed under the terms of the Creative Commons Attribution License (CC BY). The use, distribution or reproduction in other forums is permitted, provided the original author(s) and the copyright owner(s) are credited and that the original publication in this journal is cited, in accordance with accepted academic practice. No use, distribution or reproduction is permitted which does not comply with these terms.
*Correspondence: Hubert Beaumont, aHViZXJ0YmVhdW1vbnRAaG90bWFpbC5jb20=
Disclaimer: All claims expressed in this article are solely those of the authors and do not necessarily represent those of their affiliated organizations, or those of the publisher, the editors and the reviewers. Any product that may be evaluated in this article or claim that may be made by its manufacturer is not guaranteed or endorsed by the publisher.
Research integrity at Frontiers
Learn more about the work of our research integrity team to safeguard the quality of each article we publish.