
94% of researchers rate our articles as excellent or good
Learn more about the work of our research integrity team to safeguard the quality of each article we publish.
Find out more
ORIGINAL RESEARCH article
Front. Oncol., 20 July 2023
Sec. Breast Cancer
Volume 13 - 2023 | https://doi.org/10.3389/fonc.2023.1230821
This article is part of the Research TopicFGFR signaling in breast cancer: state of art and future challengesView all 4 articles
 Öykü Boraka1
 Marie Klintman1Johan Vallon-Christersson2
 Sophia Zackrisson3Per Hall4,5Signe Borgquist1,6
 Ann H. Rosendahl1*
Introduction: Mammographic breast density (MBD) is an established breast cancer risk factor, yet the underlying molecular mechanisms remain to be deciphered. Fibroblast growth factor receptor 1 (FGFR1) amplification is associated with breast cancer development and aberrant FGF signaling found in the biological processes related to both high mammographic density and breast cancer microenvironment. The aim of this study was to investigate the FGF/FGFR1 expression in-between paired tumor-adjacent and tumor tissues from the same patient, and its associations with MBD and tumor characteristics.
Methods: FGFR1 expression in paired tissues from 426 breast cancer patients participating in the Karolinska Mammography Project for Risk Prediction of Breast Cancer (KARMA) cohort study was analyzed by immunohistochemistry. FGF ligand expression was obtained from RNA-sequencing data for 327 of the included patients.
Results: FGFR1 levels were differently expressed in tumor-adjacent and tumor tissues, with increased FGFR1 levels detected in 58% of the tumors. High FGFR1 expression in tumor tissues was associated with less favorable tumor characteristics; high histological grade (OR=1.86, 95% CI 1.00–3.44), high Ki67 proliferative index (OR=2.18, 95% CI 1.18–4.02) as well as tumors of Luminal B-like subtype (OR=2.56, 95%CI 1.29–5.06). While no clear association between FGFR1 expression and MBD was found, FGF ligand (FGF1, FGF11, FGF18) expression was positively correlated with MBD.
Discussion: Taken together, these findings support a role of the FGF/FGFR1 system in early breast cancer which warrants further investigation in the MBD–breast cancer context.
Breast cancer is the most frequently diagnosed cancer in women worldwide with a steady increase in global incidence (1). While the heterogeneity of the disease constitutes a major challenge in breast cancer treatment (2), breast cancer prevention has gained increasing attention as up to 30% of all breast cancer cases are estimated to be preventable through combined modification of breast cancer risk factors including low physical activity, high body mass index (BMI), alcohol consumption, and smoking (3, 4).
Mammographic breast density (MBD), is a well-established breast cancer risk factor that is assessed via mammography images, and percent density is defined as the relative abundance of fibroglandular tissue (dense area) relative to fat (adipose) tissue (non–dense area) (5). In women with the highest (≥75%) MBD, a nearly 5-fold increased risk of breast cancer was seen when compared with women with the lowest (<10%) MBD (6). MBD is proposed to be a modifiable breast cancer risk factor, rendering MBD reduction a potential preventive measure against breast cancer (7–9). Although MBD is associated with breast cancer risk, it is unclear how. Changes in the local microenvironment of the breast, within the fibroglandular [e.g., paracrine signaling and extracellular matrix (ECM) remodeling (10)] and adipose (e.g., adipocyte secretome (11)) tissue compartments, are known to impact breast cancer initiation and progression. High abundance of an active stromal compartment thus provides a tumor promoting niche where the extracellular matrix further acts as a structural grit for tumor formation and a reservoir for growth factors, such as fibroblast growth factors (FGFs), to stimulate tumor-initiating epithelial cells (12).
FGF signaling is shared between the biological processes relating to both high MBD and breast cancer microenvironment (12, 13). FGF receptors (FGFRs) are members of the receptor tyrosine kinase family of transmembrane receptors and consist of four members that are encoded by four distinct genes: FGFR1–4. Upon activation by fibroblast growth factor ligands (FGF1–23), FGFRs phosphorylate their intracellular substrates (e.g., FGFR substrate 2 (FRS2), phospholipase Cγ (PCγ)) (14) and trigger signal transduction pathways that have key roles in mediating cell proliferation, differentiation, migration, and apoptosis as well as in the pathophysiology of a wide spectrum of diseases including cancers (15).
FGFR aberrations, including amplifications, mutations, and rearrangements, exist in various types of human cancers at an average frequency of ~7% (16). Relative to other cancer types, FGFR aberrations are more frequent in breast cancer (18%), with FGFR1 amplification being the predominant aberration observed in 14% of breast cancer patients (16). The FGFR1 is an amplified oncogene associated with the early evolution of breast cancer clones (17). The importance of the FGF/FGFR system in breast cancer is additionally reinforced via genome-wide association studies where common genetic variation in the FGFR2 locus is robustly associated with breast cancer (18). FGFR1 amplification is further found associated with antiestrogen resistance in estrogen receptor positive (ER+) tumors (19). An in vitro study that used a fibroblast-derived ECM scaffold showed that FGF2, a FGFR1 ligand, mediates estrogen-independent ER signaling in breast cancer cells when bound to the ECM, rendering FGFR1 as a relevant MBD–related target (12).
Despite the clinical evidence of an association between MBD and breast cancer risk, the molecular mediators or involved pathways are not known. In this study, we investigated FGFR1 gene and protein and FGF ligand expression in paired tumor-adjacent and tumor tissues in relation to MBD and tumor characteristics by making use of a population-based prospective screening cohort, The Karolinska Mammography Project for Risk Prediction of Breast Cancer (KARMA) cohort, with the aim of contributing to bridge the knowledge gaps in the MBD–breast cancer association.
The Karolinska Mammography Project for Risk Prediction of Breast Cancer (KARMA) is a prospective cohort study with 70,877 participants who attended mammography screening (aged 40–74 years) or clinical mammography at four hospitals in Sweden in 2011–2013, 35,367 of whom were enrolled in Southern Sweden (20). Baseline characteristics were collected via self-reported questionnaires. Among the participants in the Southern Swedish KARMA cohort, 601 incident breast cancers occurred by December 31, 2016. For tissue microarray (TMA) construction, patients with ductal/lobular carcinoma in situ (n=97), patients who underwent surgery at other hospitals in Sweden (n=12), patients with occult breast cancer, i.e., undetectable primary tumor only lymph node metastasis (n=1), patients with distant metastases at primary diagnosis (n=4), or bilateral cancers (n=8) were excluded. Paired tumor-adjacent (normal) and tumor tissues from the remaining 426 patients with invasive breast cancer and available tissue were collected and compiled in TMAs for subsequent protein expression analysis (Figure 1). The study was approved by the regional Ethics Committee at Karolinska Institutet, Sweden (Dnr 2010/958-31/1 and 2013/2090-32), and all study participants signed informed consent.
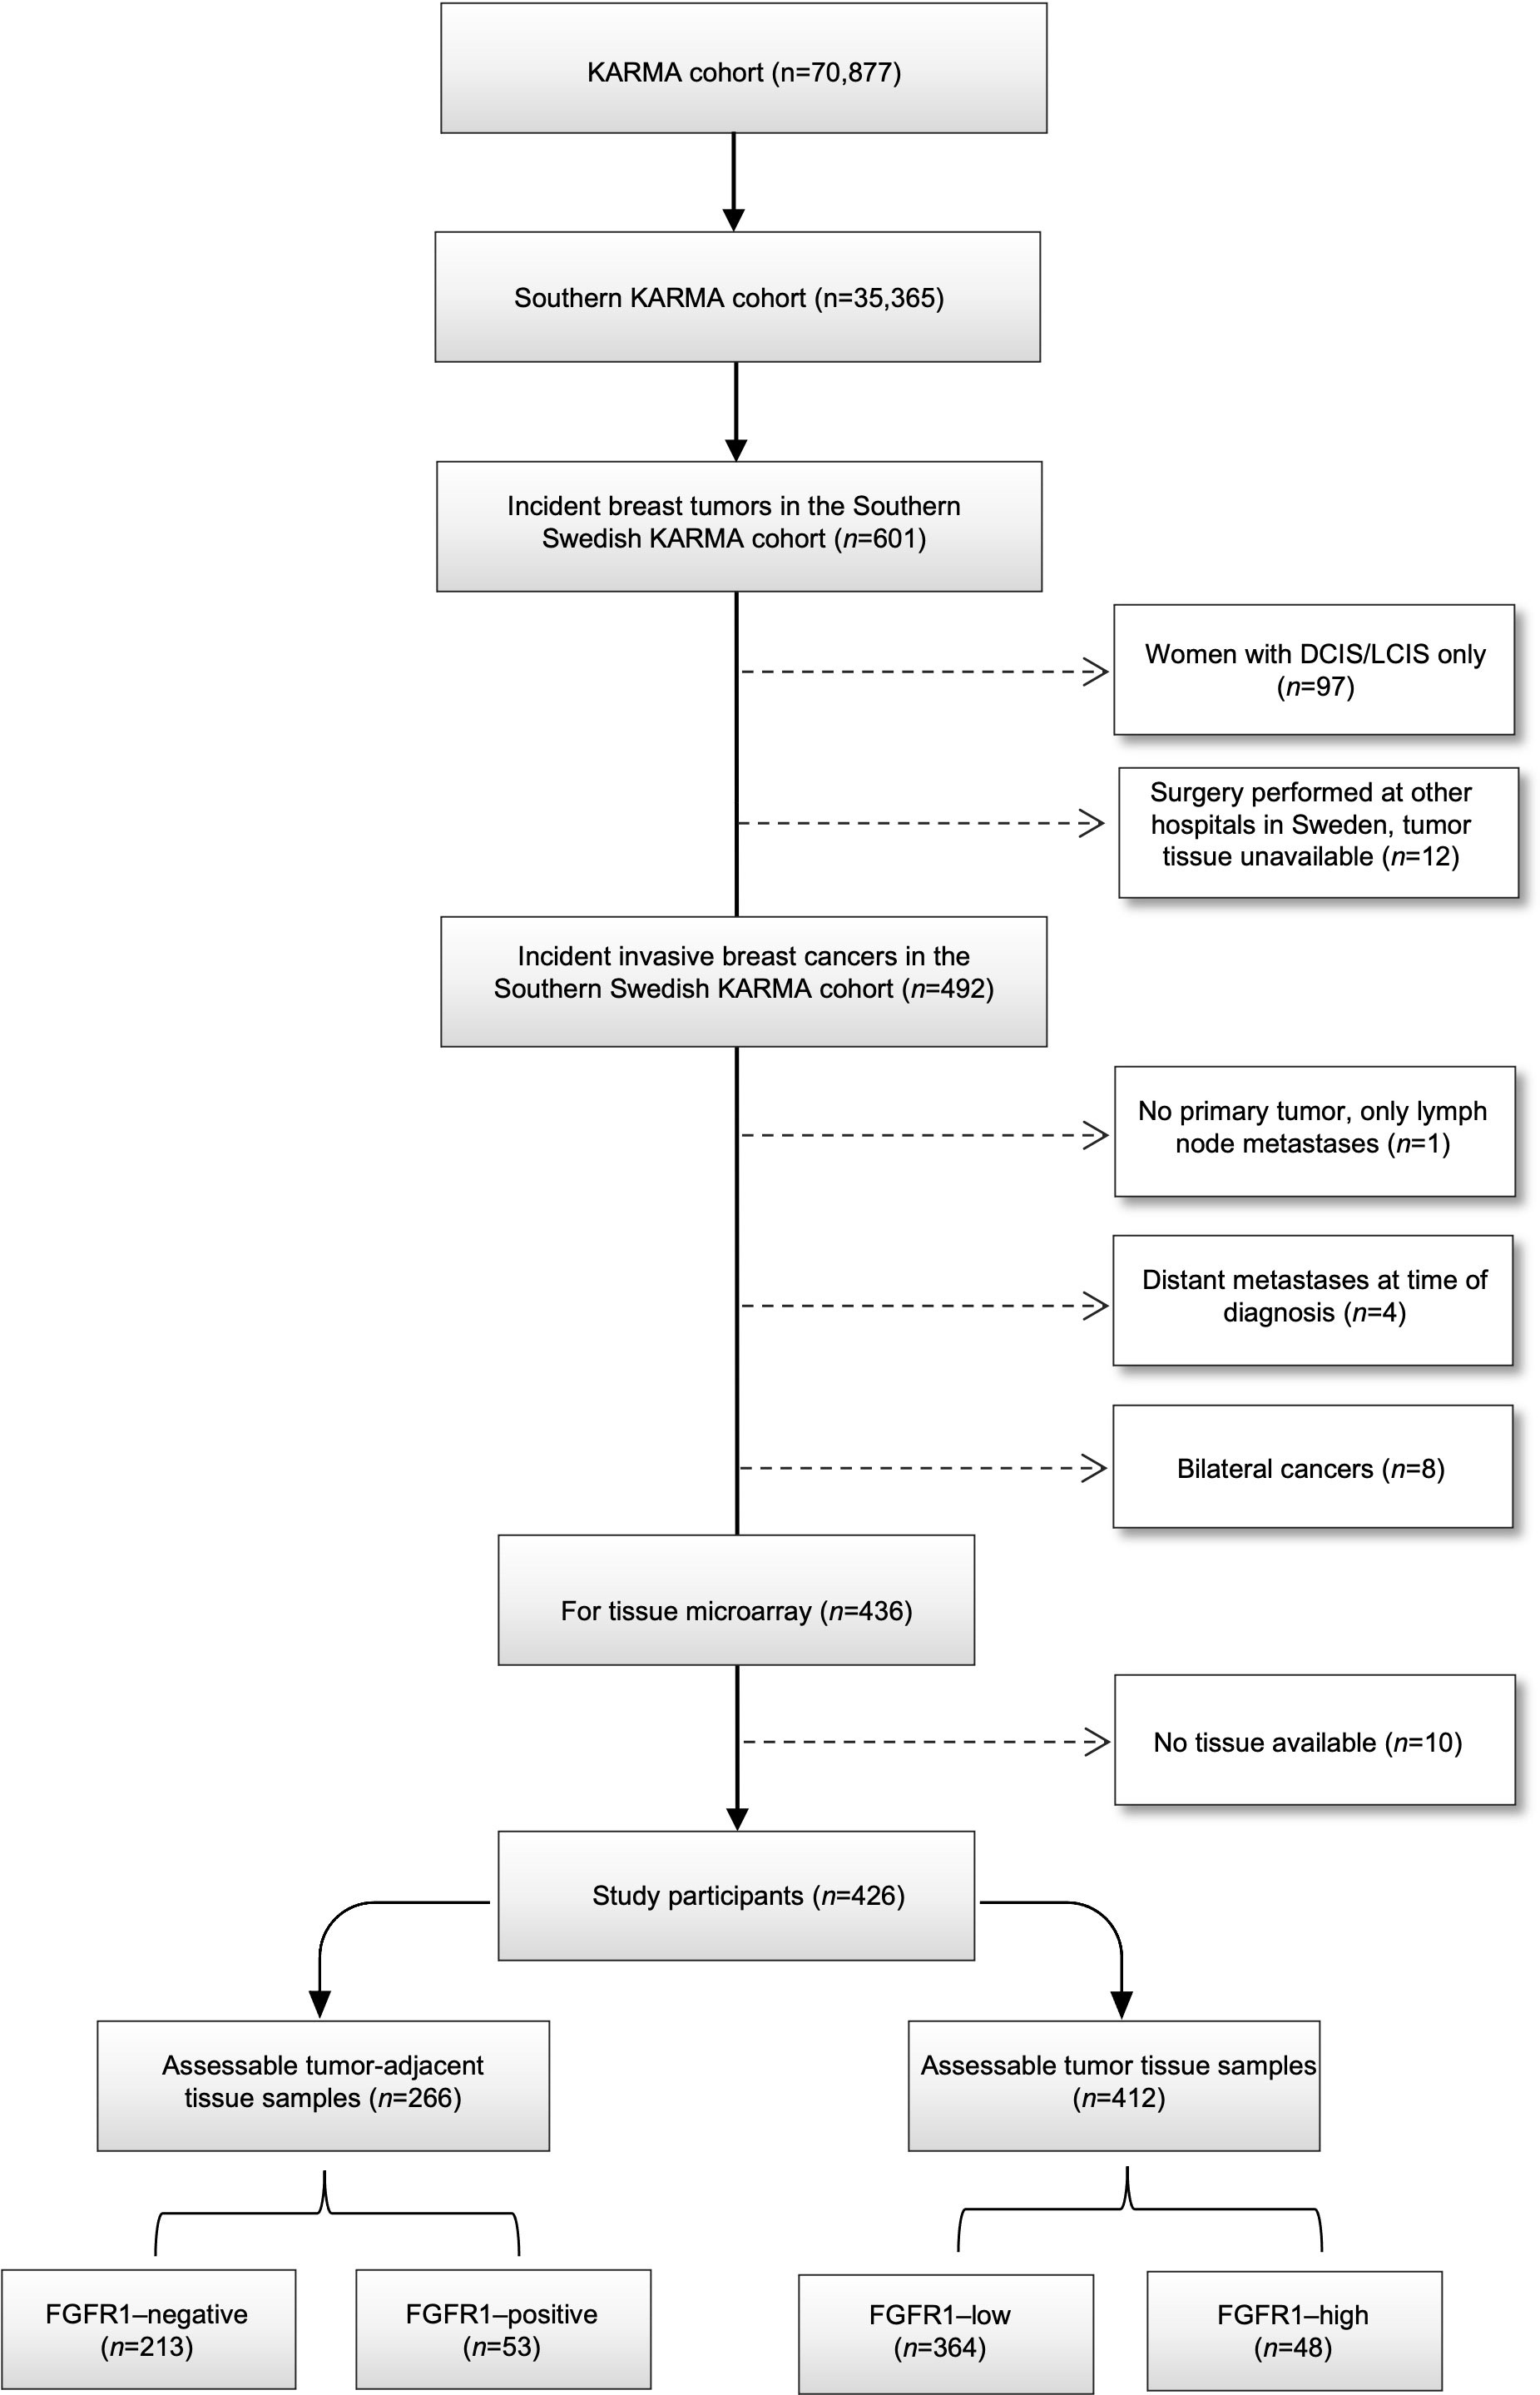
Figure 1 Consort flow diagram of included and excluded individuals within final study population.
Patient and tumor characteristics at time of diagnosis were obtained from the Swedish National Quality Register for Breast Cancer (NKBC) and validated through assessment of medical records (MK). Pathology data included tumor size (≤20 mm versus >20 mm), lymph node status (negative/positive), distant metastasis (no/yes), Nottingham histological grade (1 + 2 versus 3), estrogen receptor (ER)-, progesterone receptor (PR)-, human epidermal growth factor receptor 2 (HER2)-status (positive/negative), and Ki67 (% positive cells, low + intermediate versus high, according to cut-off definitions below). Breast cancer subtypes were defined according to the Swedish regional guidelines for clinical decision making over three time periods. In 2011–2013, Luminal A-like subtype was defined as ER >10% tumors with i) histological grade 1, or ii) histological grade 2 and Ki67 ≤20%. Luminal B-like subtype was defined as ER >10% tumors with i) histological grade 3, or ii) histological grade 2 and Ki67 >20% in all four participating pathology laboratories. The 20% Ki67 cut-off was defined to identify the 7th decile, associated with prognosis in patients with lymph node negative, histological grade 2, ER+, HER2- tumors, as previously described (21). In 2014–2015, the cut-off to define high versus low Ki67 was internally re-validated to identify the 7th decile, resulting in different cut-offs for high Ki67 in the four laboratories: Helsingborg (>30%) and Lund, Malmö and Kristianstad (>20%). Luminal A-like was then defined as ER >10%, PR >20% tumors with i) histological grade 1, or ii) histological grade 2 and low Ki67. Luminal B-like was defined as ER >10% and i) histological grade 3, or ii) histological grade 2 and high Ki67 or PR ≤20%. From 2015 and onwards, Luminal A-like was defined as ER >10% tumors with i) histological grade 1, or ii) histological grade 2 and Ki67 <20%, or iii) histological grade 2, Ki67 20–30% and PR >20%. Luminal B-like subtype was defined as ER >10% tumors with i) histological grade 3, or ii) histological grade 2 and Ki67 >30%, or iii) histological grade 2, Ki67 20–30% and PR ≤20%. For all time periods, the HER2+ subtype was defined as HER2+ tumors regardless of other characteristics, and triple-negative breast cancer (TNBC) as ER-negative (≤ 10%), PR-negative (≤ 10%) and HER2-negative.
Raw digital full field mammograms from mediolateral oblique views of both breasts were collected at KARMA study recruitment for MBD assessment. Absolute dense area (cm2) was measured on raw mammograms by using the density measurement tool iCAD (iReveal®, Nashua, NH, USA) and fully automated STRATUS method (22). Percent dense area was calculated by dividing absolute dense area by total breast area and categorized based on Breast Imaging Reporting and Data System 5th edition (BI-RADS; American College of Radiology, Reston, VA, USA): category A (almost entirely fatty breasts), category B (scattered areas of fibroglandular density), category C (heterogeneously dense breasts), category D (extremely dense breasts) (23).
Duplicate 1 mm tissue cores were collected from formalin-fixed and paraffin-embedded tissue blocks and mounted in recipient paraffin blocks for tissue microarray (TMA) construction. TMAs with paired tissues were then cut into 4 µm sections, de-paraffinized and pre-treated for antigen retrieval with Cell Conditioning 1 (CC1) buffer at pH 7.8 (#950-500, Roche). Immunohistochemistry staining was performed using monoclonal anti-FGFR1 antibody (#9740, Cell Signaling Technology, validation performed on kidney/tonsil/breast cancer tissues via IHC) and visualized by ChromoMap DAB Kit (#760-159, Roche) with the use of the fully automated DISCOVERY ULTRA IHC research platform (Ventana). The stained TMAs were then scanned for image digitalization and analyzed for their FGFR1 expression by using PathXL Xplore software (version 5.1.1, Philips). Cytoplasmic intensity of FGFR1 staining in breast epithelial and cancer cells were scored from 0–3, representing negative (0), weak (1+), moderate (2+), strong expression (3+), respectively (Figure 2). The FGFR1 staining evaluation was performed in two independent readings (ÖB), blinded to patient and tumor characteristics. For discordant cases, another round of reading was performed, and final values were decided. Reporting Recommendations for Tumor Marker Prognostic Studies (REMARK) were followed throughout the study (24).
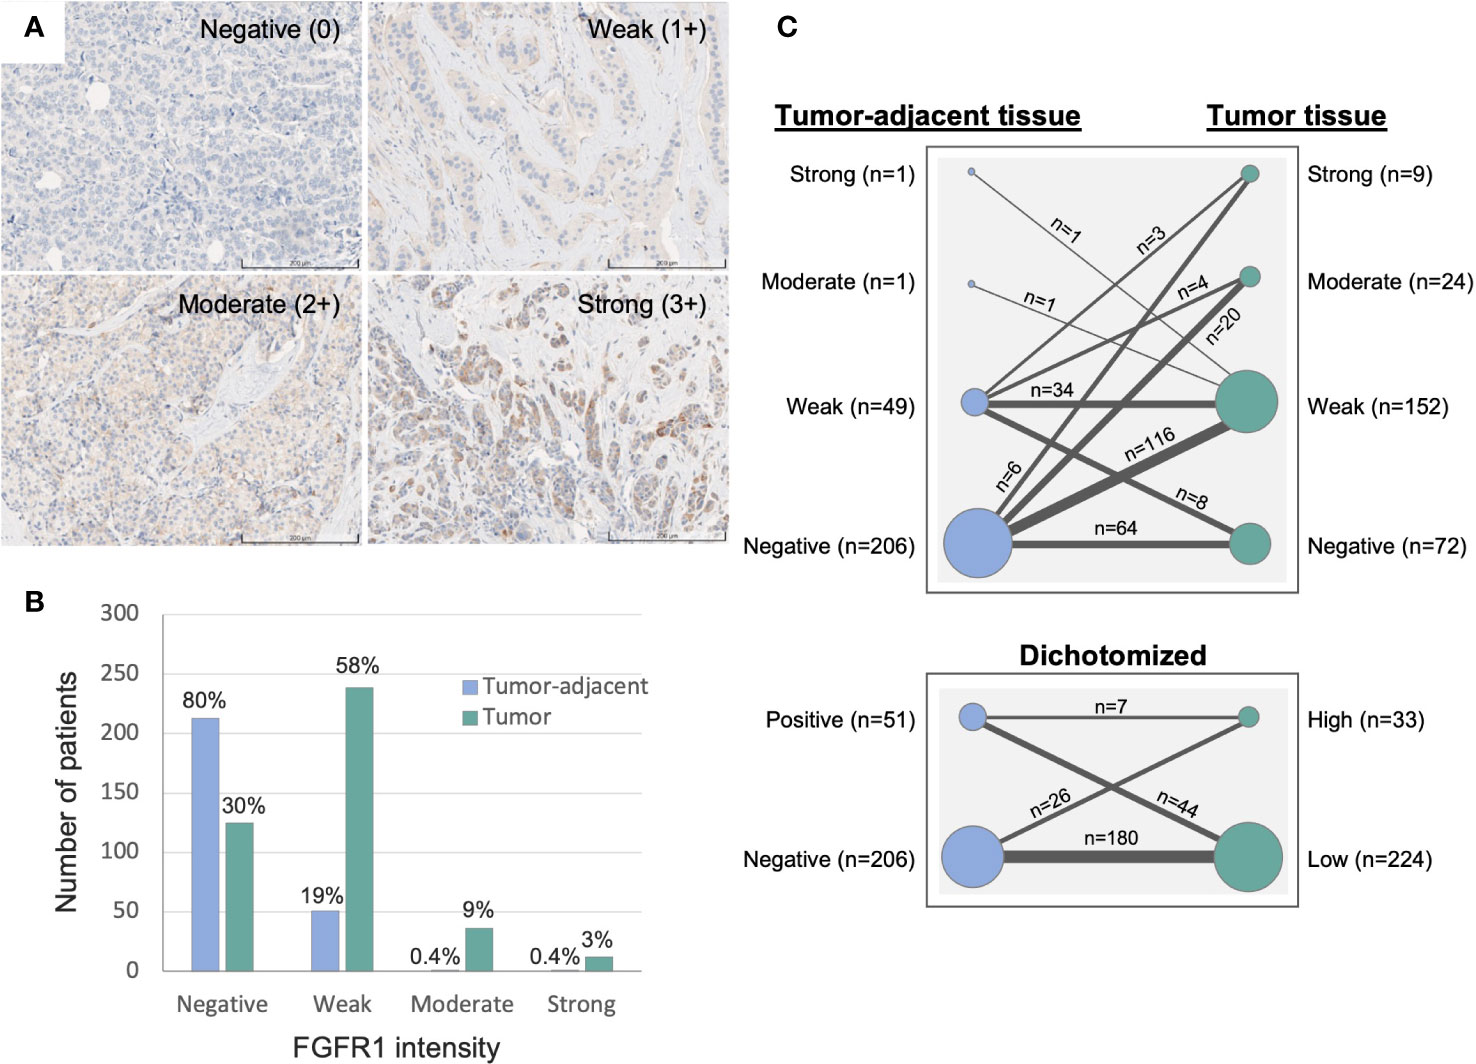
Figure 2 Immunohistochemistry evaluation of FGFR1 expression in tumor-adjacent and tumor tissues. (A) Representative images of immunohistochemically stained FGFR1 in tumor tissue and cytoplasmic intensity levels: Negative (0), Weak (1+), Moderate (2+), Strong (3+) expression. (B) Graph displaying the distribution of FGFR1 expression in tumor-adjacent (n=266) and tumor tissues (n=412). (C) Graph displaying the change in FGFR1 expression between paired tumor-adjacent and tumor tissues (n=257), according to four levels of FGFR expression (top panel) or dichotomized FGFR1 expression levels (bottom panel).
Gene expression data from 327 (77%) of 426 tumors were available and retrieved from the Sweden Cancerome Analysis Network Breast (SCAN-B) Initiative (25). Briefly, gene expression profiles of individual samples were analyzed via whole transcriptome mRNA–sequencing (>19,000 genes) with the use of Illumina sequencers, and subsequent pre–processing and log2 transformation of the RNA-seq data. Robust single sample predictor (SSP) models were trained for four RNA-sequencing-based molecular subtypes of breast cancer: Luminal A, Luminal B, HER2-enriched, and Basal-like, as described elsewhere (26).
Distribution of FGFR1 protein expression levels were analyzed in relation to patient and tumor characteristics. FGFR1 expression was dichotomized based on staining intensities into FGFR1-negative (intensity 0) and FGFR1-positive (weak-strong, intensities 1–3) in tumor adjacent tissues; FGFR1-low (negative-weak, intensities 0–1) and FGFR1-high (moderate-strong, intensities 2–3) in tumor tissues. Only two patients displayed moderate-strong FGFR1 levels in tumor adjacent tissue, hence, dichotomization was conducted differently in tumor-adjacent and tumor tissues to enable statistical analyses of comparably sized groups. Cohort-specific relative values from mean-centered, log2-transformed FGFR1 and FGF ligand expression data were used as continuous variables. Distributional differences between FGFR1 levels in tumor-adjacent and tumor tissues in relation to patient and tumor characteristics were analyzed by chi-square test. Associations of FGFR1 expression with patient and tumor characteristics were examined by logistic regression providing odds ratios (OR) with 95% confidence intervals (95%CI) in crude and adjusted models (adjustment by age at diagnosis and tissue storage time that can influence protein levels). Due to few patients in the lowest (A) or highest (D) MBD categories, dichotomized BI-RADS categories were used (A+B = low MBD; C+D = high MBD) for odds ratio assessment. Associations between FGFR1 and FGF ligand expression (FGF1–11, FGF16–23) with MBD were examined by Joncksheere-Terspstra test. FGF ligands that did not have quantifiable gene expression values for the majority of the cohort (FGF3, 4, 6, 8, 17, 21, 23) were not included in the final analyses, therefore, not presented. All statistical analyses were conducted using SPSS (versions 27 and 29 for Mac, IBM).
Median time from study inclusion to breast cancer diagnosis was 24.6 months (inter quartile range, IQR; 2.8–38.7). The majority of patients were >50 years at diagnosis, and the median age at diagnosis among patients with tissue in the TMA and with available gene expression data was 62 and 61 years, respectively (Table 1). Of the 426 patients included in the study, 412 (97%) had assessable FGFR1 levels in tumor tissue, 266 (62%) in paired tumor-adjacent tissue, and 327 (77%) had available gene expression data. Overall, FGFR1-positivity was detected more frequently and at higher levels in breast cancer tissues compared with paired tumor-adjacent tissues (Figure 2). Among the tumor-adjacent tissue samples with assessable FGFR1 levels, 53 (20%) displayed positive staining, of which 2 (1%) expressed moderate-high levels (Figure 2B). Of the corresponding tumor tissue samples, 287 (70%) displayed positive FGFR1 staining, of which 48 (12%) expressed moderate-high levels (Figures 2A, B). In total, 257 patients had assessable FGFR1 staining in both tumor-adjacent and tumor tissue, of whom 98 (38%) had stable FGFR1 levels that were maintained between tumor-adjacent and tumor tissues, 149 (58%) displayed higher FGFR1 levels in tumor tissue compared with tumor-adjacent tissue, while 10 (4%) had lower FGFR1 levels in tumor relative to tumor-adjacent tissue (Figure 2C).
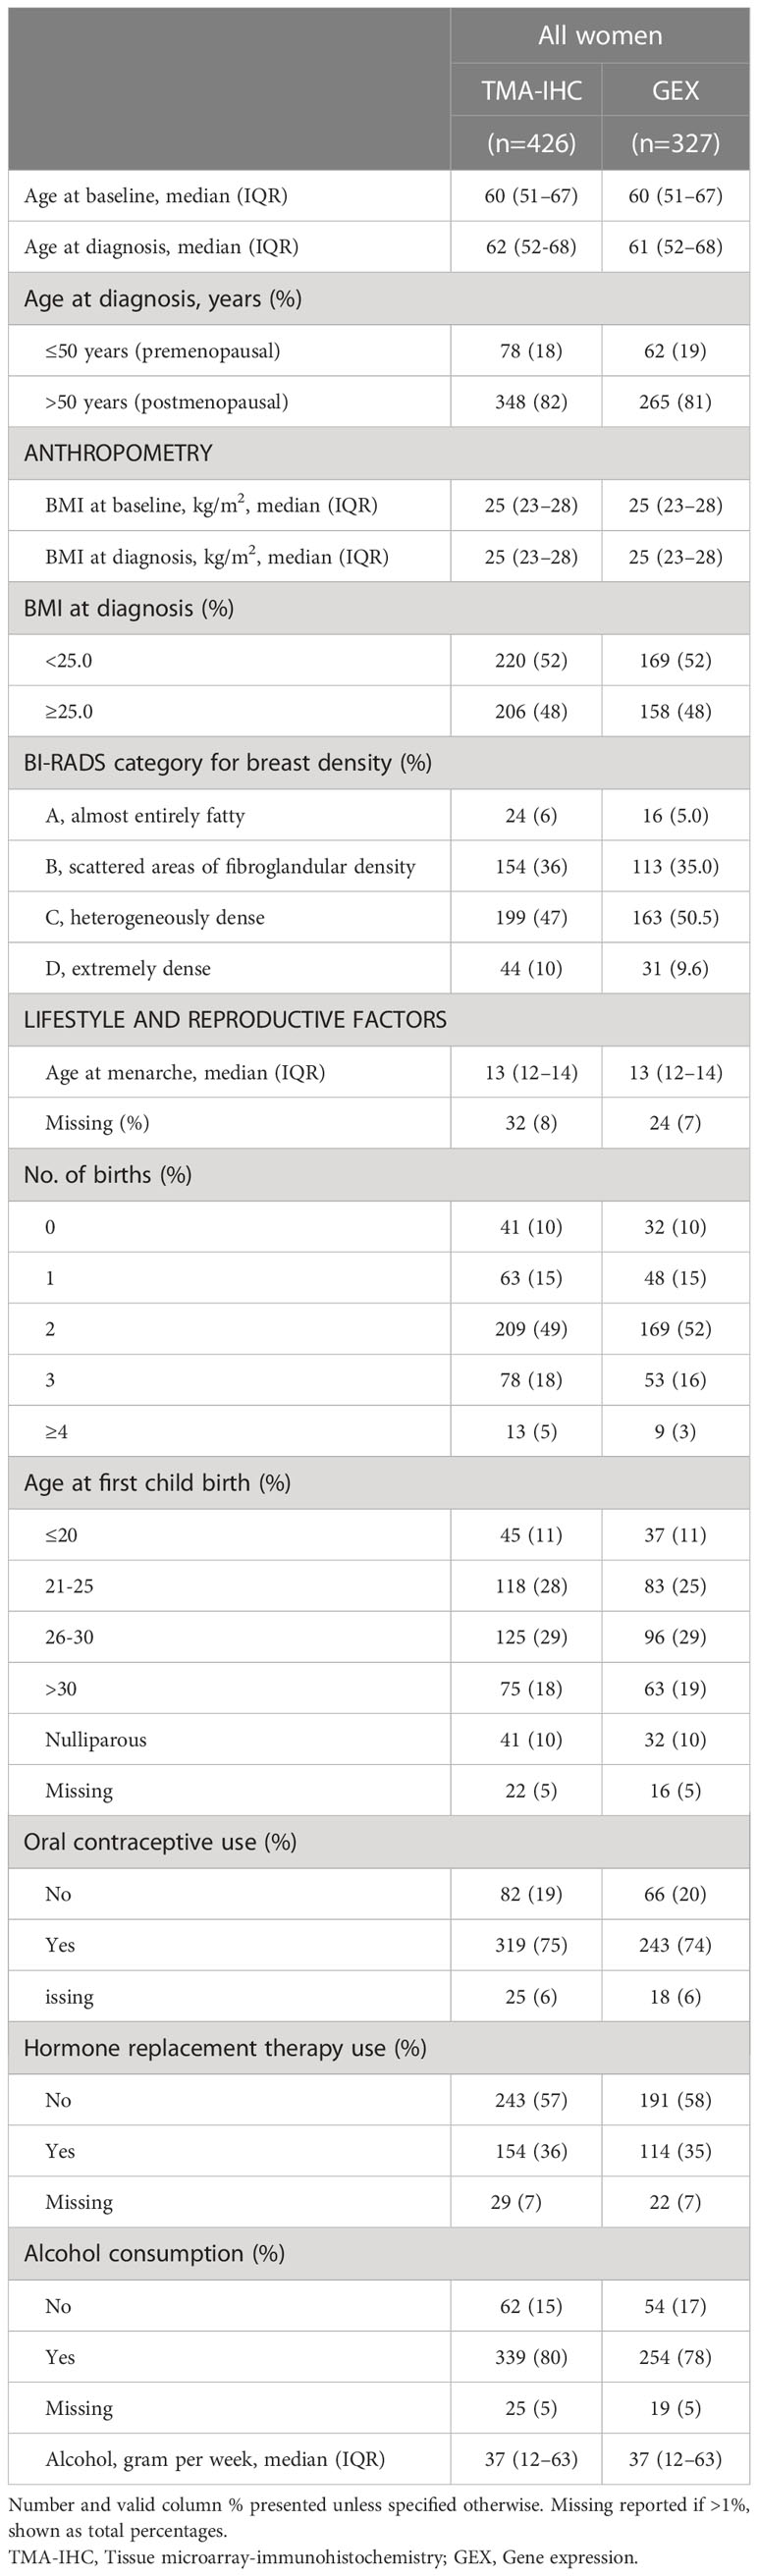
Table 1 Distribution of patient characteristics among included breast cancer patients with protein (TMA-IHC) or gene expression (GEX) data.
Frequency distribution of FGFR1 levels in tumor-adjacent and tumor tissue according to patient and tumor characteristics are shown in Table 2. Compared to patients with FGFR1 negative tumor-adjacent tissue, patients with FGFR1 positive tumor-adjacent tissue were more frequent >50 years at diagnosis. No difference in the FGFR1 tumor levels was seen in relation to age at diagnosis. A similar distribution of FGFR1 levels in both tumor-adjacent and tumor tissues was seen across BMI categories at diagnosis. Among patients with FGFR1 positive tumor-adjacent tissue, 56% had high MBD (BI-RADS C-D) compared with 63% of patients with FGFR1-negative expression. Conversely, among patients with FGFR1-high tumors, 65% had high MBD (BI-RADS C-D) compared to 57% of patients with FGFR1-low tumors. Overall, there was no distinct difference in the FGFR1 frequencies across tumor characteristics between FGFR1-negative and positive expression groups in tumor-adjacent tissues except for the few patients that with positive FGFR1 levels in tumor-adjacent tissue appeared more likely to have progesterone receptor (PR) positive tumors. Patients with FGFR1-high tumors were more likely to have tumors of histological grade 3 and high Ki67 proliferative index, compared with patients with FGFR1-low tumors. Furthermore, compared with patients with FGFR1-low tumors, patients with FGFR1-high tumors were more likely to have Luminal B-like tumors.
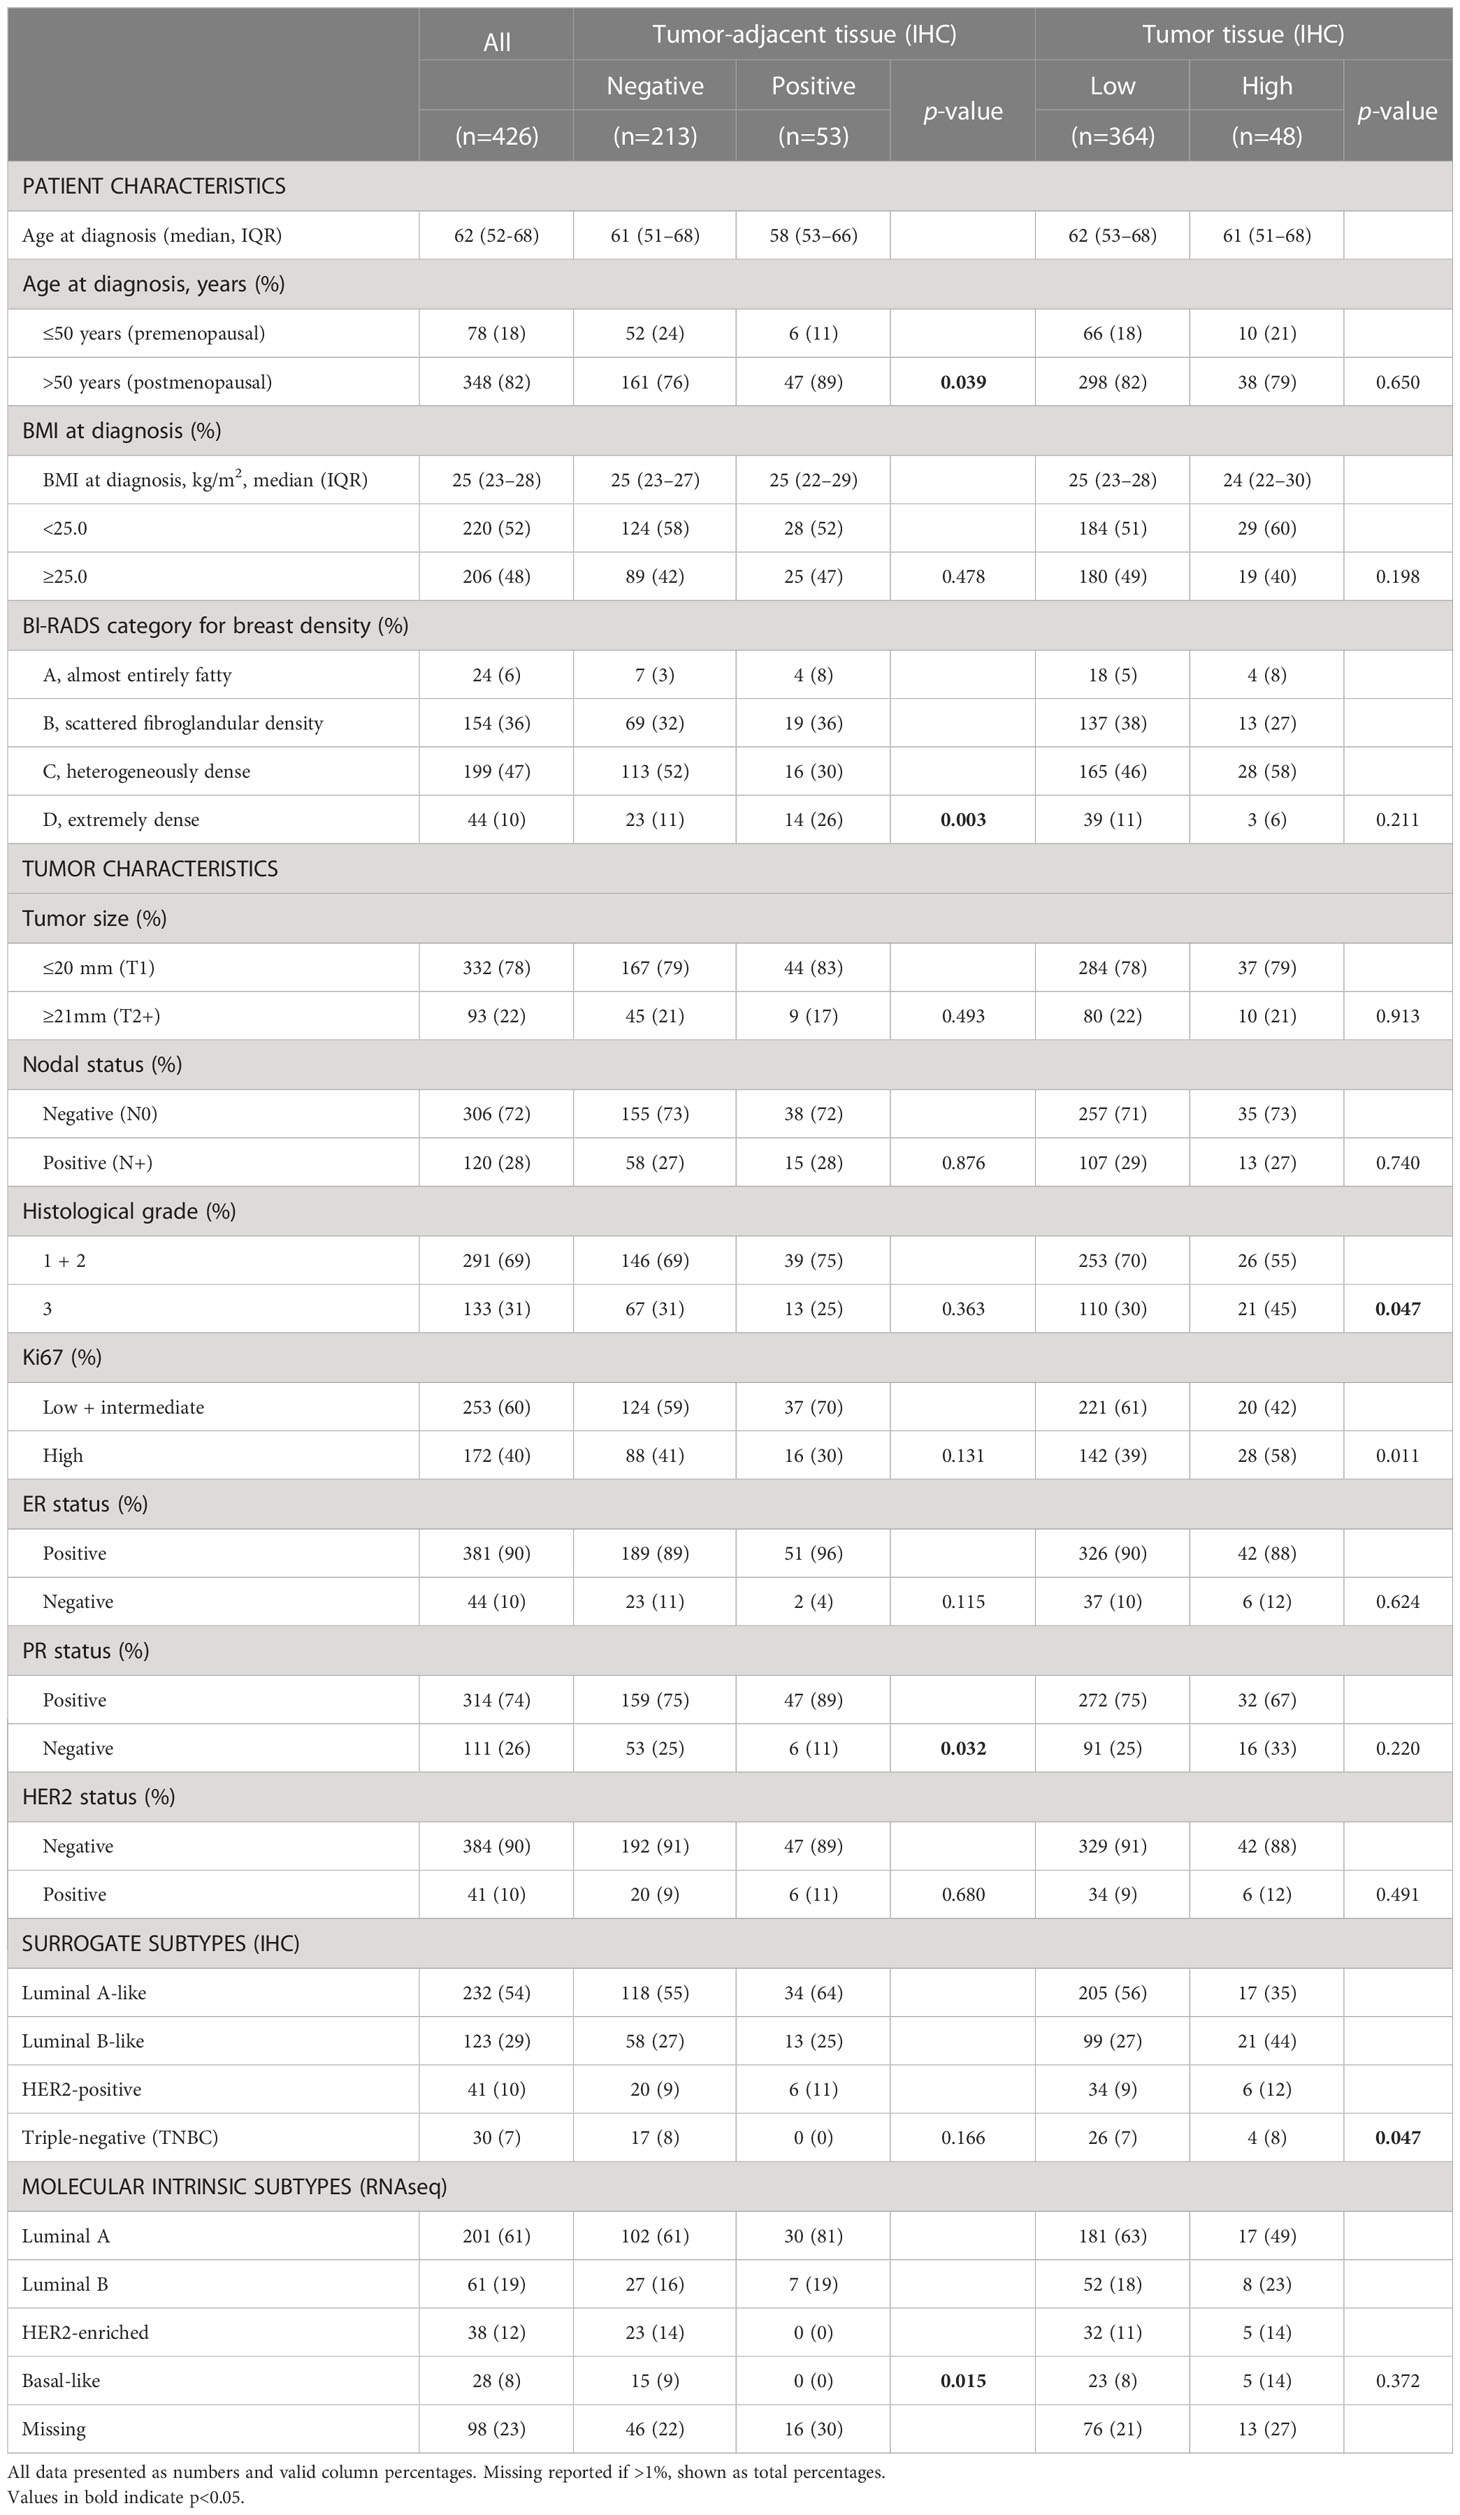
Table 2 Distribution of patient and tumor characteristics based on FGFR1 expression in tumor-adjacent and tumor tissues.
The probability of FGFR1-positivity in tumor-adjacent tissues or FGFR1-high levels in tumor tissues was assessed between patients with low and high MBD. No clear association between FGFR1 expression in tumor-adjacent or tumor tissue and MBD was found (Table 3). FGFR1-high tumors were associated with histological grade 3 (OR=1.86, 95% CI 1.00–3.44), high Ki67 (OR=2.18, 95% CI 1.18–4.02), and Luminal B-like tumors (OR=2.56, 95% CI 1.29–5.06) (Table 3). When adjusted for age at diagnosis and number of years the samples were stored, all associations remained essentially the same.
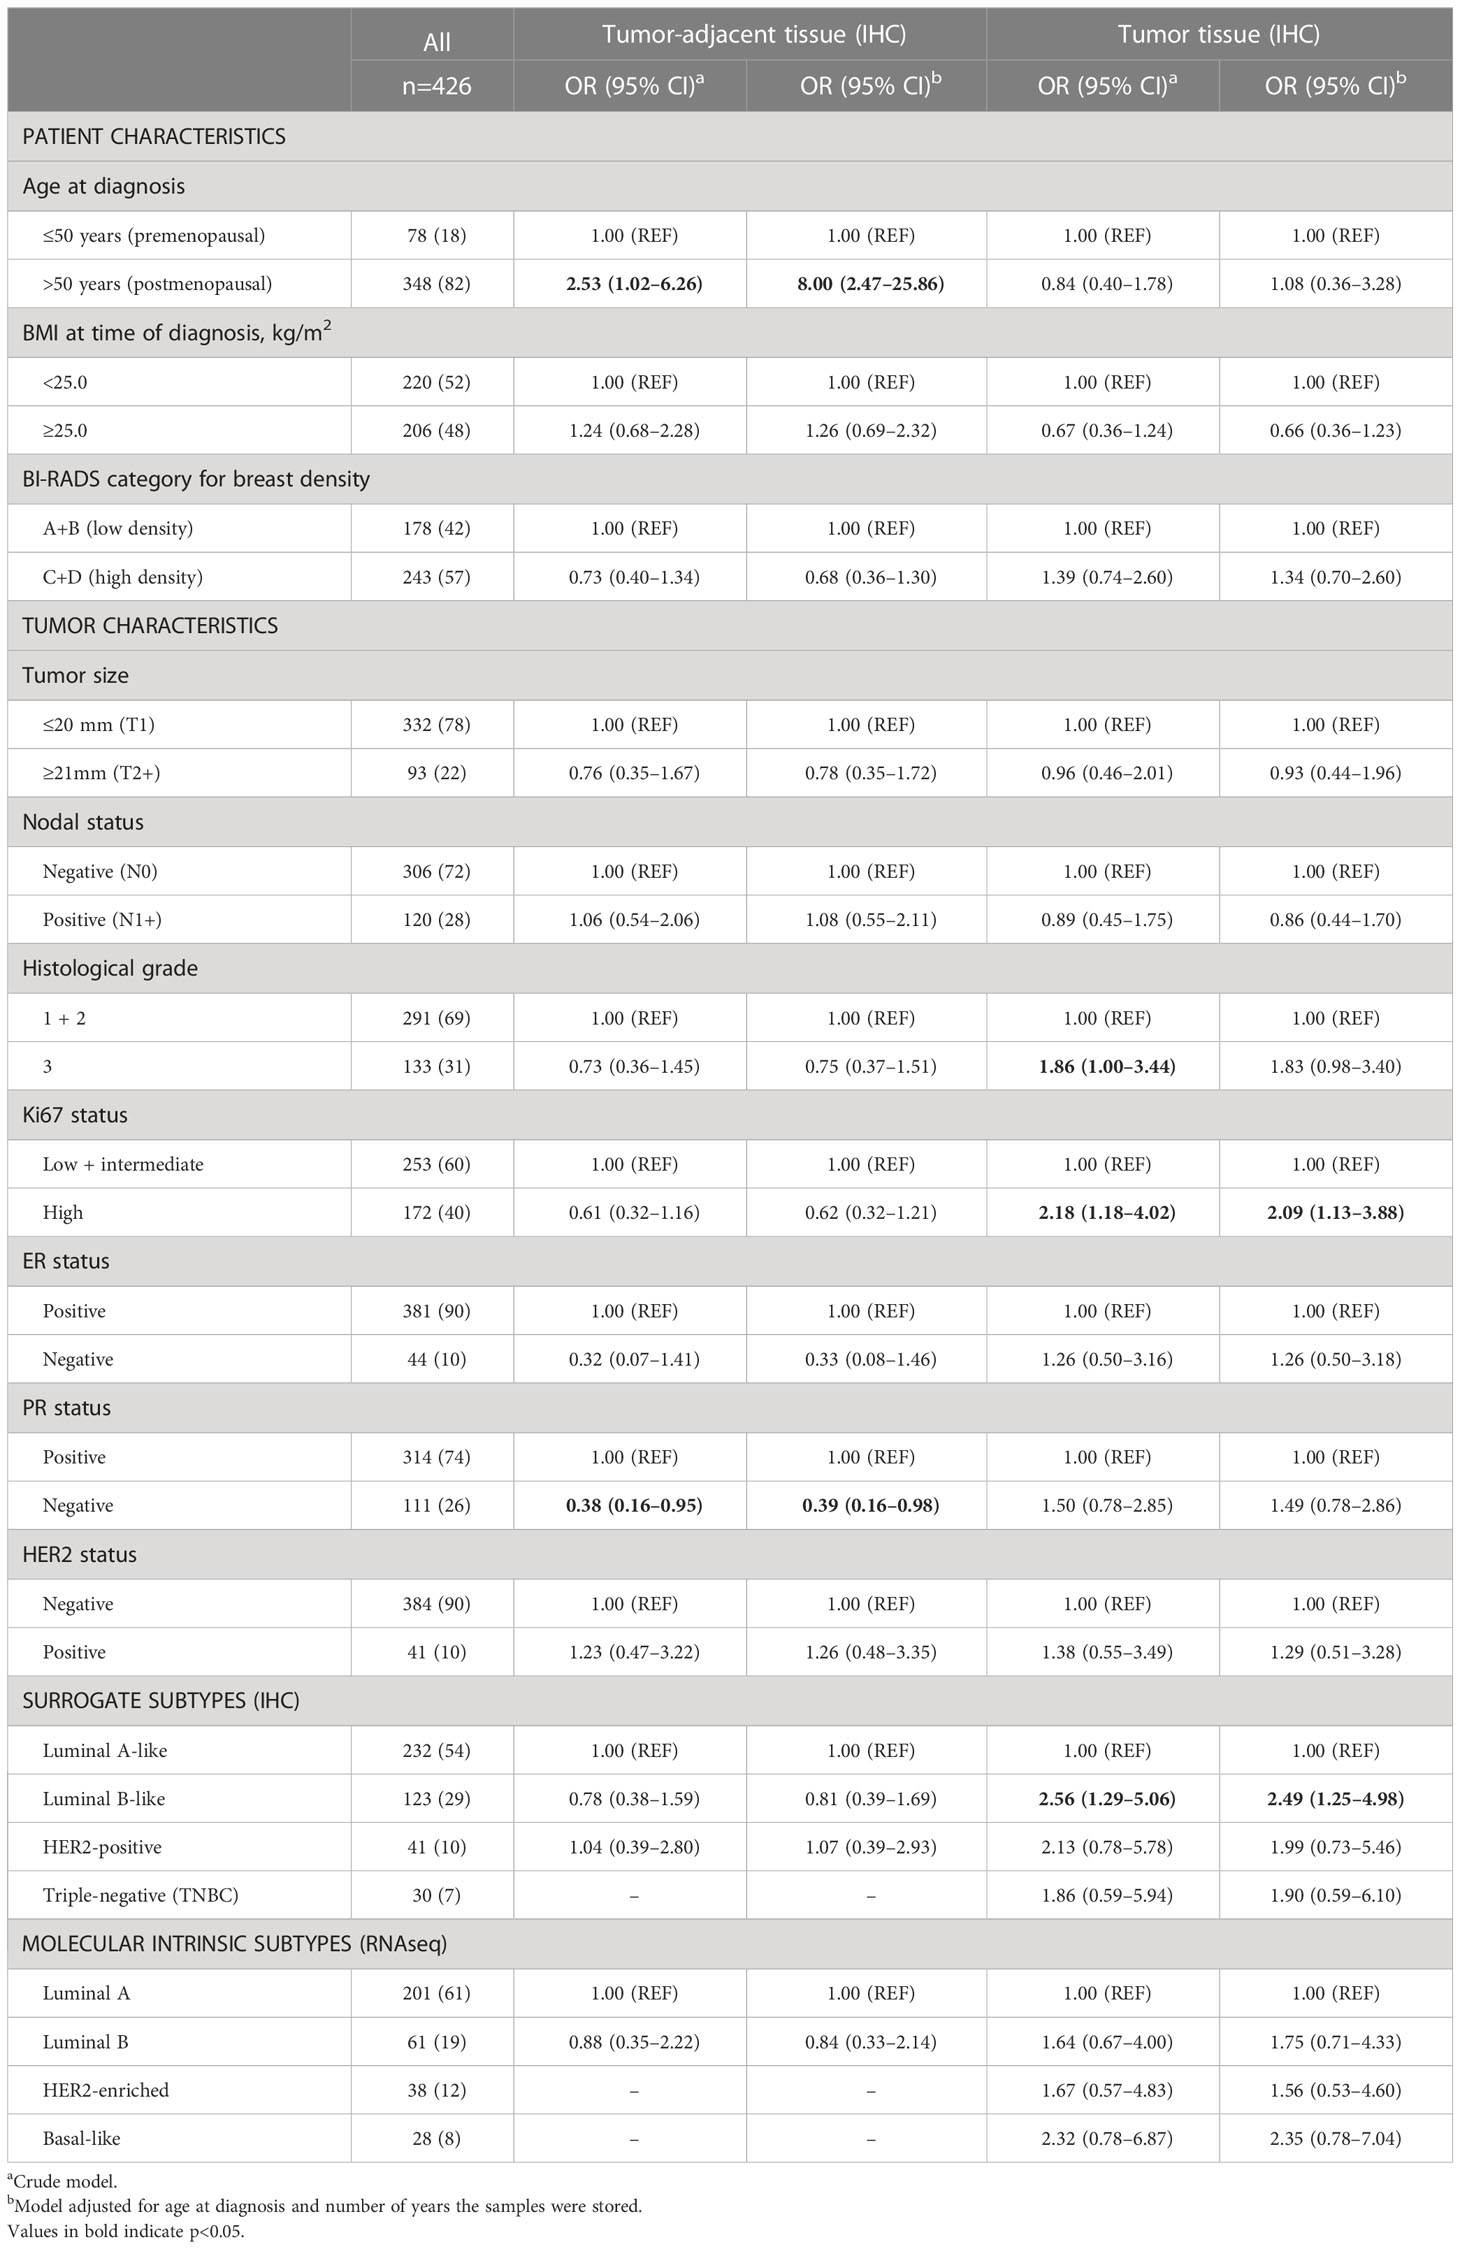
Table 3 Associations between patient and tumor characteristics and FGFR1 expression in tumor-adjacent and tumor tissues.
The correlation between FGFR1 expression (mRNA) in tumor tissues and FGFR1 expression in corresponding tumor-adjacent and tumor tissues was investigated (Figure 3). No correlation between FGFR1 gene expression and protein levels was observed for tumor-adjacent tissues (Spearman rho -0.034), and the relative FGFR1 expression was similar among patients that displayed negative versus positive FGFR1 expression (P=0.626, Figure 3A). In tumor tissues, a weak positive correlation was found between FGFR1 gene and protein expression (Spearman rho 0.257), and the relative FGFR1 expression was overall higher in FGFR1-high tumors compared with FGFR1-low tumors (P<0.001, Figure 3B).
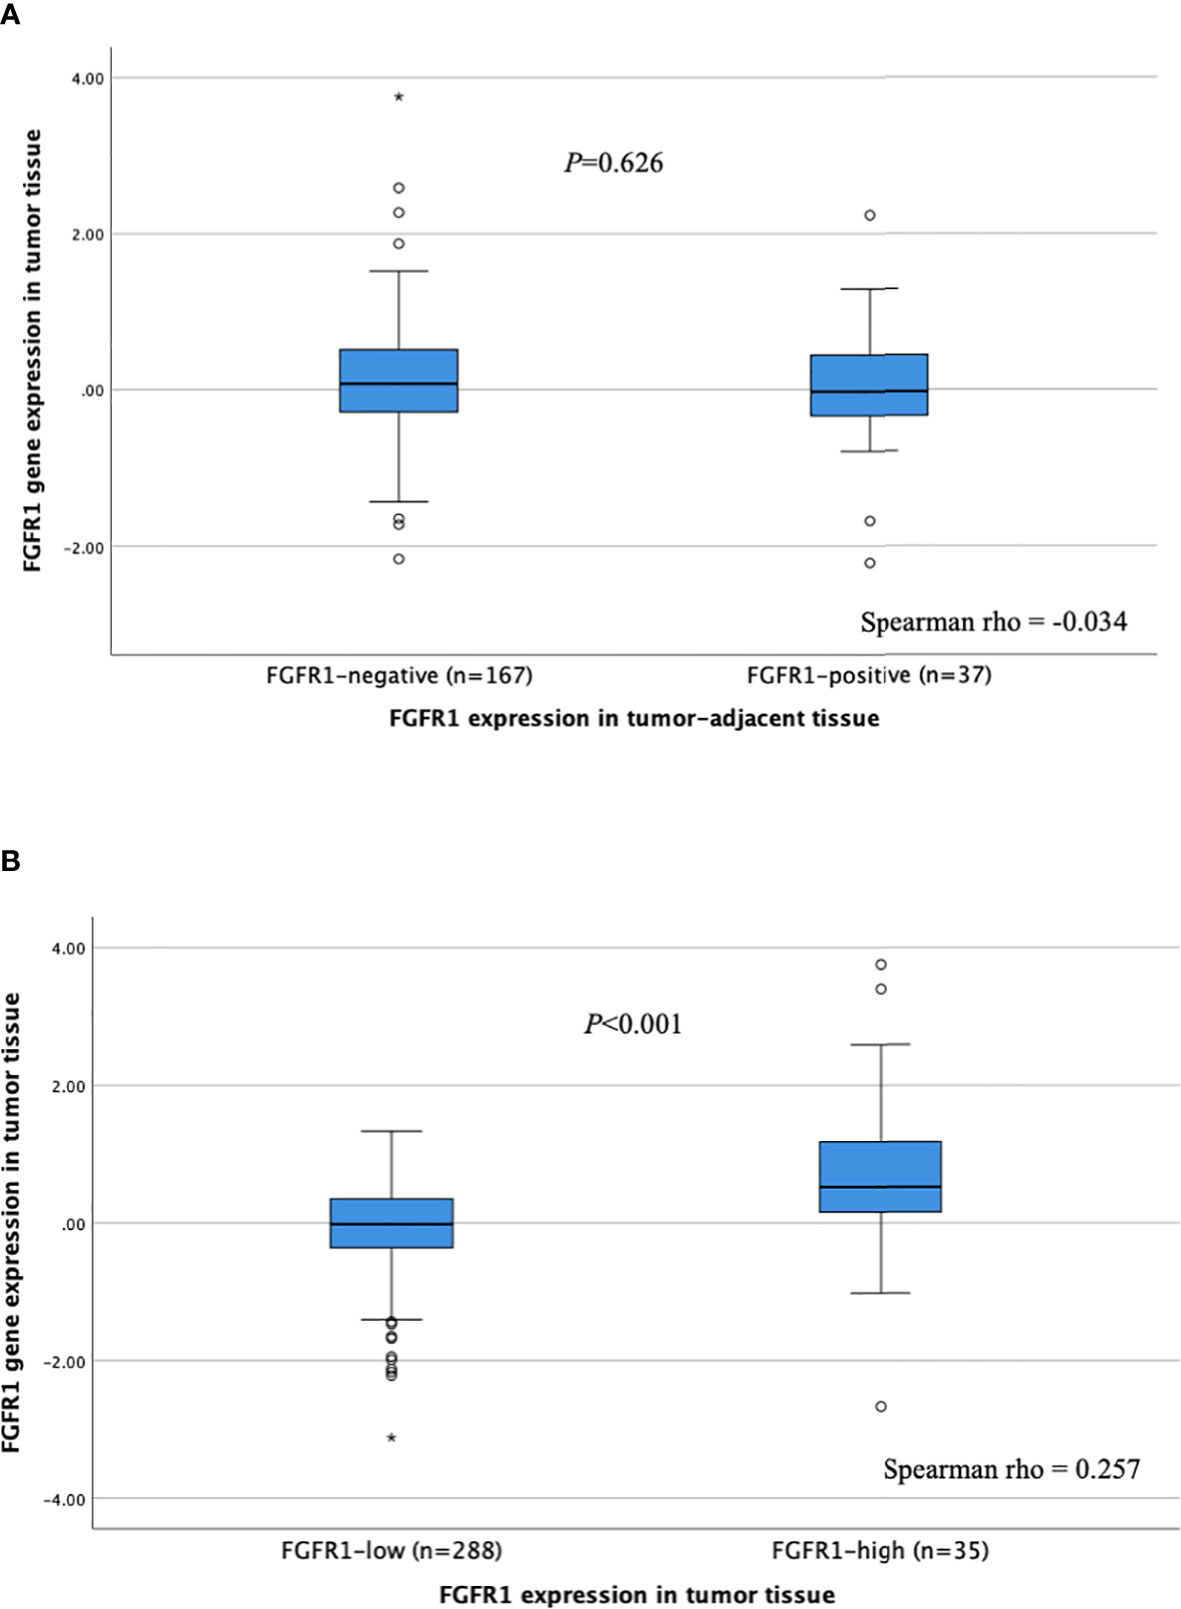
Figure 3 FGFR1 expression according to FGFR1 levels in (A) tumor-adjacent and (B) tumor tissues. P-values from Mann Whitney U-test comparing relative FGFR1 expression according to tumor-adjacent FGFR1-negative vs. positive tissue and tumor FGFR1-low vs high tissue, respectively. Spearman rho coefficients shown for correlation assessment between FGFR1 gene and protein expression. Open circles and stars indicate outliers and extremes, respectively.
No distinct difference in FGFR1 expression across BI-RADS categories was observed (Figure 4, Supplementary Table 1). However, a positive trend was found between FGF1 expression and MBD (Ptrend=0.06), in which FGF1 expression was higher among patients in BI-RADS categories B, C and D, compared with BI-RADS A (P<0.05, Figure 4, Supplementary Table 1). Similarly, FGF11 expression was higher among patients in the BI-RADS D category relative to patients in BI-RADS A, and FGF18 expression was higher in BI-RADS B, C, and D compared with BI-RADS A (P<0.05). The gene expression distribution of all assessable FGF ligands in relation to MBD is shown in Supplementary Table 1.
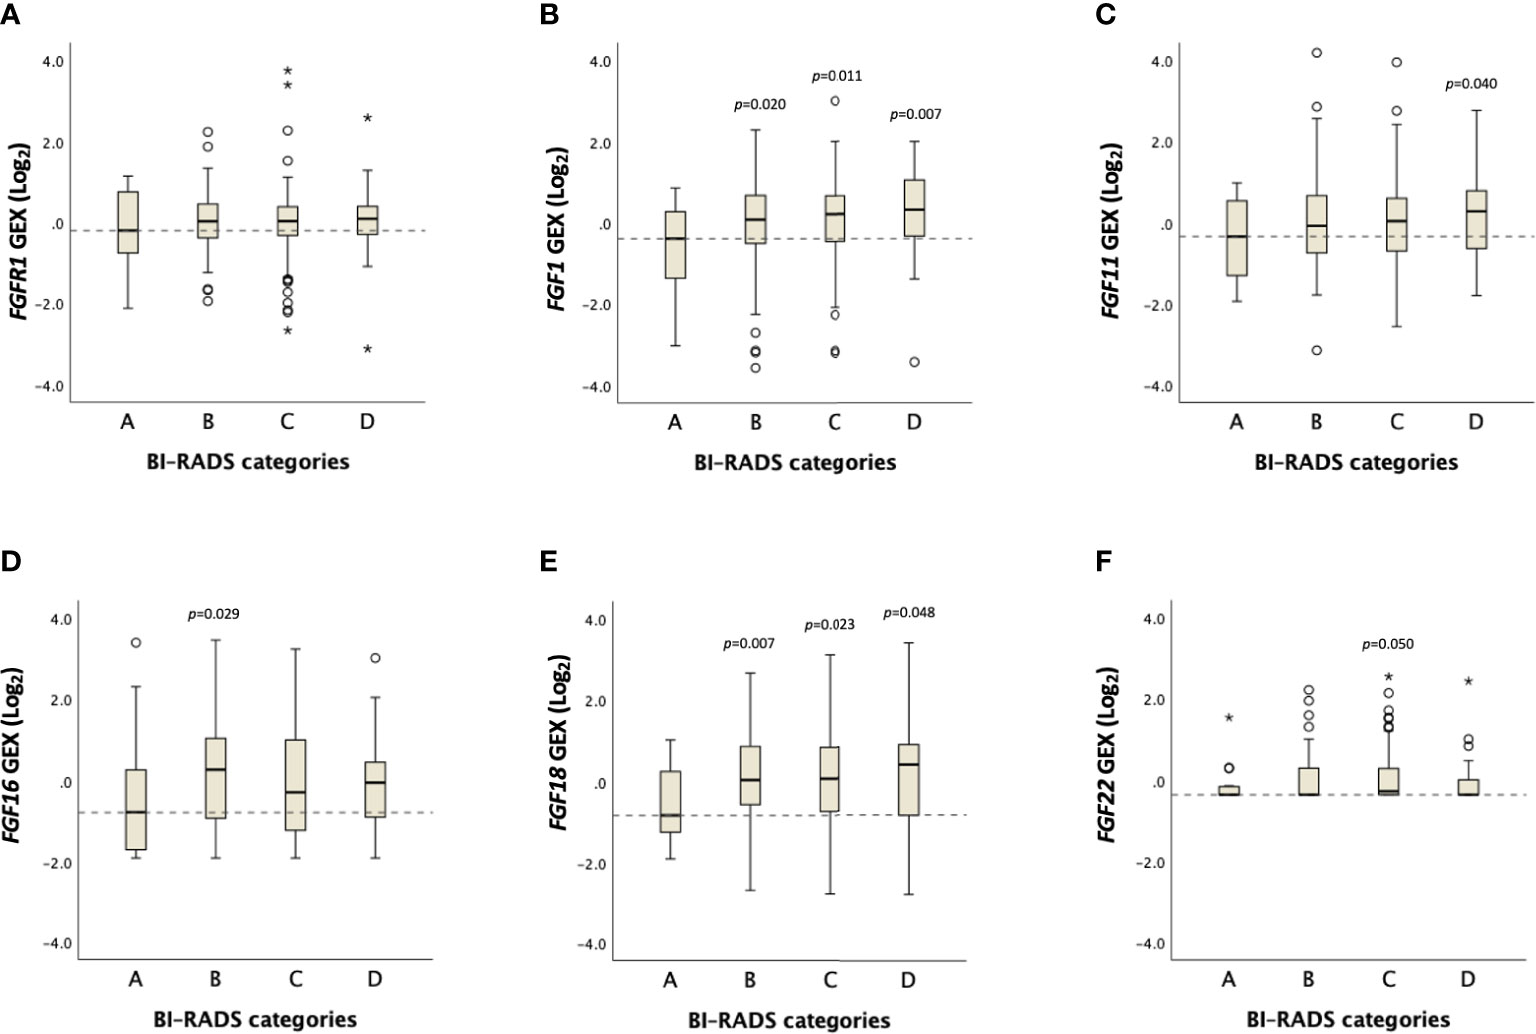
Figure 4 Distribution of FGFR1 and FGF ligand expression across BI-RADS MBD categories. Box plots showing Log2 transformed gene expression (GEX) values of (A) FGFR1, (B) FGF1, (C) FGF11, (D) FGF16, (E) FGF18, (F) FGF22 in breast tumor tissues across BI-RADS MBD categories. P-values comparing differences between groups in relation to BI-RADS A, assessed by the Jonckheere-Terpstra test. Dashed lines represent the median values of BI-RADS A. Open circles and stars indicate outliers and extremes, respectively.
Despite being an established independent breast cancer risk factor, knowledge on molecular biology underlying the MBD–breast cancer link is limited. To the best of our knowledge, this is the first study to assess the expression of FGFR1 in paired tumor-adjacent and tumor tissues, and its associations with MBD and tumor characteristics. Herein, we report that paired tumor-adjacent and tumor tissues express FGFR1 differentially, with elevated tumor-specific FGFR1 levels present in nearly 60% of the patients. High FGFR1 expression in tumor tissues is associated with less favorable tumor characteristics, and FGF ligand (FGF1, FGF11, FGF18) expression is associated with MBD.
Discovery of MBD-related mediators may have implications on breast cancer prevention as MBD has recently been shown as a modifiable risk factor for breast cancer. FGFR1 amplification is described as an early event in breast cancer initiation and dysregulated FGFR1 signaling is frequently occurring in breast cancer, and FGFR1 is a target for investigation in ongoing clinical trials for breast cancer therapy (17). Due to its role in paracrine signaling between epithelial cells and stromal fibroblasts that is emphasized in an ECM-dense environment, FGFR1 has been proposed as an MBD-related mediator in breast cancer development (12, 15).
Previously, a higher rate of FGFR1 amplification was reported in invasive breast carcinoma relative to ductal carcinoma in situ, particularly in high grade tumors (27) with FGFR1 amplification present in up to 14% of breast cancer patients (16, 28). However, the increase in copy number may not translate into a proportional increase in protein expression levels (29). In the present study, we found tumor-specific FGFR1 levels to be increased in 58% of the patients with early breast cancer compared with the corresponding FGFR1 levels in paired tumor-adjacent tissues.
Our findings further show an association between high tumor-specific FGFR1 levels with histological grade 3, high Ki67 index and Luminal B-like tumors. Consistently with our findings, FGFR1 amplification was previously shown to be associated with high Ki67 (30). Higher frequencies of FGFR1 amplification were also observed in luminal B-like tumors (31, 32), ER+, HER2-negative breast cancers as well as in patients >50 years of age (33). FGFR1 amplification was also reported to be associated with resistance to endocrine therapy, specifically, tamoxifen (34). FGFR1 activation in the mammary epithelium was shown to stimulate proliferation and upregulate epithelial-to-mesenchymal transition (EMT) in a HER2+ breast cancer model (35). An in vitro study that employed a luminal B cell line (BT-474) also showed a dependence on FGFR1 activation for cell proliferation through PI3K/AkT (36).
The rationale behind staining tumor-adjacent tissues was to assess the association between MBD measurements and the changes in the breast tissue expression profile between tumor-adjacent and tumor tissue. However, in our cohort, no association between FGFR1 expression in tumor-adjacent or tumor tissues and MBD was established. FGF ligands are secreted by activated fibroblasts, including mammary fibroblasts, and stored in the local microenvironment bound to extracellular matrix where they can induce FGFR1 signaling in adjacent epithelial cells (37). In our study, FGF1 expression in breast tumors was positively associated with MBD. In contrast to the present results addressing FGF ligand expression within the breast tumor, a study assessing circulating growth factor levels showed no association between plasma FGF1 expression and MBD (38). FGF11 and FGF18 were also found to be associated with MBD in our cohort, however limited information exists on their role in MBD or breast cancer. FGF11 is classically known as an intracellular FGF, although a recent study described extracellular activity of FGF11 and the capacity to induce cell proliferation via activation of FGFR1 (39). FGF18 copy number and mRNA levels have previously been shown to be increased in breast cancer compared with normal breast tissue (40). An in vitro study showed that FGF18 was induced during hypoxia and involved in cell cycle regulation and migration of breast cancer cells (40). A recent study showed that high levels of another FGFR1 ligand, FGF19, in breast microdialysis samples are strongly correlated with high MBD (41). However, this result could not be confirmed at the gene expression level in the present cohort with only insignificantly higher levels noticed among patients with the highest MBD.
A major strength of our study is the use of a well-characterized large prospective study population with validated clinical information. Another unique strength is the availability of paired tumor-adjacent and tumor tissues which provided us the opportunity to analyze differences in FGFR1 levels in-between breast epithelial and cancer cells. However, no information was available on the distance from the tumor adjacent tissue to the tumor border. Access to both FGFR1 gene and protein expression data is another strength as well as access to FGF ligand expression data.
The study also has some limitations. While TMA allows for protein expression analyses in a large number of samples, it does not represent the entire tumor tissue. However, the use of duplicate tissue cores reduces the influence of potential tissue heterogeneity. Despite the high number of participants of the KARMA cohort, the short follow-up time limited the number of incident breast cancer patients to study, and the final subgroup analyses were still restricted by small sample sizes that could have affected the robustness of the tests. The study is based on a large prospective mammography screening cohort and the present study population comprises breast cancer patients in Sweden, where the median age at diagnosis is 64 years on a national level, with few premenopausal patients. Therefore, our results are mainly restricted to postmenopausal women. As breast density varies according to age, the study results are not generalizable to younger women.
In conclusion, the present study showed increased FGFR1 expression in breast tumor tissue compared with paired tumor-adjacent breast tissue from the same patient. No clear association between FGFR1 expression and MBD was established. FGFR1 expression in tumor tissues was associated with less favorable tumor characteristics. FGF-1, -11, -18 expression in tumor tissues was associated with MBD. Further studies are needed to better understand the contribution of the FGFR1/FGF system to the molecular mechanisms behind the influence of MBD on breast cancer risk.
The data analyzed in this study is subject to the following licenses/restrictions: The datasets presented in this article are not readily available because of legal, ethical and privacy restrictions to protect patient confidentiality. Requests to access these datasets should be directed to the corresponding author (AR) and the steering committees of the KARMA and SCAN-B studies (http://www.karmastudy.org/ and https://www.scan-b.lu.se/).
The studies involving human participants were reviewed and approved by the regional Ethics Committee at Karolinska Institutet. The patients/participants provided their written informed consent to participate in this study.
Conceptualization, AR; formal analysis, ÖB and AR; resources, MK, JV-C, PH, SB, and AR, writing–original draft preparation, ÖB; writing–review and editing, ÖB, MK, JV-C, SZ, PH, SB, and AR; supervision and funding acquisition, PH, SB, and AR. All authors contributed to the article and approved the submitted version.
The Swedish Cancer Society (CAN 2020/1211), Mrs. Berta Kamprad Foundation (FBKS-2019-48-(219), FBKS-2022-43-(419)), Dir Albert Påhlsson Foundation (2021), the Swedish Breast Cancer Association (2022), Governmental Funding of Clinical Research within the National Health Service (ALF) (ALF: 2018-Project0211), and EU-MSCA-COFUND, 754299. Open access funding was provided by Lund University APC fund (20230525).
The authors would like to thank all the patients and clinicians participating in the KARMA and SCAN-B studies, all personnel who were involved in data collection, the personnel at the central SCAN-B laboratory at the Division of Oncology at Lund University, the Swedish National Breast Cancer Quality Registry (NKBC), Regional Cancer Center South (RCC Syd), Regional Biobank Center South (RBC Syd), the South Sweden Breast Cancer Group (SSBCG), and acknowledge Björn Nodin for the TMA construction and Lena Tran for IHC staining.
The authors declare that the research was conducted in the absence of any commercial or financial relationships that could be construed as a potential conflict of interest.
All claims expressed in this article are solely those of the authors and do not necessarily represent those of their affiliated organizations, or those of the publisher, the editors and the reviewers. Any product that may be evaluated in this article, or claim that may be made by its manufacturer, is not guaranteed or endorsed by the publisher.
The Supplementary Material for this article can be found online at: https://www.frontiersin.org/articles/10.3389/fonc.2023.1230821/full#supplementary-material
1. Sung H, Ferlay J, Siegel RL, Laversanne M, Soerjomataram I, Jemal A, et al. Global cancer statistics 2020: GLOBOCAN estimates of incidence and mortality worldwide for 36 cancers in 185 countries. CA Cancer J Clin (2021) 71(3):209–49. doi: 10.3322/caac.21660
2. Turashvili G, Brogi E. Tumor heterogeneity in breast cancer. Front Med (Lausanne) (2017) 4:227. doi: 10.3389/fmed.2017.00227
3. Arthur R, Wassertheil-Smoller S, Manson JE, Luo J, Snetselaar L, Hastert T, et al. The combined association of modifiable risk factors with breast cancer risk in the women's health initiative. Cancer Prev Res (Phila) (2018) 11(6):317–26. doi: 10.1158/1940-6207.CAPR-17-0347
4. Boraka O, Klintman M, Rosendahl AH. Physical activity and long-term risk of breast cancer, associations with time in life and body composition in the prospective malmo diet and cancer study. Cancers (Basel) (2022) 14(8):1–15. doi: 10.3390/cancers14081960
5. McCormack VA, dos Santos Silva I. Breast density and parenchymal patterns as markers of breast cancer risk: a meta-analysis. Cancer Epidemiol Biomarkers Prev (2006) 15(6):1159–69. doi: 10.1158/1055-9965.EPI-06-0034
6. Boyd NF, Guo H, Martin LJ, Sun L, Stone J, Fishell E, et al. Mammographic density and the risk and detection of breast cancer. N Engl J Med (2007) 356(3):227–36. doi: 10.1056/NEJMoa062790
7. Eriksson M, Eklund M, Borgquist S, Hellgren R, Margolin S, Thoren L, et al. Low-dose tamoxifen for mammographic density reduction: a randomized controlled trial. J Clin Oncol (2021) 39(17):1899–908. doi: 10.1200/JCO.20.02598
8. Gabrielson M, Hammarstrom M, Backlund M, Bergqvist J, Lang K, Rosendahl AH, et al. Effects of tamoxifen on normal breast tissue histological composition: results from a randomised six-arm placebo-controlled trial in healthy women. Int J Cancer (2023) 152(11):2632–72. doi: 10.1002/ijc.34430
9. Mocellin S, Goodwin A, Pasquali S. Risk-reducing medications for primary breast cancer: a network meta-analysis. Cochrane Database Syst Rev (2019) 4(4):CD012191. doi: 10.1002/14651858.CD012191.pub2
10. Winkler J, Abisoye-Ogunniyan A, Metcalf KJ, Werb Z. Concepts of extracellular matrix remodelling in tumour progression and metastasis. Nat Commun (2020) 11(1):5120. doi: 10.1038/s41467-020-18794-x
11. Rybinska I, Agresti R, Trapani A, Tagliabue E, Triulzi T. Adipocytes in breast cancer, the thick and the thin. Cells (2020) 9:(3). doi: 10.3390/cells9030560
12. DiGiacomo JW, Godet I, Trautmann-Rodriguez M, Gilkes DM. Extracellular matrix-bound FGF2 mediates estrogen receptor signaling and therapeutic response in breast cancer. Mol Cancer Res (2021) 19(1):136–49. doi: 10.1158/1541-7786.MCR-20-0554
13. Lisanti MP, Tsirigos A, Pavlides S, Reeves KJ, Peiris-Pages M, Chadwick AL, et al. JNK1 stress signaling is hyper-activated in high breast density and the tumor stroma: connecting fibrosis, inflammation, and stemness for cancer prevention. Cell Cycle (2014) 13(4):580–99. doi: 10.4161/cc.27379
14. Kong-Beltran M, Donoghue DJ. Signaling from FGF receptors in development and disease. Handbook of Cell Signaling (2003) Chapter 264:861–5. doi: 10.1016/B978-012124546-7/50625-2
15. Xie Y, Su N, Yang J, Tan Q, Huang S, Jin M, et al. FGF/FGFR signaling in health and disease. Signal Transduct Target Ther (2020) 5(1):181. doi: 10.1038/s41392-020-00222-7
16. Helsten T, Elkin S, Arthur E, Tomson BN, Carter J, Kurzrock R. The FGFR landscape in cancer: analysis of 4,853 tumors by next-generation sequencing. Clin Cancer Res (2016) 22(1):259–67. doi: 10.1158/1078-0432.CCR-14-3212
17. Lomakin A, Svedlund J, Strell C, Gataric M, Shmatko A, Rukhovich G, et al. Spatial genomics maps the structure, nature and evolution of cancer clones. Nature (2022) 611(7936):594–602. doi: 10.1038/s41586-022-05425-2
18. Easton DF, Pooley KA, Dunning AM, Pharoah PD, Thompson D, Ballinger DG, et al. Genome-wide association study identifies novel breast cancer susceptibility loci. Nature (2007) 447(7148):1087–93. doi: 10.1038/nature05887
19. Servetto A, Kollipara R, Formisano L, Lin CC, Lee KM, Sudhan DR, et al. Nuclear FGFR1 regulates gene transcription and promotes antiestrogen resistance in ER(+) breast cancer. Clin Cancer Res (2021) 27(15):4379–96. doi: 10.1158/1078-0432.CCR-20-3905
20. Gabrielson M, Eriksson M, Hammarstrom M, Borgquist S, Leifland K, Czene K, et al. Cohort profile: the karolinska mammography project for risk prediction of breast cancer (KARMA). Int J Epidemiol (2017) 46(6):1740–1741g. doi: 10.1093/ije/dyw357
21. Klintman M, Bendahl PO, Grabau D, Lovgren K, Malmstrom P, Ferno M, et al. The prognostic value of Ki67 is dependent on estrogen receptor status and histological grade in premenopausal patients with node-negative breast cancer. Mod Pathol (2010) 23(2):251–9. doi: 10.1038/modpathol.2009.167
22. Eriksson M, Li J, Leifland K, Czene K, Hall P. A comprehensive tool for measuring mammographic density changes over time. Breast Cancer Res Treat (2018) 169(2):371–9. doi: 10.1007/s10549-018-4690-5
23. Spak DA, Plaxco JS, Santiago L, Dryden MJ, Dogan BE. BI-RADS((R)) fifth edition: a summary of changes. Diagn Interv Imag (2017) 98(3):179–90. doi: 10.1016/j.diii.2017.01.001
24. McShane LM, Altman DG, Sauerbrei W, Taube SE, Gion M, Clark GM, et al. REporting recommendations for tumour MARKer prognostic studies (REMARK). Br J Cancer (2005) 93(4):387–91. doi: 10.1038/sj.bjc.6602678
25. Saal LH, Vallon-Christersson J, Hakkinen J, Hegardt C, Grabau D, Winter C, et al. The Sweden cancerome analysis network - breast (SCAN-b) initiative: a large-scale multicenter infrastructure towards implementation of breast cancer genomic analyses in the clinical routine. Genome Med (2015) 7(1):20. doi: 10.1186/s13073-015-0131-9
26. Staaf J, Hakkinen J, Hegardt C, Saal LH, Kimbung S, Hedenfalk I, et al. RNA Sequencing-based single sample predictors of molecular subtype and risk of recurrence for clinical assessment of early-stage breast cancer. medRxiv (2021) 10:13. doi: 10.1101/2021.12.03.21267116
27. Jang M, Kim E, Choi Y, Lee H, Kim Y, Kim J, et al. FGFR1 is amplified during the progression of in situ to invasive breast carcinoma. Breast Cancer Res (2012) 14(4):R115. doi:10.1186/bcr3239
28. Gonzalez-Ericsson PI, Servetto A, Formisano L, Sanchez V, Mayer IA, Arteaga CL, et al. FGFR1 antibody validation and characterization of FGFR1 protein expression in ER+ breast cancer. Appl Immunohistochem Mol Morphol (2022) 30(9):600–8. doi: 10.1097/PAI.0000000000001058
29. Goncalves E, Fragoulis A, Garcia-Alonso L, Cramer T, Saez-Rodriguez J, Beltrao P. Widespread post-transcriptional attenuation of genomic copy-number variation in cancer. Cell Syst (2017) 5(4):386–98.e4. doi: 10.1016/j.cels.2017.08.013
30. Bofin AM, Ytterhus B, Klaestad E, Valla M. FGFR1 copy number in breast cancer: associations with proliferation, histopathological grade and molecular subtypes. J Clin Pathol (2022) 75(7):459–64. doi: 10.1136/jclinpath-2021-207456
31. Shi YJ, Tsang JY, Ni YB, Chan SK, Chan KF, Tse GM. FGFR1 is an adverse outcome indicator for luminal a breast cancers. Oncotarget (2016) 7(4):5063–73. doi: 10.18632/oncotarget.6563
32. Erber R, Rubner M, Davenport S, Hauke S, Beckmann MW, Hartmann A, et al. Impact of fibroblast growth factor receptor 1 (FGFR1) amplification on the prognosis of breast cancer patients. Breast Cancer Res Treat (2020) 184(2):311–24. doi: 10.1007/s10549-020-05865-2
33. Elbauomy Elsheikh S, Green AR, Lambros MB, Turner NC, Grainge MJ, Powe D, et al. FGFR1 amplification in breast carcinomas: a chromogenic in situ hybridisation analysis. Breast Cancer Res (2007) 9(2):R23. doi: 10.1186/bcr1665
34. Turner N, Pearson A, Sharpe R, Lambros M, Geyer F, Lopez-Garcia MA, et al. FGFR1 amplification drives endocrine therapy resistance and is a therapeutic target in breast cancer. Cancer Res (2010) 70(5):2085–94. doi: 10.1158/0008-5472.CAN-09-3746
35. Qian X, Anzovino A, Kim S, Suyama K, Yao J, Hulit J, et al. N-cadherin/FGFR promotes metastasis through epithelial-to-mesenchymal transition and stem/progenitor cell-like properties. Oncogene (2014) 33(26):3411–21. doi: 10.1038/onc.2013.310
36. Morales-Guadarrama G, Mendez-Perez EA, Garcia-Quiroz J, Avila E, Larrea F, Diaz L. AZD4547 and calcitriol synergistically inhibited BT-474 cell proliferation while modified stemness and tumorsphere formation. J Steroid Biochem Mol Biol (2022) 223:106132. doi: 10.1016/j.jsbmb.2022.106132
37. Taipale J, Keski-Oja J. Growth factors in the extracellular matrix. FASEB J (1997) 11(1):51–9. doi: 10.1096/fasebj.11.1.9034166
38. Akinjiyan FA, Adams A, Xu S, Wang M, Toriola AT. Plasma growth factor gene expression and mammographic breast density in postmenopausal women. Cancer Prev Res (Phila) (2022) 15(6):391–8. doi: 10.1158/1940-6207.CAPR-21-0253
39. Lee KW, An YJ, Lee J, Jung YE, Ko IY, Jin J, et al. Expression and purification of intracrine human FGF 11 and study of its FGFR-dependent biological activity. J Microbiol (2022) 60(11):1086–94. doi: 10.1007/s12275-022-2406-3
40. Song N, Zhong J, Hu Q, Gu T, Yang B, Zhang J, et al. FGF18 enhances migration and the epithelial-mesenchymal transition in breast cancer by regulating Akt/GSK3beta/Beta-catenin signaling. Cell Physiol Biochem (2018) 49(3):1019–32. doi: 10.1159/000493286
Keywords: breast cancer, mammographic breast density, fibroblast growth factor receptor, FGFR1, tumor characteristics
Citation: Boraka Ö, Klintman M, Vallon-Christersson J, Zackrisson S, Hall P, Borgquist S and Rosendahl AH (2023) FGF/FGFR1 system in paired breast tumor-adjacent and tumor tissues, associations with mammographic breast density and tumor characteristics. Front. Oncol. 13:1230821. doi: 10.3389/fonc.2023.1230821
Received: 29 May 2023; Accepted: 04 July 2023;
Published: 20 July 2023.
Edited by:
Tiziana Triulzi, Fondazione IRCCS Istituto Nazionale dei Tumori, ItalyReviewed by:
Antoni Wiedlocha, Oslo University Hospital, NorwayCopyright © 2023 Boraka, Klintman, Vallon-Christersson, Zackrisson, Hall, Borgquist and Rosendahl. This is an open-access article distributed under the terms of the Creative Commons Attribution License (CC BY). The use, distribution or reproduction in other forums is permitted, provided the original author(s) and the copyright owner(s) are credited and that the original publication in this journal is cited, in accordance with accepted academic practice. No use, distribution or reproduction is permitted which does not comply with these terms.
*Correspondence: Ann H. Rosendahl, YW5uLnJvc2VuZGFobEBtZWQubHUuc2U=
Disclaimer: All claims expressed in this article are solely those of the authors and do not necessarily represent those of their affiliated organizations, or those of the publisher, the editors and the reviewers. Any product that may be evaluated in this article or claim that may be made by its manufacturer is not guaranteed or endorsed by the publisher.
Research integrity at Frontiers
Learn more about the work of our research integrity team to safeguard the quality of each article we publish.