 Yihua Wang
 Lijun Wang
 Haitao Huang2
 Liangjie Lin
 Qingwei Song
 Ailian Liu
- 1Department of Radiology, First Affiliated Hospital of Dalian Medical University, Dalian, China
- 2Department of Stomatology, First Affiliated Hospital of Dalian Medical University, Dalian, China
- 3Clinical and Technical Support, Philips Healthcare, Beijing, China
Purpose: To assess the usefulness of amide proton transfer-weighted (APTw) imaging in the differentiation of parotid gland tumors.
Materials and methods: Patients with parotid gland tumors who underwent APTw imaging were retrospectively enrolled and divided into groups according to pathology. Two radiologists evaluated the APTw image quality independently, and APTw images with quality score ≥3 were enrolled. The maximum and average values of APTw imaging for tumor lesions (APTmax and APTmean) were measured. The differences in APTmax and APTmean were compared between malignant tumors (MTs) and benign tumors (BTs), as well as between MTs and pleomorphic adenomas (PAs) and between MTs and Warthin tumors (WTs). Independent-samples t-test, Kruskal–Wallis H test, and receiver operating characteristic (ROC) curve analyses were used for statistical analysis.
Results: Seventy-three patients were included for image quality evaluation. In this study, 32/73 and 29/73 parotid tumors were scored as 4 and 3, respectively. After excluding lesions with quality score ≤2 (12/73), the APTmean and APTmax of MTs were 4.15% ± 1.33% and 7.43% ± 1.61%, higher than those of BTs 2.74% ± 1.04% and 5.25% ± 1.54%, respectively (p < 0.05). The areas under the ROC curve (AUCs) of the APTmean and APTmax for differentiation between MTs and BTs were 0.819 and 0.821, respectively. MTs indicated significantly higher APTmean and APTmax values than those of PAs (p < 0.05) and WTs (p < 0.05). The AUCs of the APTmean and APTmax for differentiation between MTs and PAs were 0.830 and 0.815 and between MTs and WTs were 0.847 and 0.920, respectively.
Conclusion: Most APTw images for parotid tumors had acceptable image quality for APTw value evaluation. Both APTmax and APTmean can be used to differentiate MTs from BTs and to differentiate MTs from subtype parotid gland tumors.
Introduction
Salivary gland tumors account for approximately 2%~5% of all tumors in the head and neck (1, 2), with nearly 80% occurring in the parotid glands. The parotid benign tumors (BTs) and malignant tumors (MTs) account for approximately 80% and 20%, respectively (3). For BTs, local parotidectomy or superficial lobectomy is adopted to protect the facial nerve. For MTs, total parotidectomy is required (4, 5). Preoperative biopsy is helpful for the qualitative diagnosis of parotid gland tumors, but some punctures have the risk of capsule rupture, which will greatly increase the risk of tumor proliferation or implantation (6). Therefore, noninvasive qualitative preoperative diagnosis has become an urgent clinical need.
Magnetic resonance imaging (MRI) is one of the major methods to diagnose tumors of the head and neck with good visualization (7, 8). However, the pathological types of parotid gland tumors are various, and there exists substantial overlap in the appearance of tumors, which limits the role of conventional MRI in characterization and brings great difficulty to the preoperative qualitative diagnosis (9). In the past, diffusion-weighted imaging (DWI), dynamic contrast-enhanced MRI (DCE-MRI), and other functional imaging have been used to evaluate parotid tumors, but the diagnostic ability of one single functional MRI technology is limited (10–12). Rather, multiparametric analysis is usually required to improve diagnostic accuracy (13, 14). However, there are still some challenges in the clinical applications of multiparametric analysis because of the long acquisition time and requirement in the injection of contrast agents in DCE-MRI.
Amide proton transfer-weighted (APTw) imaging is a novel imaging technique that uses endogenous contrast by chemical exchange saturation transfer to indirectly detect mobile proteins and peptides in tissues, which are thought to closely relate to tumor metabolism (15). The clinical utility of APTw imaging has already been demonstrated in glioma, lung cancer, prostate cancer, endometrial carcinoma, and rectal cancer (16–19). Kamitani et al. (20) demonstrated that for parotid tumors, the mean APTw values measured from circle regions of interest (ROIs) in MTs were higher than those in BTs. Bae et al. (21) reported about parotid gland that APTw imaging was superior to conventional MRI contrasts and to advanced functional imaging methods such as DCE-MRI and DWI. However, one limitation of APTw is its vulnerability to hyperintensity artifacts in the parotid gland, resulting in false positives in the evaluation of lesions probably (22, 23). Therefore, in this study, we investigated APTw imaging in parotid lesions in terms of image quality to ensure the accuracy of APTw measurements and evaluated its ability to differentiate among parotid gland tumors.
Materials and methods
Patients
The institutional review board of our hospital approved our retrospective study (license number: PJ-KS-XJS-2021-18). The patients who participated in this study provided their written informed consent. Inclusion criteria were as follows: 1) the clinical and pathological information was complete; 2) 3.0T MRI examination [including T1-weighted imaging (T1WI), T2-weighted imaging (T2WI), and APTw imaging] was performed within 1 week before treatment; 3) no treatment before MRI examination. Exclusion criteria were as follows: 1) parotid lesions were not clearly visible on images or motion artifacts affected the observation; 2) the tumor diameter was less than 2 cm that it was difficult to define the boundary of the tumor. The flowchart of patient inclusion and exclusion is shown in Figure 1.
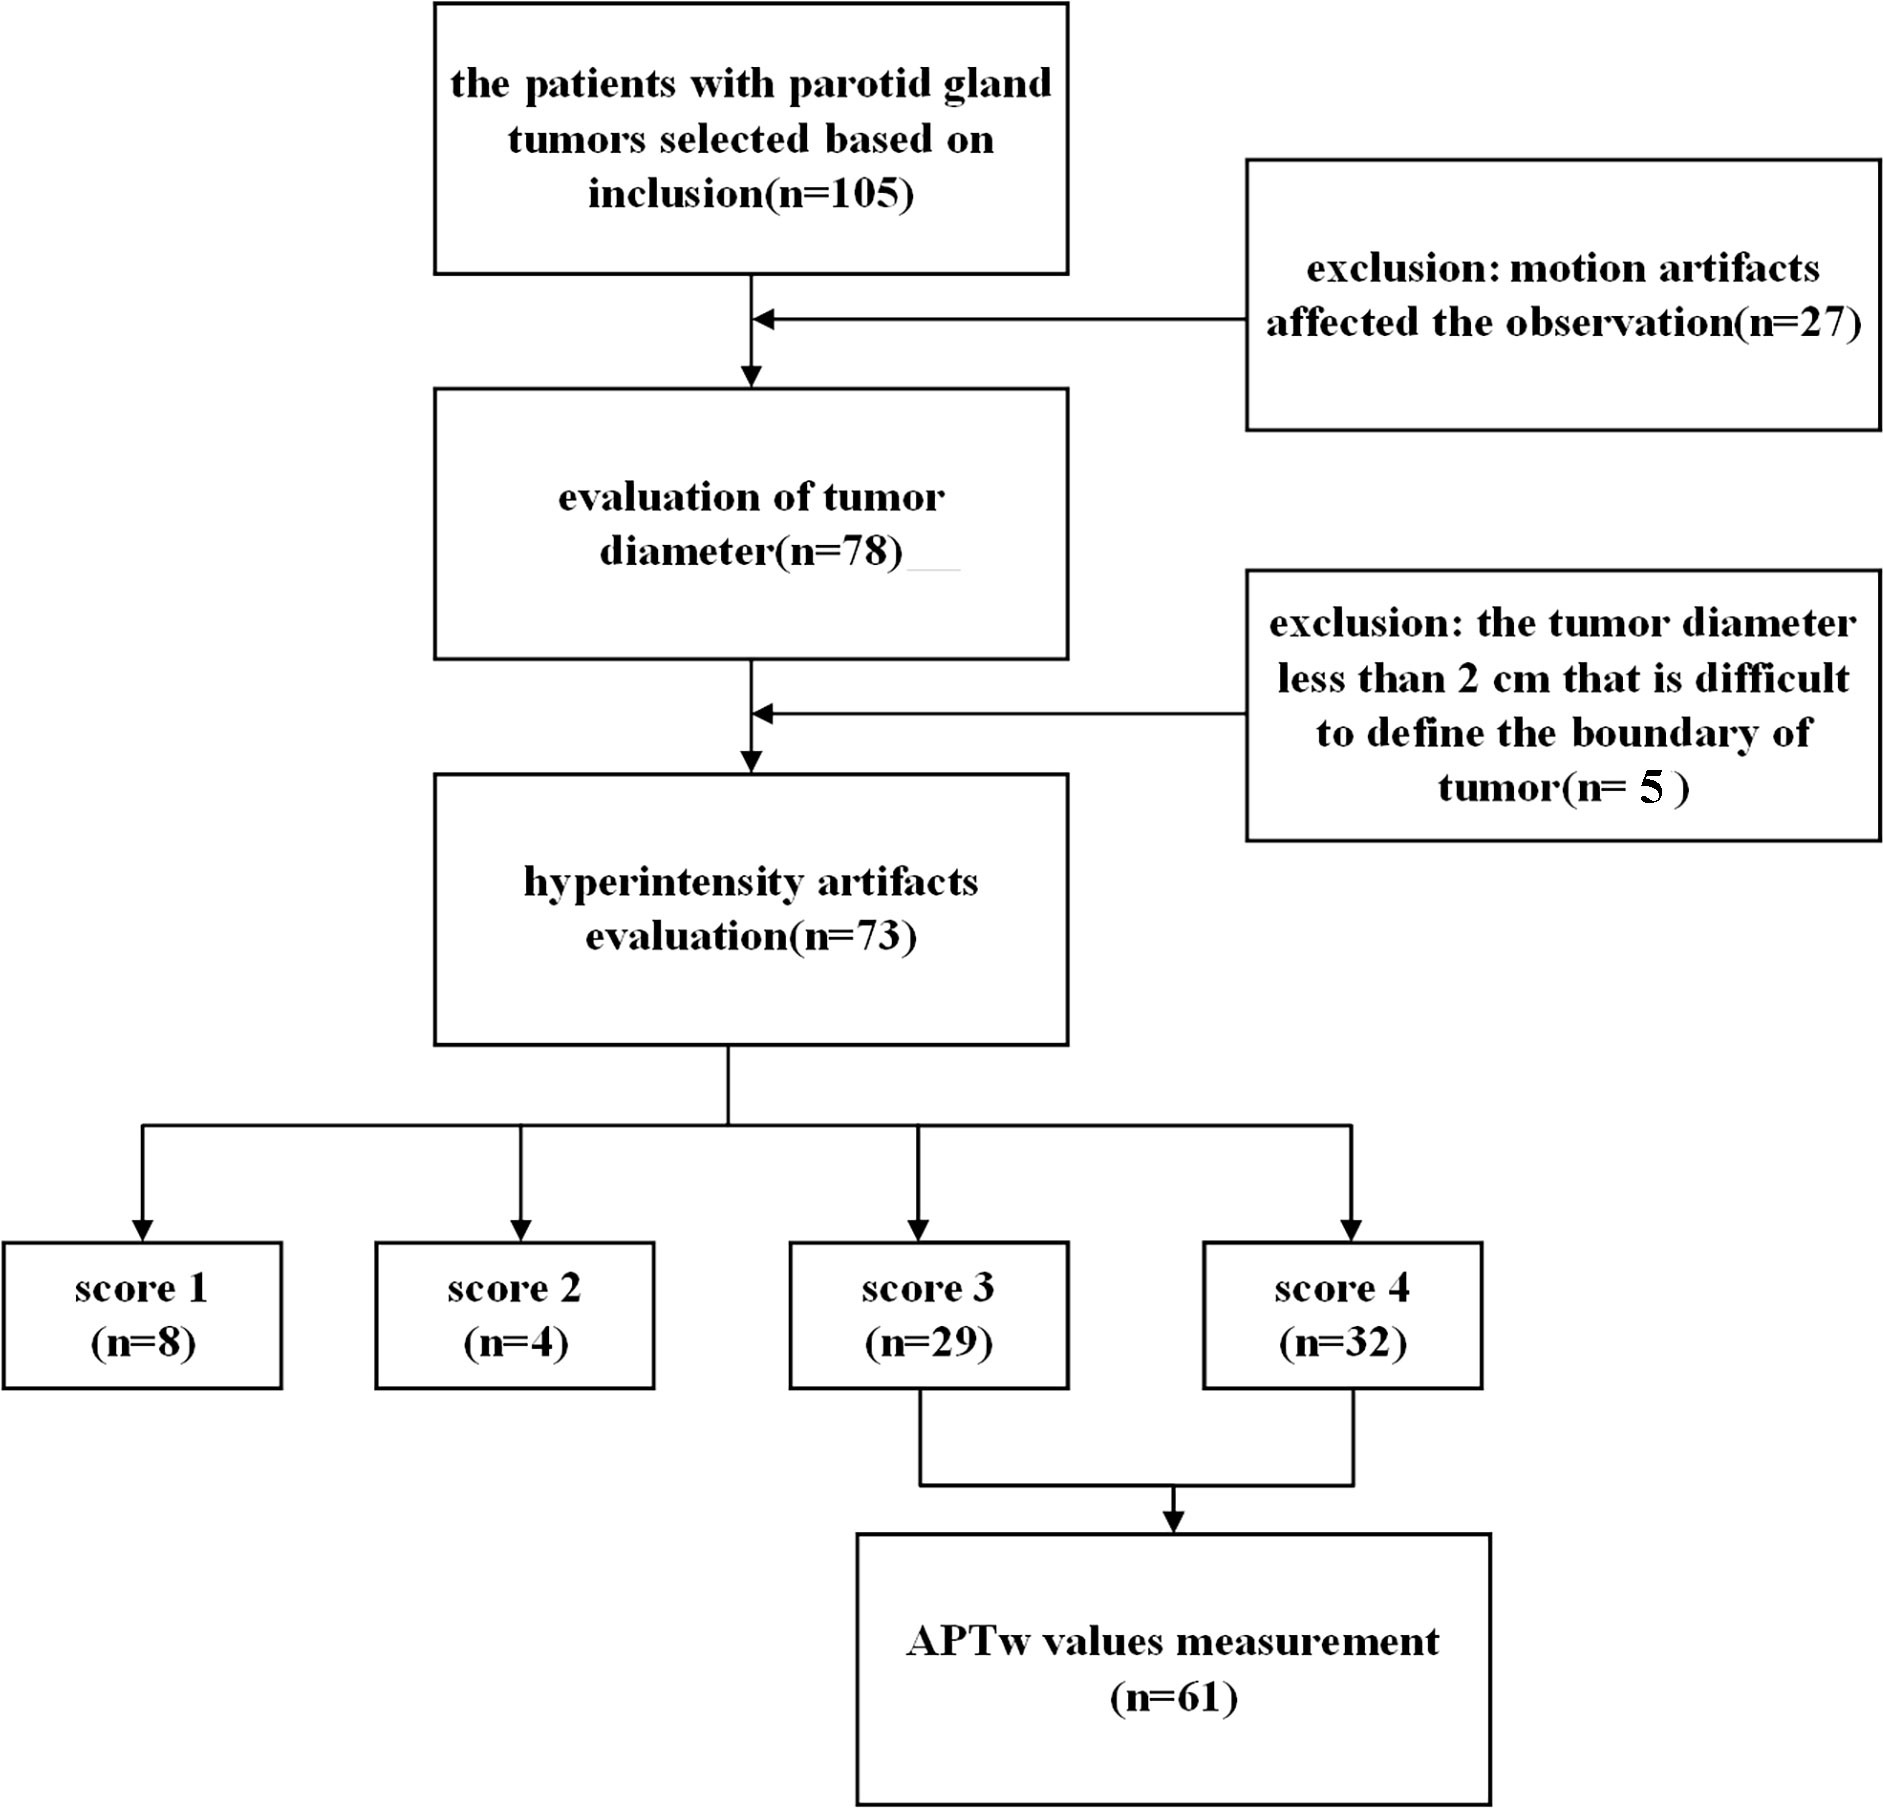
Figure 1 Flowchart depicting the patient selection.
Based on inclusion criteria, the imaging and clinical information data of 105 patients with parotid gland tumors in our hospital from September 2020 to October 2022 were retrospectively analyzed. All patients underwent surgical treatment in the Department of Stomatology of our hospital within 1 week after MRI examination. All extracted tumor tissues routinely underwent histopathological examination after the operation. These tissues were embedded in paraffin, stained with hematoxylin–eosin, and examined microscopically.
MRI
APTw imaging was performed using a 3.0T MR scanner (Ingenia CX; Philips Healthcare, Best, Netherlands) with a 32-channel phase-array head coil. In addition, the protocol of conventional MRI was acquired, including the axial T1WI and axial fat-suppressed T2WI. The APTw sequence used in this study is based on Chen et al. (23). The detailed parameters of all MRI sequences are shown in Table 1. The MTRasym(3.5 ppm) was calculated by the following equation: MTRasym(3.5 ppm) = (S-3.5 ppm − S3.5 ppm)/S0, where S-3.5 ppm is the signal intensity acquired at the saturation frequency of -3.5 ppm, S3.5 ppm is the signal intensity acquired at the saturation frequency of 3.5 ppm, and S0 is the reference signal intensity acquired at a saturation frequency of 1,540 ppm (the water frequency was referred to as 0 ppm).
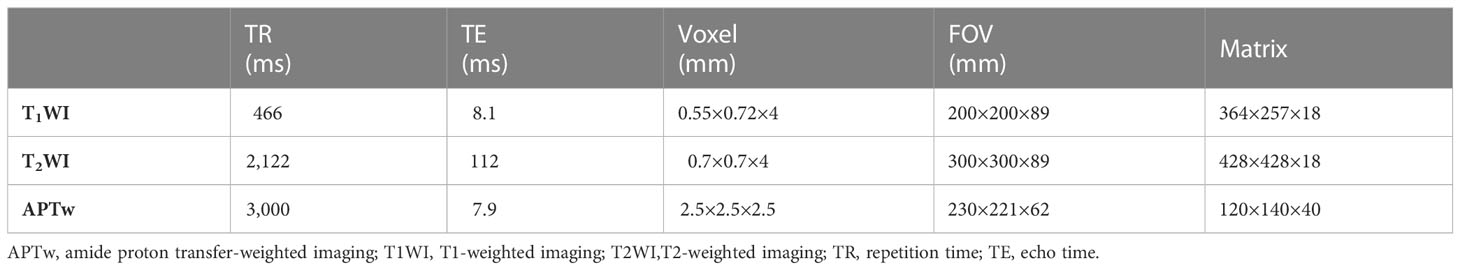
Table 1 Scan parameters of T1WI, T2WI, and APTw.
MR image evaluation
APTw images were automatically reconstructed after data acquisition and then transferred to the Intellispace Portal (ISP v9.0, Philips Healthcare) workstation. The image quality evaluation and quantitative measurements of APTw image were implemented by two experienced radiologists in MRI diagnosis independently (radiologist 1 and radiologist 2 had 3 and 20 years of MRI diagnosis experience, respectively) who were blinded to pathological results. With APTw images fused to axial T2WI images, the degree of image quality was judged with a 4-scale scoring system according to a previous report (23): 4 = excellent, tumor could be recognized on APTw images without hyperintensity artifacts; 3 = good, hyperintensity artifacts impair less than 50% tumor; 2 = moderate, hyperintensity artifacts impair more than 50% tumor; 1 = poor, the entire tumor is impaired by hyperintensity artifacts.
APTw images with image quality score no higher than 2 were excluded for further analyses. The ROI was carefully drawn on a slice of the fused image showing the maximum lesion to cover the solid part of the tumor as much as possible and exclude the cystic degeneration, necrosis, and hyperintensity artifacts from surrounding tissues (Figure 2). The maximum (APTmax) and the average (APTmean) values were recorded.
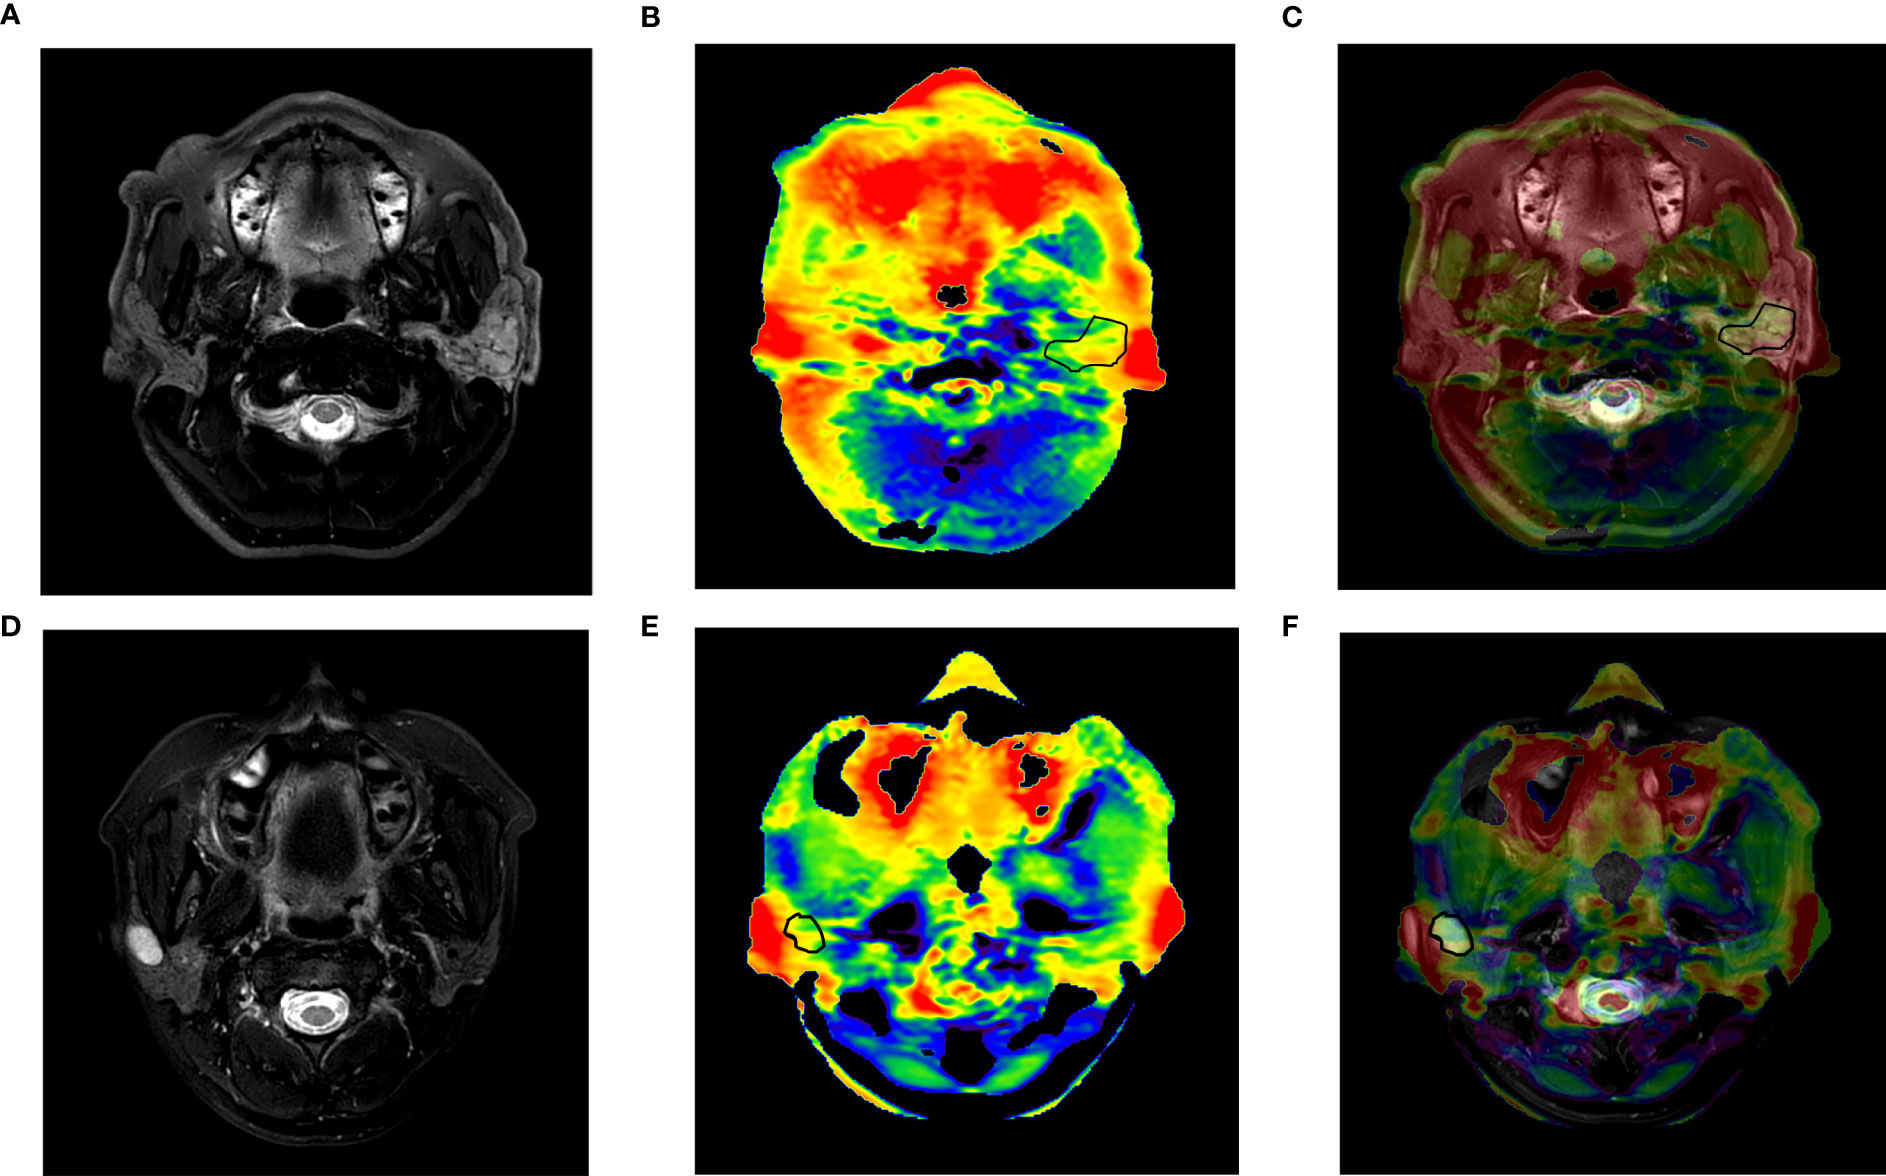
Figure 2 (A–C) A 57-year-old man with adenoid cystic carcinoma of the left parotid gland. (A) T2WI; (B) APTw image; (C) APTw image (fused on T2WI) showed an image quality score of 3 with little hyperintensity artifact less than 50% tumor, an APTmean of 5.14%, and an APTmax of 6.75%. (D–F) A 30-year-old woman with pleomorphic adenoma of the right parotid gland. (D) T2WI; (E) APTw image; (F) APTw image (fused on T2WI) showed an image quality score of 4, an APTmean value of 1.95%, and an APTmax of 4.9%. APTmax, the maximum value of APTw imaging; APTmean, the average value of APTw imaging; APTw, amide proton transfer-weighted.
Statistical analysis
For statistical analyses of patient information and diagnostic efficacy of APTw, we used SPSS (version 25.0; IBM Corp., Armonk, NY, USA) and MedCalc (version 20 MedCalc Software Ltd., Ostend, Belgium). The interobserver reliability for all APTw values measured by two radiologists was assessed via intraclass correlation coefficient (ICC) (excellent, >0.75; good, 0.60~0.74; fair, 0.40~0.59; poor, <0.40). One-sample Kolmogorov–Smirnov test was performed to test the normality of APTmax and APTmean values for both BTs and MTs, as well as patient ages. When continuous variables conformed to the normal distribution, the parameters were expressed as mean ± standard deviation, and independent-samples t-test was used for comparisons between BTs and MTs groups; otherwise, they were expressed as median (first quartile, third quartile), and Mann–Whitney U test was used. The Kruskal–Wallis H test was used to test the differences of the two parameters among pleomorphic adenomas (PAs), Warthin tumors (WTs), and MTs. The pairwise comparison with Bonferroni correction was made with overall test statistically significant for the above three groups. Receiver operating characteristic (ROC) curve analysis was used to determine the diagnostic value of APTmax and APTmean for the differentiation between MTs and BTs. The threshold criterion was calculated to maximize the Youden index. ROC curves were compared by the method of DeLong et al. (24). p < 0.05 was considered statistically significant.
Results
Patient characteristics
Among the included 105 patients, 27 patients were excluded because of the incomplete MR scans or severe motion artifacts on images, and five patients were excluded due to the small tumor size and unclear tumor boundary. Finally, we enrolled a total of 73 patients for the next image quality analysis. According to the benign and malignant pathological results, 73 patients who were included for image quality scale analysis were divided into two groups (Table 2). There was no significant difference in age (p = 0.63) between benign and malignant groups.
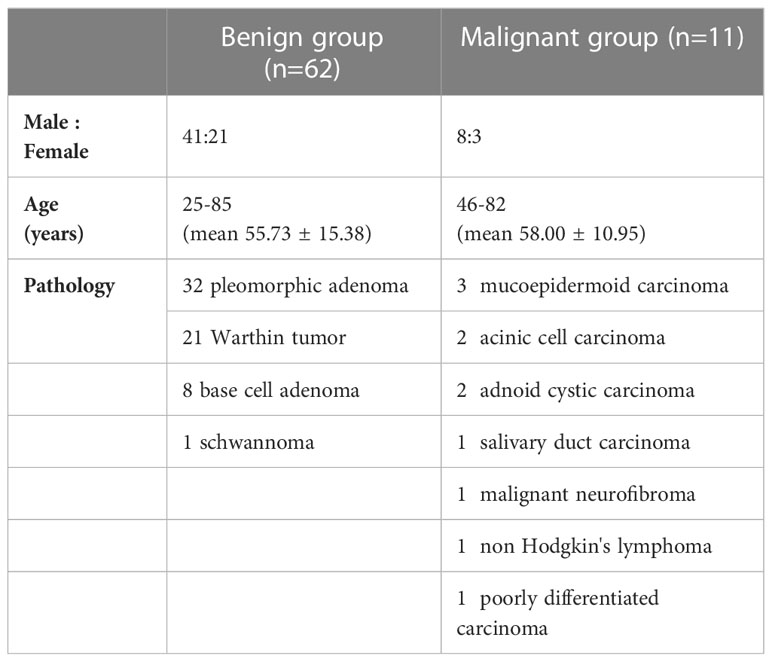
Table 2 Demographics for patients confirmed by surgery.
Score of APTw image quality
Interobserver agreement was excellent, with ICCs = 0.989 for artifact scores of parotid lesions by the two readers. In the evaluation of image quality, 32 out of 73 parotid tumors (43.84%) were considered for score 4, and 29 out of 73 (39.73%) for score 3. Moreover, 5.48% (4/73) and 10.95% (8/73) of tumors were scored 2 and 1, respectively, which showed parotid lesions highly affected by hyperintensity artifacts and were removed in the subsequent measurement of APTw values.
APTw finding and diagnostic performance between BTs and MTs
After excluding the cases with image quality scores ≤2, 61 patients were involved in the quantitative evaluation. Interobserver agreement was excellent, with ICCs = 0.994 and 0.918, respectively, for APTmax and APTmean measurements, and the average values by the two observers were taken for analyses. The APTmean of MTs (4.15% ± 1.33%) was significantly higher than that of BTs (2.74% ± 1.04%) (p < 0.05), and the APTmax value of MTs was (7.43% ± 1.61%), similarly higher than that of BTs (5.25% ± 1.54%) (p < 0.05) (Table 3, Figure 3).
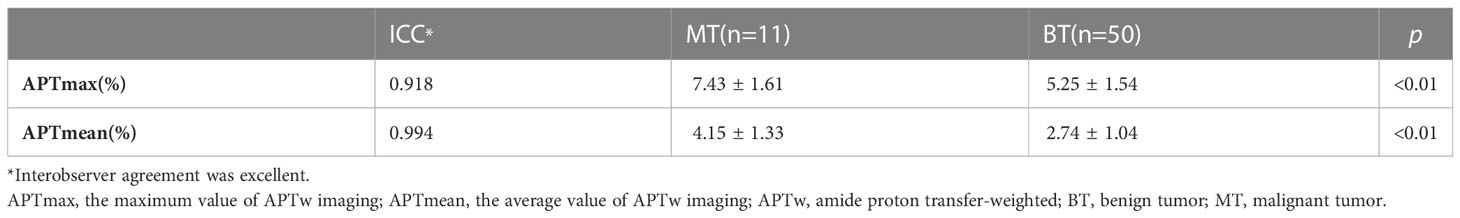
Table 3 Comparison of APTw values between BT and MT.
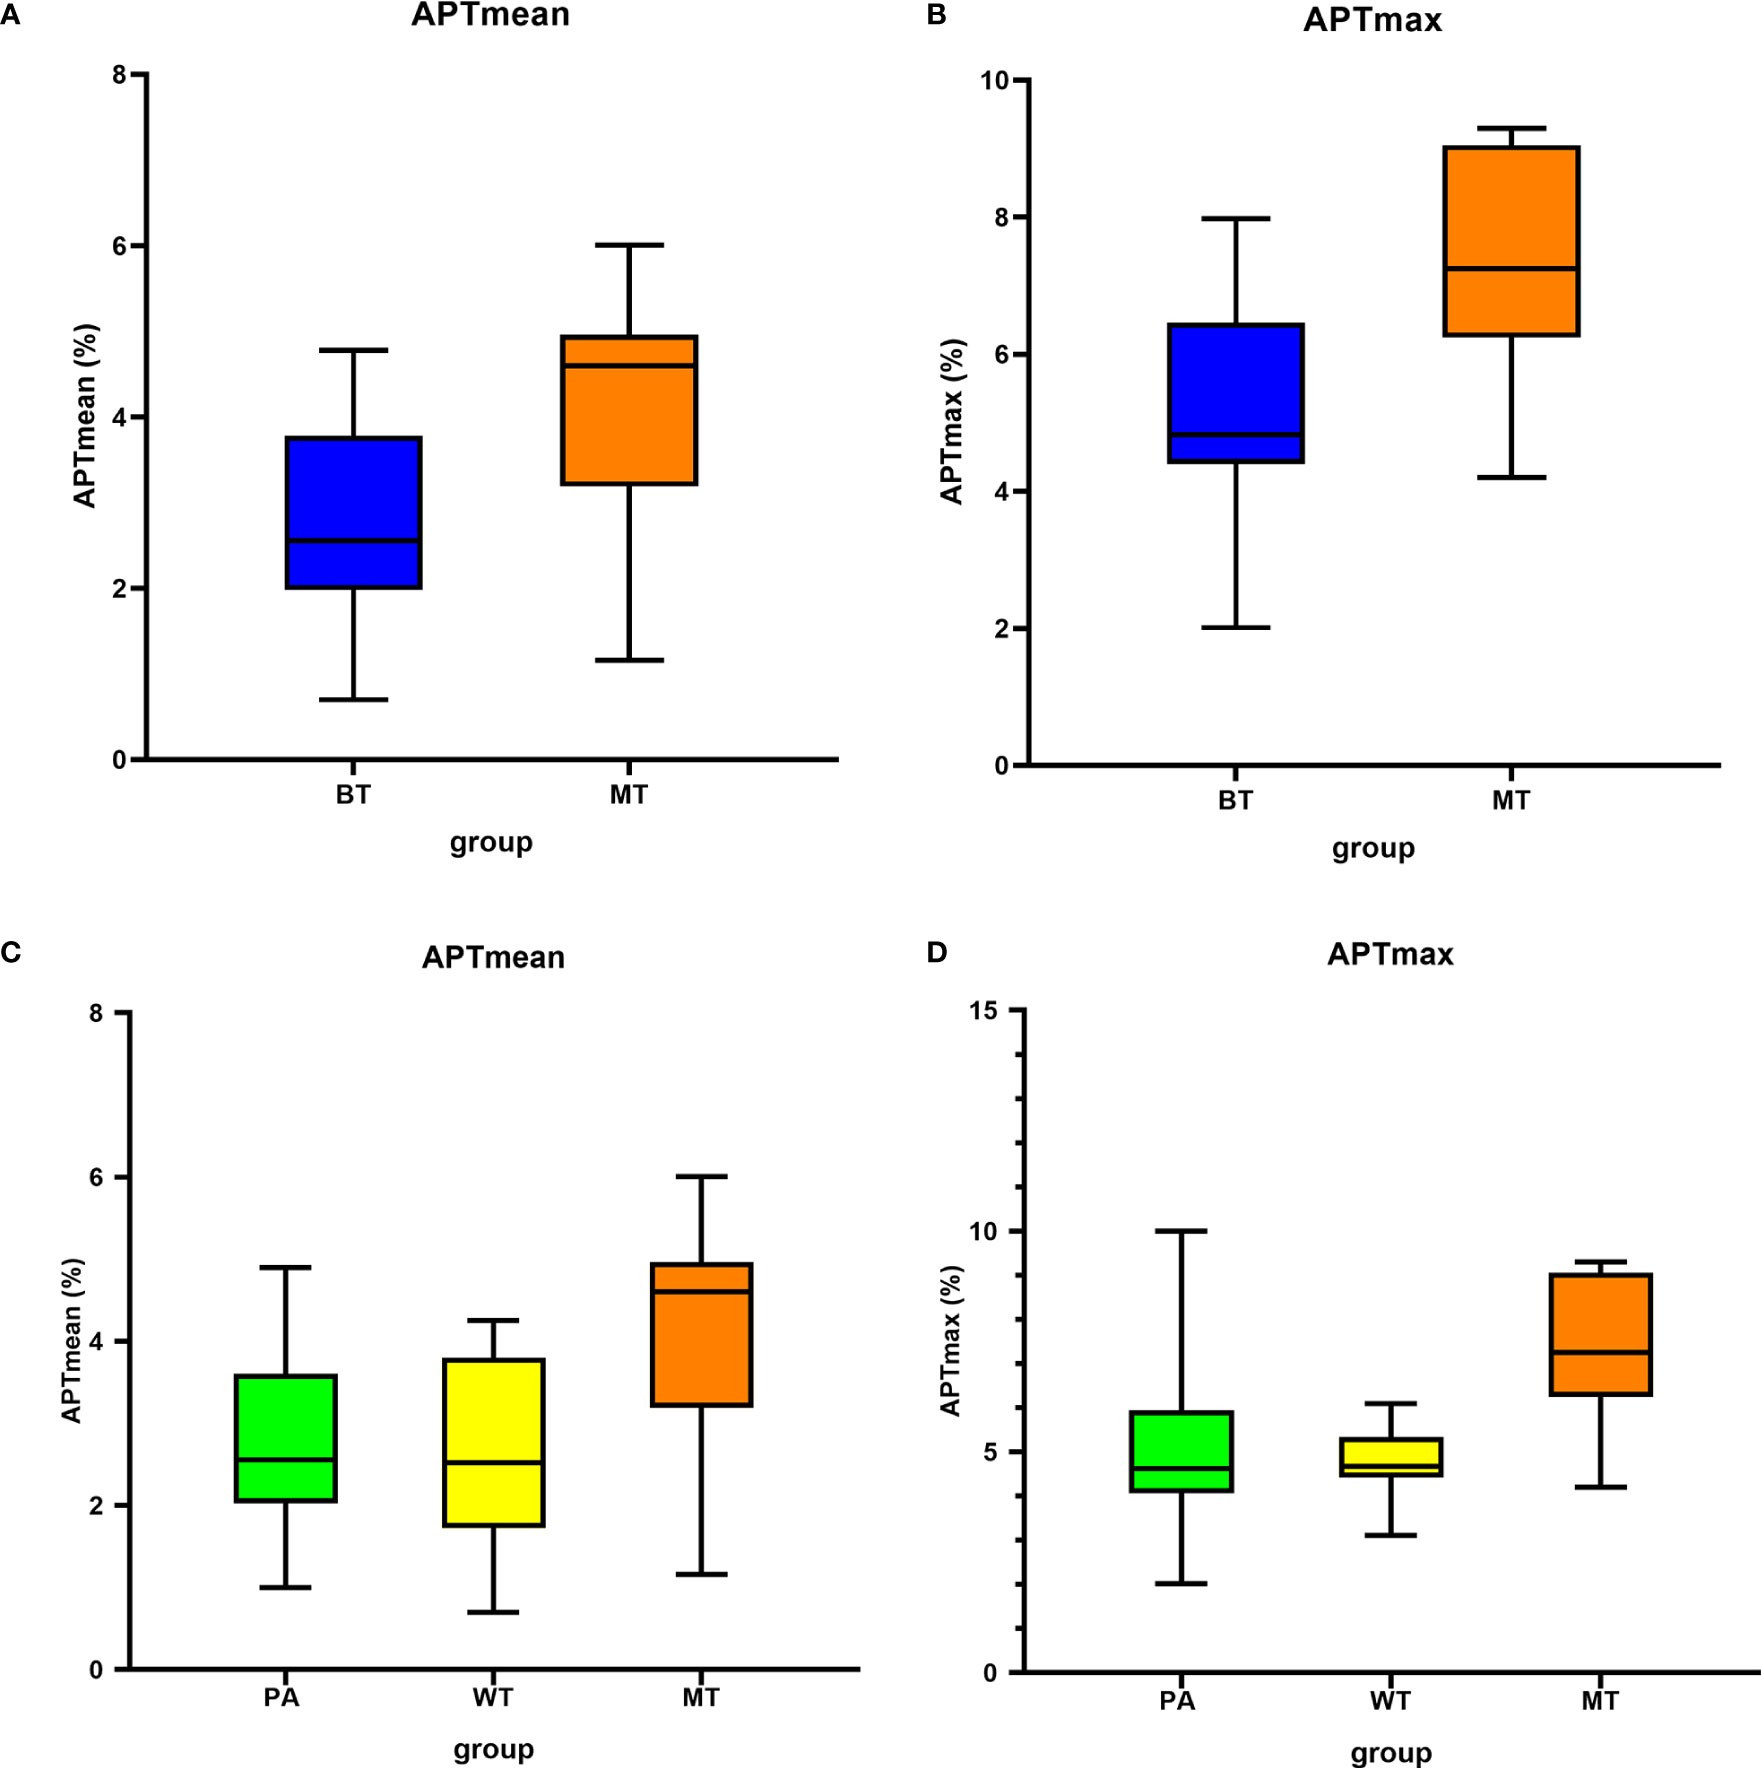
Figure 3 Box plots show the comparison of APTmean and APTmax among groups. Line in box represents the median, and the height of the box represents the interquartile range. (A, B) Comparison between BT and MT; (C, D) comparison among PA, WT, and MT. APTmax, the maximum value of APTw imaging; APTmean, the average value of APTw imaging; BT, benign tumor; MT, malignant tumor; PA, pleomorphic adenoma; WT, Warthin tumor.
The threshold of APTmean was 3.98%, and its area under the ROC curve (AUC), sensitivity, and specificity were 0.819, 86.00%, and 72.73%, respectively, for differential diagnosis between BTs and MTs. Moreover, ROC curve analysis indicated that an APTmax of 5.9% was the optimum threshold to distinguish between BTs and MTs, with AUC, sensitivity, and specificity of 0.821, 53.33%, and 82.61%, respectively. There was no significant difference in diagnostic efficacy between the above parameters (Z = 0.017, p = 0.987) (Table 4, Figure 4).
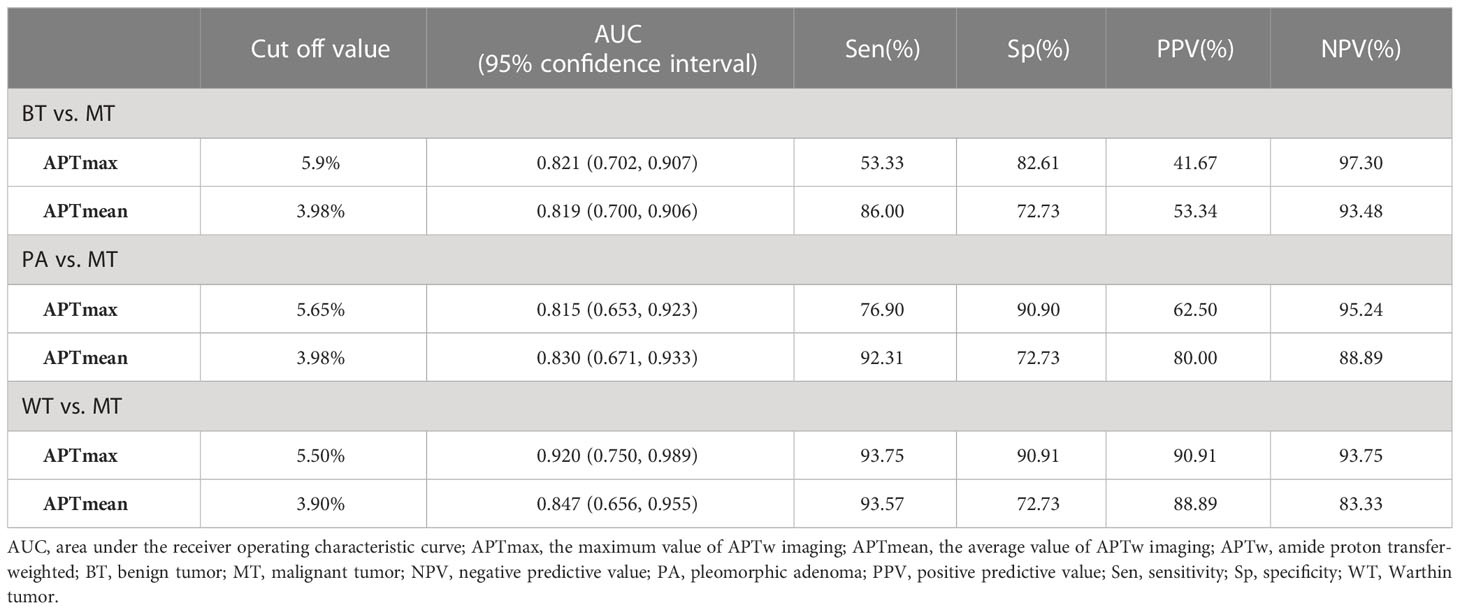
Table 4 The ROC curve of the values of APTw to differentiate between groups.
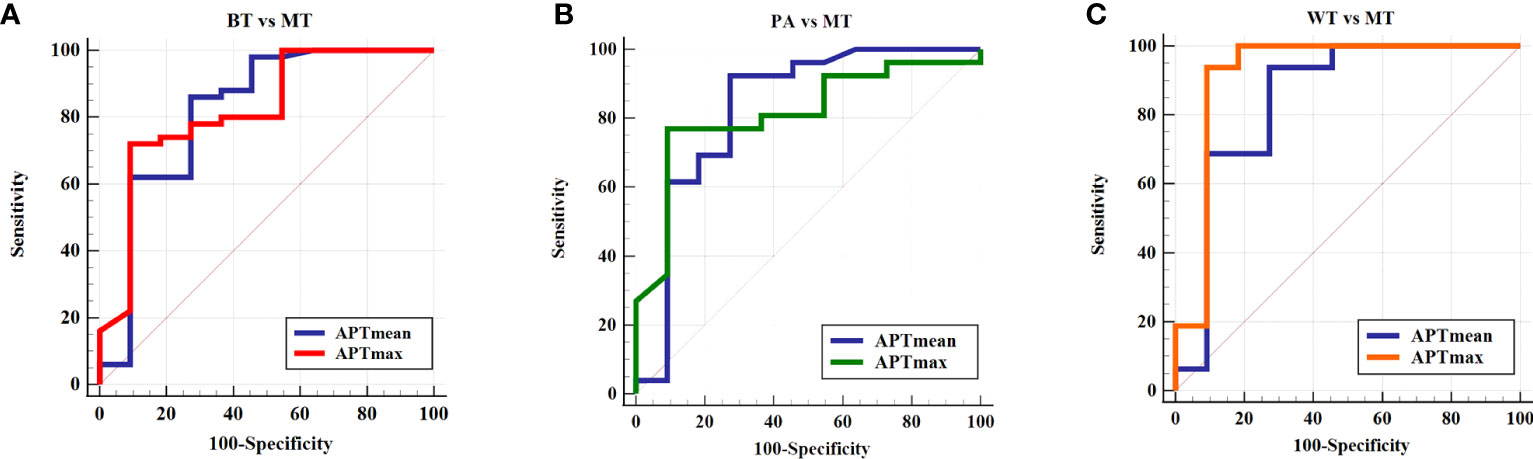
Figure 4 ROC curve of the APTmean and APTmax for differentiation between (A) BT and MT, (B) PA and MT, and (C) WT and MT. APTmax, the maximum value of APTw imaging; APTmean, the average value of APTw imaging; BT, benign tumor; MT, malignant tumor; PA, pleomorphic adenoma; WT, Warthin tumor.
APTw finding and diagnostic performance among PAs, WTs, and MTs
There were significant differences among these three groups (APTmean, p = 0.03; APTmax, p = 0.02). The pairwise comparisons showed that the APTmean and APTmax values in MTs were significantly higher than those of PAs and WTs, while the difference of the two parameters between PAs and WTs was not significant (p > 0.99, Table 5).
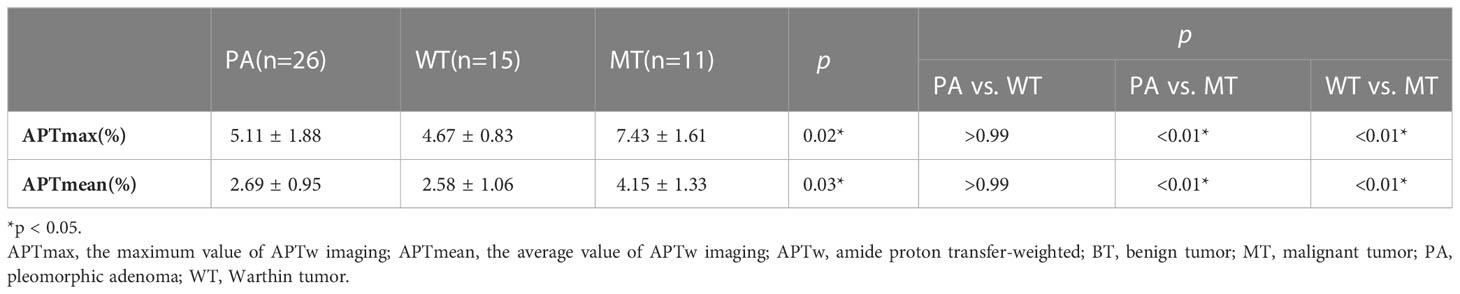
Table 5 Comparison of APTw values among PA, WT, and MT.
The diagnostic performance of APTmean and APTmax for differentiating among these three groups was shown in Tables 4 and 5. When the thresholds of the APTmean and APTmax were 3.98% and 5.65%, respectively, the optimal diagnostic performance for differentiating between PAs and MTs can be achieved. The AUC, sensitivity, and specificity of the APTmean between PAs and MTs were 0.830, 92.31%, and 72.73%. And the AUC, sensitivity, and specificity of the APTmax between PAs and MTs were 0.815, 76.90%, and 90.90%. Meanwhile, the threshold APTmean value of 3.90% can be used for optimal differential diagnosis between WTs and MTs with AUC, sensitivity, and specificity 0.847, 93.57%, and 72.73%. And the threshold APTmax value of 5.50% can be used for differentiating between WTs and MTs with AUC, sensitivity, and specificity 0.920, 93.75%, and 90.91%. There was no significant difference in diagnostic efficacy between APTmean and APTmax (PAs and MTs: Z = 0.141, p = 0.887; WTs and MTs: Z = 0.707, p = 0.479).
Discussion
In this study, we investigated the image quality of APTw imaging of parotid gland tumors and evaluated the characteristics and diagnostic performance of APTmax and APTmean. APTmean and APTmax in MTs were higher than those in BTs with high diagnostic efficacy. However, APTw imaging based on the current technology may be associated with severe artifacts in parotid glands (16.43% of cases), which can affect the evaluation of tumors.
In the parotid gland, APTw hyperintensity artifacts, diffused from the bone, air, ear, and other surrounding tissues, can affect the display of peripheral lesions and thus the quantitative APTw measurements. In this study, most of the cases with score ≤2 were PAs and WTs, where more than half of the tumors and the surrounding normal parotid gland parenchyma showed significantly hyperintensity. These hyperintensity artifacts were usually spread from the ear and mandible regions around the parotid gland. On the other hand, the area of hemorrhage, necrosis, and cystic degeneration can also contribute to the increase of APTw values due to the increase of mobile water molecule and amide protons. Chen et al. (23) demonstrated that approximately 70.6% of parotid gland lesions had no or small artifacts and the APTw measurements of the lesion would be reliable after excluding cases with poor image integrity and severe artifacts. Takeshi et al. (20) evaluated the difference in APTw values of BTs and MTs by sketching three circular ROIs in the parenchyma of parotid tumors. This measurement method can avoid artifacts of necrosis and cystic degeneration but cannot determine the maximum value of the whole tumors. Therefore, this study evaluated the image quality (83.57% of cases with an acceptable image quality score of 3 or 4) before the overall measurement of lesions, excluded lesions with severe artifacts, and determined reliable cases for analyses. The fusion of APTw with conventional structural images can be helpful for the determination of tumor boundary.
APTw imaging has been widely used in the assessment of tumor metabolism, ischemic penumbra of cerebral infarction, neurodegenerative changes, etc. (25, 26). In previous studies (27), it was found that MTs showed generally higher APTw values due to increased mobile proteins and polypeptides; however, abundant new blood vessels and increased vascular permeability could also lead to significantly increased APTw signal intensity in BTs. Most studies (20, 28) used the mean APTw value of the lesion to evaluate the overall lesion. Generally, the APTw mean value of MTs is higher than that of BTs, and similar results were also observed in this study. However, in the study of Ochiai et al. (29) on the evaluation of endometrial carcinoma, APTmean values had no significant difference between type I and type II endometrial carcinoma, but APTmax was significantly higher in type II carcinomas than that in type I, which may be due to the heterogeneity of lesion histology. APTmax might indicate the position with the most active metabolism and the highest cell density, which can evaluate heterogeneity of tumors more accurately in some studies (30, 31). The malignant lesions with more active cell proliferation, which showed a higher APTw value, may be related to the capacity of tumor invasion and prognosis. In the study by Law et al. (27), the AUC and sensitivity of the APTw value at the 90th percentage in head and neck tumors were significantly higher than those of the mean APTw value. Therefore, we speculated that the maximum APTw value of the whole lesions may have high diagnostic efficacy between BTs and MTs.
In this study, we excluded the cases showing artifacts that might affect the APTw value measurements and selected the slice with the largest section of lesion for ROI delineation to obtain the mean and maximum APTw values. It was found that in this study, the AUC of the APTmax value was similar to that of the APTmean for differentiation between MTs and BTs, but the APTmax was more specific than the APTmean. Additionally, because of hypercellularity, some functional MRI sequences showed image overlap between WTs and MTs (32, 33). In this study, the APTmean also showed false-positive results in the evaluation of MTs, but the APTmax values in the two groups of tumors have less overlap with higher diagnostic efficiency, which may suggest that the APTmax can play a complementary role in the differential diagnosis of parotid gland tumors. Although the overall APTmean and APTmax of BTs were lower, not a few cases of PA exhibited high APTmax signals. Some studies (20, 34, 35) believe that the epithelial and interstitial components of PA are diverse, and mesenchymal-like component is rich in mucoid, which can cause the variety of APTw values and might be the interference for APTw in parotid gland tumor evaluation. Moreover, some MTs (36) were low-grade malignant (such as mucoepidermoid carcinomas), and the increase of cell proliferation was not obvious, with the increase of the APTw value inapparent, which can be difficult to be distinguished from some BTs with more active proliferation. Therefore, the pathological complexity of parotid gland tumors mentioned above led to their diverse imaging manifestations, which also affected the accuracy of the APTmean and APTmax in the diagnosis of parotid gland tumors.
There are some limitations in our study. First, we did not choose the overall volume but the largest slice of tumor for analysis, which may affect the evaluation of tumor heterogeneity. Second, our study did not register imaging results with pathological findings accurately. It is necessary to further explore the relationship between the heterogeneity of imaging manifestations and tissue structure. Third, some previous studies (11, 13) demonstrated a high diagnostic performance with the combination of DCE-MRI and DWI, and this study did not compare APTw-MRI with other functional imaging sequences and investigate whether APTw can further improve the diagnostic performance of other functional sequences. Fourth, this was a small-sample retrospective study, especially, with few other BT types except PAs and WTs, and the malignant group was a small sample and includes different histological patterns. The pathological types were relatively limited, which may cause some errors in the statistics of the results. The low disease prevalence of MTs is the fundamental limiting factor. It is recommended to conduct further research to confirm the clinical impact of our results and the differences between specific sites in a larger cohort.
Conclusion
Both APTmax and APTmean values can differentiate benign and malignant parotid gland tumors, which suggested that APTw imaging might be helpful in the differentiation of benign and malignant parotid tumors before surgery. In our study, most APTw images in parotid gland tumors (83.57%) had acceptable image quality for APTw value evaluation. However, the technique still needs to be improved for reduced image artifacts.
Data availability statement
The raw data supporting the conclusions of this article will be made available by the authors without undue reservation.
Ethics statement
The studies involving human participants were reviewed and approved by the Ethics Committee of the First Affiliated Hospital of Dalian Medical University (license number: PJ−KS−XJS−2021-18). The patients/participants provided their written informed consent to participate in this study.
Author contributions
YW: methodology, investigation, data curation, writing—original draft, and writing—review and editing. LW: conceptualization, investigation, writing—review and editing, supervision, and project administration. LJL: software, visualization, and writing—review and editing. HH, JM, and LL: investigation, resources, and data curation. QS: resources and data curation. AL: supervision and project administration. All authors contributed to the article and approved the submitted version.
Funding
This study was supported by the Medical Education Research Project of Liaoning Province (No. 2022-N005-05).
Conflict of interest
Author LJL was employed by company Philips Healthcare, Beijing, China.
The remaining authors declare that the research was conducted in the absence of any commercial or financial relationships that could be construed as a potential conflict of interest.
Publisher’s note
All claims expressed in this article are solely those of the authors and do not necessarily represent those of their affiliated organizations, or those of the publisher, the editors and the reviewers. Any product that may be evaluated in this article, or claim that may be made by its manufacturer, is not guaranteed or endorsed by the publisher.
Abbreviations
APTw, amide proton transfer-weighted; AUC, area under the receiver operating characteristic curve; BT, benign tumor; DWI, diffusion-weighted imaging; DCE-MRI, dynamic contrast-enhanced MRI; ICC, intraclass correlation coefficient; MT, malignant tumor; MRI, magnetic resonance imaging; PA, pleomorphic adenoma; ROI, region of interest; ROC, receiver operating characteristic; WT, Warthin tumor.
References
1. Santana BW, Silva LP, Serpa MS, Borges MD, Moura SR, Silveira MM, et al. Incidence and profile of benign epithelial tumors of salivary glands from a single center in Northeast of Brazil. Med Oral Patol Oral Cir Bucal (2021) 26:e108–13. doi: 10.4317/medoral
2. Del Signore AG, Megwalu UC. The rising incidence of major salivary gland cancer in the United States. Ear Nose Throat J (2017) 96(3):E13–6. doi: 10.1177/014556131709600319
3. Gupta R, Balasubramanian D, Clark JR. Salivary gland lesions: recent advances and evolving concepts. Oral Surg Oral Med Oral Pathol Oral Radiol (2015) 119(6):661–74. doi: 10.1016/j.oooo.2015.02.481
4. Lee DH, Yoon TM, Lee JK, Lim SC. Surgical treatment strategy in Warthin tumor of the parotid gland. Braz J Otorhinolaryngol (2019) 85(5):546–50. doi: 10.1016/j.bjorl.2018.04.004
5. Chiesa-Estomba CM, Larruscain-Sarasola E, Lechien JR, Mouawad F, Calvo-Henriquez C, Diom ES, et al. Facial nerve monitoring during parotid gland surgery: a systematic review and meta-analysis. Eur Arch Otorhinolaryngol (2021) 278(4):933–43. doi: 10.1007/s00405-020-06188-0
6. Seyhun N, Doğan U, Çalış ZAB, Kaya MF, Hasçiçek SÖ, Turgut S. The role of fine needle aspiration biopsy in deep lobe parotid tumors: Comparison of preoperative cytology and postoperative histopathologic results. Am J Otolaryngol (2021) 42(1):102590. doi: 10.1016/j.amjoto.2020.102590
7. El Beltagi AH, Elsotouhy AH, Own AM, Abdelfattah W, Nair K, Vattoth S. Functional magnetic resonance imaging of head and neck cancer: Performance and potential. Neuroradiol J (2019) 32(1):36–52. doi: 10.1177/1971400918808546
8. Wang J, Weygand J, Hwang KP, Mohamed AS, Ding Y, Fuller CD, et al. Magnetic resonance imaging of glucose uptake and metabolism in patients with head and neck cancer. Sci Rep (2016) 6:30618. doi: 10.1038/srep30618
9. Wei P, Shao C, Tian M, Wu M, Wang H, Han Z, et al. Quantitative analysis and pathological basis of signal intensity on T2-weighted MR images in benign and Malignant parotid tumors. Cancer Manag Res (2021) 13:5423–31. doi: 10.2147/CMAR.S319466
10. Gökçe E. Multiparametric magnetic resonance imaging for the diagnosis and differential diagnosis of parotid gland tumors. J Magn Reson Imaging (2020) 52(1):11–32. doi: 10.1002/jmri.27061
11. Mikaszewski B, Markiet K, Smugała A, Stodulski D, Szurowska E, Stankiewicz C. Clinical and demographic data improve diagnostic accuracy of dynamic contrast-enhanced and diffusion-weighted MRI in differential diagnostics of parotid gland tumors. Oral Oncol (2020) 111:104932. doi: 10.1016/j.oraloncology.2020.104932
12. Karaman CZ, Tanyeri A, Özgür R, Öztürk VS. Parotid gland tumors: comparison of conventional and diffusion-weighted MRI findings with histopathological results. Dentomaxillofac Radiol (2021) 50(4):20200391. doi: 10.1259/dmfr.20200391
13. Xu Z, Zheng S, Pan A, Cheng X, Gao M. A multiparametric analysis based on DCE-MRI to improve the accuracy of parotid tumor discrimination. Eur J Nucl Med Mol Imaging (2019) 46(11):2228–34. doi: 10.1007/s00259-019-04447-9
14. Patella F, Franceschelli G, Petrillo M, Sansone M, Fusco R, Pesapane F, et al. A multiparametric analysis combining DCE-MRI- and IVIM -derived parameters to improve differentiation of parotid tumors: a pilot study. Future Oncol (2018) 14(28):2893–903. doi: 10.2217/fon-2017-0655
15. Zhou J, Heo HY, Knutsson L, van Zijl PCM, Jiang S. APT-weighted MRI: Techniques, current neuro applications, and challenging issues. J Magn Reson Imaging (2019) 50(2):347–64. doi: 10.1002/jmri.26645
16. Guo Z, Qin X, Mu R, Lv J, Meng Z, Zheng W, et al. Amide proton transfer could provide more accurate lesion characterization in the transition zone of the prostate. J Magn Reson Imaging (2022) 56(5):1311–9. doi: 10.1002/jmri.28204
17. Song Q, Tian S, Ma C, Meng X, Chen L, Wang N, et al. Amide proton transfer weighted imaging combined with dynamic contrast-enhanced MRI in predicting lymphovascular space invasion and deep stromal invasion of IB1-IIA1 cervical cancer. Front Oncol (2022) 12:916846. doi: 10.3389/fonc.2022.916846
18. Chappell MA, Chen M, Gochberg DF, Goerke S, Heo HY, Jiang S, et al. Review and consensus recommendations on clinical APT-weighted imaging approaches at 3T: Application to brain tumors. Magn Reson Med (2022) 88(2):546–74. doi: 10.1002/mrm.29241
19. Meng N, Fu F, Feng P, Li Z, Gao H, Wu Y, et al. Evaluation of amide proton transfer-weighted imaging for lung cancer subtype and epidermal growth factor receptor: A comparative study with diffusion and metabolic parameters. J Magn Reson Imaging (2022) 56(4):1118–29. doi: 10.1002/jmri.28135
20. Kamitani T, Sagiyama K, Togao O, Yamasaki Y, Hida T, Matsuura Y, et al. Amide proton transfer (APT) imaging of parotid tumors: Differentiation of Malignant and benign tumors. Eur J Radiol (2020) 129:109047. doi: 10.1016/j.ejrad.2020.109047
21. Bae YJ, Choi BS, Jeong WJ, Jung YH, Park JH, Sunwoo L, et al. Amide proton transfer-weighted MRI in the diagnosis of major salivary gland tumors. Sci Rep (2019) 9(1):8349. doi: 10.1038/s41598-019-44820-0
22. Paech D, Zaiss M, Meissner JE, Windschuh J, Wiestler B, Bachert P, et al. Nuclear overhauser enhancement mediated chemical exchange saturation transfer imaging at 7 Tesla in glioblastoma patients. PloS One (2014) 9(8):e104181. doi: 10.1371/journal.pone.0104181
23. Chen Y, Wang X, Su T, Xu Z, Wang Y, Zhang Z, et al. Feasibility evaluation of amide proton transfer-weighted imaging in the parotid glands: a strategy to recognize artifacts and measure APT value. Quant Imaging Med Surg (2021) 11(6):2279–91. doi: 10.21037/qims-20-675
24. DeLong ER, DeLong DM, Clarke-Pearson DL. Comparing the areas under two or more correlated receiver operating characteristic curves: a nonparametric approach. Biometrics (1988) 44:837–45. doi: 10.2307/2531595
25. Chen W, Mao L, Li L, Wei Q, Hu S, Ye Y, et al. Predicting treatment response of neoadjuvant chemoradiotherapy in locally advanced rectal cancer using amide proton transfer MRI combined with diffusion-weighted imaging. Front Oncol (2021) 11:698427. doi: 10.3389/fonc.2021.698427
26. Zhang H, Zhou J, Peng Y. Amide proton transfer-weighted MR imaging of pediatric central nervous system diseases. Magn Reson Imaging Clin N Am (2021) 29(4):631–41. doi: 10.1016/j.mric.2021.06.012
27. Law BKH, King AD, Ai QY, Poon DMC, Chen W, Bhatia KS, et al. Head and neck tumors: amide proton transfer MRI. Radiology (2018) 288(3):782–90. doi: 10.1148/radiol.2018171528
28. Ju Y, Liu A, Wang Y, Chen L, Wang N, Bu X, et al. Amide proton transfer magnetic resonance imaging to evaluate renal impairment in patients with chronic kidney disease. Magn Reson Imaging (2022) 87:177–82. doi: 10.1016/j.mri.2021.11.015
29. Ochiai R, Mukuda N, Yunaga H, Kitao S, Okuda K, Sato S, et al. Amide proton transfer imaging in differentiation of type II and type I endometrial carcinoma: a pilot study. Jpn J Radiol (2022) 40(2):184–91. doi: 10.1007/s11604-021-01197-3
30. Gatius S, Cuevas D, Fernández C, ROman-Canal B, Adamoli V, Piulats JM, et al. Tumor heterogeneity in endometrial carcinoma: practical consequences. Pathobiology (2018) 85(1-2):35–40. doi: 10.1159/000475529
31. Li B, Sun H, Zhang S, Wang X, Guo Q. The utility of APT and IVIM in the diagnosis and diferentiation of squamous cell carcinoma of the cervix: a pilot study. Magn Reson Imaging (2019) 63:105–13. doi: 10.1016/j.mri.2019.08.020
32. Yuan Y, Tang W, Tao X. Parotid gland lesions: separate and combined diagnostic value of conventional MRI, diffusion-weighted imaging and dynamic contrast-enhanced MRI. Br J Radiol (2016) 89(1060):20150912. doi: 10.1259/bjr.20150912
33. Yabuuchi H, Kamitani T, Sagiyama K, Yamasaki Y, Hida T, Matsuura Y, et al. Characterization of parotid gland tumors: added value of permeability MR imaging to DWI and DCE-MRI. Eur Radiol (2020) 30(12):6402–12. doi: 10.1007/s00330-020-07004-3
34. Ishimatsu K, Nishie A, Takayama Y, Asayama Y, Ushijima Y, Kakihara D, et al. Amide proton transfer imaging for differentiating benign ovarian cystic lesions: Potential of first time right. Eur J Radiol (2019) 120:108656. doi: 10.1016/j.ejrad.2019.108656
35. Togao O, Yoshiura T, Keupp J, Hiwatashi A, Yamashita K, Kikuchi K, et al. Amide proton transfer imaging of adult diffuse gliomas: correlation with histopathological grades. Neuro Oncol (2014) 16(3):441–8. doi: 10.1093/neuonc/not158
Keywords: parotid gland tumor, magnetic resonance imaging, amide proton transfer-weighted image, pleomorphic adenoma, Warthin tumor
Citation: Wang Y, Wang L, Huang H, Ma J, Lin L, Liu L, Song Q and Liu A (2023) Amide proton transfer-weighted magnetic resonance imaging for the differentiation of parotid gland tumors. Front. Oncol. 13:1223598. doi: 10.3389/fonc.2023.1223598
Received: 16 May 2023; Accepted: 28 July 2023;
Published: 18 August 2023.
Edited by:
Ester Orlandi, National Center of Oncological Hadrontherapy, ItalyReviewed by:
Sara Imparato, National Center of Oncological Hadrontherapy, ItalyHuiting Zhang, Siemens Healthineers, China
Copyright © 2023 Wang, Wang, Huang, Ma, Lin, Liu, Song and Liu. This is an open-access article distributed under the terms of the Creative Commons Attribution License (CC BY). The use, distribution or reproduction in other forums is permitted, provided the original author(s) and the copyright owner(s) are credited and that the original publication in this journal is cited, in accordance with accepted academic practice. No use, distribution or reproduction is permitted which does not comply with these terms.
*Correspondence: Lijun Wang, d2FuZ2xqMzQ1QDE2My5jb20=