
95% of researchers rate our articles as excellent or good
Learn more about the work of our research integrity team to safeguard the quality of each article we publish.
Find out more
ORIGINAL RESEARCH article
Front. Oncol. , 27 July 2023
Sec. Breast Cancer
Volume 13 - 2023 | https://doi.org/10.3389/fonc.2023.1210125
This article is part of the Research Topic Epigenetic and Metabolic Regulators of Breast Carcinogenesis View all 13 articles
 Tongtong Jia1†
 Qingfu Lv2†Xiaowei Cai3†Shushan Ge1
 Shibiao Sang1
 Bin Zhang1*Chunjing Yu4*
 Shengming Deng1*
Purpose: The aim of this study was to investigate the predictive role of fluorine-18 fluorodeoxyglucose positron emission tomography/computed tomography (18F-FDG PET/CT) in the prognostic risk stratification of patients with invasive breast cancer (IBC). To achieve this, we developed a clinicopathologic-radiomic-based model (C-R model) and established a nomogram that could be utilized in clinical practice.
Methods: We retrospectively enrolled a total of 91 patients who underwent preoperative 18F-FDG PET/CT and randomly divided them into training (n=63) and testing cohorts (n=28). Radiomic signatures (RSs) were identified using the least absolute shrinkage and selection operator (LASSO) regression algorithm and used to compute the radiomic score (Rad-score). Patients were assigned to high- and low-risk groups based on the optimal cut-off value of the receiver operating characteristic (ROC) curve analysis for both Rad-score and clinicopathological risk factors. Univariate and multivariate Cox regression analyses were performed to determine the association between these variables and progression-free survival (PFS) or overall survival (OS). We then plotted a nomogram integrating all these factors to validate the predictive performance of survival status.
Results: The Rad-score, age, clinical M stage, and minimum standardized uptake value (SUVmin) were identified as independent prognostic factors for predicting PFS, while only Rad-score, age, and clinical M stage were found to be prognostic factors for OS in the training cohort. In the testing cohort, the C-R model showed superior performance compared to single clinical or radiomic models. The concordance index (C-index) values for the C-R model, clinical model, and radiomic model were 0.816, 0.772, and 0.647 for predicting PFS, and 0.882, 0.824, and 0.754 for OS, respectively. Furthermore, decision curve analysis (DCA) and calibration curves demonstrated that the C-R model had a good ability for both clinical net benefit and application.
Conclusion: The combination of clinicopathological risks and baseline PET/CT-derived Rad-score could be used to evaluate the prognosis in patients with IBC. The predictive nomogram based on the C-R model further enhanced individualized estimation and allowed for more accurate prediction of patient outcomes.
Breast cancer (BC) is now the leading cause of malignancy incidence and tumor-related deaths among females worldwide, surpassing lung cancer (1). The comprehensive therapy of BC, including surgery, chemotherapy, radiotherapy, and targeted treatments, has been effective in reducing locoregional or distant recurrences and prolonging survival (2–4). However, the intrinsic intratumoral heterogeneity of BC has resulted in distinct patterns of tumor progression, metastasis formation, and therapy resistance (5). Despite active therapies, some patients still develop various forms of resistance, which has not altered mortality outcomes (6, 7). Clinicians have made initial prognostic predictions and individualized therapies based on the tumor-node-metastasis (TNM) staging system and molecular classification (8, 9). However, it remains difficult to precisely predict the prognosis of patients with advanced and inoperable BC. This can result in overtreatment or undertreatment due to the high heterogeneity of BC and the complexity of treatment strategies (10).
To improve risk stratification and monitor therapeutic efficacy in BC patients, it is crucial to develop robust image-driven biomarkers. Recently, fluorine-18 fluorodeoxyglucose positron emission tomography/computed tomography (18F-FDG PET/CT) has become a common diagnostic tool for BC patients, as it combines functional metabolic quantification with morphological imaging. This technique is useful for initial staging, prognostic assessments, and response monitoring (11, 12). Certain studies have indicated that preoperative metabolic parameters, such as standardized uptake values (SUVs), metabolic tumor volume (MTV), and total lesion glycolysis (TLG), serve as reliable biomarkers associated with the prognosis of BC (13, 14). However, these traditional metabolic factors may not fully capture the spatial distribution between pairs of voxels (15, 16).
Radiomics, which extracts advanced texture features from medical images to non-invasively characterize tumor heterogeneity and predict prognostic response, has emerged as a promising research topic in BC (17–19). However, few studies have investigated the predictive value of baseline PET/CT radiomics in BC prognosis (20, 21). Moreover, combining clinicopathological characteristics with radiomic biomarkers to create predictive signatures and constructing a nomogram is a prevalent and effective approach for achieving prognosis prediction and individualized management (22, 23). In the present study, we aimed to develop a predictive nomogram using the C-R model that combined clinicopathological and radiomic signatures (RSs) based on pretreatment PET/CT to estimate the survival prognosis of BC patients.
This retrospective study was approved by the medical ethics committee of the First Affiliated Hospital of Soochow University and waived additional informed consent (Trial registration number: ChiCTR2300070309). The study was conducted in compliance with the Declaration of Helsinki, and no personal information was disclosed. The total cohort of consecutive patients who were initially diagnosed with BC using 18F-FDG PET/CT and confirmed by pathology in our institution between September 2016 and April 2022 were further checked by the following criteria. Inclusion criteria were as follows: a) patients who did not receive any therapy prior to the standard examination of 18F-FDG PET/CT; b) patients ultimately diagnosed with invasive carcinoma of BC, including invasive ductal, lobular, or papillary carcinomas, and confirmed by puncture biopsy or surgical specimen; c) patients with available clinical records and pathological data; and d) patients with immunochemistry (IHC) examination, including estrogen receptor (ER), progesterone receptor (PR), human epidermal growth factor receptor 2 (HER2), and Ki-67. Exclusion criteria were as follows: a) patients with the suboptimal quality of 18F-FDG PET/CT images due to motion artifacts or abnormal biodistribution of tracer; b) primary lesions with a too small size to be outlined the volume of interest (VOI) for measurement (short-axis diameter <1 cm); c) patients with other types of tumors; d) patients confirmed to have other specific histological types of BC (sarcomas, lymphomas and so on); and e) newly diagnosed patients with a follow-up time of less than 8 months. The enrolled patients were randomly divided into training and validation cohorts at a 7:3 ratio using computer-generated random numbers.
All patients were followed up from the confirmed time of primary diagnosis until the cut-off date of December 30, 2022, using outpatient review data and telephone follow-ups. Progression-free survival (PFS) was defined as the interval between the date of first diagnosis and the first relapse, tumor progression, death, or the last follow-up. Overall survival (OS) was defined as the interval between the date of first diagnosis and death from any cause or the last follow-up. The study endpoints were PFS and OS.
According to guidelines from the European Association of Nuclear Medicine (EANM), patients must fast for at least 4 h and ensure that their plasma glucose level is lower than 11.0 mmol/L (about 200 mg/dL) prior to undergoing the 18F-FDG PET/CT procedure in clinical studies (24). Approximately 40-60 min after intravenous injection of 18F-FDG (4.07-5.55 MBq/kg), patients were scanned using an integrated PET/CT scanner (Discovery STE, General Electric Medical Systems, Milwaukee, WI, USA) to acquire images from the base of the skull to the midthigh. Low-dose (140 kV, 120 mA) CT images were used for subsequent attenuation correction and anatomic localization of PET images, with acquisition parameters including a transaxial field of view of 70 cm, pitch of 1.75, rotation time of 0.8 s, and slice thickness of 3.75 mm. PET image acquisition was performed at 2-3 min per bed position, with a total of 8-10 bed positions. During image reconstruction, the ordered subset expectation maximization algorithm was used (two iterations and eight subsets) to ensure that reconstructed voxel sizes were within 3.0-4.0 mm in any direction.
The study collected several clinical factors, including age, menopausal status, tumor location, initial TNM stage, treatment strategies, and diagnosis time. Specimens obtained from core needle biopsy and excisional biopsy were fixed in formalin solution, embedded in paraffin, and stained with hematoxylin and eosin (H&E staining). Stained sections were evaluated by independently two experienced pathologists to confirm the histopathological type. The expressions of ER, PR, HER2, and Ki-67 were detected using IHC. ER and PR were considered positive if there was a proportion of at least 1% of nuclear staining. HER2 status was confirmed using a combination of IHC scores and fluorescence in situ hybridization (FISH), where a positive result was defined as IHC 2+ and FISH gene amplification or IHC 3+ (25). Ki-67 cell nuclear staining of ≥ 30% was considered a high expression.
The Local Image Features Extraction (LifeX) package (version 7.0.0, available at https://www.lifexsoft.org/) was used to automatically match and fuse PET and CT images in DICOM format for quantitative PET/CT analysis (26). Two experienced nuclear medicine physicians, who were blinded to the clinicopathological results, manually segmented the transaxial VOI layer by layer. The VOI was defined by integrating abnormal uptake of 18F-FDG on PET and abnormal density on CT, which was optimized by setting a threshold of 40% of the SUVmax to ensure reproducibility (16). Once matched, the RSs (four or six conventional features, nine first-order features, and 32 high-order features) of the CT or PET images could be automatically extracted from the same VOI. To avoid overfitting, significant RSs of the training cohort were selected using correlation analysis, least absolute shrinkage and selection operator (LASSO) regression algorithm, and univariable Cox analysis before model construction (17, 27). Finally, 10-fold cross-validation was used to ensure the robustness of the optimal features.
The Rad-score was calculated using a linear fitting formula, which involved multiplying the remaining features with their respective weighted coefficients to create a radiomic model. Based on the optimal threshold value of the Rad-score, as determined through receiver operating characteristic (ROC) curve analysis, the cohorts were divided into high-risk and low-risk groups. In addition to clinicopathological factors, the Rad-score was further evaluated using Kaplan-Meier (KM) analysis and log-rank tests. All significant factors were entered into a multivariable Cox proportional hazards regression to identify the final subset of prognostic factors. Finally, the radiomic and clinical nomograms were evaluated in the training cohort and then validated in the testing cohort. To evaluate the discriminative ability, calibration, and clinical usefulness of the models, we employed the Harrell concordance index, calibration curves, and decision curve analysis (DCA), respectively (28).
Statistical data were calculated and analyzed using IBM SPSS Statistics (version 26.0, IBM Corp), Python (version 3.0, https://www.python.org), MedCalc software (MedCalc Software, Ostend, Belgium), and R (version 4.2.1, http://www.R-project.org). The normality and homogeneity of variance for continuous data were evaluated using the Kolmogorov-Smirnov test and Levene’s test, respectively. The independent t-test and Mann-Whitney U test were then used to evaluate any differences in baseline characteristics between the training and testing sets. Meanwhile, the Chi-square test and Fisher’s exact test were applied to analyze categorical variables. For the final survival analysis, quantitative variables were transformed into dichotomous variables to conduct further univariate and multivariate Cox analyses, as well as to estimate hazard ratios (HRs). A two-sided p-value of less than 0.05 was considered statistically significant. Figure 1 provides an overview of the study’s workflow.
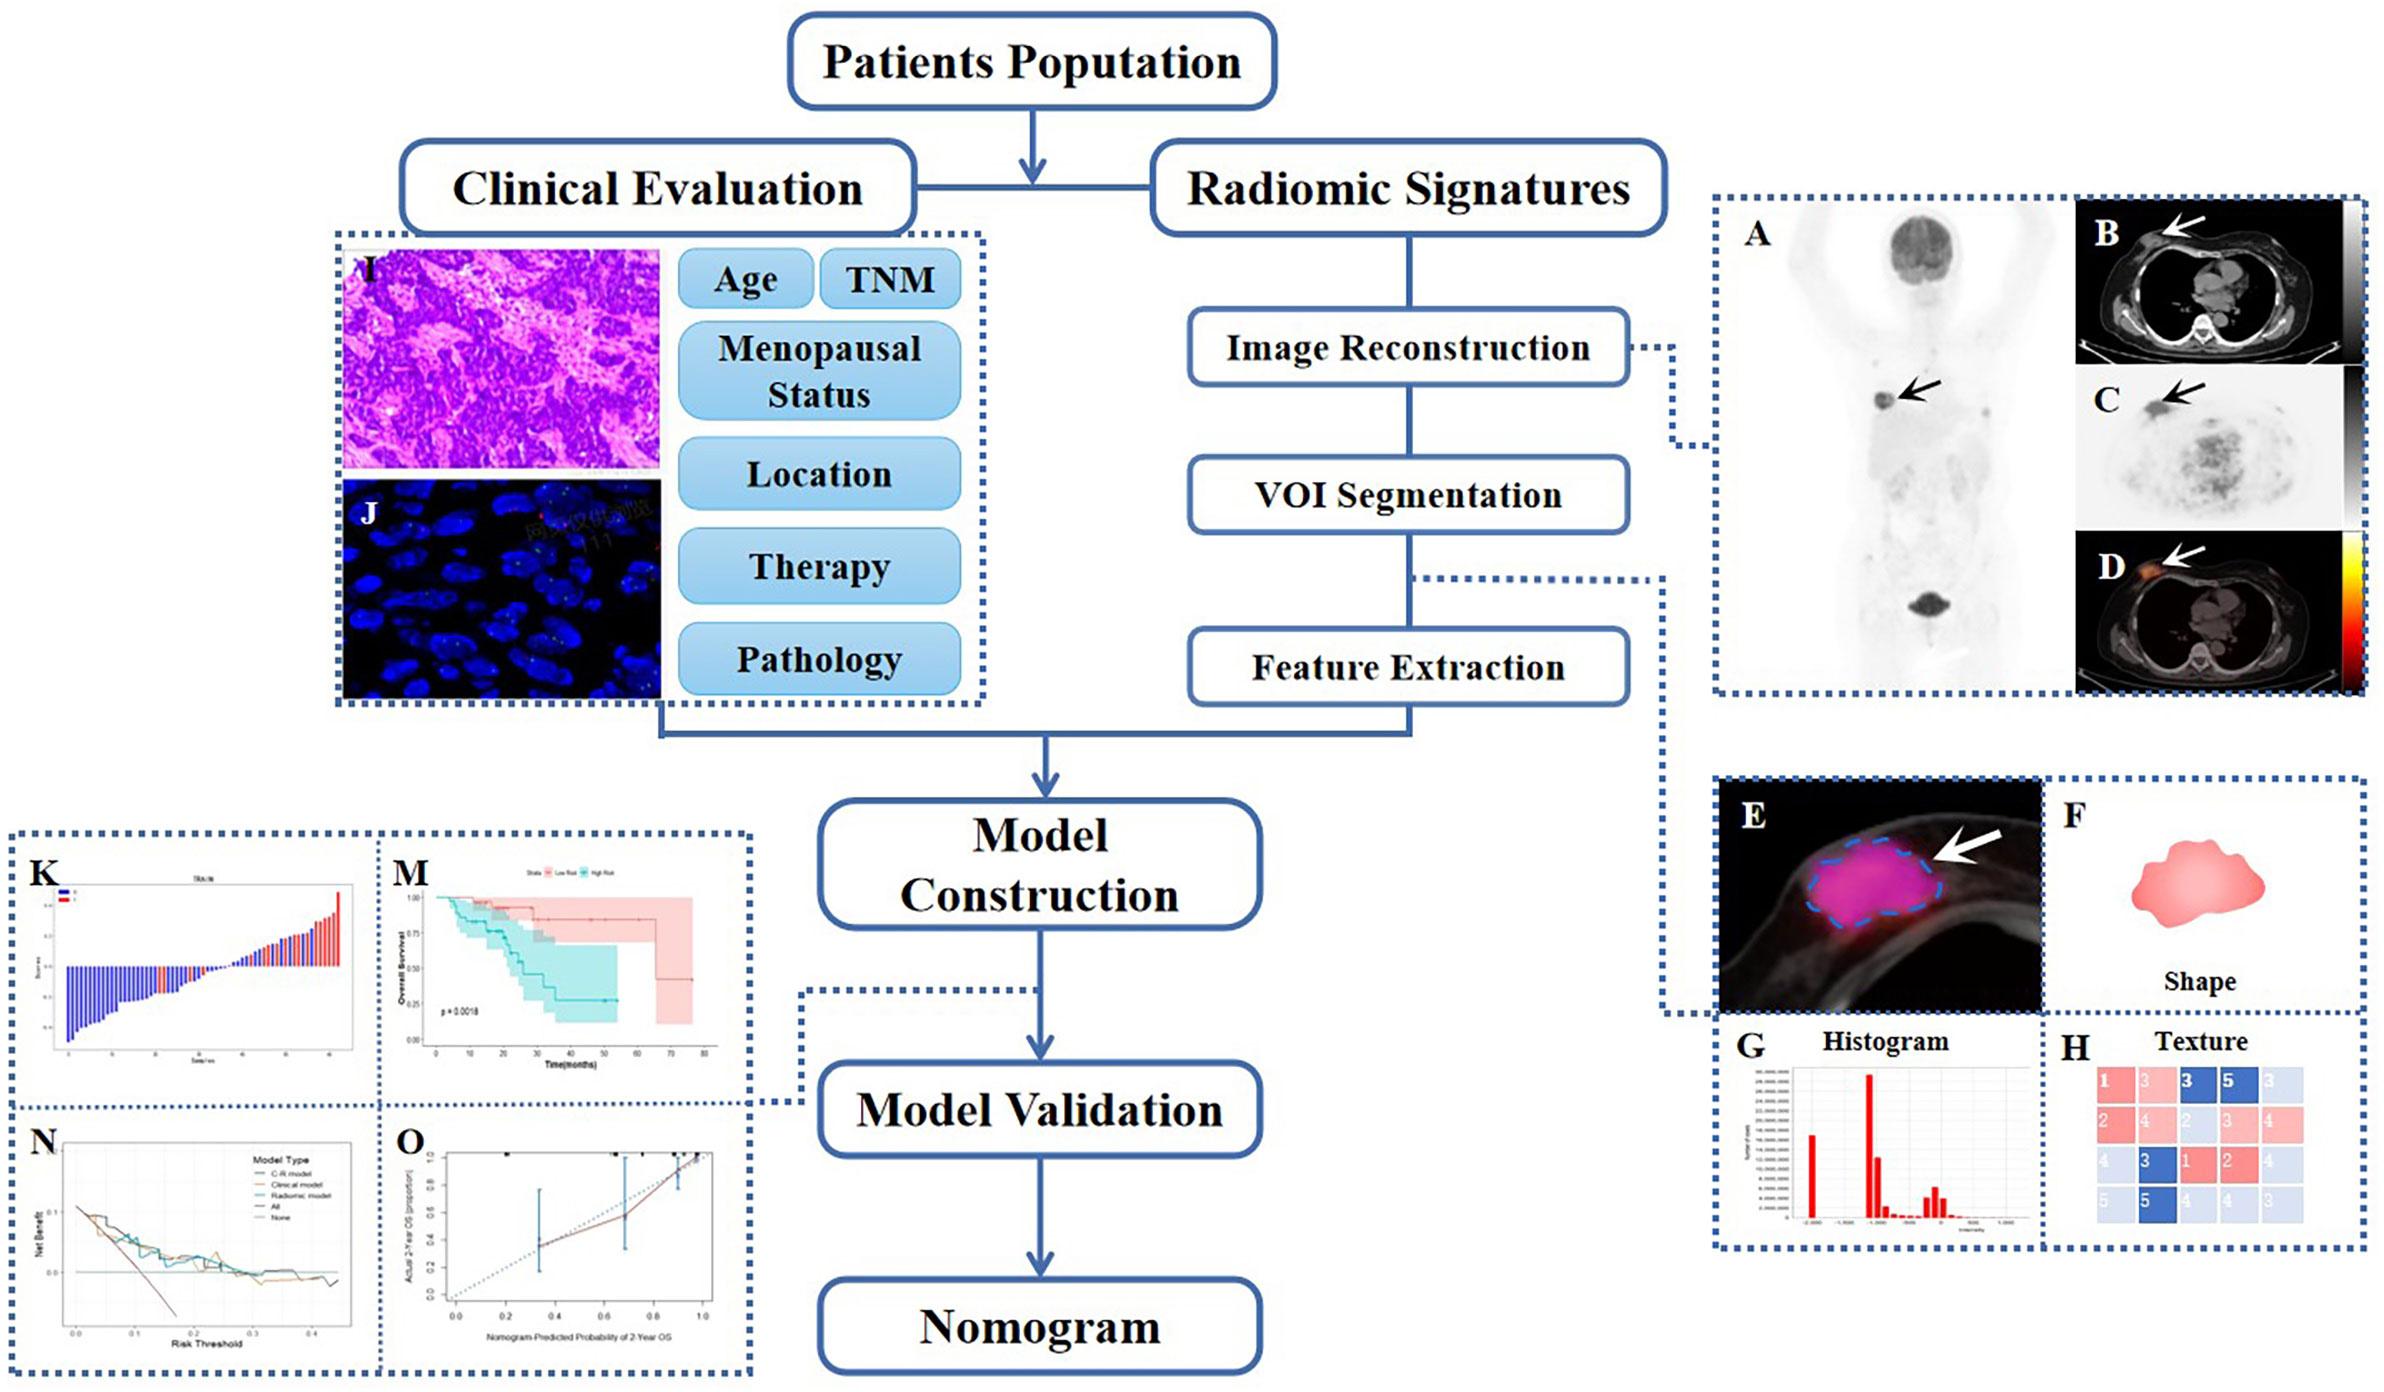
Figure 1 Workflow diagram of this retrospective study. The typical example of PET/CT image reconstruction in a patient with BC, whole-body maximum intensity projection (MIP) of PET image (A), axial views of low-dose CT, PET or PET/CT infusion scans (B–D). Arrows point to tumor lesions. The dotted line circles the VOI in magnified PET/CT image (E), from which first-order (F, G) and high-order (H) radiomic features were extracted. The IHC and FISH of representatively pathological section (I, J). Waterfall plot of radiomic score (Rad-score) and KM curve of survival analysis during model construction (K, M), DCA, and calibration curve during model validation (N, O).
In this retrospective study, 91 patients with BC pretreatment who met the inclusion criteria were selected (in Figure 2). Table 1 summarizes the clinical characteristics of the training and validation cohorts, and there were no statistically significant biases in patient distribution between the two cohorts (all p > 0.05). During the follow-up period from the time of primary diagnosis (median: 20 months, range: 4 - 95 months), 42 out of 91 patients (46.2%) developed PFS endpoints, and 27 out of 91 patients (29.7%) died. Patients without any PFS events who survived at least 8 months after cancer diagnosis were considered as the control group (n = 49). The event rates of PFS (46.0% and 46.4%, respectively) and OS (30.2% and 28.6%, respectively) were not significantly different between the two cohorts, indicating a balanced distribution.
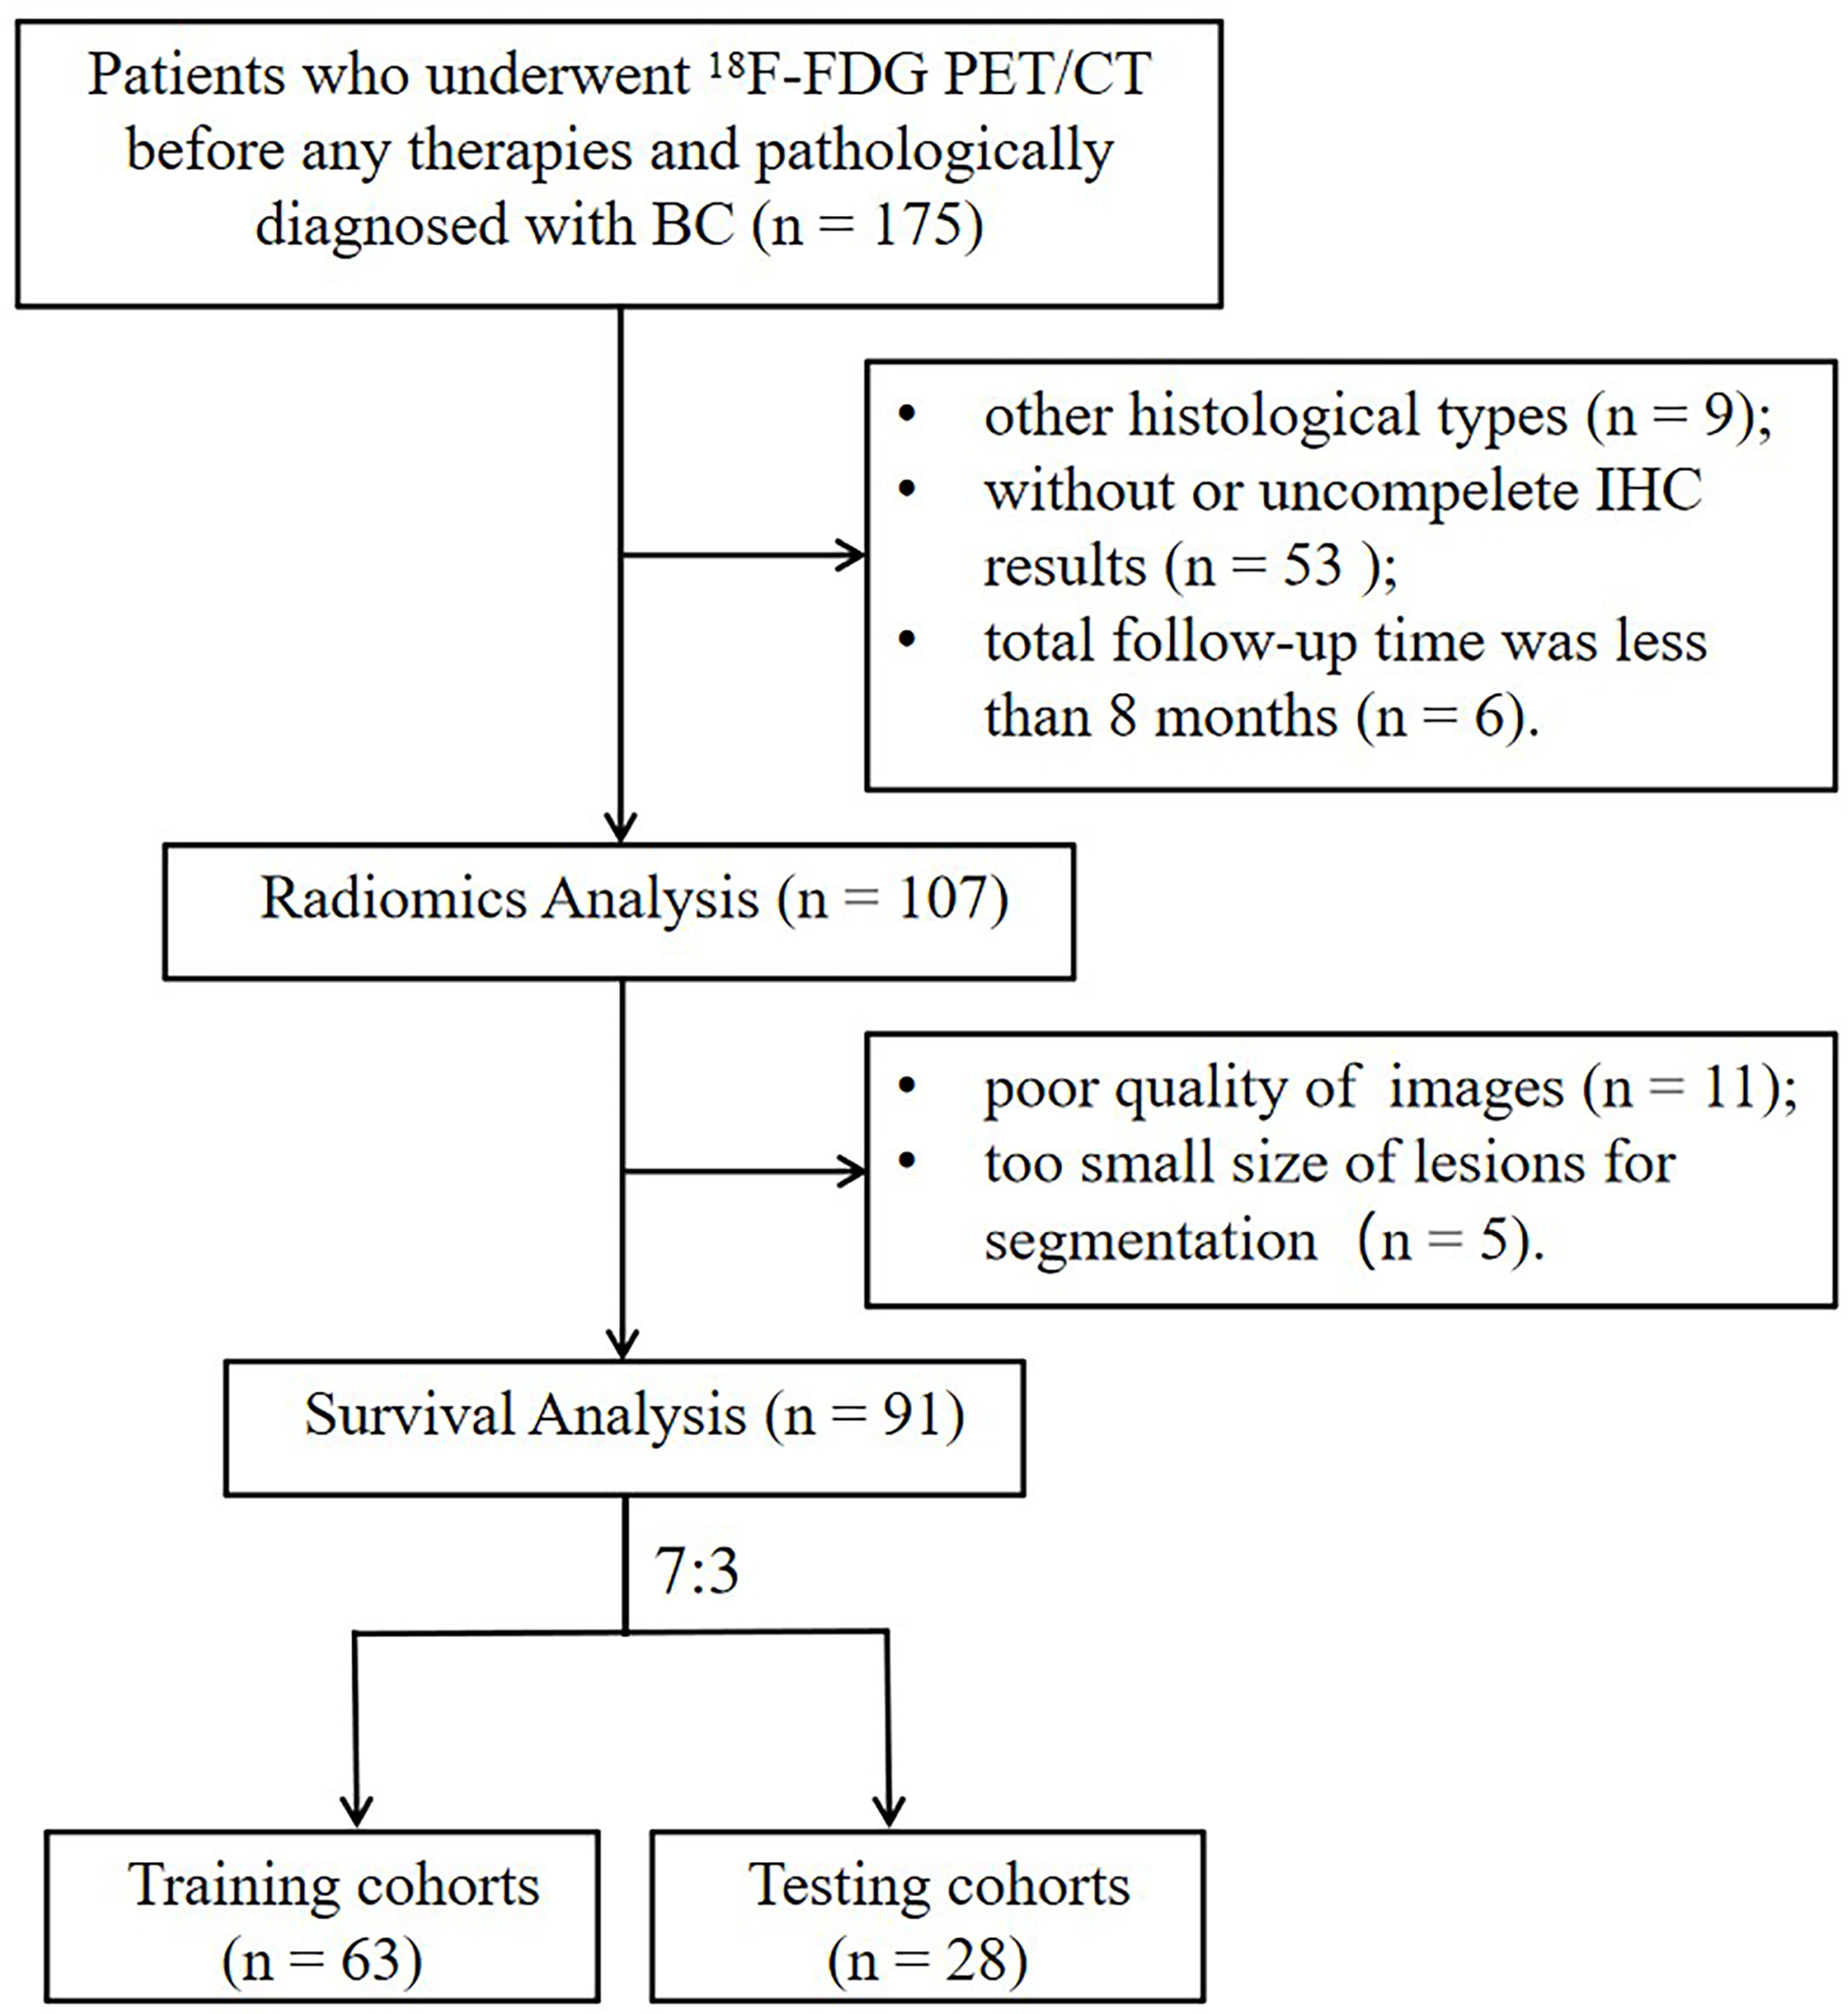
Figure 2 The flowchart of the selection process according to eligibility and exclusive criteria. BC, breast cancer; IHC, immunohistochemistry.
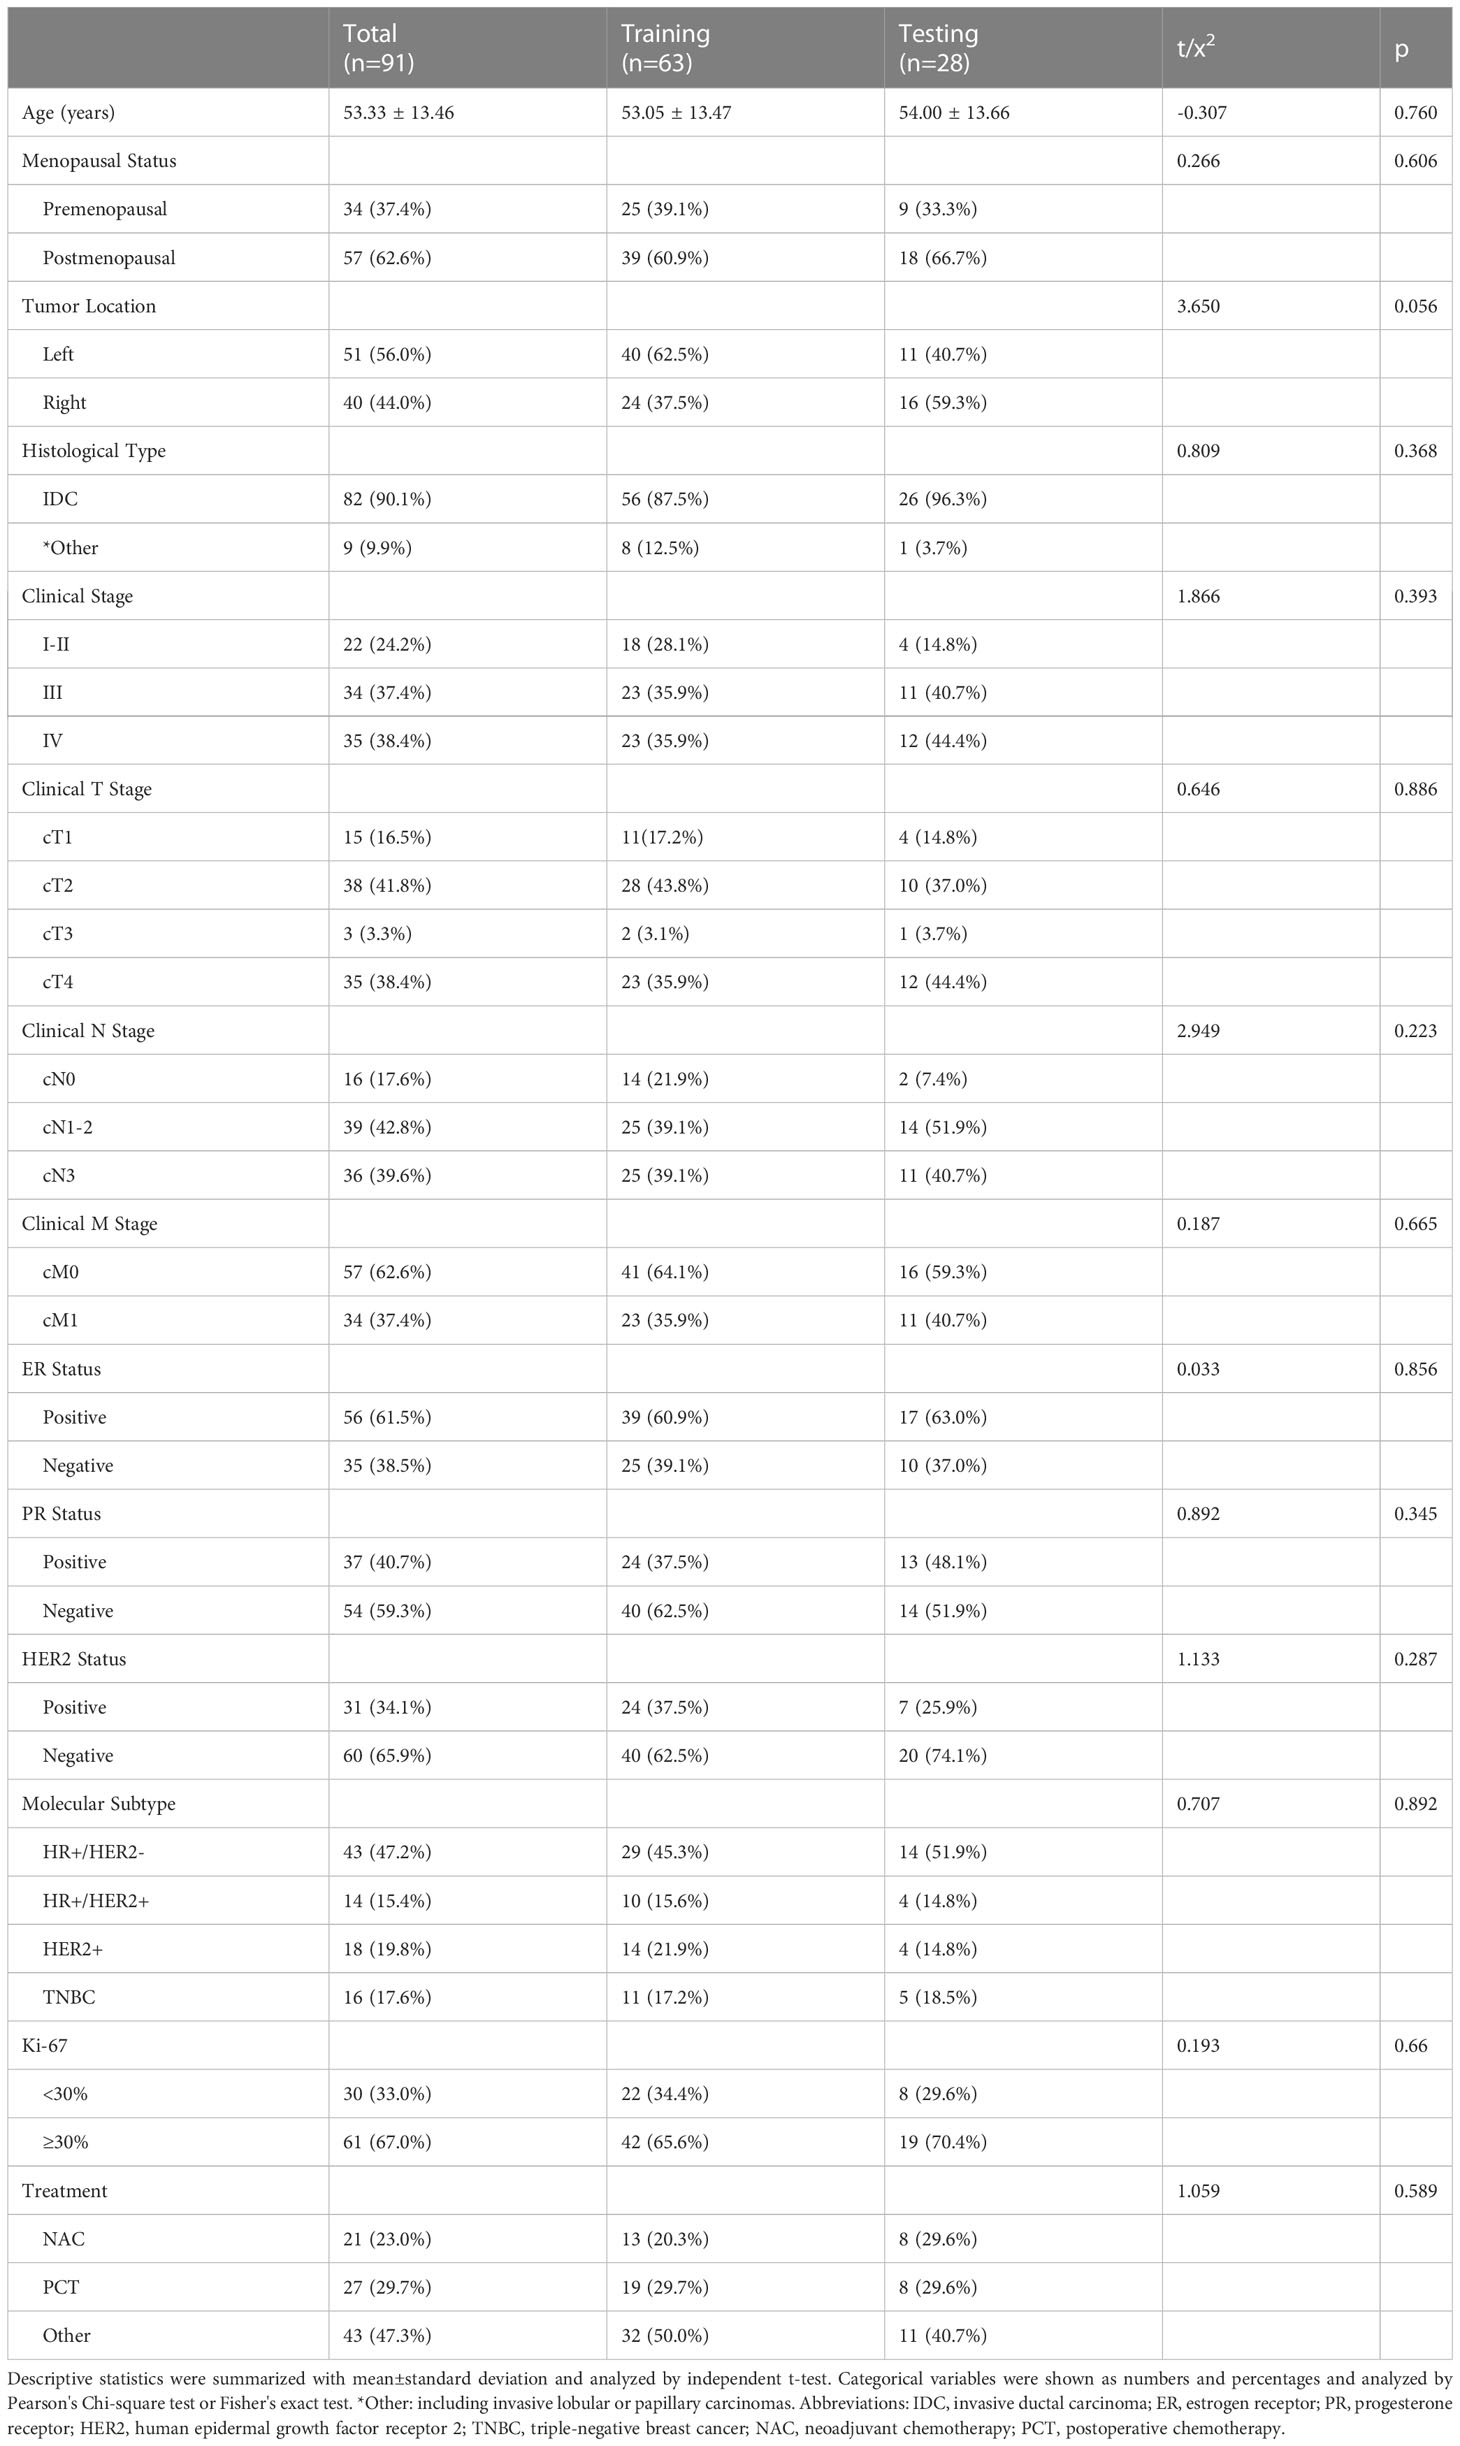
Table 1 The clinicopathological features of the enrolled population.
The intra-class correlation coefficient (ICC) of the extracted radiomic features was above 0.75 between the two experienced nuclear medicine physicians, and they reached a final agreement in consensus. Pearson correlation analysis between the RSs was visualized in Figure 3, and several strongly correlated clusters were circled by black boxes. After using LASSO for dimensionality reduction to remove redundant features (with zero coefficients), the most significant prognostic signatures were selected to calculate the Rad-score in the training cohort. Finally, a total of four RSs consisting of two CT RSs [SHAPE_Volume(mL)CT and GLZLM_GLNUCT] and two PET RSs (NGLDM_CoarsenessPET and GLZLM_GLNUPET) were chosen for predicting PFS. With regard to OS, two CT RSs (NGLDM_CoarsenessCT and NGLDM_ContrastCT) and three PET RSs (SHAPE_SphericityPET, NGLDM_CoarsenessPET, and GLZLM_GLNUPET) were involved in the predictive formula as follows: Rad-scorePFS= - 0.0941130 × SHAPE_Volume(mL)CT- 0.033147 × GLZLM_GLNUCT + 0.057186 × NGLDM_CoarsenessPET- 0.105334 × GLZLM_GLNUPET. Rad-scoreOS = 0.106539 × NGLDM_CoarsenessCT + 0.050655×NGLDM_ContrastCT + 0.049265×SHAPE_SphericityPET + 0.097559×NGLDM_CoarsenessPET - 0.013341×GLZLM_GLNUPET. The median Rad-score calculated using the above formula was 0.2923 (range: 0.0475 - 0.5508) for PFS and 0.4227 (range: 0.1636 - 0.9299) for OS. Moreover, the optimum threshold generated from the ROC analysis of PFS and OS was 0.3776 and 0.3197 in the training set, respectively. Table 2 shows that the area under the curve (AUC) was 0.670 (95% CI: 0.541 - 0.782) for PFS and 0.706 (95% CI: 0.579 - 0.814) for OS. Accordingly, patients were classified into low-score and high-score groups (Rad-scorePFS> 0.3776; Rad-scoreOS> 0.3197). Then, Rad-score was incorporated into the subsequent survival analysis as a potential prognostic biomarker. Univariate Cox regression indicated that Rad-score was closely associated with both PFS (p=0.039) and OS (p=0.0085) and was shown by KM survival curves (Figures 4G, 5E).
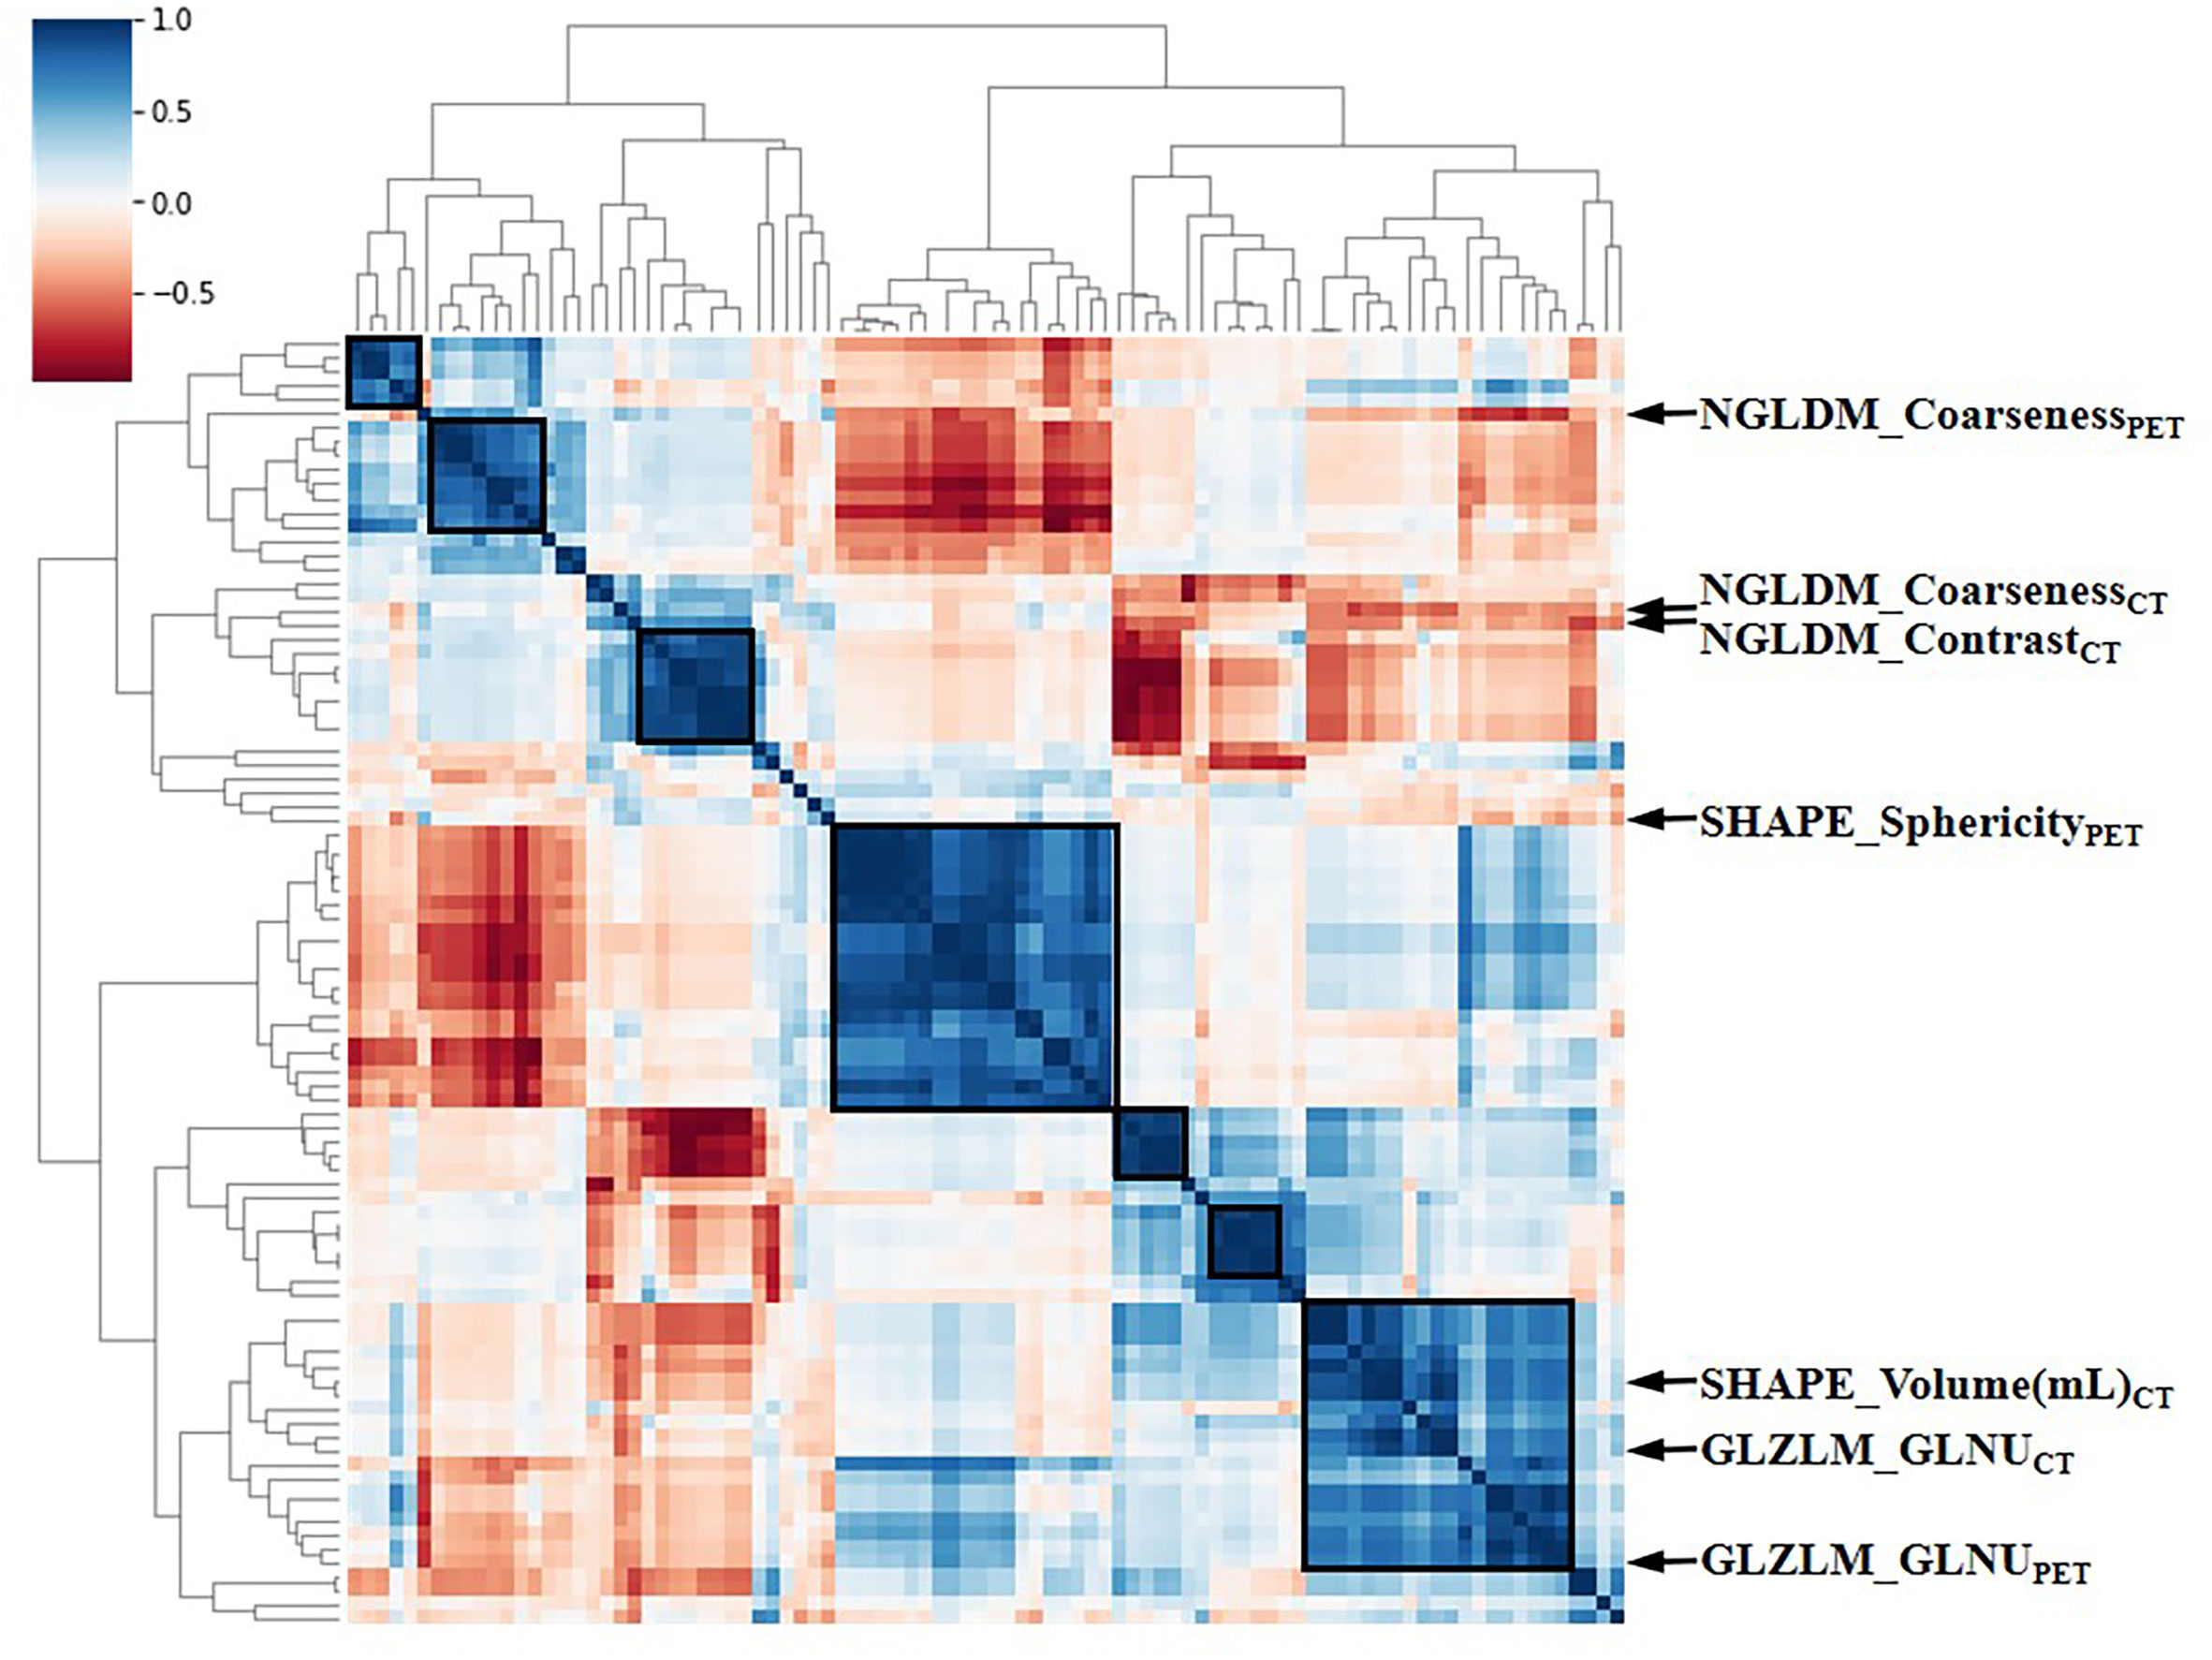
Figure 3 The heat map of Pearson correlation analysis among 97 radiomic features. Correlation coefficients were displayed by color scale. Boxes circled the clusters that were closely related. Representative RSs were marked by arrows. RSs, radiomic signatures; NGLDM, Neighboring Gray-level dependence matrix; GLZLM, Gray-Level Zone Length Matrix; GLNU, Gray-Level Non-Uniformity for zone.
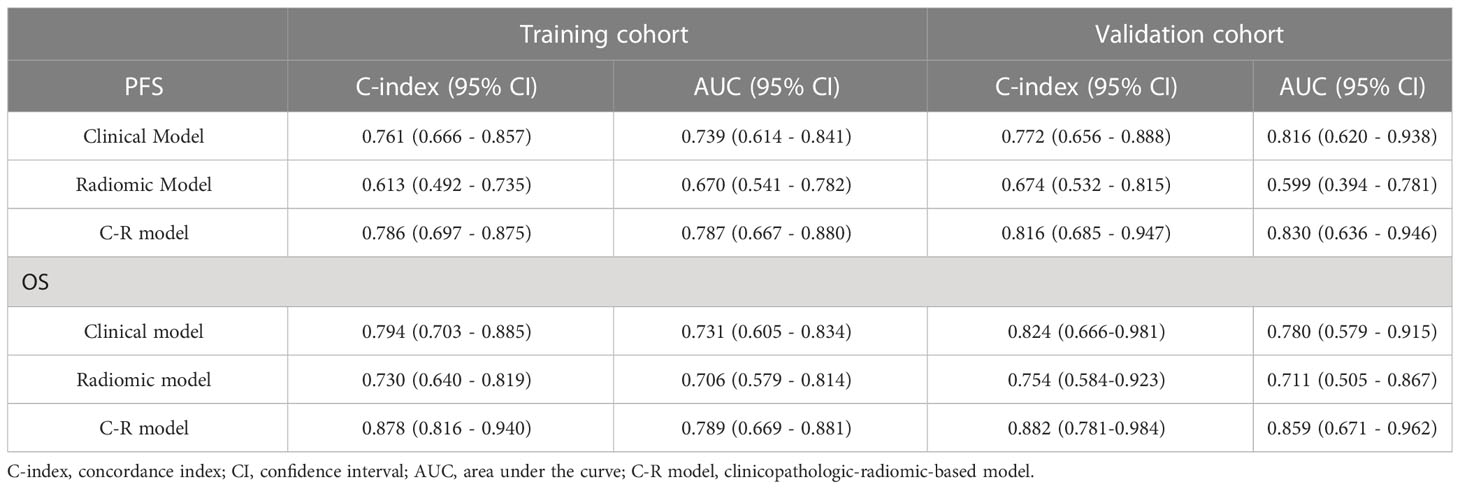
Table 2 The Harrell's C-index and AUC results in the training and validation cohorts.
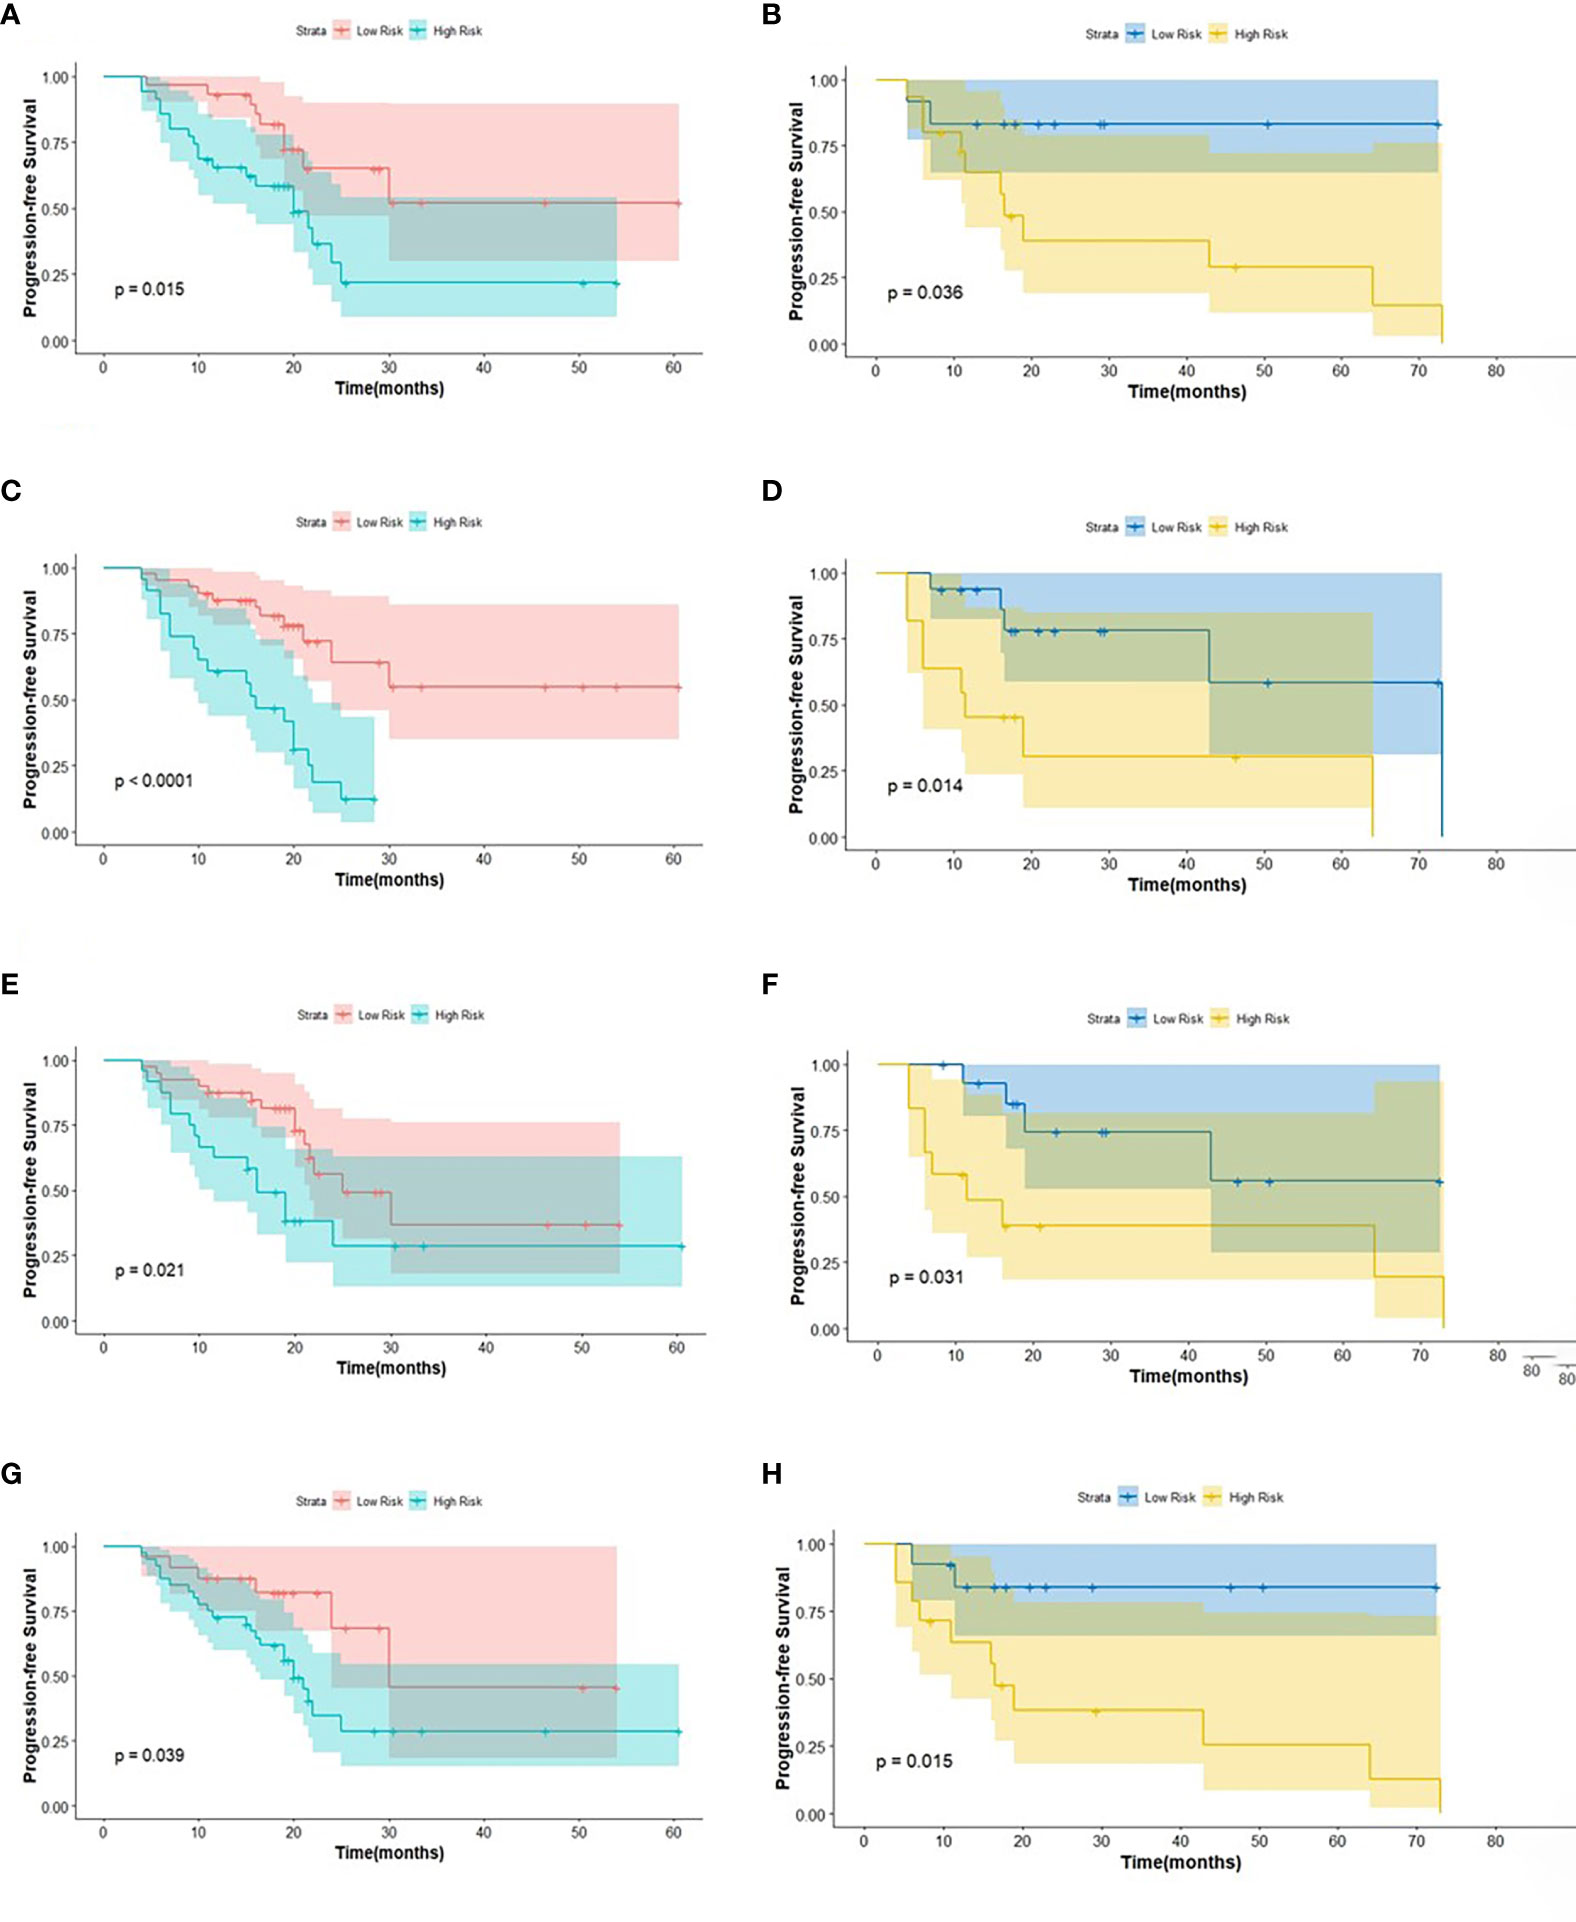
Figure 4 The KM analysis of independent factors for predicting PFS in the training cohort and in the testing cohort (A, B: age; C, D: clinical M stage; E, F: SUVmin; G, H: Rad-score).
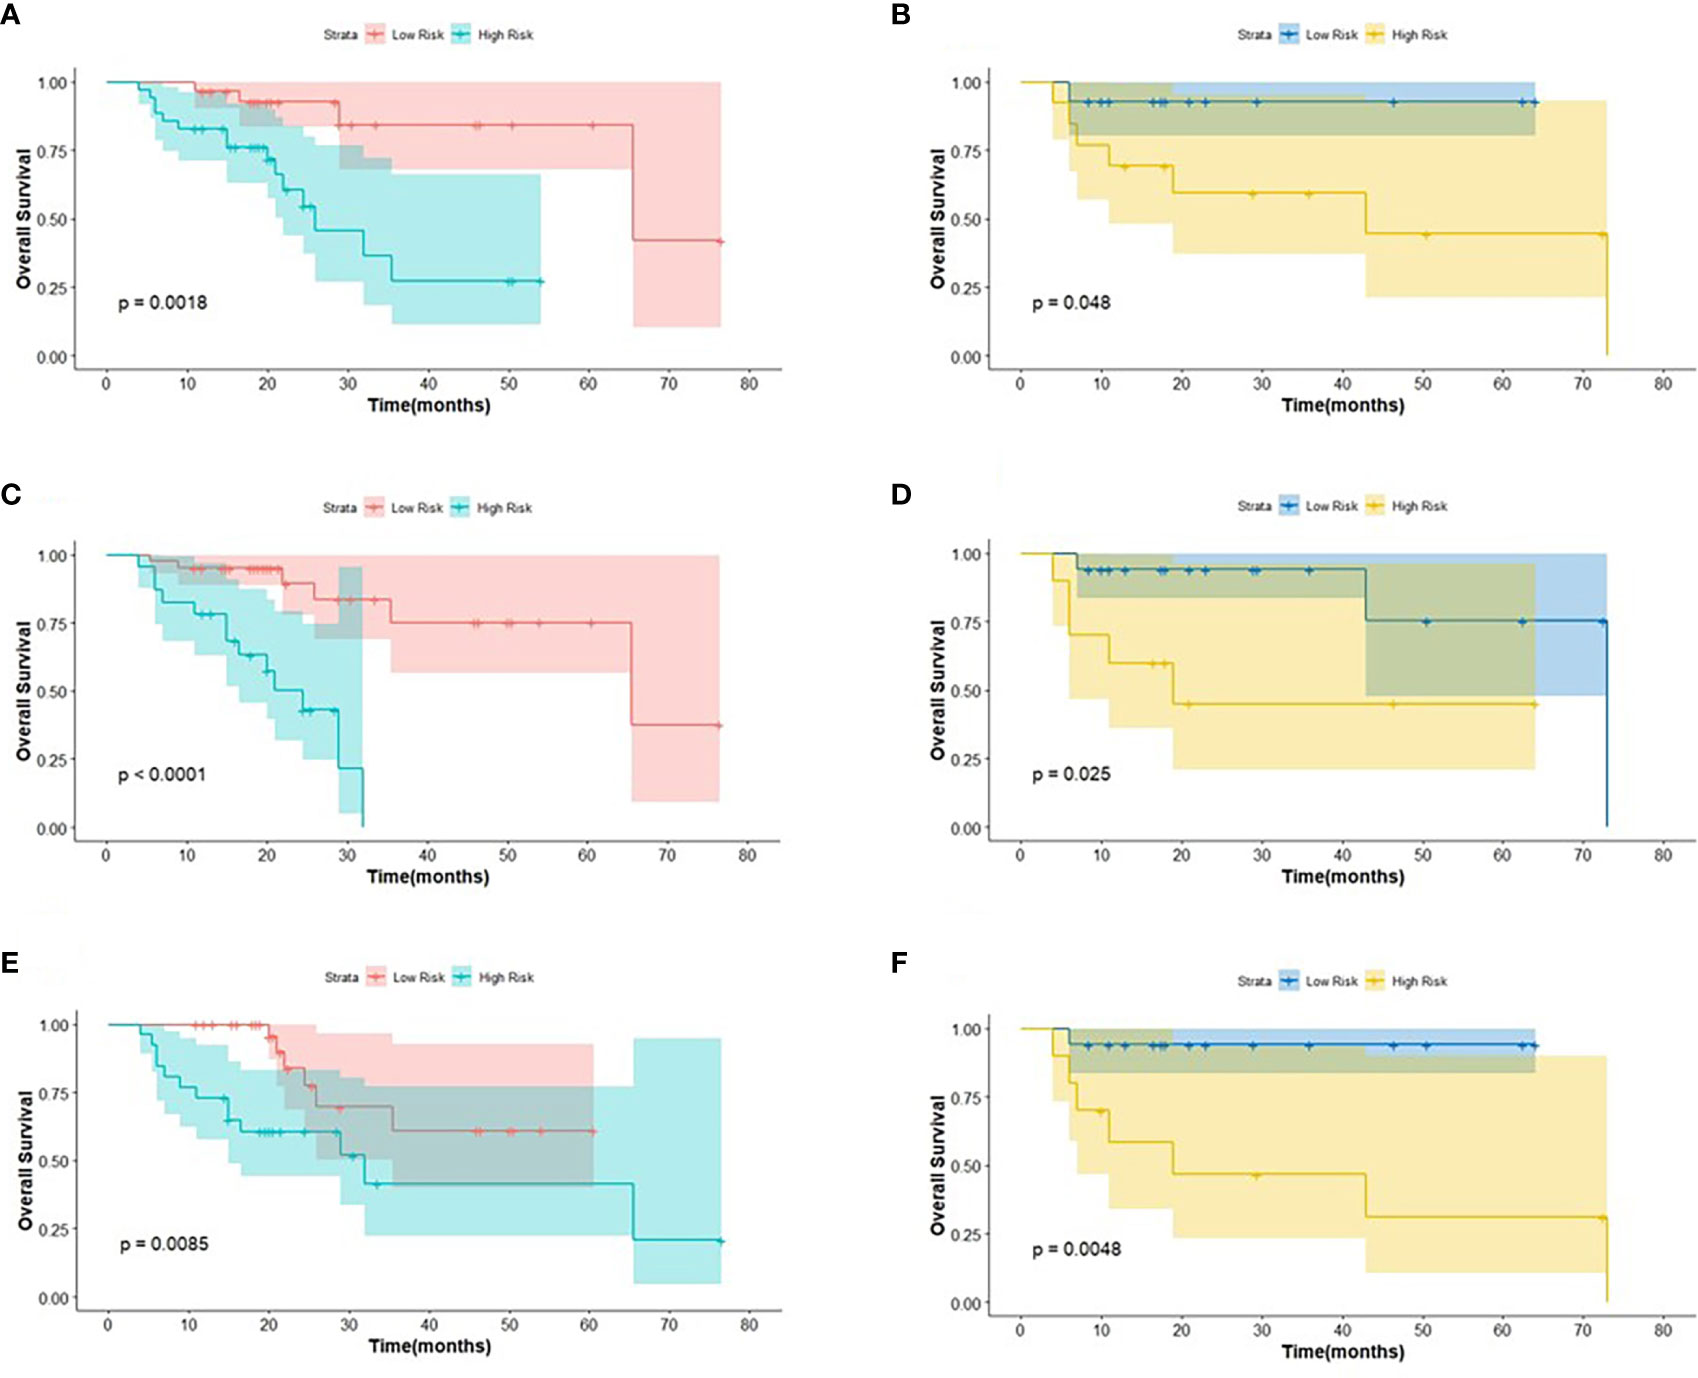
Figure 5 The KM analysis of meaningful biomarkers for predicting OS in the training cohort and in the testing cohort (A, B: age; C, D: clinical M stage; E, F: Rad-score).
The log-rank test was used to perform a univariate analysis of clinicopathological and radiomic features in predicting the prognosis of BC. Additionally, characteristics with a p-value <0.05 were included in the final multivariate Cox regression (Table 3). In the univariate analysis of PFS, it was found that age, menopausal status, clinical stage, clinical N stage, clinical M stage, ER status, PR status, Ki-67, SUV parameters (SUVmax, SUVmin, SUVmean, and SUVpeak), and Rad-score were potential biomarkers. Among them, age (HR = 3.532, P = 0.013), clinical M stage (HR = 2.977, P = 0.017), SUVmin (HR = 4.240, P = 0.001), and Rad-score (HR = 2.660, P = 0.044) were independent factors for prognosis in the multivariate proportional hazards model (Figure 6). Meanwhile, age (HR = 5.644, P = 0.013), clinical M stage (HR = 3.499, P = 0.057), and Rad-score (HR = 3.627, P = 0.026) were selected from significant factors (age, menopausal status, clinical stage, clinical N stage, clinical M stage, PR status, and Rad-score) to construct the integrated model for predicting OS. Furthermore, the remaining factors had a strong predictive value for PFS and OS in the training cohort, which was similar to the results observed in the validation cohort through KM analyses (Figures 4, 5).
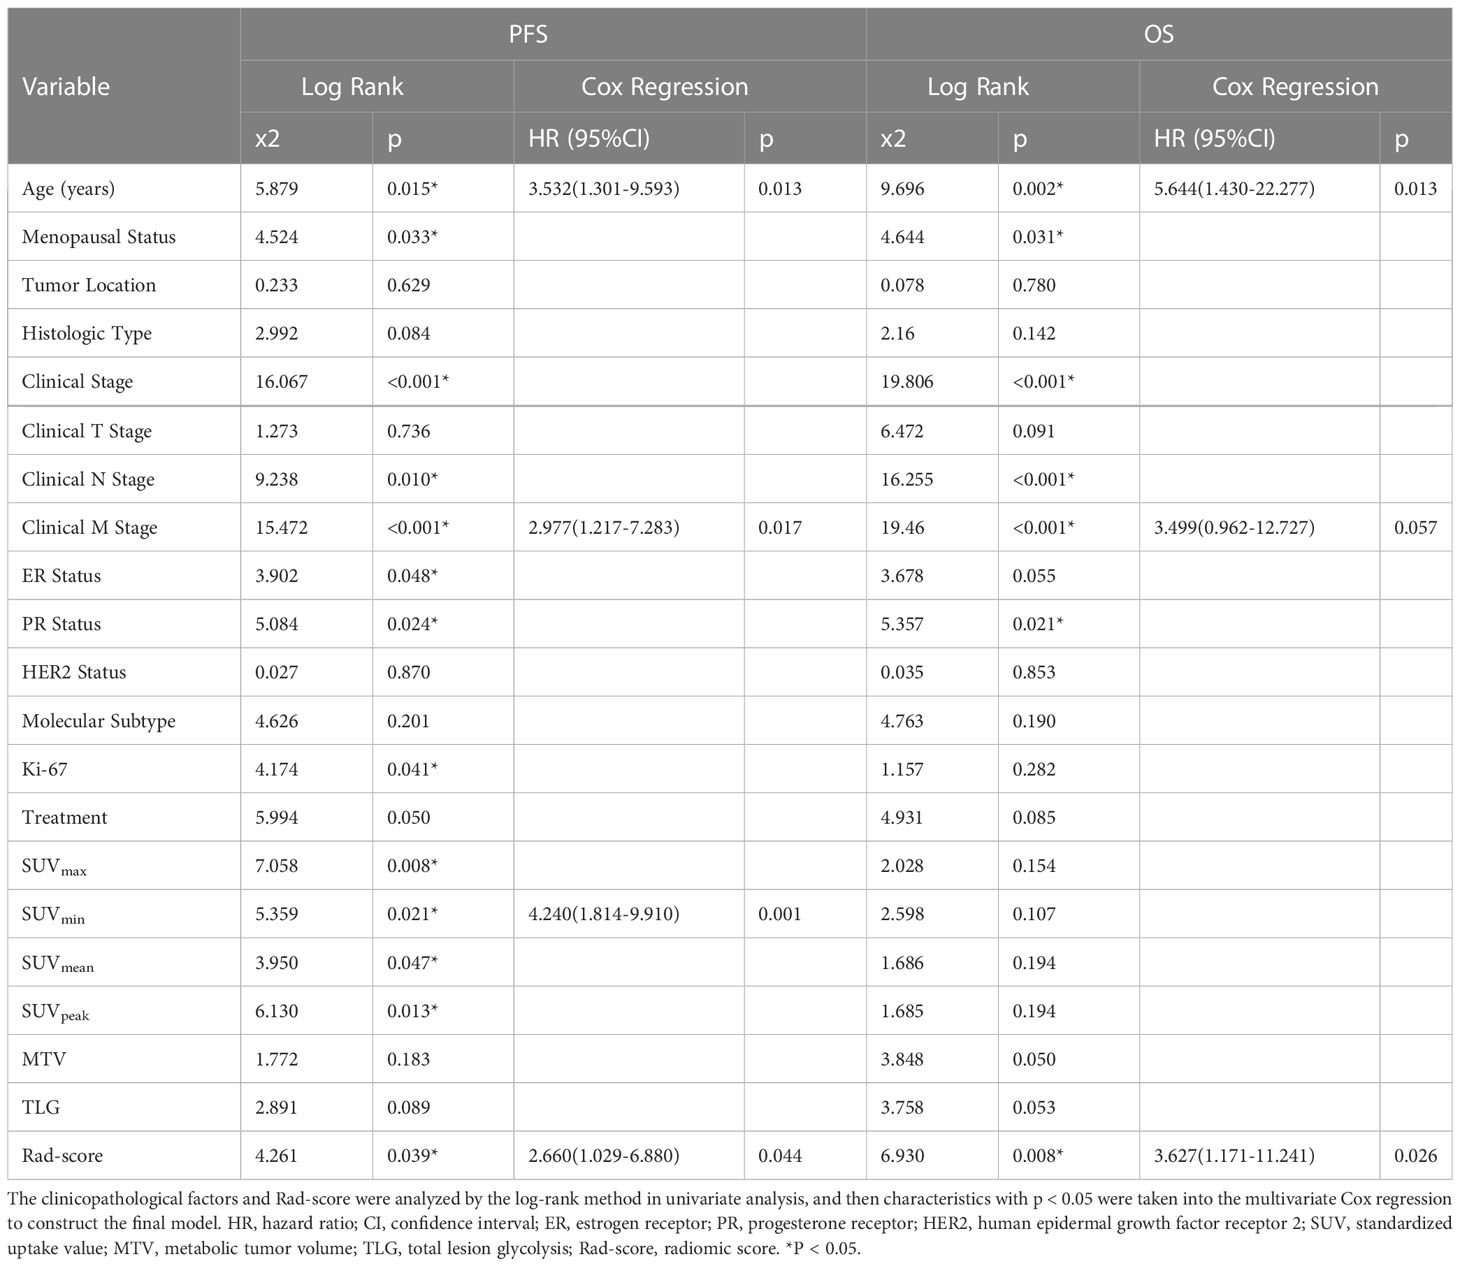
Table 3 The results of the univariate and multivariate Cox regression analysis.
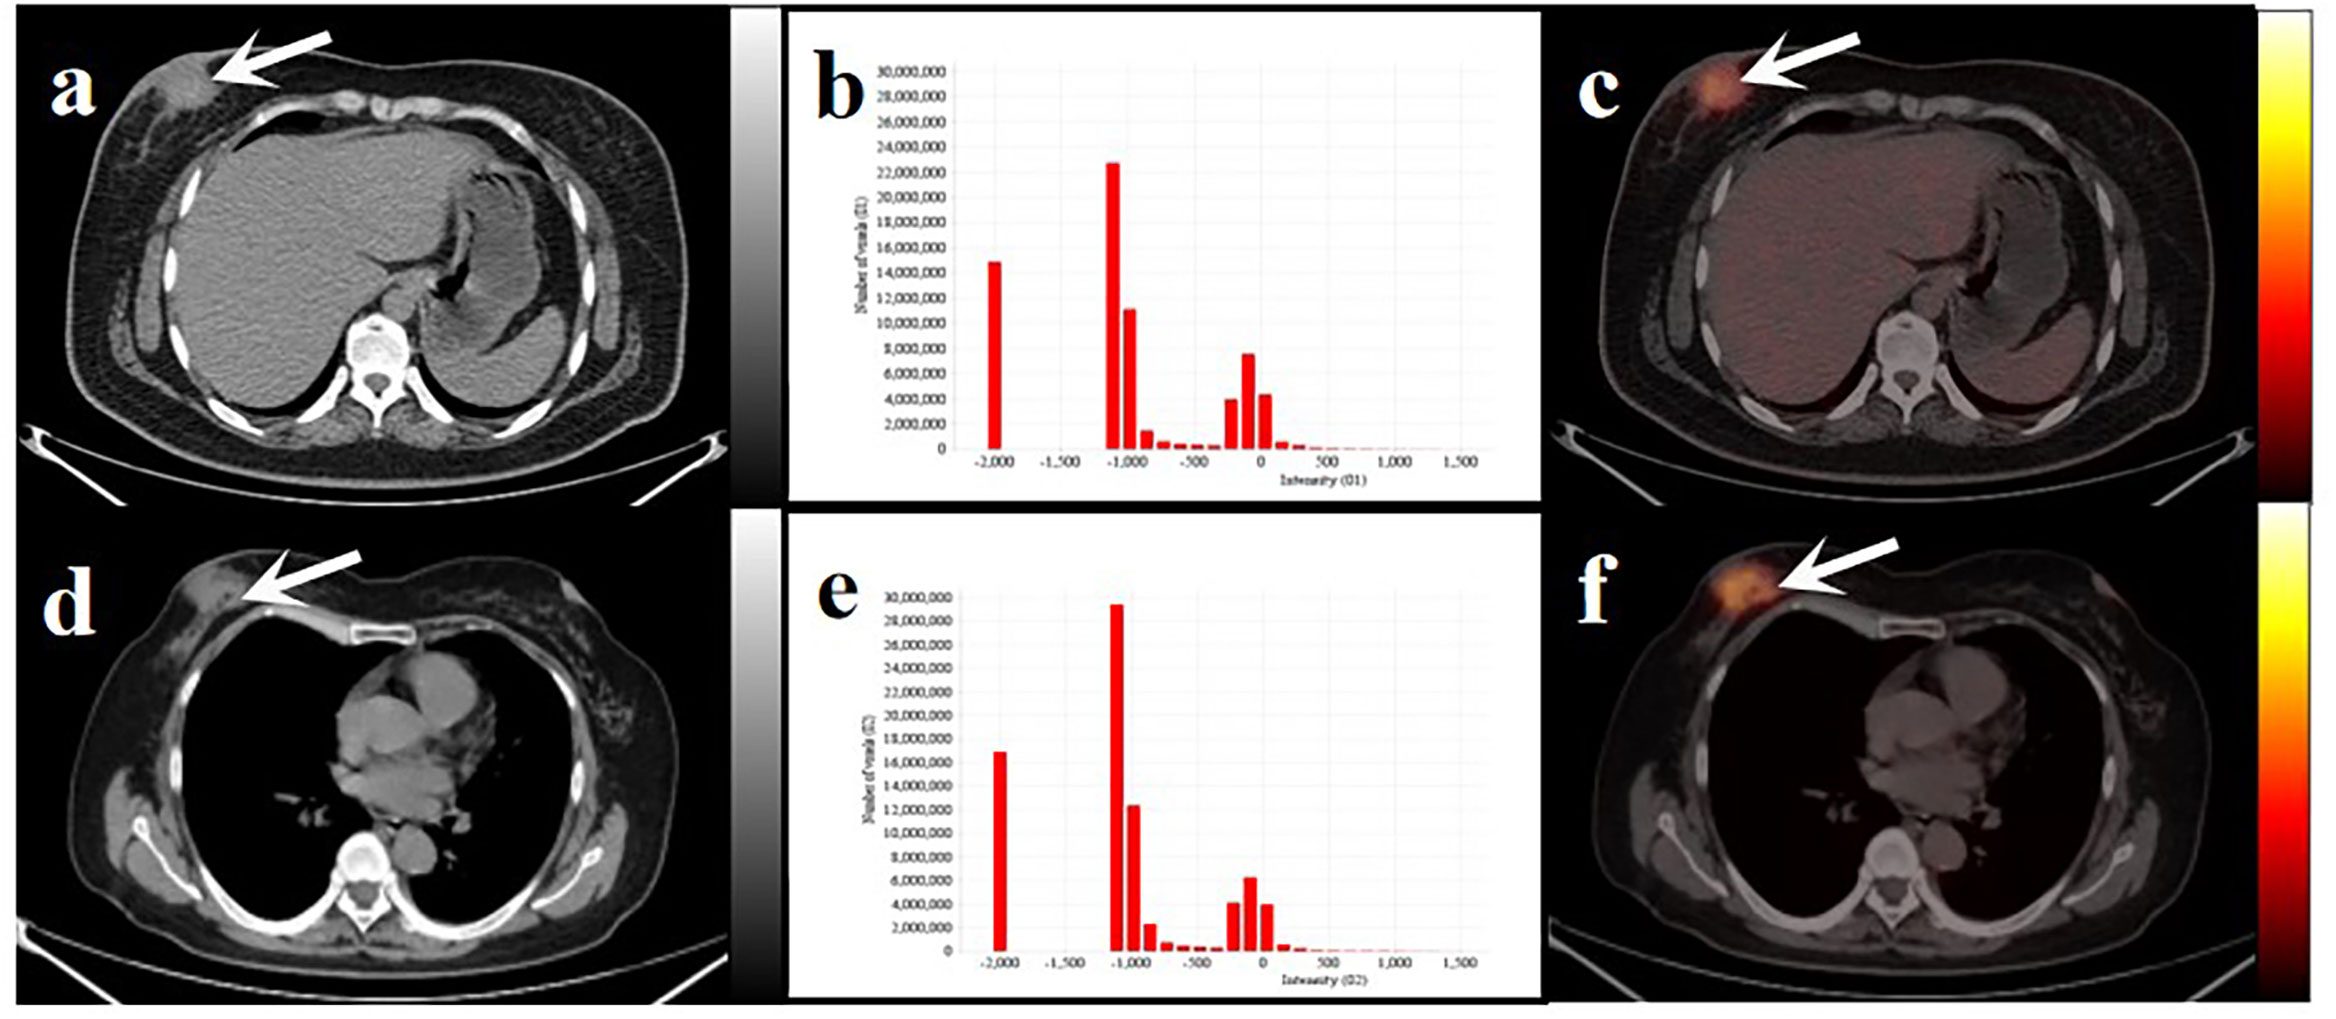
Figure 6 Two women with similar lesions were initially diagnosed with BC. Axial low-dose CT images (A, D) and infusion PET/CT images (C, F). Black and white arrows point to the primary lesions located on the right breast. The histograms of CT intensity for the VOI (B, E). The former (age: 32 years, IDC: grade 2, molecular type: HR+/HER2-, clinical stage: T4N1M0, Rad-score: 0.1647) who underwent neoadjuvant chemotherapy didn’t have any obvious disease progression during the 19-month follow-up. The latter (age:61 years, IDC: grade 2, molecular type: TNBC, clinical stage: T4N3M1, Rad-score: 0.3089) underwent postoperative chemotherapy and died after 20 months. These primary lesions were similar on PET/CT images but showed significant differences in the histograms of the radiomic features and clinical outcomes.
To evaluate the probability of 1-, 2-, and 3-year PFS and OS, we established nomograms for an integrated model that incorporated the most valuable clinical and imaging parameters (Figure 7). For the training cohort, the concordance index (C-index) and AUC of the C-R model were 0.786 (95% CI: 0.697 - 0.875) and 0.787 (95% CI: 0.667 - 0.880), respectively, for PFS prediction. These values were superior to those of the single clinical or radiomic models, demonstrating the good predictive accuracy of the C-R model (Table 2). Similar performance was observed for OS, where the C-index and AUC of the C-R model were 0.878 (95% CI: 0.816 - 0.940) and 0.789 (95% CI: 0.669 - 0.881), respectively, and were higher than those of other models. The C-R model was successfully validated in the testing set. In the validation cohort, the C-index of the C-R model was 0.816 (95% CI: 0.685 - 0.947) for predicting PFS and 0.882 (95% CI: 0.781 - 0.984) for predicting OS. Using ROC curve analysis, we found that the C-R model had a higher AUC compared with the other two models for predicting PFS (AUC = 0.830, 95% CI: 0.636 - 0.946) and OS (AUC = 0.859, 95% CI: 0.671 - 0.962) (Table 2). Figure 8 presents the DCA and calibration curve of the nomogram (2-year predictive probability of the C-R model) for PFS and OS. The DCA for the PFS nomogram indicated that the net benefit of the clinical and C-R models was slightly higher compared with the radiomic model within reasonable threshold probabilities (Figure 8A). Regarding OS, while there was no significant difference observed among the three models, all of them provided overall net benefits in clinical application (Figure 8B). Both calibration curves of the nomograms for PFS and OS showed accurate discrimination between prediction and observation in the testing set (Figures 8C, D).
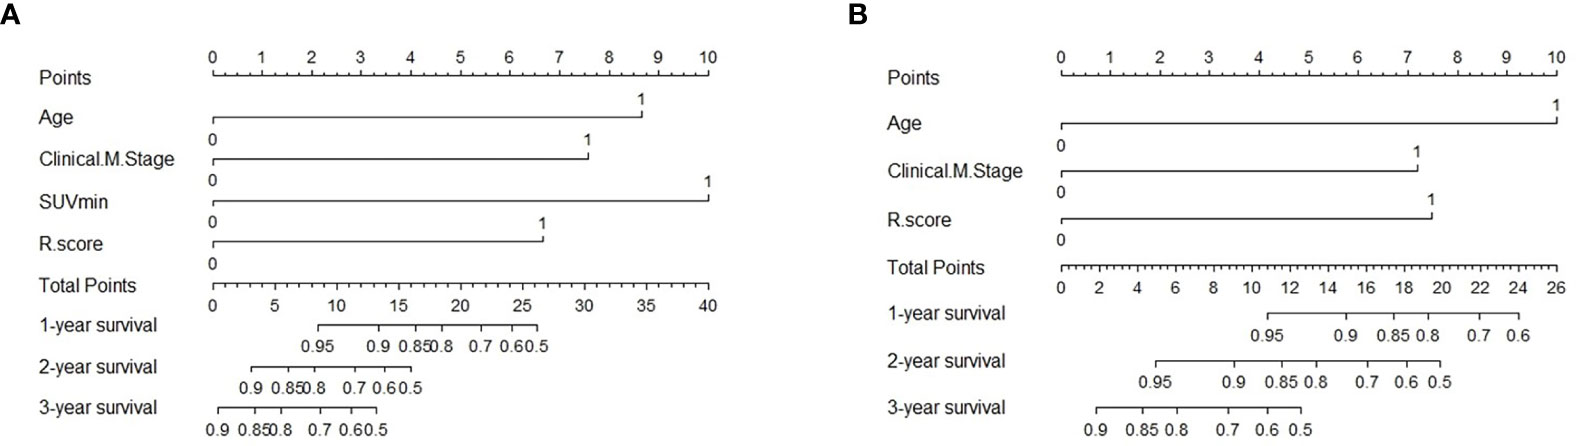
Figure 7 Predictive nomogram of C-R model for PFS (A) and OS (B) in the testing cohort. Summed by the points of every risk factor, the final points are located on the Total Point axis. R.score, radiomic score.
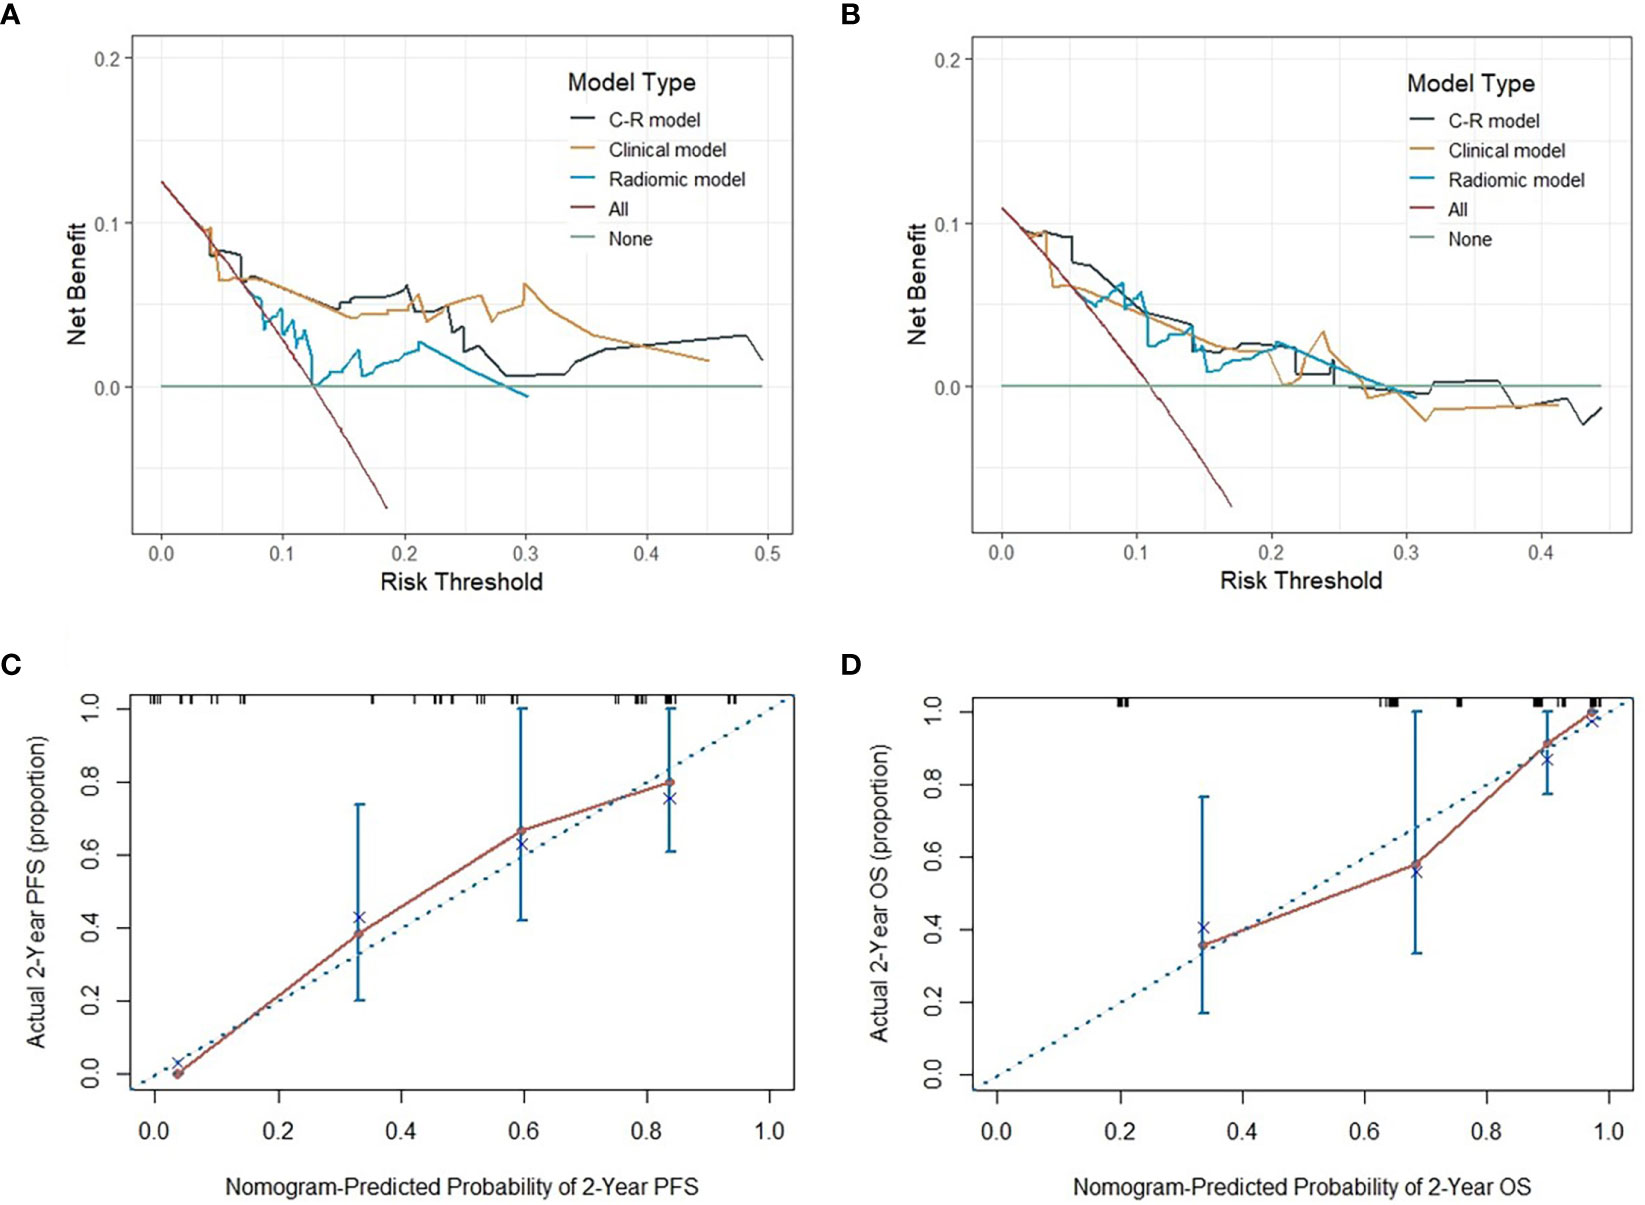
Figure 8 The DCA of three models for PFS and OS in the testing cohort (A, B). The y-axis measures the net benefit, which is calculated by summing the benefits (true positive results) and subtracting the harms (false-positive results). The calibration curves of C-R models’ nomograms for the 2-year probability of PFS and OS (C, D). The dashed line indicated a perfect match between the actual probability (y-axis) and the nomogram-predicted probability of 2-year PFS and OS (x-axis).
Recent studies have revealed various clinical endpoints among individuals with BC, and precise prediction based on non-invasive machine learning methods has become increasingly prevalent in prognostic research (29–31). These promising results have encouraged the emergence of combination models based on clinical, histological, and imaging features to better meet clinical requirements (32, 33). In this study, we established novel nomograms that reflected the underlying role of clinicopathological and radiomic biomarkers extracted from 18F-FDG PET/CT to estimate the outcomes of BC patients. Regarding the prediction of PFS, the C-index of the C-R model, clinical model, and radiomic model was 0.786, 0.761, and 0.613 in the training group and 0.878, 0.794, and 0.730 in the testing group, respectively. With regard to the endpoint of OS in the training test, the C-index of the three models was 0.816, 0.772, and 0.674, and it became 0.882, 0.731, and 0.706 in the testing test, respectively. These findings suggested the superior predictive performance of the combination model in both the training and validation cohorts compared to other single models.
Traditionally, clinicians have relied on TNM staging to make prognostic assessments based on physical examinations and clinical symptoms. With the emergence of PET/CT scans, these assessments have been improved. However, patients at the same stage still show varying outcomes, even when treated with similar strategies, as the stage changes. Therefore, there is an urgent clinical need for an accurate predictive method of prognosis, particularly for highly heterogeneous malignancies, such as BC. In our retrospective study, metabolic parameters of PET/CT played an invaluable role in predicting the risk of disease recurrence. Shingo Baba et al. have revealed a correlation between higher SUVs extracted from PET images and a poor prognosis of BC. On the other hand, Evangelista et al. have found that MTV and TLG are independent factors in predicting BC recurrence, while SUVmax demonstrates poor prognostic performance. However, it is important to note that metabolic parameters can be influenced by various physiological and technical factors. In the end, only SUVmin is identified as independently associated with PFS.
To comprehensively quantify tumor heterogeneity, radiomics can provide more detailed information on the tumor microenvironment beyond visual features, allowing for the reflection of multiple clinical endpoints. High-dimensional features, such as NGLDM and GLZLM, have been found to be associated with survival time in various tumor types and have been used in the construction of the Rad-score (34–36). These studies have also confirmed that Rad-score is an independent biomarker for predicting survival status. In our present study, NGLDMCoarseness, NGLDMContrast, and GLZLMGLNU were selected using LASSO regression and used to calculate the Rad-score, which was found to be a meaningful predictor of both PFS and OS. As far as we know, our study is one of the few articles that have focused on predicting BC prognosis using PET/CT imaging and histology.
In addition, age and clinical M stage were also identified as prominent predictors for both PFS and OS in our study. Specifically, our study found that patients over the age of 50 and those with distant metastases (clinical M stage: M1) and higher Rad-score were more likely to experience earlier disease progression or even death. Moreover, recent research has confirmed that visually represented nomograms based on clinicopathologic risk factors and rad-score can significantly contribute to the prediction of prognosis (37). The C-index, along with its 95% CI, DCA, and calibration curve in the testing cohort, can provide a more comprehensive assessment, including discrimination, clinical applicability, and calibration of the nomogram for the predictive model (38). Therefore, we aimed to establish an integrated model visualized by a nomogram to assess the potential prognostic value of BC patients by combining PET/CT-based radiomics with clinical features.
However, our work has some limitations that need to be acknowledged. Firstly, our limited population needs to be taken into account, although it is homogeneous in terms of histology types. Our assumptions need to be further strengthened in multicenter prospective cohorts. Secondly, previous literature has shown that radiological signatures derived from PET/CT may be influenced by the equipment and software used for image acquisition, reconstruction, and analysis (39). All patients underwent PET/CT examination with consistent scanners in our study. Thirdly, although the inter-observer agreement was repeatable (ICC > 0.75), selection bias was inevitable. Lastly, the survival study highly depended on follow-up time, and adequate interviews will be necessary to validate our results.
In conclusion, we established a complex model that incorporated both clinicopathologic and radiomic factors, which could potentially serve as a biomarker for risk stratification of prognosis in patients with invasive BC. Our strategy demonstrated not only a great net benefit at a large range of threshold probabilities but also accurate discrimination in clinical applications.
The original contributions presented in the study are included in the article/supplementary material. Further inquiries can be directed to the corresponding authors.
The studies involving human participants were reviewed and approved by the First Affiliated Hospital of Soochow University. The ethics committee waived the requirement of written informed consent for participation.
TJ, QL, XC, and SD conceptualized and designed the study. SG and SS performed analysis. BZ and CY interpreted the data. TJ and QL drafted the manuscript. SS and SD revised the manuscript. All authors contributed to the article and approved the submitted version.
This research was funded by the National Natural Science Foundation of China (Grant No. 81601522 and 61927801), Gusu Health Talent Program (No. GSWS2020013), Suzhou Science and Education Youth Project (No. KJXW2021004), Project of State Key Laboratory of Radiation Medicine and Protection, Soochow University (No. GZK1202127), NHC Key Laboratory of Nuclear Technology Medical Transformation (MIANYANG CENTRAL HOSPITAL) (No. 2021HYX023 and 2021HYX029), the Suqian Sci & Tech Program (Grant No.K202107), and the Natural Science Foundation of the First Affiliated Hospital of Soochow University (No. BXQN202114).
The authors declare that the research was conducted in the absence of any commercial or financial relationships that could be construed as a potential conflict of interest.
All claims expressed in this article are solely those of the authors and do not necessarily represent those of their affiliated organizations, or those of the publisher, the editors and the reviewers. Any product that may be evaluated in this article, or claim that may be made by its manufacturer, is not guaranteed or endorsed by the publisher.
1. Sung H, Ferlay J, Siegel RL, Laversanne M, Soerjomataram I, Jemal A, et al. Global cancer statistics 2020: GLOBOCAN estimates of incidence and mortality worldwide for 36 cancers in 185 countries. CA Cancer J Clin (2021) 71:209–49. doi: 10.3322/caac.21660
2. Whelan TJ, Olivotto IA, Parulekar WR, Ackerman I, Chua BH, Nabid A, et al. MA.20 study investigators. Regional nodal irradiation in early-stage breast cancer. N Engl J Med (2015) 373:307–16. doi: 10.1056/NEJMoa1415340
3. Tryfonidis K, Senkus E, Cardoso MJ, Cardoso F. Management of locally advanced breast cancer-perspectives and future directions. Nat Rev Clin Oncol (2015) 12:147–62. doi: 10.1038/nrclinonc.2015.13
4. Early Breast Cancer Trialists' Collaborative group (EBCTCG). Trastuzumab for early-stage, HER2-positive breast cancer: a meta-analysis of 13 864 women in seven randomised trials. Lancet Oncol (2021) 22:1139–50. doi: 10.1016/S1470-2045(21)00288-6
5. Lüönd F, Tiede S, Christofori G. Breast cancer as an example of tumour heterogeneity and tumour cell plasticity during malignant progression. Br J Cancer (2021) 125:164–75. doi: 10.1038/s41416-021-01328-7
7. Gradishar WJ, Anderson BO, Abraham J, Aft R, Agnese D, Allison KH, et al. Breast cancer, version 3.2020, NCCN clinical practice guidelines in oncology. J Natl Compr Canc Netw (2020) 18:452–78. doi: 10.6004/jnccn.2020.0016
8. Amin MB, Greene FL, Edge SB, Compton CC, Gershenwald JE, Brookland RK, et al. The Eighth Edition AJCC Cancer Staging Manual: Continuing to build a bridge from a population-based to a more "personalized" approach to cancer staging. CA Cancer J Clin (2017) 67:93–9. doi: 10.3322/caac.21388
9. Cianfrocca M, Gradishar W. New molecular classifications of breast cancer. CA Cancer J Clin (2009) 59:303–13. doi: 10.3322/caac.20029
10. Wang X, Xie T, Luo J, Zhou Z, Yu X, Guo X. Radiomics predicts the prognosis of patients with locally advanced breast cancer by reflecting the heterogeneity of tumor cells and the tumor microenvironment. Breast Cancer Res (2022) 24:20. doi: 10.1186/s13058-022-01516-0
11. Groheux D, Cochet A, Humbert O, Alberini JL, Hindié E, Mankoff D. 18F-FDG PET/CT for staging and restaging of breast cancer. J Nucl Med (2016) 57 Suppl;1:17S–26S. doi: 10.2967/jnumed.115.157859
12. Ulaner GA. PET/CT for patients with breast cancer: where is the clinical impact? AJR Am J Roentgenol (2019) 213:254–65. doi: 10.2214/AJR.19.21177
13. Baba S, Isoda T, Maruoka Y, Kitamura Y, Sasaki M, Yoshida T, et al. Diagnostic and prognostic value of pretreatment SUV in 18F-FDG/PET in breast cancer: comparison with apparent diffusion coefficient from diffusion-weighted MR imaging. J Nucl Med (2014) 55:736–42. doi: 10.2967/jnumed.113.129395
14. Evangelista L, Cervino AR, Ghiotto C, Saibene T, Michieletto S, Fernando B, et al. Could semiquantitative FDG analysis add information to the prognosis in patients with stage II/III breast cancer undergoing neoadjuvant treatment? Eur J Nucl Med Mol Imaging (2015) 42:1648–55. doi: 10.1007/s00259-015-3088-4
15. Yan J, Chu-Shern JL, Loi HY, Khor LK, Sinha AK, Quek ST, et al. Impact of image reconstruction settings on texture features in 18F-FDG PET. J Nucl Med (2015) 56:1667–73. doi: 10.2967/jnumed.115.156927
16. Zwanenburg A. Radiomics in nuclear medicine: robustness, reproducibility, standardization, and how to avoid data analysis traps and replication crisis. Eur J Nucl Med Mol Imaging (2019) 46:2638–55. doi: 10.1007/s00259-019-04391-8
17. Lambin P, Leijenaar RTH, Deist TM, Peerlings J, de Jong EEC, van Timmeren J, et al. Radiomics: the bridge between medical imaging and personalized medicine. Nat Rev Clin Oncol (2017) 14:749–62. doi: 10.1038/nrclinonc.2017.141
18. Hatt M, Tixier F, Pierce L, Kinahan PE, Le Rest CC, Visvikis D. Characterization of PET/CT images using texture analysis: the past, the present… any future? Eur J Nucl Med Mol Imaging (2017) 44:151–65. doi: 10.1007/s00259-016-3427-0
19. Valdora F, Houssami N, Rossi F, Calabrese M, Tagliafico AS. Rapid review: radiomics and breast cancer. Breast Cancer Res Treat (2018) 169:217–29. doi: 10.1007/s10549-018-4675-4
20. Antunovic L, De Sanctis R, Cozzi L, Kirienko M, Sagona A, Torrisi R, et al. PET/CT radiomics in breast cancer: promising tool for prediction of pathological response to neoadjuvant chemotherapy. Eur J Nucl Med Mol Imaging (2019) 46:1468–77. doi: 10.1007/s00259-019-04313-8
21. Li P, Wang X, Xu C, Liu C, Zheng C, Fulham MJ, et al. 18F-FDG PET/CT radiomic predictors of pathologic complete response (pCR) to neoadjuvant chemotherapy in breast cancer patients. Eur J Nucl Med Mol Imaging (2020) 47:1116–26. doi: 10.1007/s00259-020-04684-3
22. Jiang Y, Yuan Q, Lv W, Xi S, Huang W, Sun Z, et al. Radiomic signature of 18F fluorodeoxyglucose PET/CT for prediction of gastric cancer survival and chemotherapeutic benefits. Theranostics (2018) 8:5915–28. doi: 10.7150/thno.28018
23. Li Y, Zhang Y, Fang Q, Zhang X, Hou P, Wu H, et al. Radiomics analysis of [18F]FDG PET/CT for microvascular invasion and prognosis prediction in very-early- and early-stage hepatocellular carcinoma. Eur J Nucl Med Mol Imaging (2021) 48:2599–614. doi: 10.1007/s00259-020-05119-9
24. Boellaard R, Delgado-Bolton R, Oyen WJ, Giammarile F, Tatsch K, Eschner W, et al. FDG PET/CT: EANM procedure guidelines for tumour imaging: version 2.0. Eur J Nucl Med Mol Imaging (2015) 42:328–54. doi: 10.1007/s00259-014-2961-x
25. Wolff AC, Hammond MEH, Allison KH, Harvey BE, Mangu PB, Bartlett JMS, et al. Human epidermal growth factor receptor 2 testing in breast cancer: american society of clinical oncology/college of american pathologists clinical practice guideline focused update. J Clin Oncol (2018) 36:2105–22. doi: 10.1200/JCO.2018.77.8738
26. Nioche C, Orlhac F, Boughdad S, Reuzé S, Goya-Outi J, Robert C, et al. LIFEx: A freeware for radiomic feature calculation in multimodality imaging to accelerate advances in the characterization of tumor heterogeneity. Cancer Res (2018) 78:4786–9. doi: 10.1158/0008-5472.CAN-18-0125
27. Wang S, Wei Y, Li Z, Xu J, Zhou Y. Development and validation of an MRI radiomics-based signature to predict histological grade in patients with invasive breast cancer. Breast Cancer (Dove Med Press) (2022) 14:335–42. doi: 10.2147/BCTT.S380651
28. Alba AC, Agoritsas T, Walsh M, Hanna S, Iorio A, Devereaux PJ, et al. Discrimination and calibration of clinical prediction models: users' Guides to the medical literature. JAMA (2017) 318:1377–84. doi: 10.1001/jama.2017.12126
29. Yu Y, Tan Y, Xie C, Hu Q, Ouyang J, Chen Y, et al. Development and validation of a preoperative magnetic resonance imaging radiomics-based signature to predict axillary lymph node metastasis and disease-free survival in patients with early-stage breast cancer. JAMA Netw Open (2020) 3:e2028086. doi: 10.1001/jamanetworkopen.2020.28086
30. Han X, Cao W, Wu L, Liang C. Radiomics assessment of the tumor immune microenvironment to predict outcomes in breast cancer. Front Immunol (2022) 12:773581. doi: 10.3389/fimmu.2021.773581
31. Huang SY, Franc BL, Harnish RJ, Liu G, Mitra D, Copeland TP, et al. Exploration of PET and MRI radiomic features for decoding breast cancer phenotypes and prognosis. NPJ Breast Cancer (2018) 4:24. doi: 10.1038/s41523-018-0078-2
32. Wang C, Chen X, Luo H, Liu Y, Meng R, Wang M, et al. Development and internal validation of a preoperative prediction model for sentinel lymph node status in breast cancer: combining radiomics signature and clinical factors. Front Oncol (2021) 11:754843. doi: 10.3389/fonc.2021.754843
33. Mazurowski MA, Saha A, Harowicz MR, Cain EH, Marks JR, Marcom PK. Association of distant recurrence-free survival with algorithmically extracted MRI characteristics in breast cancer. J Magn Reson Imaging (2019) 497:e231–40. doi: 10.1002/jmri.26648
34. Brown PJ, Zhong J, Frood R, Currie S, Gilbert A, Appelt AL, et al. Prediction of outcome in anal squamous cell carcinoma using radiomic feature analysis of pretreatment FDG PET-CT. Eur J Nucl Med Mol Imaging (2019) 46:2790–9. doi: 10.1007/s00259-019-04495-1
35. Zhou Y, Li J, Zhang X, Jia T, Zhang B, Dai N, et al. Prognostic value of radiomic features of 18F-FDG PET/CT in patients with B-cell lymphoma treated with CD19/CD22 dual-targeted chimeric antigen receptor T cells. Front Oncol (2022) 12:834288. doi: 10.3389/fonc.2022.834288
36. Toyama Y, Hotta M, Motoi F, Takanami K, Minamimoto R, Takase K. Prognostic value of FDG-PET radiomics with machine learning in pancreatic cancer. Sci Rep (2020) 10:17024. doi: 10.1038/s41598-020-73237-3
37. Li Q, Xiao Q, Li J, Duan S, Wang H, Gu Y. MRI-based radiomic signature as a prognostic biomarker for HER2-positive invasive breast cancer treated with NAC. Cancer Manag Res (2020) 12:10603–13. doi: 10.2147/CMAR.S271876
38. Huang YQ, Liang CH, He L, Tian J, Liang CS, Chen X, et al. Development and validation of a radiomics nomogram for preoperative prediction of lymph node metastasis in colorectal cancer. J Clin Oncol (2016) 34:2157–64. doi: 10.1200/JCO.2015.65.9128
Keywords: breast cancer, radiomic, PET/CT, prognosis, nomogram, biomarker
Citation: Jia T, Lv Q, Cai X, Ge S, Sang S, Zhang B, Yu C and Deng S (2023) Radiomic signatures based on pretreatment 18F-FDG PET/CT, combined with clinicopathological characteristics, as early prognostic biomarkers among patients with invasive breast cancer. Front. Oncol. 13:1210125. doi: 10.3389/fonc.2023.1210125
Received: 21 April 2023; Accepted: 06 July 2023;
Published: 27 July 2023.
Edited by:
Iman Mamdouh Talaat, University of Sharjah, United Arab EmiratesReviewed by:
Xiaoliang Shao, First People’s Hospital of Changzhou, ChinaCopyright © 2023 Jia, Lv, Cai, Ge, Sang, Zhang, Yu and Deng. This is an open-access article distributed under the terms of the Creative Commons Attribution License (CC BY). The use, distribution or reproduction in other forums is permitted, provided the original author(s) and the copyright owner(s) are credited and that the original publication in this journal is cited, in accordance with accepted academic practice. No use, distribution or reproduction is permitted which does not comply with these terms.
*Correspondence: Bin Zhang, emJudWNsbWRAMTI2LmNvbQ==; Chunjing Yu, Y2h1bmppbmd5dTIwMjJAMTYzLmNvbQ==; Shengming Deng, ZHNobWluZ0AxNjMuY29t
†These authors have contributed equally to this work
Disclaimer: All claims expressed in this article are solely those of the authors and do not necessarily represent those of their affiliated organizations, or those of the publisher, the editors and the reviewers. Any product that may be evaluated in this article or claim that may be made by its manufacturer is not guaranteed or endorsed by the publisher.
Research integrity at Frontiers
Learn more about the work of our research integrity team to safeguard the quality of each article we publish.