 Toros A. Dincman1,2,3*
 Joseph A. Q. Karam3
 Antonio Giordano1,2,4,5Hong Li2,6
 Leylah M. Drusbosky7
 Theodore S. Gourdin1,2Philip H. Howe3Michael B. Lilly1,2
- 1Department of Medicine, Division of Hematology and Oncology, Medical University of South Carolina, Charleston, SC, United States
- 2Hollings Cancer Center, Medical University of South Carolina, Charleston, SC, United States
- 3Department of Biochemistry and Molecular Biology, College of Medicine, Medical University of South Carolina, Charleston, SC, United States
- 4Medical Oncology, Dana-Farber Cancer Institute, Boston, MA, United States
- 5Medical Oncology, Harvard Medical School, Boston, MA, United States
- 6Department of Public Health Sciences, University of California- Davis, Davis, CA, United States
- 7Guardant Health, Redwood City, CA, United States
Purpose: Analysis of circulating tumor DNA (ctDNA) in patients with metastatic prostate cancer (mPC) provides an opportunity to identify and monitor genomic alterations during a patient’s treatment course. We evaluated whether the presence of specific gene amplifications (GAs) and plasma copy number (PCN) alterations are associated with disease features.
Methods: This is a single-institution retrospective study of patients with mPC who underwent ctDNA profiling using Guardant360® (Guardant Health Inc.). This test identifies single nucleotide variants (SNVs) and GAs of select genes by next-generation sequencing. A total of 155 men with mPC were studied. Patients were stratified by GA status. The Kaplan-Meier method and multivariate cox regression models were used to estimate overall survival (OS) or failure-free survival (FFS) from either the date of GA detection or the initiation of systemic therapy. The chi-square test was used to evaluate associations between clinical factors and GAs.
Results: The presence of liver and/or lung metastases was associated with GAs of BRAF, CDK6, PI3KCA, and FGFR1. Survival analyses were completed on a subset of 83 patients with metastatic castration-resistant prostate cancer (mCRPC). Median OS was improved in patients with 1 GA compared to patients with ≥2 GAs, whether determined from the date of initial GA(s) detection (14.9 mo vs. 8.9 mo) or date of therapy initiation nearest to GA detection (16.7 mo vs. 9.0 mo). Patients without GAs had not reached median OS. Patients with androgen receptor (AR) GA only were also found to have better median OS compared to patients with AR GA plus at least one other additional GA (19.3 mo vs. 8.9 mo). Patients with PIK3CA GA had significantly lower median OS compared to patients with GAs that did not have a PIK3CA GA (5.9 mo vs. 16.0 mo). In patients with AR and/or MYC GA(s), median OS improved in those with reduced AR or MYC PCN during therapy compared to those without such a reduction (25.1 mo vs. 15.9 mo).
Conclusions: The association of select GAs with survival provides an additional tool for assessing mCRPC prognosis and informing management. Serial monitoring of ctDNA GAs is also useful to guide prognosis and therapeutic response.
Introduction
Prostate cancer (PC) remains the most diagnosed malignancy and the second leading cause of cancer-related death among men in the United States. Between 2014 and 2019, prostate cancer incidence has increased by 3% per year (1, 2). Although most men diagnosed with PC have local disease, recurrences frequently occur (3, 4). Furthermore, diagnosis of metastatic prostate cancer (mPC) has been modestly increasing in the context of changing screening practices and is a dynamic disease with a poor prognosis, particularly as it progresses to castration-resistant prostate cancer (CRPC) (5–8). Prostate cancer has the propensity to develop resistance across various treatment paradigms, which include androgen axis targeting agents and chemotherapy. Thus, uncovering the genomic phenotypes as the disease evolves is critical to understanding patient prognosis, treatment sequencing, and developing novel therapeutics. Circulating tumor DNA (ctDNA) provides an essential tool for understanding such genomic phenotypes, guiding therapeutic decisions, and characterizing tumor heterogeneity in a cost-effective manner. It poses minimal patient risk and little technical challenge compared to (repeated) biopsy of tumor tissue (8–10).
Recently, the use of ctDNA analysis has increased, enhancing our understanding of PC progression and helping to guide clinical management (9). An analysis of more than 500 patients with metastatic CRPC (mCRPC) identified frequent androgen receptor (AR) and MYC alterations associated with clinical outcomes, such as overall survival (OS) and failure-free survival (FFS) (11). Several AR mutations that are associated with resistance to anti-androgen axis therapies were identified by ctDNA analysis and can guide therapeutic decision-making (12). Although distinct from ctDNA, circulating cell-free DNA (cfDNA), which consists of ctDNA and hematopoietic cell-derived DNA, is elevated in patients with mPC and can also serve as a marker of therapeutic response. For example, decreased cfDNA levels were associated with improved outcomes in patients harboring mutations in genes involved in homologous recombination and demonstrating clinical response to poly(ADP)ribose polymerase (PARP) inhibitor (13). Similarly, cfDNA levels were reduced in patients receiving taxane therapy, and that reduction was associated with both radiological progression-free survival (rPFS) and OS (14). Finally, ctDNA levels were associated with rPFS in mCRPC patients in the A.MARTIN phase II study of abiraterone with or without pan-AKT inhibitor ipatasertib (15).
In patients with mPC, the genomic landscape remains fluid throughout the treatment course. ctDNA can be used to profile somatic mutations and genomic amplifications (GAs) with their corresponding variant allele frequency (VAF) plasma copy number (PCN) during any stage of the treatment course. GAs may be representative of either chromosomal duplication and/or gene-specific amplification, which is particularly interesting because aneuploidy is a relevant feature of aggressive prostate cancers that may be more likely to be lethal (16). Copy number alterations frequently occur in the form of loss of regions, with the loss of tumor suppressors CHD1, RB1, TP53 and PTEN as the most common alterations (17). A recently published copy number alteration analysis from 300 patients in the androgen deprivation therapy control arm of the STAMPEDE trial showed that loss of segments of chromosome 5 containing CHD1 and amplifications in segments of chromosome 8 containing MYC were associated with a higher burden of copy number alterations. Copy number alteration burden was associated with a statistically significant increase in metastasis at diagnosis, risk of progression, and death (18). This follows prior demonstration of the presence of AR, or MYC, or BRAF amplifications (as detected by ctDNA) are associated with worse OS (11). Furthermore, we previously demonstrated that elevated carcinoembryonic antigen (CEA) is associated with higher rates of liver metastases and increased copy number alterations of select genes (19).
The prognostic significance of GAs and PCN detected prior to or serially through the course of treatment in a cohort of patients remains to be fully characterized. The majority of ctDNA assays do not commonly report on actionable deletions, germline mutations, or less frequent GAs such as chromosomal rearrangements (20). This limitation led us to focus on whether GAs and PCN measured through ctDNA analysis alone can inform us on clinical outcomes and therefore continue to build from prior studies. To investigate the associations between GAs and PCN with specific clinical factors and treatment outcomes, we conducted a retrospective analysis of patients at our institution with mPC who harbor GAs.
Methods
Patient selection
Patients with mPC who were seen at the Medical University of South Carolina’s Hollings Cancer Center (Charleston, SC) from March 2015 through March 2020 and underwent ctDNA evaluation using the Guardant360® platform (Guardant Health Inc., Redwood City, CA) were eligible for analysis (21). Eligible patients were de-identified, and demographic, clinical, and corresponding ctDNA data were collected. Patients with one or more GAs (i.e., increase in PCN) were selected for downstream analysis. Our cohort (Figure 1) included mPC patients with a ctDNA-detectable increase in PCN in at least one gene. Collected clinical data included Gleason score at diagnosis, prostate-specific antigen (PSA), hemoglobin (Hgb), metastatic disease present at diagnosis, sites of metastases, castrate-resistant status, Eastern Cooperative Oncology Group (ECOG) performance status, and systemic therapies received prior to collection of plasma for ctDNA analysis. Metastatic sites included bone only, lymph node only, liver/lung only, bone and lymph node, and liver/lung with other sites. Patients who had been diagnosed with mCRPC were divided into two groups. Patients in Group A (Figure 1) had evaluable survival and systemic therapy time points in addition to ctDNA analysis. Overall survival was defined as duration from ctDNA sample collection or treatment start date to study end date or death. Failure-free survival was defined as duration from treatment start date to date treatment was last administered or death. Patients in Group B had detectable AR or MYC amplification and two serial ctDNA analyses. The conduct of this study was approved by the institutional review board of the Medical University of South Carolina.
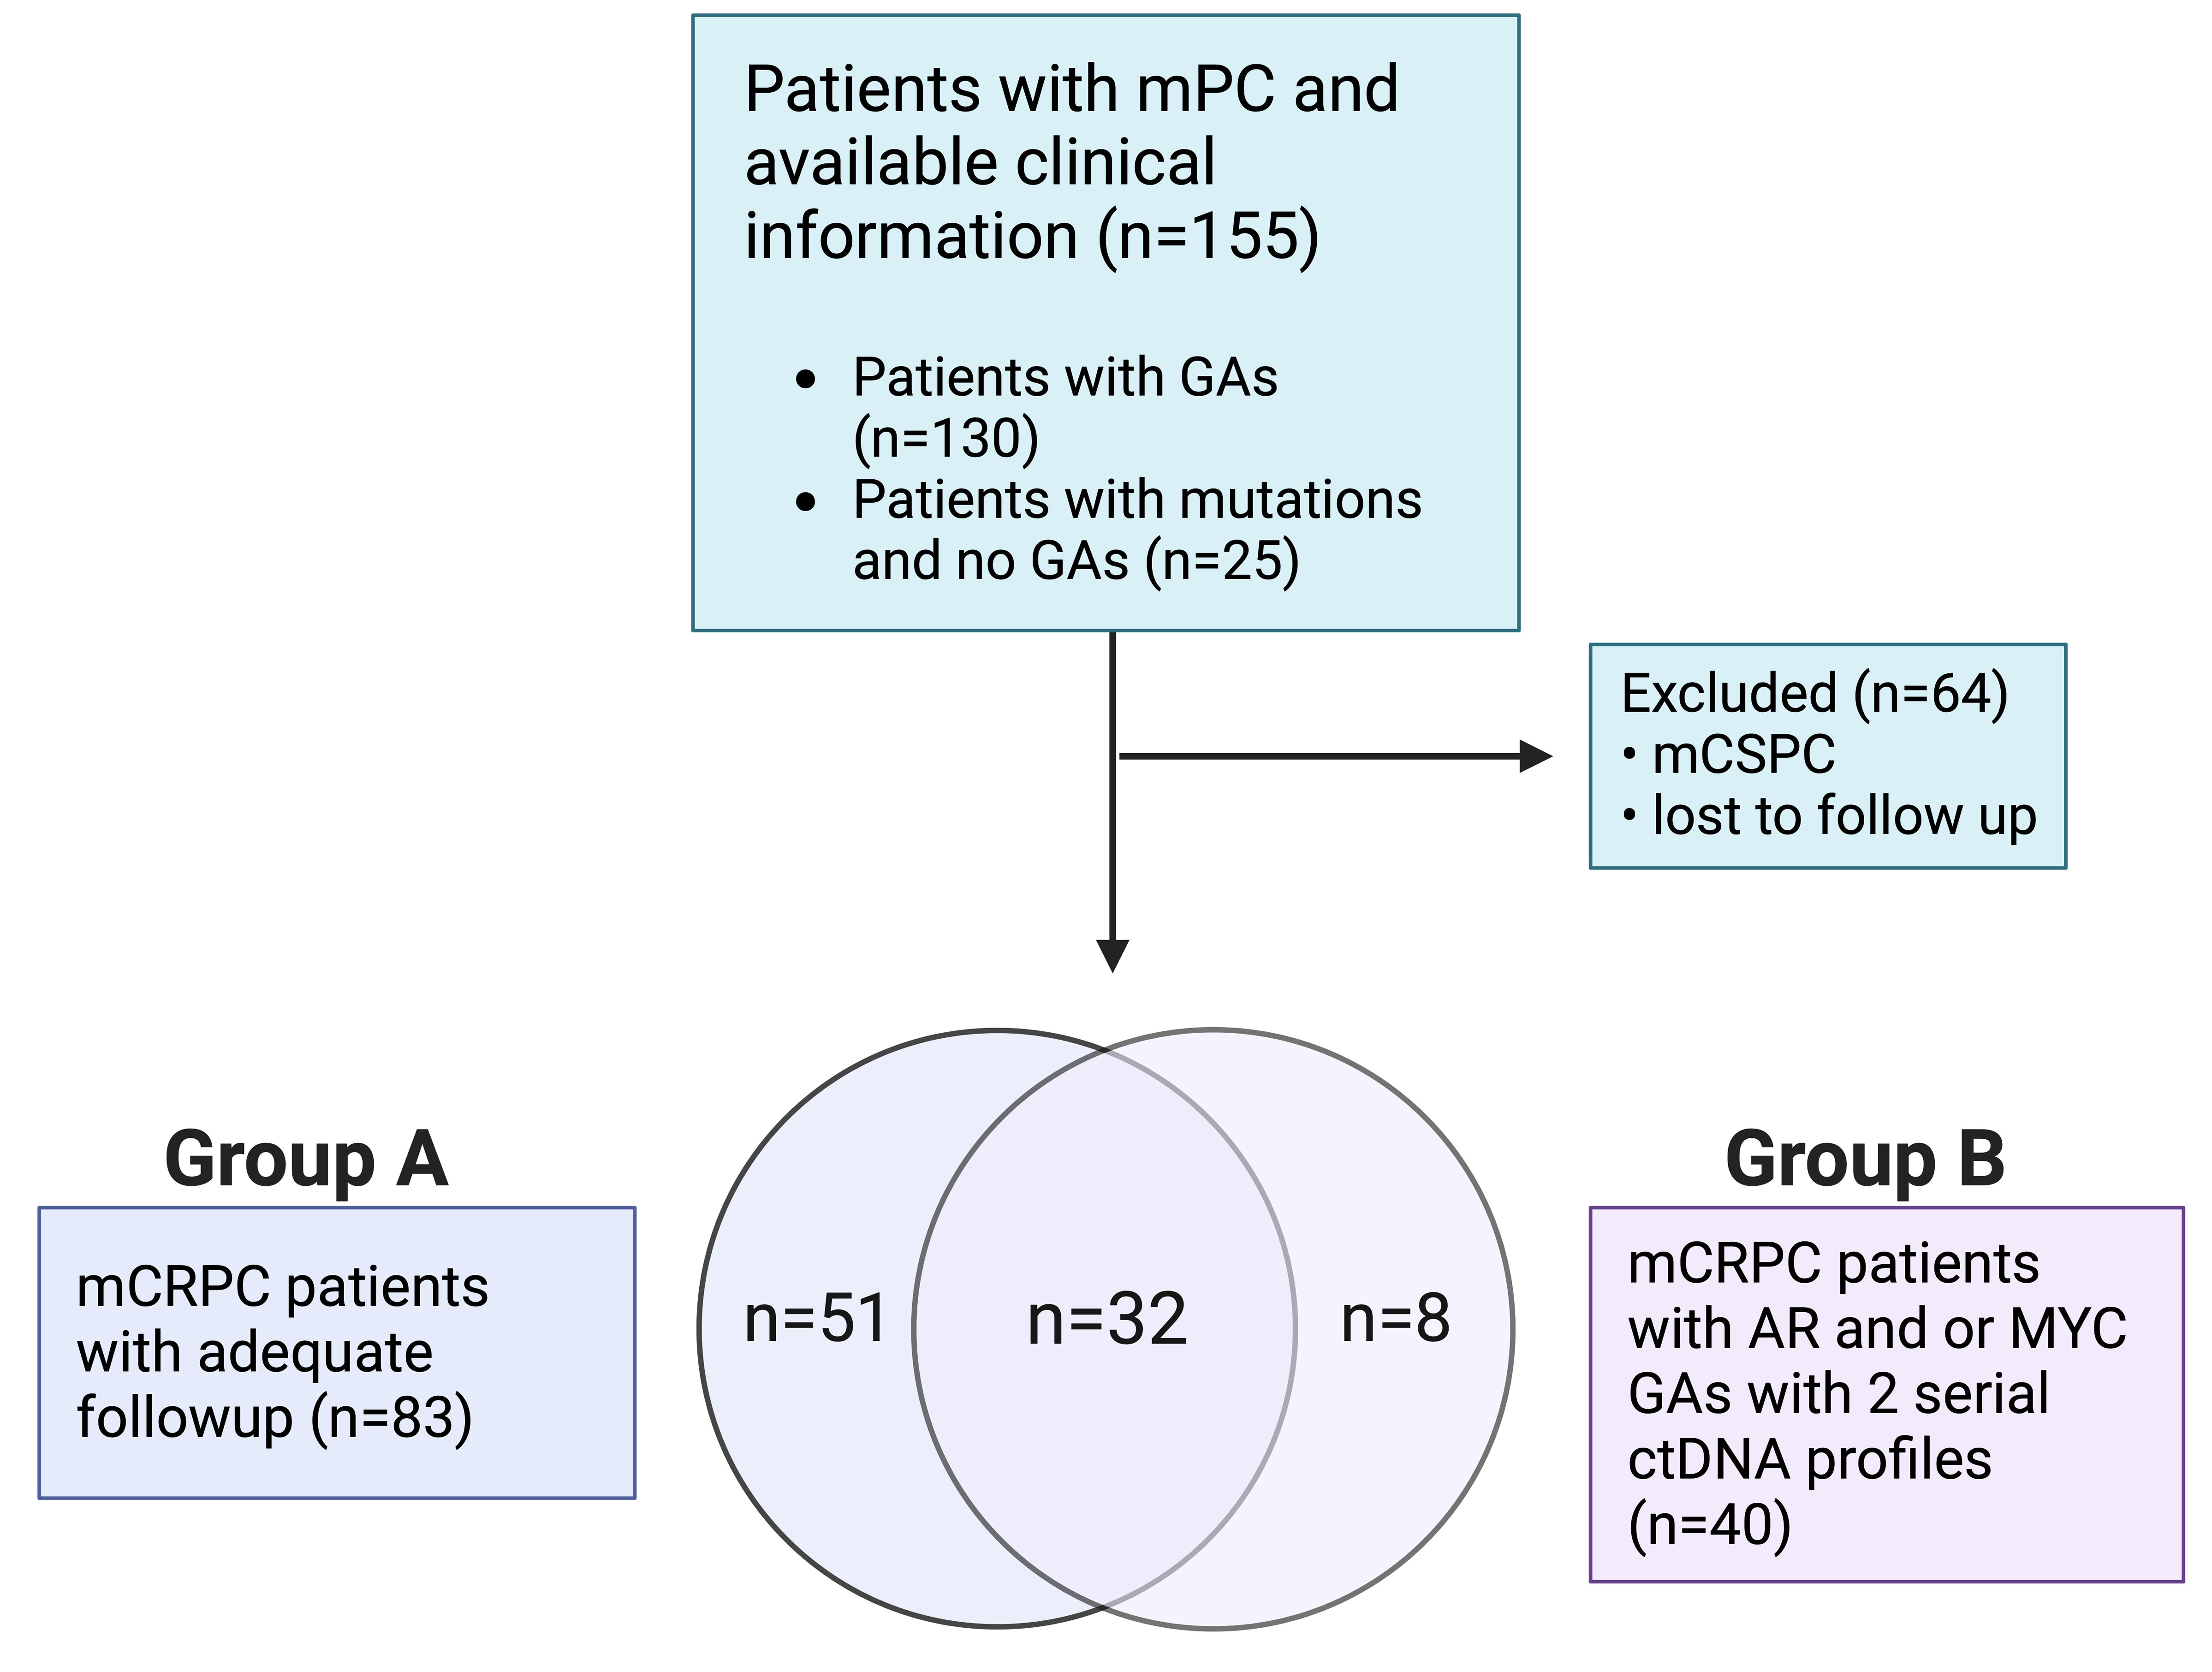
Figure 1 Retrospective study design flowchart.
ctDNA profiling
Blood samples for subsequent ctDNA analysis were collected from patients at scheduled clinic visits as part of their routine care. Next-generation sequencing (NGS) of plasma ctDNA (i.e., liquid biopsy) was completed as previously described by Guardant Health (Guardant360®), a College of American Pathologists (CAP)-accredited and Clinical Laboratory Improvement Amendments (CLIA)-certified laboratory (21). Briefly, cfDNA was extracted from whole blood collected in 10-mL Streck® tubes using the QIAmp Circulating Nucleic Acid Kit (Qiagen, Inc). Hybrid-capture sequencing libraries were prepared for up to 30ng cfDNA and labeled with non-random oligonucleotide barcodes (IDT, Inc.), followed by library preparation, hybrid capture enrichment (Agilent Technologies, Inc.), and sequencing at 15,000X read depth of the critical exons in the targeted panel by paired-end synthesis (NextSeq 500 and/or HiSeq 2500, Illumina, Inc.). Bioinformatics analysis and variant detection were performed as previously described (22). NGS data were interpreted by N-of-One, Inc. (Lexington, MA). Over the course of the study, the panel composition expanded from 68 to 70 to 73 to 74 genes. In the 68-gene panel, coverage of gene amplifications included 16 genes. The 74-gene panel includes coverage of 18 gene amplifications. Most samples in this study were tested using the 74-gene panel. All gene amplifications analyzed for this study were sufficiently covered by all iterations of the Guardant ctDNA assay during the study period.
Statistical analyses
Descriptive statistics were used to summarize all baseline patient characteristics, frequency of GAs, and missense/frameshift mutation frequencies. Chi-square analyses and Odds Ratios were used to evaluate for associations between select clinical factors and GAs. The Kaplan-Meier method was used to estimate OS and FFS outcomes in patients with mCRPC from the time points indicated to either the end of the study (OS), final administration of treatment (FFS), or death (OS, FFS). Survival analyses for patients in Group A were stratified by the presence of one or more than one GA at the time of initial GA detection. Univariable Cox proportional hazards regression was used to identify associations of clinical variables and GAs with OS and FFS. These clinical variables included age, race, metastases at the time of diagnosis, PSA, Hgb, ECOG performance status, metastatic sites, therapy administered prior to ctDNA profiling, and select GAs. Systemic therapies evaluated included abiraterone, enzalutamide, docetaxel, cabazitaxel, carboplatin, sipuleucel-T, and radium-223 in which a p-value less than or equal to 0.2 was used as the initial variable selection criteria. Then multivariable Cox regression models were fit in which a forward variable selection approach was used to generate the final clinical factors which have significant impact on outcomes. Patients in Group B were categorized as either having a “Response” or “No Response”. The term “Response” was defined as having a 10% reduction in AR PCN in the ctDNA analysis completed after the initial detection of AR amplification. If these variables remained the same or increased, patients were categorized as having “No Response”. Statistical tests were 2-sided with significance defined as p≤ 0.05.
Results
Study design and patient characteristics
Among mPC patients seen at our institution, a total of 130 out of 155 tested patients had at least one GA (Figure 1). Baseline clinical variables of the study-eligible patient population are detailed in Table 1 and are reflective of the time of ctDNA analysis and initial GA detection. The median age was 71 years (range 46-91 years), and 36.8% of patients were African American. Almost three-quarters of patients (72.9%) had a Gleason score of 7-10, and the median PSA was 46.2 ng/ml (range 0.1-6000 ng/ml). Nearly half of the patients had metastasis at diagnosis (42.6%). Most patients had mCRPC (87.1%). Select systemic therapies included the androgen axis-targeting drugs abiraterone (47.1%) and enzalutamide (43.9%) and chemotherapy such as docetaxel (44.5%), cabazitaxel (22.6%), and carboplatin (14.2%). Of note, carboplatin was administered in combination with either docetaxel or cabazitaxel and not as a single agent. Sipuleucel-T and Radium-223 were also administered in 15.5% and 10.3% of patients, respectively.
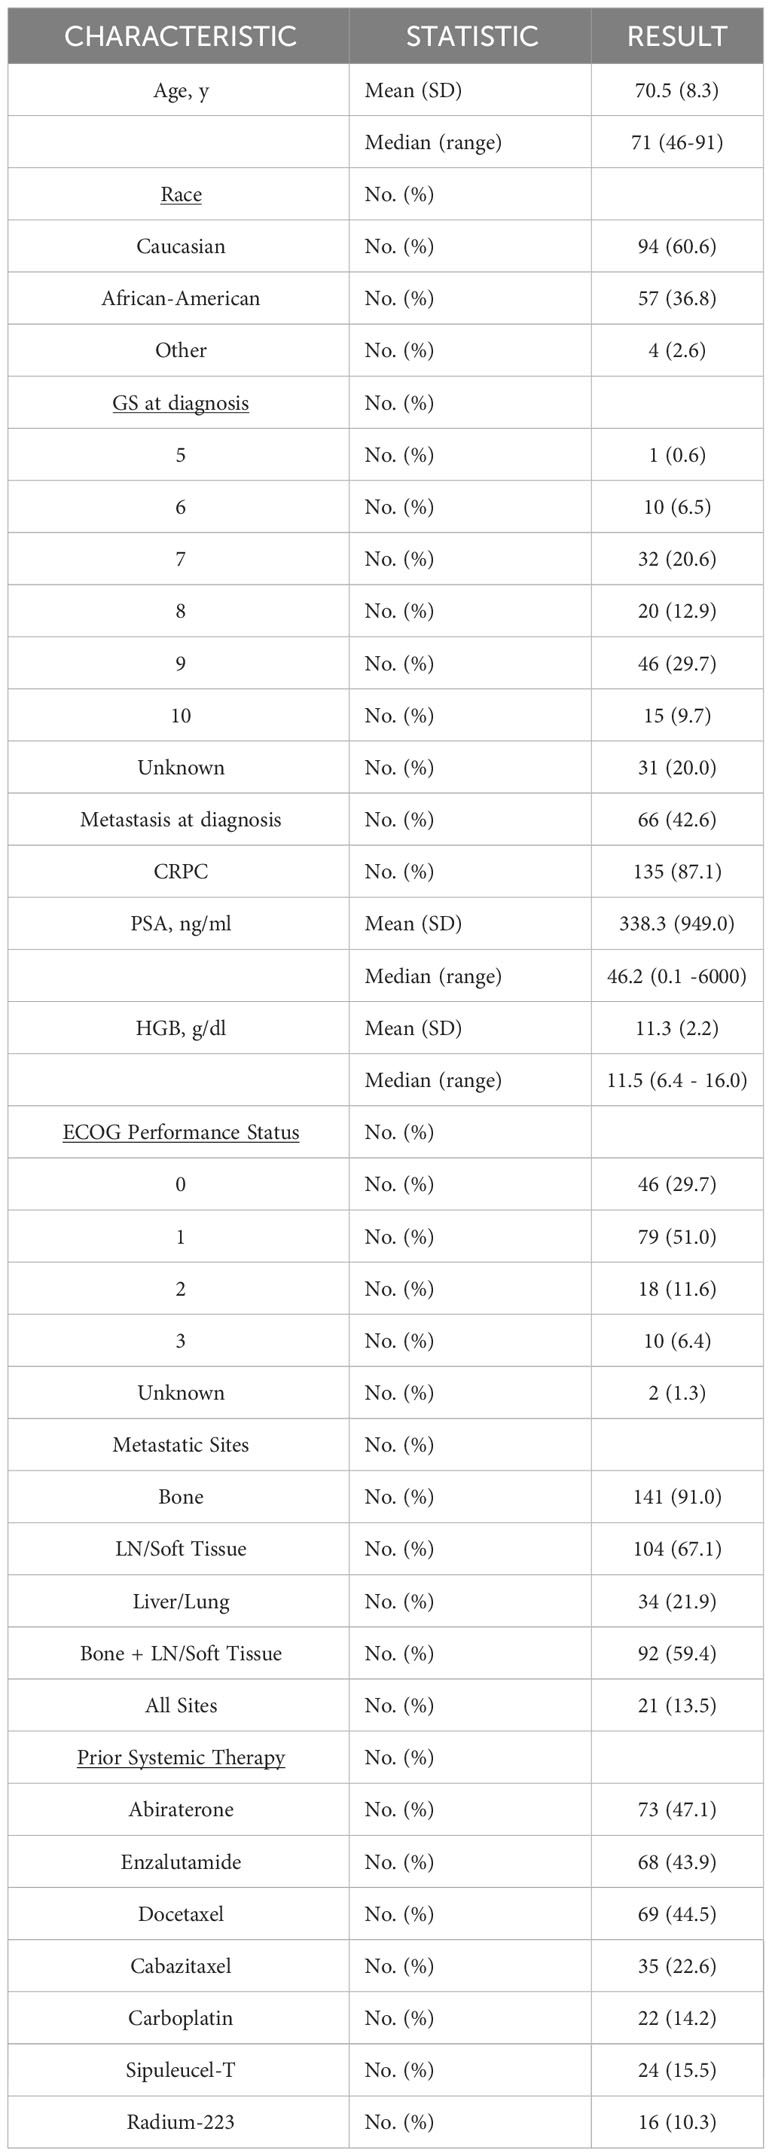
Table 1 Baseline characteristics of the mPC cohort.
Association between certain GAs and visceral metastases
At the time of initial detection of at least one GA, the most frequently occurring GA was in AR (Figure 2A; 59.2%), followed by MYC (29.2%), BRAF (27.7%), CDK6 (22.3%), PIK3CA (21.5%), and MET (20.0%). Given the relative genomic positions of BRAF (7q34), CDK6 (7q21.2), and MET (7q31.2) genes on chromosome 7, these GAs frequently co-occur. For instance, 69% of CDK6 GAs co-occur with BRAF GAs, and 88.5% of MET GAs co-occur with BRAF and/or CDK6 GAs. Of the GAs, AR had the largest range in plasma copy number (PCN) (1.2 – 35.4), but a median PCN of 2.03 (Figure 2B). Of all other identified GAs occurring in at least 10% of patients, the median PCN ranged from 2.37 (RAF1) to 2.87 (FGFR1) (Figure 2B).
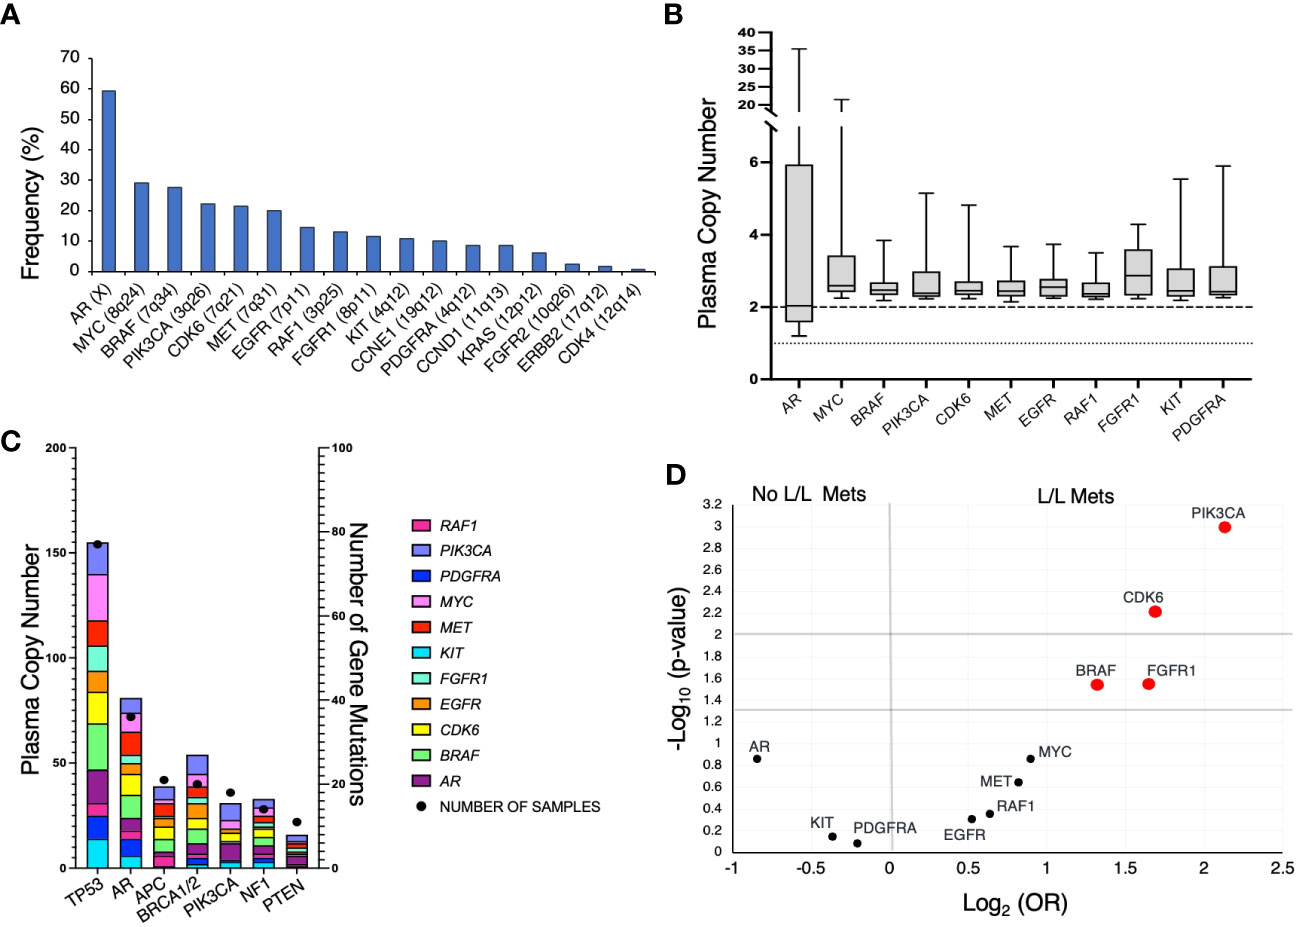
Figure 2 (A) Frequency of genomic amplifications (GAs) in our mPC cohort at time of initial identification of increased gene plasma copy number. (B) Distribution of PCN in GAs present in at least 10% of patients. Dotted line represent PCN of 1 to illustrate baseline for AR and dashed line at PCN of 2 to represent baseline for all described other genes. (C) Frequency of mutations and co-occurring GAs. X-axis represents the commonly occurring mutations in cohort A, left Y-axis represents the frequency of GAs, and right Y-axis represents the number of samples that harbored the specified gene mutation listed on X-axis. (D) Volcano plot depicting GAs present in at least 10% of patients and association with liver/lung metastases (L/L Mets).
We also evaluated the frequency of GAs co-occurring with select mutations. TP53 was the most frequently mutated gene (Figure 2C). Interestingly, despite AR amplification being the most frequently occurring GA, patients harboring TP53 mutations had a greater frequency of concurrent MYC and BRAF amplifications. Furthermore, patients with mPC with APC mutations rarely had the two most frequently occurring GAs, AR and MYC.
In patients with mPC, liver and/or lung metastases are associated with poorer prognosis and may be indicative of more aggressive mPC subtypes such as neuroendocrine prostate cancer (NEPC) (19, 23). We evaluated whether GAs that occurred in at least 10% of patients were associated with the incidence of liver/lung metastases present at the time of initial GA detection (Figure 2D). Liver/lung metastases were found to be significantly associated with amplification of BRAF (OR 2.51, 95%CI 1.09 – 5.81), CDK6 (OR 3.23, 95%CI 1.36 – 7.93), PIK3CA (OR 4.37, 95%CI 1.79 – 10.67), and FGFR1 (OR 3.13, 95%CI 1.1 – 8.95). CDK6 is frequently co-amplified with BRAF, given the relative proximity of its genomic position. Thirty-three percent of patients with CDK6 GA without co-occurring BRAF GA had liver/lung metastases.
Increased number of GAs associated with patient survival
From patients in this cohort, we then identified 83 patients with mCRPC and clinically evaluable complete treatment records (Group A, Figure 1). Patients were stratified by whether they had no GAs, one GA, or two or more GAs at the time of ctDNA analysis. There was no statistically significant difference in the mean number of therapies prior to ctDNA analysis amongst these three stratified groups. This analysis demonstrated that patients with two or more identifiable GAs had a poorer OS from the time of initial GA detection than those with only one GA. Median OS was not reached for patients with no GAs, was 16.4 months for patients with only one GA, and 9.4 months for patients with ≥2 GAs (Figure 3). Survival analysis was extended to include OS and FFS from the date of systemic treatment initiation nearest to the date of ctDNA analysis. OS and FFS were poorer in patients with ≥2 GAs than in those with only one or no GA. Median OS in patients with one GA was almost double that in patients with ≥2 GAs (16.7 vs. 9.0 months; p-value < 0.001) (Figure 4A). Median OS in patients with no GAs was not reached at the time of analysis. Median FFS was significantly different when comparing patients with 1 (4.3 months), or with ≥2 GAs (3.3 months), to patients with no GAs (median OS not reached, p-value < 0.001) (Figure 4B).
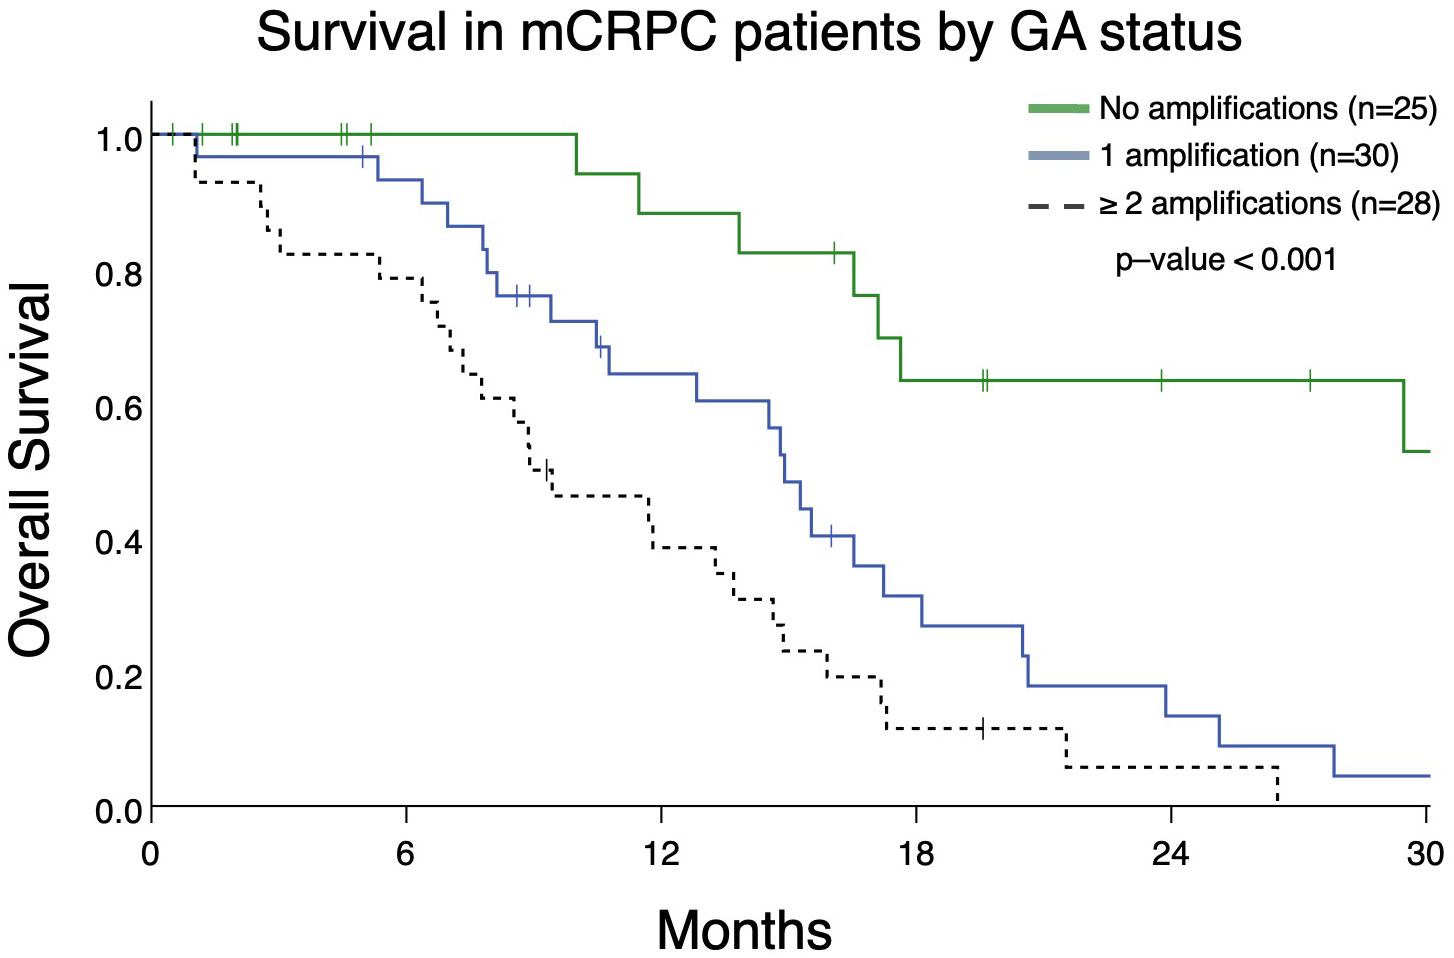
Figure 3 Overall survival in patients with mCRPC (Group A) from the date of initial detection by ctDNA assay in patients with no GAs, only 1 GA, or with ≥ 2 GAs. Patients with no GAs had greater survival (median survival not reached) compared to only 1 GA (median survival 14.9 months) or ≥ 2 GAs (median survival 8.9 months; p<0.001).
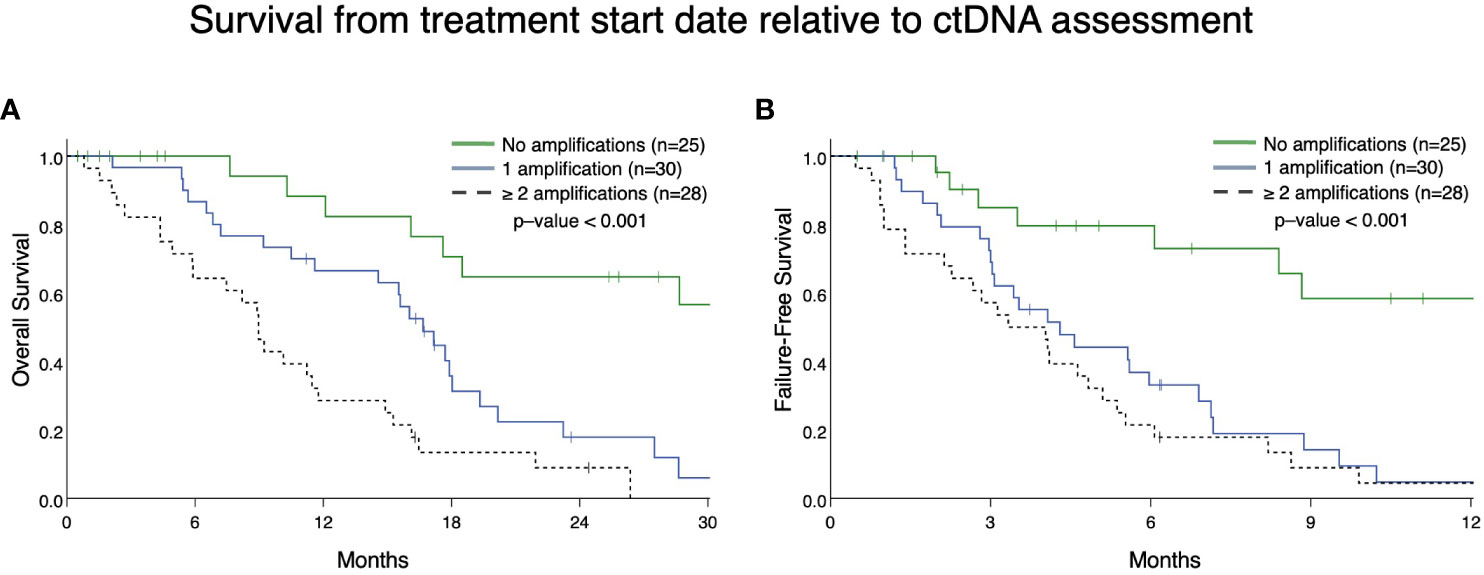
Figure 4 Overall survival (A) and failure-free survival (B) in Group A from the date of the nearest systemic therapy initialization. (A) Patients with mCRPC with ≥ 2 GAs had reduced survival (median survival in patients with one GA was 16.7 months vs. 9.0 months in patients with ≥ 2 GAs; p <0.001). Median survival for no GAs was not reached. (B) Patients with mCRPC with 1 or ≥ 2 GAs had reduced failure-free survival (median FFS in patients with one GA was 4.3 months vs. 3.3 months in patients with ≥ 2 GAs; p < 0.001) compared to patients with no GAs (median FFS not reached). There was no statistical difference in FFS between patients with only 1 GA compared to ≥ 2 GAs (p=0.28).
As demonstrated above, the majority of detected GAs were in AR (Figure 2A). Given our prior work demonstrating that presence of an AR GA being associated with worse prognosis (11), we next determined whether AR plus at least one other GA (designated as “AR Plus”) had a difference in OS compared to patients having exclusively an AR GA. Patients with only an AR GA have a significantly better median OS compared to patients with “AR Plus” GAs (19.3 vs 8.9 months; p-value < 0.001) (Figure 5).
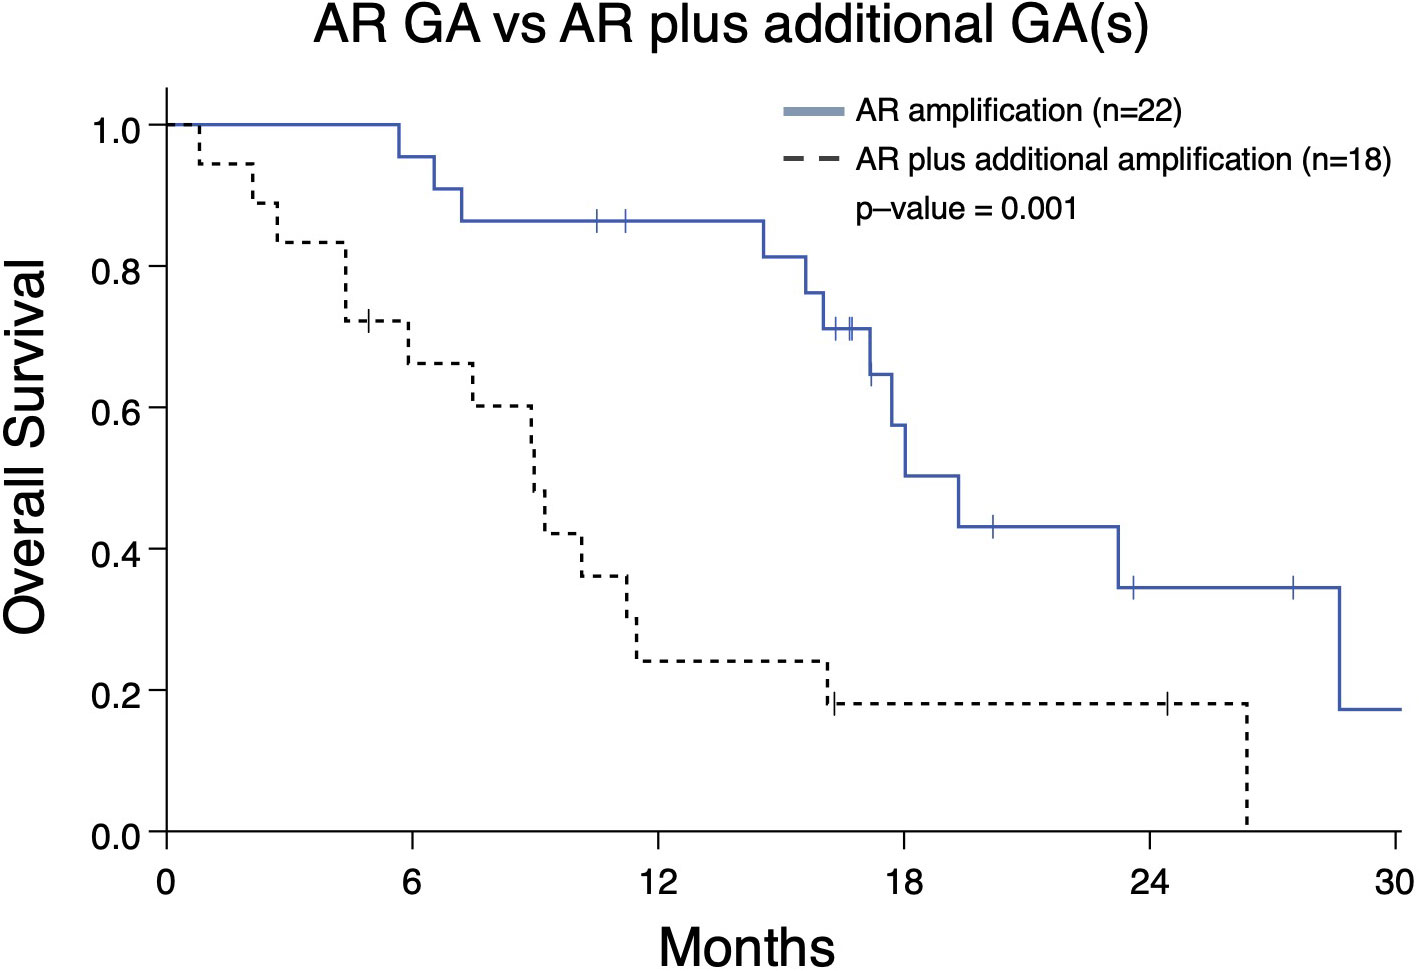
Figure 5 Overall survival in mCRPC patients (Group A) from the date of the nearest systemic therapy initialization with that have either an AR genomic amplification (GA) only vs patients with an AR GA as well as at least one additional GA in another gene. Patients with AR GA only had greater median survival (19.3 months) compared to patients with AR GA plus at least one GA (median survival 8.9 months; p=0.001).
Cox regression univariate analysis of group A patients indicates that reduced OS may be present with amplifications in MYC, BRAF, PIK3CA, CDK6, MET2, EGFR, and RAF1 (Table 2). However, when adjusted for significant covariates in a multivariate analysis, genomic amplification of PIK3CA remains significantly associated with worse survival in the final model (Table 2). Consistent with the Kaplan-Meier survival analysis, patients with one GA (HR 3.84 [1.45 – 10.16], p-value <0.01) and ≥2 GAs (HR 7.15 [2.50 – 20.46], p-value <0.001) were also significant in the final multivariate regression model as well. PIK3CA is associated with worse FFS in multivariate analysis as well (Table 3). Abiraterone prior to ctDNA analysis was shown to be prognostic for FFS (Table 3).
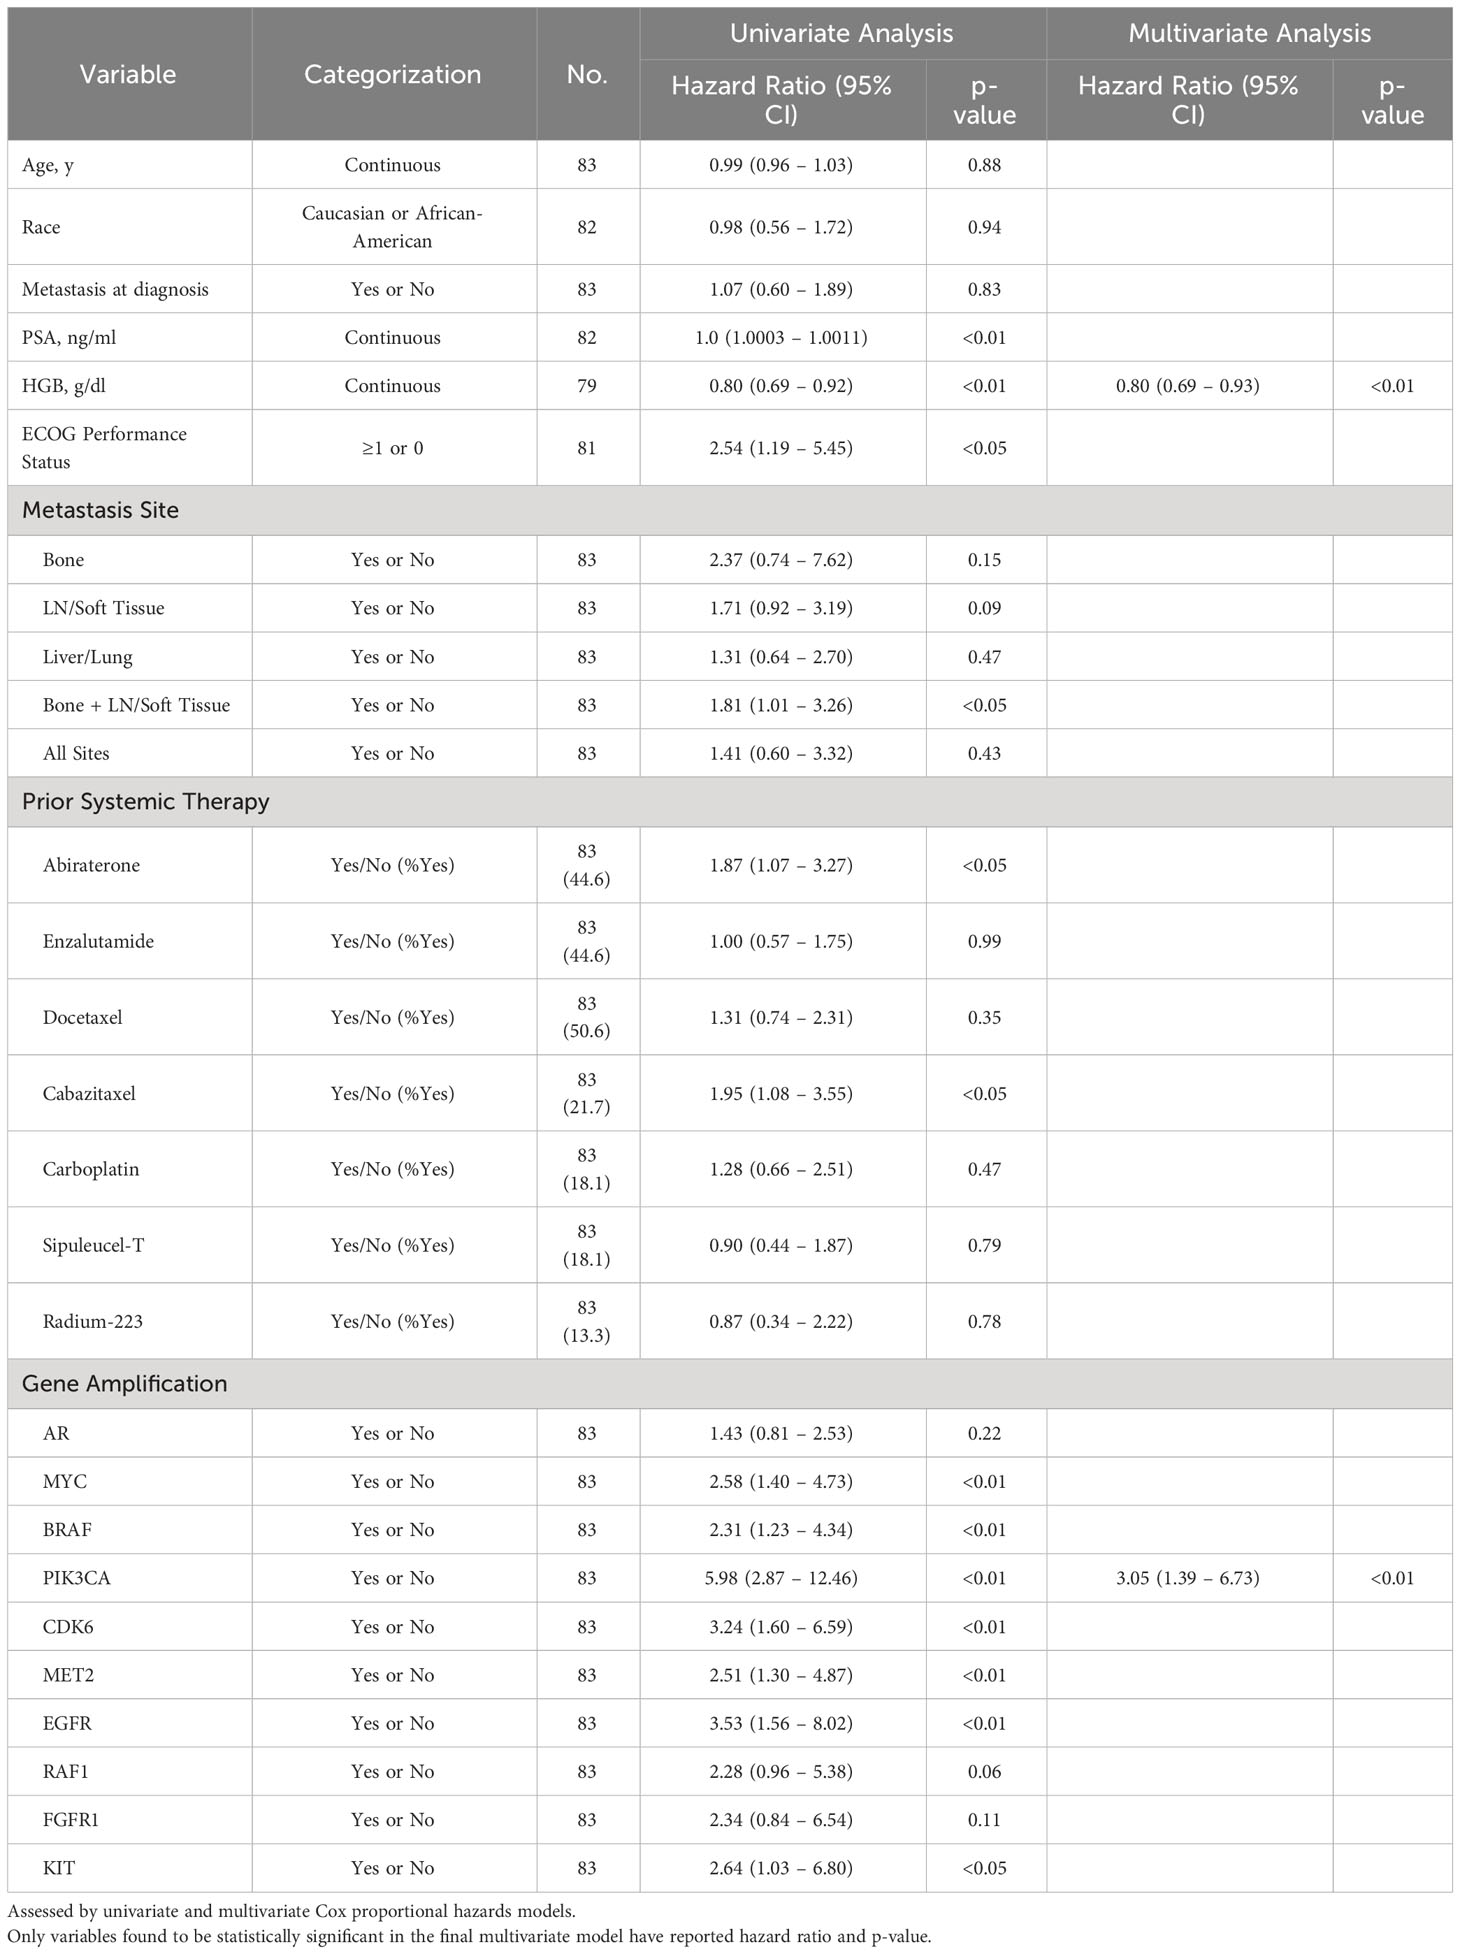
Table 2 Association of select variables in Group A with overall survival as determined by date of systemic treatment initiation nearest to time of ctDNA analysis.
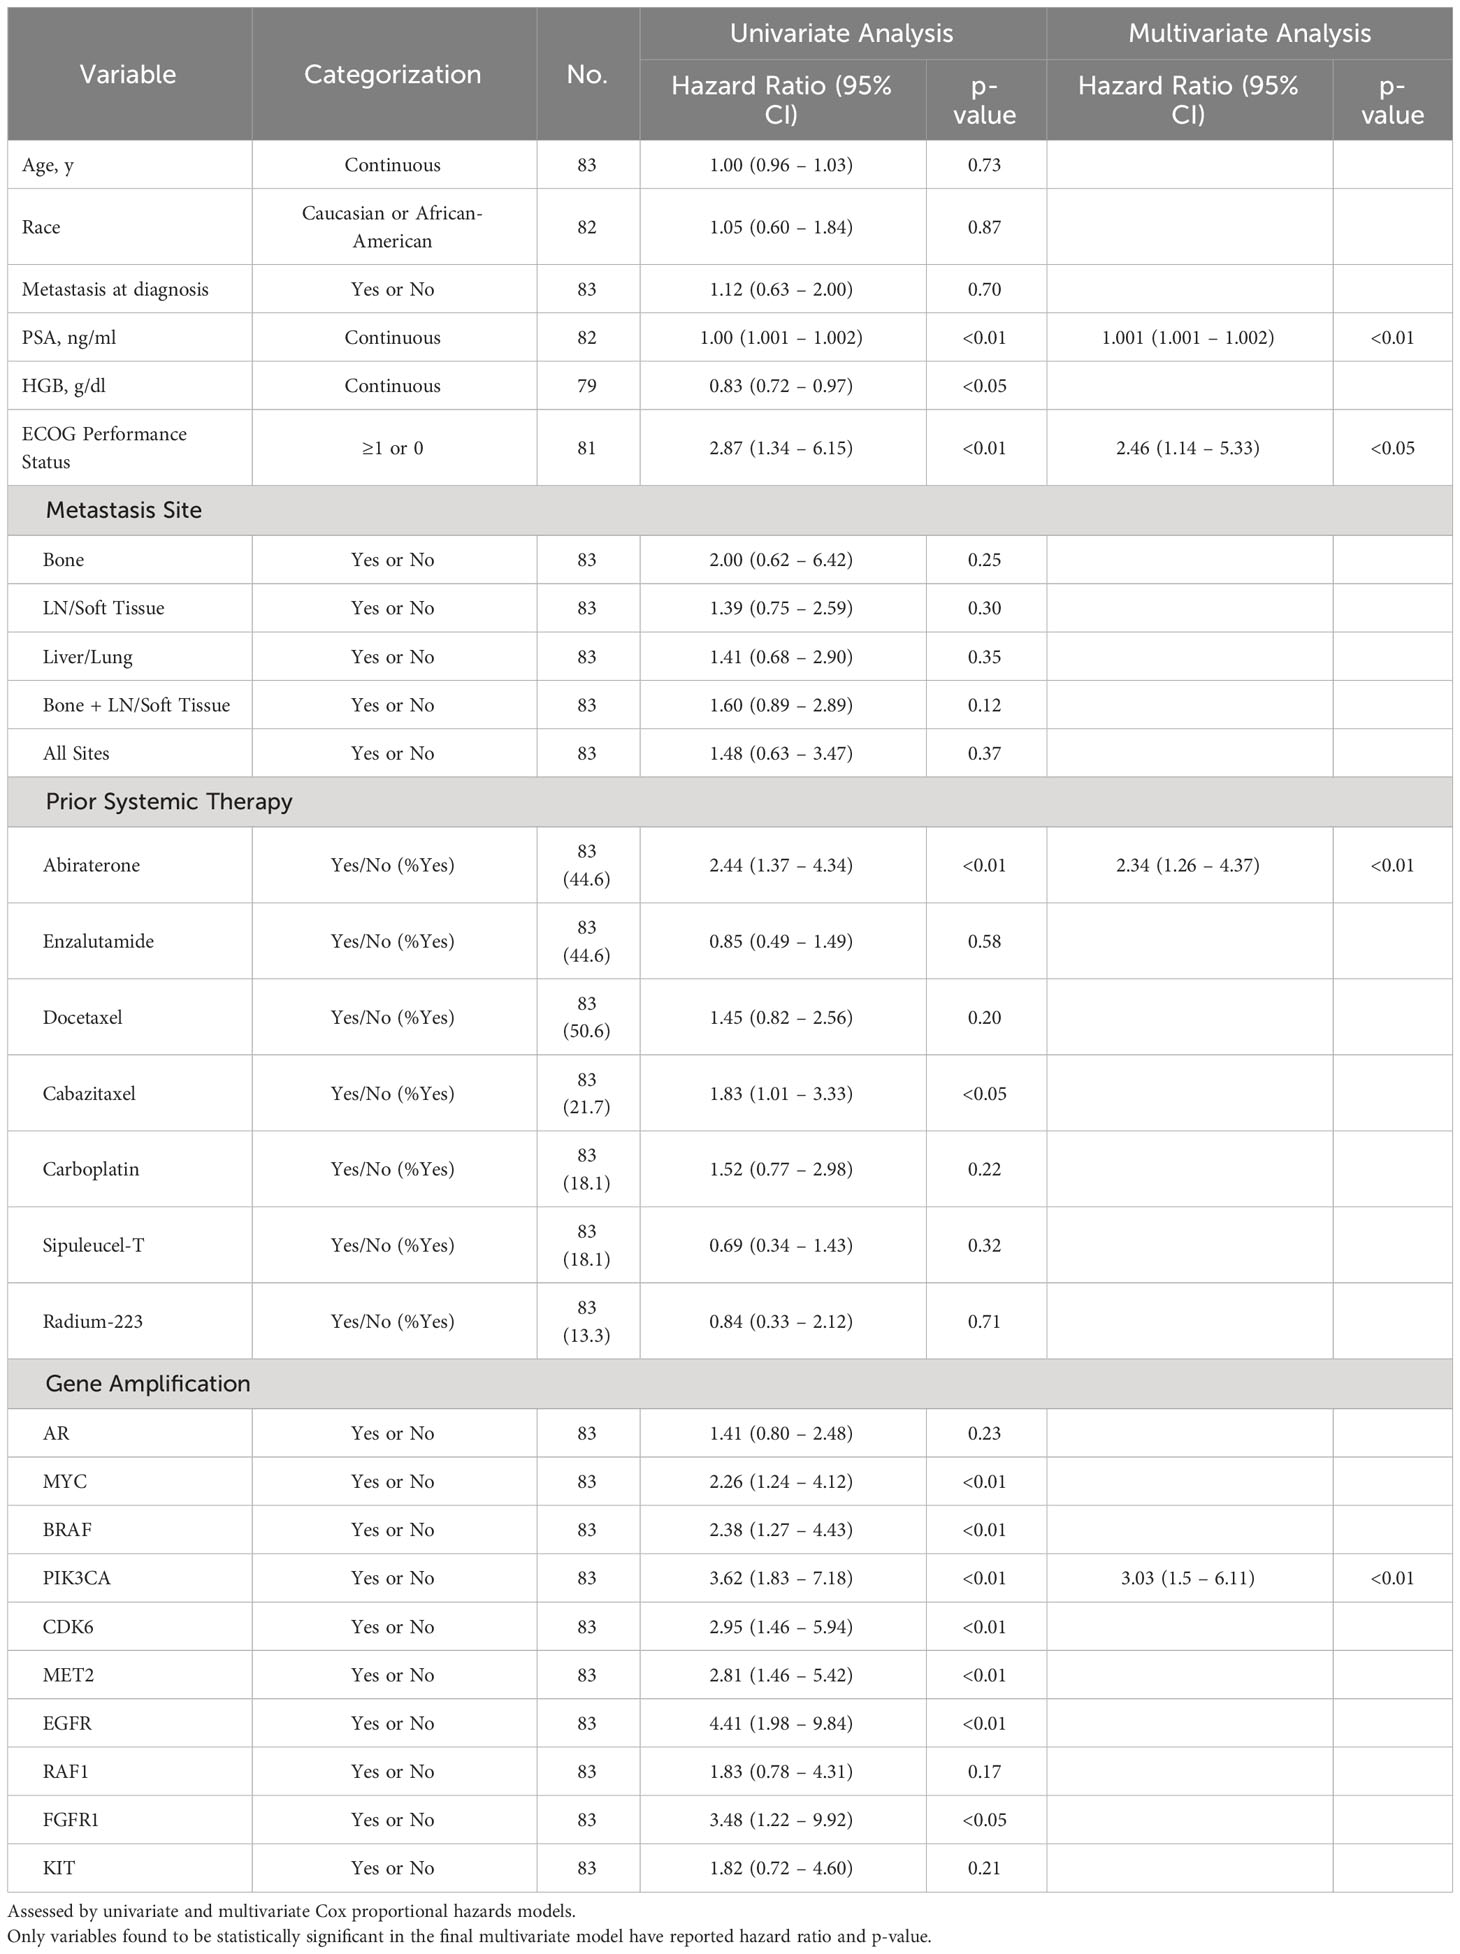
Table 3 Association of select variables in Group A with Failure-Free Survival as determined by date of systemic treatment initiation nearest to time of ctDNA analysis.
In light of PIK3CA GA association with increased liver and lung metastases (Figure 2D) and association with worse OS and FFS in multivariate analysis (Tables 2, 3), we determined the impact of a PIK3CA amplification on OS when compared to patients with GAs (regardless of number) without PIK3CA amplification (Figure 6). mCRPC patients that have at least one GA but lack any PIK3CA GA was associated with better OS compared to patients whose disease harbors a PIK3CA GA (16.0 vs 5.9 months; p-value < 0.001) (Figure 6). It is worth noting that a majority of patients with PIK3CA GA in this group did have at least one other GA as well (data not shown).
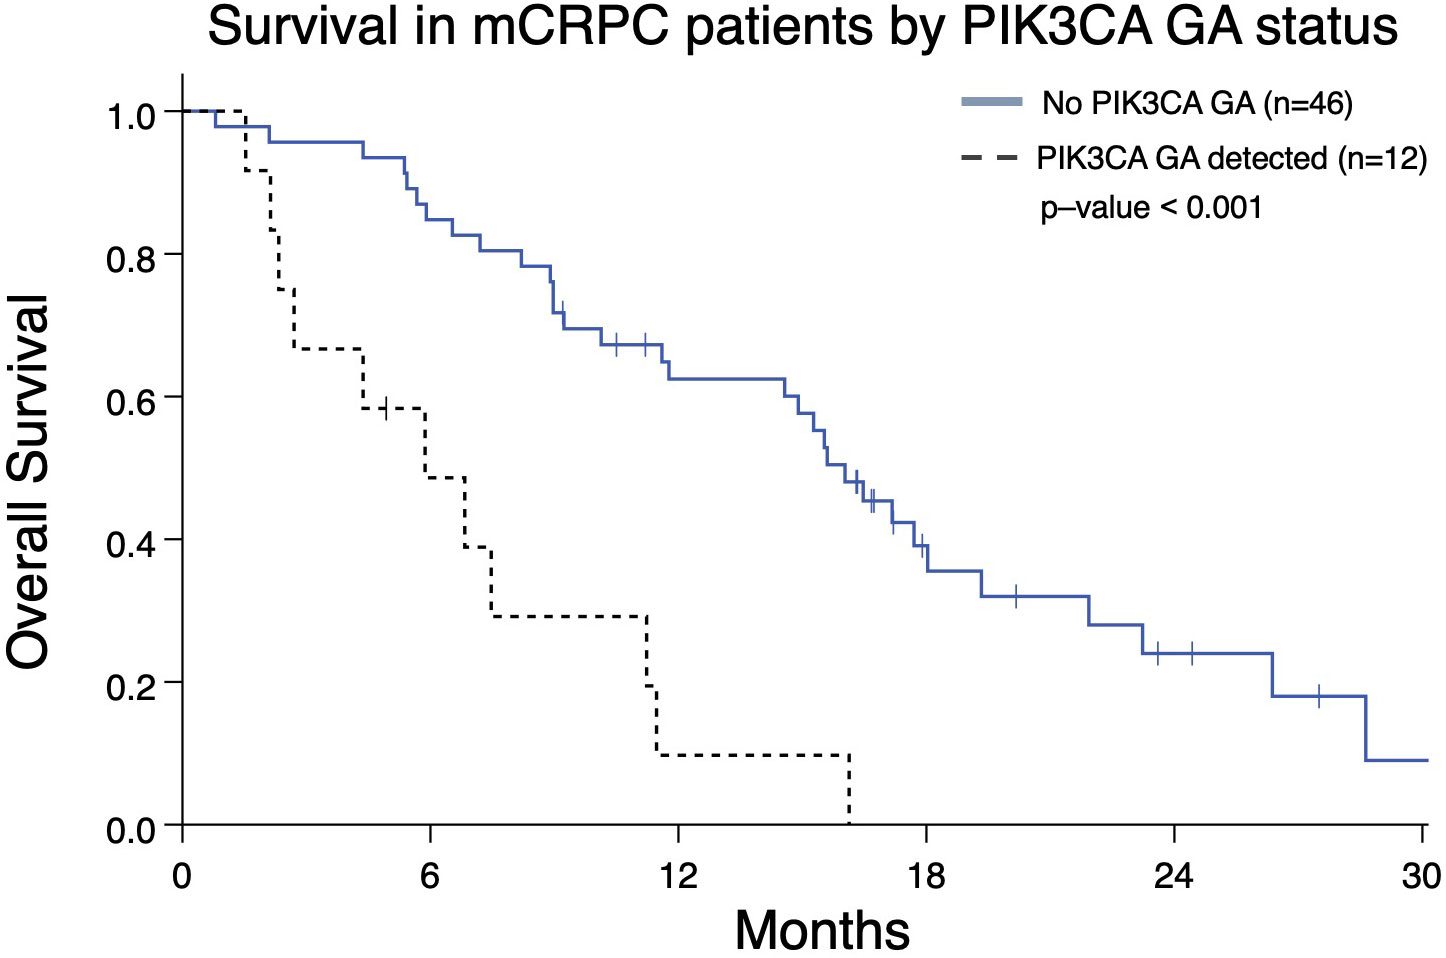
Figure 6 Overall survival from the date of the nearest systemic therapy initialization in Group A patients with mCRPC who have at least one GA (n=58) and either also have or lack a PIK3CA GA as well. Patients without PIK3CA GA have greater median OS (16.0 months) compared to patients with a PIK3CA GA (5.9 months; p < 0.001).
Reduction in AR and/or MYC PCN predicts improved OS
Serial ctDNA profiling permits assessment of PCN changes as they occur during a patient’s treatment course. Therefore, we determined whether changes in PCN in patients with two consecutive ctDNA profiles might be prognostic. Analyzing the two most frequently occurring GAs, we identified patients with mCRPC who had AR and/or MYC GAs with an additional ctDNA profile completed afterwards to gauge PCN change. These patients were categorized as group B (Figure 1). Patients with ≥10% reduction in AR and/or MYC PCN (termed as “Response”) on the second profile had better OS than those with ≤ 10% AR and/or MYC PCN decrease (termed as “No Response”) (median OS, 25.1 months vs. 15.9 months, p = 0.008) (Figure 7).
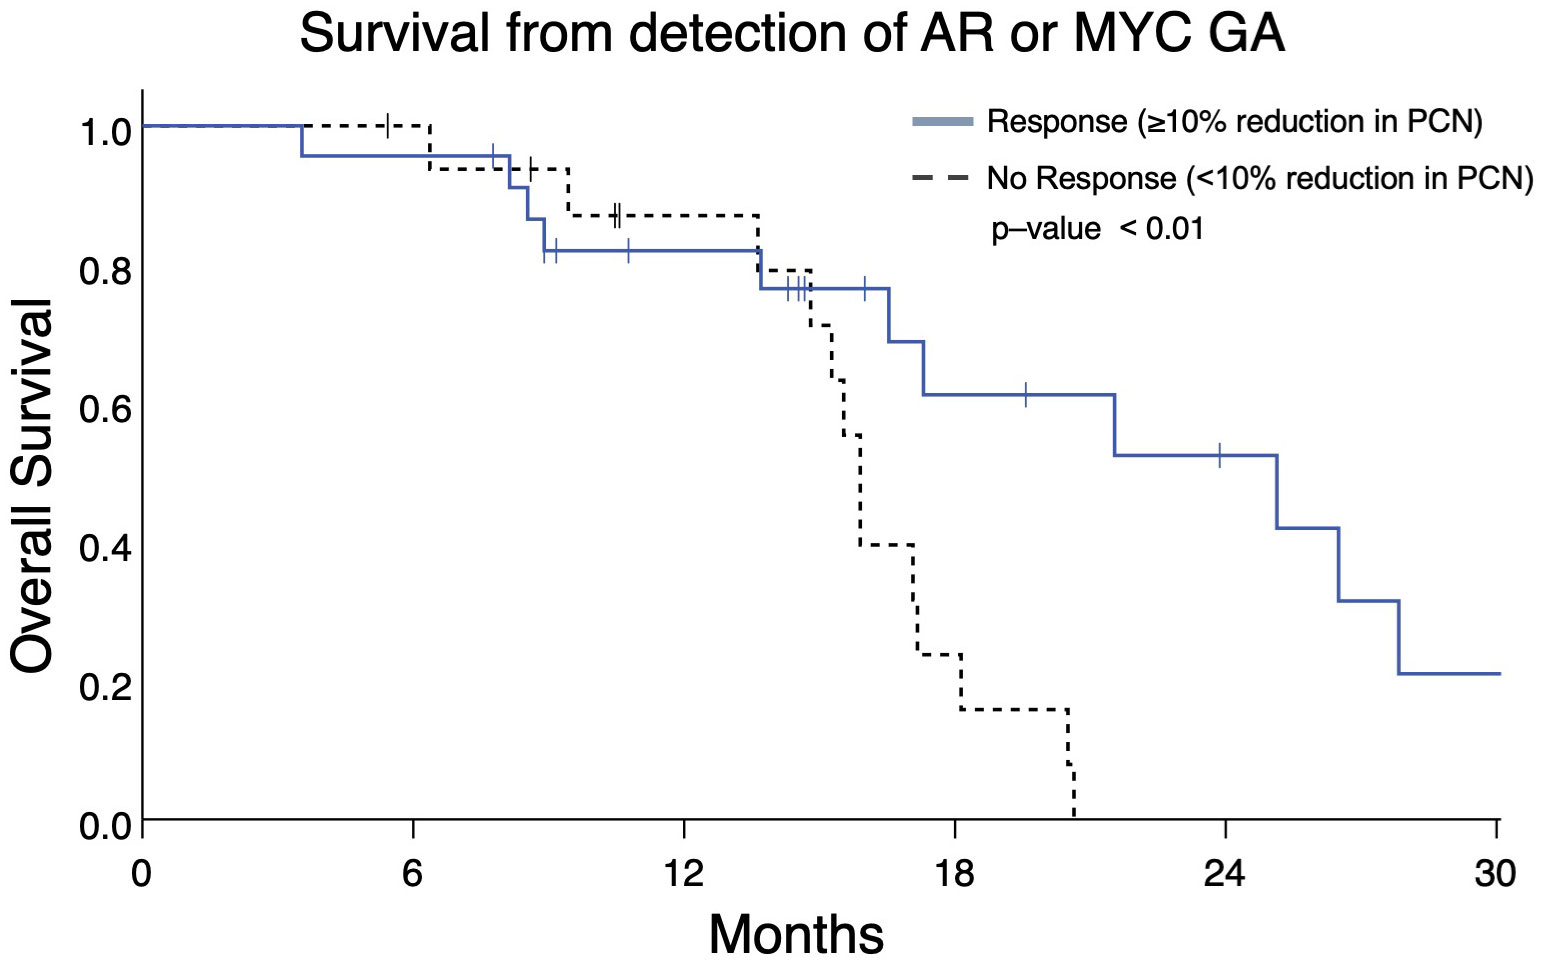
Figure 7 Overall survival in Group B patients with ≥10% reduction in AR and/or MYC PCN (“Response”) following initial gene amplification had longer survival vs patients without PCN reduction (median OS 25.1 months vs 15.9 months, p = 0.008).
The heatmap in Figure 8, which details the GAs identified in group B patients and the treatments those patients underwent prior to each ctDNA analysis, demonstrates PCN reduction following a variety of systemic therapies. Androgen axis-targeting agents such as abiraterone and enzalutamide were associated with detectable AR/MYC PCN reductions in seven out of 40 patients. Taxane-based chemotherapy (with or without carboplatin) resulted in responses in at least 10 patients. Interestingly, two of the responses were in patients who harbored either a BRCA2 (PtID 152) or ATM mutation (PtID 205) and had AR PCN reduction following olaparib administration. In one patient who received Radium-223, MYC PCN was reduced while the PCN of other GAs increased (PtID 69), suggesting that perhaps the predominant subclone that was metastatic to the bone in this patient harbored the MYC GA and therefore had PCN reduction following Radium-223 treatment. One patient with no identifiable AR mutations was observed to have a reduction in the MYC GA-containing subclone following administration of the investigational agent TRC253 (PtID 18). In another patient with an identifiable BRAF mutation and amplification (PtID 35), AR PCN was reduced after administration of trametinib. Overall, a variety of systemic treatments resulted in PCN reduction of the two predominant GAs in this group and were significantly associated with increased survival.
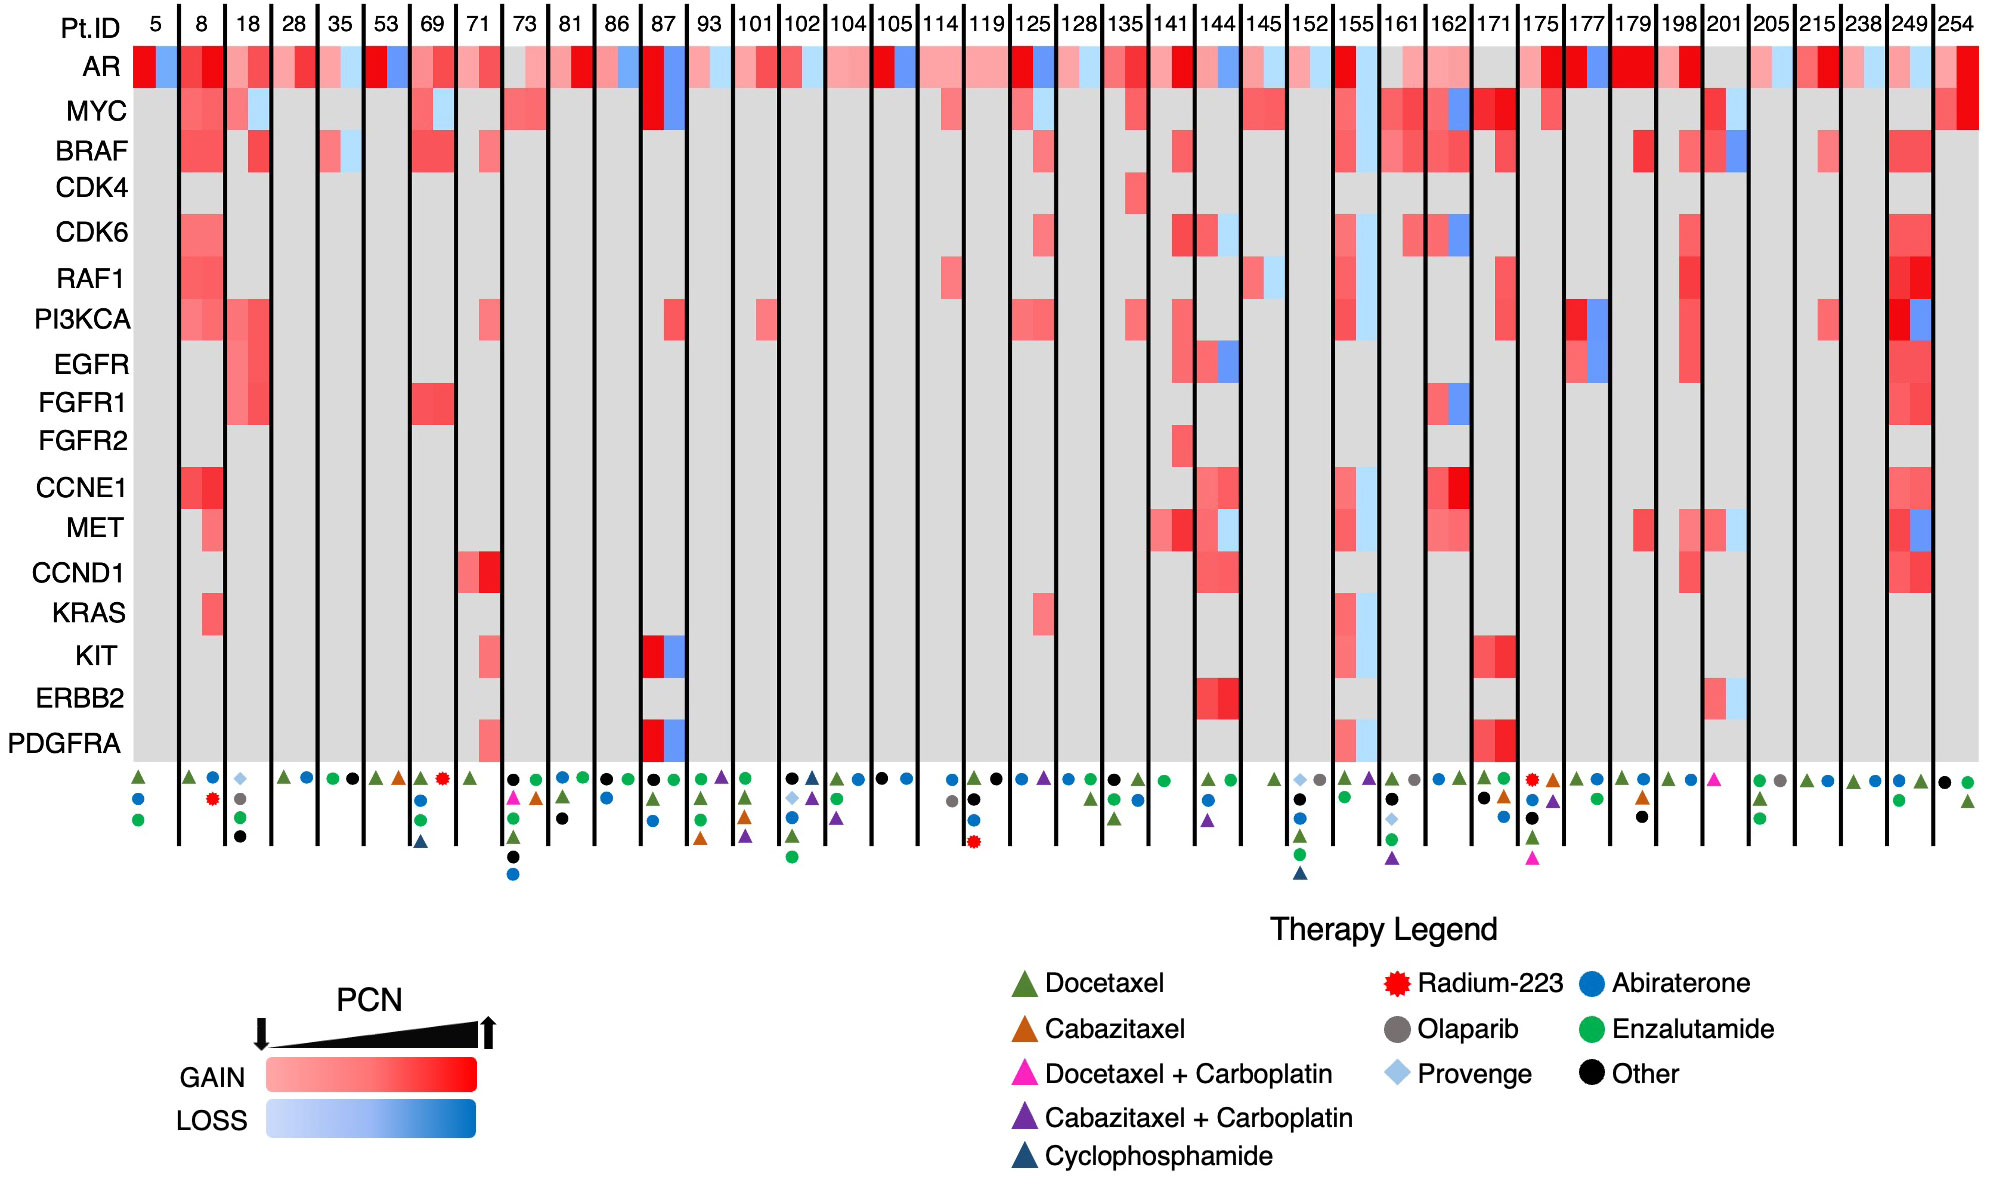
Figure 8 Heatmap of GAs in Group B patients. Each patient had two consecutive ctDNA analyses completed. Two columns are depicted for each patient with the initial AR/MYC detecting ctDNA analysis in the first column and the subsequent analysis in the second column.
Discussion
Circulating tumor DNA analysis is increasingly being used in mPC and its role in decision making is being defined. While many commercially available assays examine the presence of single nucleotide variants, few ctDNA assays report GAs. Our data suggest that clinically useful information may be found in the additional analytes. Furthermore, our findings provide a basis for evaluating ctDNA somatic alterations at diagnosis of metastatic disease and throughout the course of treatment, with an emphasis on identifying GAs and continually assessing changes in their PCN. This paradigm of serial ctDNA analyses might be used not only to guide therapeutic decisions but also inform prognosis and serve as a biomarker of treatment response, complementing known disease markers such as PSA. Of note, prior studies have evaluated early changes of ctDNA across solid tumors and found that patients who achieve ≥50% decrease in their ctDNA ratio early in immunotherapy-based treatment as compared to baseline sampling have a superior PFS and OS advantage compared to patients who do not reach a 50% threshold for decrease (24, 25). While our cohort does contain serial sampling, the timepoints of collection are diverse and are not reflective of an early on-treatment change. Thus, we aimed to demonstrate that any decrease in ctDNA or amplifications in patients with mCRPC, even at a low threshold of 10% reduction, is prognostic of clinical benefit to their therapy.
Previous studies have evaluated the clinical significance of specific mutations and the associations they may have in clonal development and treatment resistance (12–14). Although most patients in prior studies have had detectable co-existing mutations, our study emphasizes evaluation of clinical factors and outcomes in patients stratified based on specific GAs and changes in PCN in prostate cancer. Our approach is supported by the fact that GAs are commonly observed in patients with mPC, particularly when disease is castration-resistant. By identifying specific GAs, ctDNA analysis could prove a valuable management tool for patients seen at various points in their sequential treatment courses.
Inferior outcomes have been associated with alterations in AR, such as coding sequence mutations, splice variants, and amplifications (26). With regard to this study, it is important to note findings regarding presence of the number of GAs and which genes may be amplified are nuanced, and need to be evaluated in context (i.e. whether they co-occur with other GAs). For instance, prior work has demonstrated AR amplification being associated with reduced FFS and OS (11). However, in our study, “AR Plus” patients have worse OS compared to patients exclusively with an AR GA (Figure 5). This demonstrates AR amplification in the presence of other GAs is associated with worse clinical outcomes. In other words, tumor biology in mCRPC may not be as aggressive in a patient with only an AR amplification compared to those whose malignancy has multiple GAs that include AR (such as MYC, BRAF, PIK3CA, and others).
Increased numbers of GAs are seen in patients with TP53 mutations (Figure 2C). This is consistent with TP53 mutations being associated with increased aneuploidy frequency in malignancies (27, 28). Previous studies have identified putative associations and roles for BRAF, PIK3CA, and FGFR1 in mCRPC (17, 29, 30). The association we found between BRAF or PIK3CA GAs, and liver or lung metastases, further prioritizes the need to identify potential treatment options for patients with these GAs (Figure 2D). This also corresponds to reduced OS seen in patients with PIK3CA amplification relative to other patients with GAs (Table 2 and Figure 6). A recent report from our group demonstrated CEA elevation is associated with a number of amplifications including PIK3CA (19). However, this was not associated with aggressive variant prostate cancer phenotype (19). Further evaluation regarding the biological input of PIK3CA amplification is needed.
Our study identified a high frequency of BRAF amplifications compared to the TCGA database. We feel this reflects the advanced disease of the subjects evaluated in this study. As multiple genes are co-amplified with BRAF such as CDK6, EGFR, and MET (also located on chromosome 7), this gives confidence that we are in fact detecting true BRAF amplifications. Related to this, we found that CDK6 amplification was significantly associated with liver/lung metastases; however, it remains to be seen whether this association reveals a significant biological role for CDK6 in disease pathogenesis or treatment. Finally, we observed an association between FGFR1 amplification and liver/lung metastases (Figure 2D). Pre-clinical studies have demonstrated that FGFR1 is involved in prostate cancer progression and has a role in the metabolic reprogramming of prostate cancer cells (29, 30).
Serial ctDNA analyses revealed the emergence of GAs in multiple patients following systemic therapy (Figure 8, PtID’s 71, 101, 114, 135, and 175). In fact, some patients developed new GAs even after a reduction in AR and/or MYC PCN (i.e. PtID’s 18, 69, 87, and 125). The latter phenomenon is likely reflective of tumor heterogeneity, with certain clones/subclones sensitive to treatment resulting in PCN reduction, while new subclones then emerge that are resistant to treatment. In the copy number analysis performed on the STAMPEDE patient cohort, sequencing was performed on multiple regions of the same prostate tumor, and intratumoral differences in GA burden, indicating increased heterogeneity, was associated with increased metastatic potential (18).
This study has a number of limitations. It is a single-institution retrospective study intended to be hypothesis-generating in nature and as such does not capture the breadth of geographic differences in patient clinical accessibility, outcomes, and provider bias for ctDNA testing and treatment recommendations. Furthermore, this study had a modest sample size and does not represent the full extent of tumor genomic heterogeneity among patients. Although 155 patients with mPC were evaluated in this cohort, the survival analysis was limited to the 91 subjects in Group A and Group B, (Figure 1), who had mCRPC and adequate treatment records for the entire disease course (Figures 3, 4, 7). Provider bias in the use or sequencing of abiraterone could have affected our finding that it was prognostic for FFS. Although the gene panel used in this study is meant to capture a wide variety of somatic alterations relevant to numerous malignancies, it evaluates a modest number of genes, ranging from 68-74. With regard to mPC, this panel did not evaluate somatic alterations such as AR variant 7 splice site changes, SPOP mutations, and PTEN loss (31, 32). Therefore, these are beyond the scope of this study. Moreover, in the analysis completed in group B, there is variability among patients in the timing between ctDNA analyses. This variability also extends to the timing and variety of systemic treatments administered prior to initial AR/MYC GA detection and between ctDNA analyses. Future work in controlled trial formats should investigate PCN changes in relevant GAs.
Nonetheless, this study provides significant support for the wider use of ctDNA evaluation to guide prognosis and mPC treatment selection. Additionally, it reinforces the role for serial monitoring of ctDNA to characterize changes in GAs and other somatic alterations. Ultimately, this raises the question whether ctDNA information should be incorporated into decision making regarding early treatment options. For instance, should mPC patients receive more aggressive initial systemic therapy such as the addition of docetaxel to ADT plus androgen axis targeting therapies (i.e. darolutamide or abiraterone as per the ARASENS or PEACE-1 studies) if they harbor GAs that are linked to increased likelihood of visceral metastases (33, 34)? Ongoing prospective clinical studies are evaluating the impact of pretreatment ctDNA evaluation on therapeutic decisions and clinical outcomes in metastatic disease. Additionally, it remains unknown whether specific amplifications are associated with increased expression of their respective gene products and enhanced downstream signaling of relevant oncogenic pathways. If such an association exists, protein products of select GAs would make attractive therapeutic targets.
Findings from our retrospective study demonstrate that GAs, as detected by ctDNA analysis, may play a significant role in informing potential risk for visceral metastases and overall prognosis in mCRPC. Furthermore, evaluation of serial PCN during mCRPC treatment provides an additional tool to determine putative responses to a variety of therapeutic interventions and, as such, can supplement clinical decision-making. Future studies are needed to determine the prognostic significance of specific GAs and the reliability of using PCN as a clinical tool to assess treatment responses.
Data availability statement
The datasets presented in this article are not readily available because of patient anonymity. Requests to access the datasets should be directed to the corresponding author.
Ethics statement
The studies involving humans were approved by Medical University of South Carolina IRB. The studies were conducted in accordance with the local legislation and institutional requirements. Written informed consent for participation was not required from the participants or the participants’ legal guardians/next of kin in accordance with the national legislation and institutional requirements.
Author contributions
TD contributed to conceptualization, data analysis, study design, and was the primary manuscript writer/editor. ML contributed to conceptualization, data analysis, study design, and manuscript writing/editing. HL performed formal statistical analysis and manuscript review/editing. JK, LD, and AG contributed to data analysis, and manuscript writing/editing. TG and PH contributed to manuscript review/editing. All authors contributed to the article and approved the submitted version.
Funding
This publication was supported, in part, by the National Center for Advancing Translational Sciences of the National Institutes of Health under Grant Numbers KL2 TR001452 & UL1 TR001450.
Conflict of interest
LD is an employee of Guardant Health with stock and ownership interests in the company. AG is on the advisory board for Pfizer.
The remaining authors declare that the research was conducted in the absence of any commercial or financial relationship that could be construed as a potential conflict of interest.
Publisher’s note
All claims expressed in this article are solely those of the authors and do not necessarily represent those of their affiliated organizations, or those of the publisher, the editors and the reviewers. Any product that may be evaluated in this article, or claim that may be made by its manufacturer, is not guaranteed or endorsed by the publisher.
References
1. Siegel RL, Miller KD, Wagle NS, Jemal A. Cancer statistics, 2023. CA Cancer J Clin (2023) 73(1):17–48. doi: 10.3322/caac.21763
2. Leuva H, Sigel K, Zhou M, Wilkerson J, Aggen DH, Park YA, et al. A novel approach to assess real-world efficacy of cancer therapy in metastatic prostate cancer. Analysis of national data on Veterans treated with abiraterone and enzalutamide. Semin Oncol (2019) 46(4-5):351–61.
3. Epstein JI, Zelefsky MJ, Sjoberg DD, Nelson JB, Egevad L, Magi-Galluzzi C, et al. A contemporary prostate cancer grading system: A validated alternative to the gleason score. Eur Urol (2016) 69(3):428–35. doi: 10.1016/j.eururo.2015.06.046
4. Loeb S, Folkvaljon Y, Robinson D, Lissbrant IF, Egevad L, Stattin P. Evaluation of the 2015 gleason grade groups in a nationwide population-based cohort. Eur Urol (2016) 69(6):1135–41. doi: 10.1016/j.eururo.2015.11.036
5. Hall ME, Huelster HL, Luckenbaugh AN, Laviana AA, Keegan KA, Klaassen Z, et al. Metastatic hormone-sensitive prostate cancer: current perspective on the evolving therapeutic landscape. Onco Targets Ther (2020) 13:3571–81. doi: 10.2147/OTT.S228355
6. Sartor O, de Bono JS. Metastatic prostate cancer. N Engl J Med (2018) 378(17):1653–4. doi: 10.1056/NEJMra1701695
7. Sumanasuriya S, De Bono J. Treatment of advanced prostate cancer-A review of current therapies and future promise. Cold Spring Harb Perspect Med (2018) 8(6). doi: 10.1101/cshperspect.a030635
8. Oliveira KCS, Ramos IB, Silva JMC, Barra WF, Riggins GJ, Palande V, et al. Current perspectives on circulating tumor DNA, precision medicine, and personalized clinical management of cancer. Mol Cancer Res (2020) 18(4):517–28. doi: 10.1158/1541-7786.MCR-19-0768
9. Lu YT, Delijani K, Mecum A, Goldkorn A. Current status of liquid biopsies for the detection and management of prostate cancer. Cancer Manag Res (2019) 11:5271–91. doi: 10.2147/CMAR.S170380
10. Gourdin T, Sonpavde G. Utility of cell-free nucleic acid and circulating tumor cell analyses in prostate cancer. Asian J Androl (2018) 20(3):230–7.
11. Sonpavde G, Agarwal N, Pond GR, Nagy RJ, Nussenzveig RH, Hahn AW, et al. Circulating tumor DNA alterations in patients with metastatic castration-resistant prostate cancer. Cancer (2019) 125(9):1459–69. doi: 10.1002/cncr.31959
12. Ledet EM, Lilly MB, Sonpavde G, Lin E, Nussenzveig RH, Barata PC, et al. Comprehensive analysis of AR alterations in circulating tumor DNA from patients with advanced prostate cancer. Oncologist (2020) 25(4):327–33. doi: 10.1634/theoncologist.2019-0115
13. Goodall J, Mateo J, Yuan W, Mossop H, Porta N, Miranda S, et al. Circulating cell-free DNA to guide prostate cancer treatment with PARP inhibition. Cancer Discov (2017) 7(9):1006–17. doi: 10.1158/2159-8290.CD-17-0261
14. Mehra N, Dolling D, Sumanasuriya S, Christova R, Pope L, Carreira S, et al. Plasma cell-free DNA concentration and outcomes from taxane therapy in metastatic castration-resistant prostate cancer from two phase III trials (FIRSTANA and PROSELICA). Eur Urol (2018) 74(3):283–91. doi: 10.1016/j.eururo.2018.02.013
15. Goodall J, Assaf ZJ, Shi Z, Seed G, Zhang L, Lauffer B, et al. Circulating tumor DNA (ctDNA) dynamics associate with treatment response and radiological progression-free survival (rPFS): Analyses from a randomized phase II trial in metastatic castration-resistant prostate cancer (mCRPC). J Clin Oncol (2020) 38(15_suppl):5508–. doi: 10.1200/JCO.2020.38.15_suppl.5508
16. Stopsack KH, Whittaker CA, Gerke TA, Loda M, Kantoff PW, Mucci LA, et al. Aneuploidy drives lethal progression in prostate cancer. Proc Natl Acad Sci USA (2019) 116(23):11390–5. doi: 10.1073/pnas.1902645116
17. Robinson D, Van Allen EM, Wu YM, Schultz N, Lonigro RJ, Mosquera JM, et al. Integrative clinical genomics of advanced prostate cancer. Cell (2015) 162(2):454.
18. Grist E, Friedrich S, Brawley C, Mendes L, Parry M, Ali A, et al. Accumulation of copy number alterations and clinical progression across advanced prostate cancer. Genome Med (2022) 14(1):102. doi: 10.1186/s13073-022-01080-4
19. Bray AW, Duan R, Malalur P, Drusbosky LM, Gourdin TS, Hill EG, et al. Elevated serum CEA is associated with liver metastasis and distinctive circulating tumor DNA alterations in patients with castration-resistant prostate cancer. Prostate (2022) 82(13):1264–72. doi: 10.1002/pros.24400
20. Taavitsainen S, Annala M, Ledet E, Beja K, Miller PJ, Moses M, et al. Evaluation of commercial circulating tumor DNA test in metastatic prostate cancer. JCO Precis Oncol (2019) 3. doi: 10.1200/PO.19.00014
21. Lanman RB, Mortimer SA, Zill OA, Sebisanovic D, Lopez R, Blau S, et al. Analytical and clinical validation of a digital sequencing panel for quantitative, highly accurate evaluation of cell-free circulating tumor DNA. PloS One (2015) 10(10):e0140712. doi: 10.1371/journal.pone.0140712
22. Odegaard JI, Vincent JJ, Mortimer S, Vowles JV, Ulrich BC, Banks KC, et al. Validation of a plasma-based comprehensive cancer genotyping assay utilizing orthogonal tissue- and plasma-based methodologies. Clin Cancer Res (2018) 24(15):3539–49. doi: 10.1158/1078-0432.CCR-17-3831
23. Pezaro C, Omlin A, Lorente D, Rodrigues DN, Ferraldeschi R, Bianchini D, et al. Visceral disease in castration-resistant prostate cancer. Eur Urol (2014) 65(2):270–3. doi: 10.1016/j.eururo.2013.10.055
24. Thompson JC, Carpenter EL, Silva BA, Rosenstein J, Chien AL, Quinn K, et al. Serial monitoring of circulating tumor DNA by next-generation gene sequencing as a biomarker of response and survival in patients with advanced NSCLC receiving pembrolizumab-based therapy. JCO Precis Oncol (2021) 5. doi: 10.1200/PO.20.00321
25. Zhang Q, Luo J, Wu S, Si H, Gao C, Xu W, et al. Prognostic and predictive impact of circulating tumor DNA in patients with advanced cancers treated with immune checkpoint blockade. Cancer Discov (2020) 10(12):1842–53. doi: 10.1158/2159-8290.CD-20-0047
26. Dang HX, Chauhan PS, Ellis H, Feng W, Harris PK, Smith G, et al. Cell-free DNA alterations in the AR enhancer and locus predict resistance to AR-directed therapy in patients with metastatic prostate cancer. JCO Precis Oncol (2020) 4:680–713. doi: 10.1200/PO.20.00047
27. Taylor AM, Shih J, Ha G, Gao GF, Zhang X, Berger AC, et al. Genomic and functional approaches to understanding cancer aneuploidy. Cancer Cell (2018) 33(4):676–89 e3.
28. Miller ET, You S, Cadaneanu RM, Kim M, Yoon J, Liu ST, et al. Chromosomal instability in untreated primary prostate cancer as an indicator of metastatic potential. BMC Cancer (2020) 20(1):398. doi: 10.1186/s12885-020-06817-1
29. Yang F, Zhang Y, Ressler SJ, Ittmann MM, Ayala GE, Dang TD, et al. FGFR1 is essential for prostate cancer progression and metastasis. Cancer Res (2013) 73(12):3716–24. doi: 10.1158/0008-5472.CAN-12-3274
30. Liu J, Chen G, Liu Z, Liu S, Cai Z, You P, et al. Aberrant FGFR tyrosine kinase signaling enhances the warburg effect by reprogramming LDH isoform expression and activity in prostate cancer. Cancer Res (2018) 78(16):4459–70. doi: 10.1158/0008-5472.CAN-17-3226
31. Quigley DA, Dang HX, Zhao SG, Lloyd P, Aggarwal R, Alumkal JJ, et al. Genomic hallmarks and structural variation in metastatic prostate cancer. Cell (2018) 175(3):889.
32. Viswanathan SR, Ha G, Hoff AM, Wala JA, Carrot-Zhang J, Whelan CW, et al. Structural alterations driving castration-resistant prostate cancer revealed by linked-read genome sequencing. Cell (2018) 174(2):433–47 e19. doi: 10.1016/j.cell.2018.05.036
33. Fizazi K, Foulon S, Carles J, Roubaud G, McDermott R, Flechon A, et al. Abiraterone plus prednisone added to androgen deprivation therapy and docetaxel in de novo metastatic castration-sensitive prostate cancer (PEACE-1): a multicentre, open-label, randomised, phase 3 study with a 2 x 2 factorial design. Lancet (2022) 399(10336):1695–707. doi: 10.1016/S0140-6736(22)00367-1
Keywords: prostate cancer, metastasis, castration-resistant prostate cancer, androgen receptor, PIK3CA, aneuploidy, genomic amplification, circulating tumor DNA
Citation: Dincman TA, Karam JAQ, Giordano A, Li H, Drusbosky LM, Gourdin TS, Howe PH and Lilly MB (2024) Genomic amplifications identified by circulating tumor DNA analysis guide prognosis in metastatic castration-resistant prostate cancer. Front. Oncol. 13:1202277. doi: 10.3389/fonc.2023.1202277
Received: 07 April 2023; Accepted: 25 October 2023;
Published: 21 February 2024.
Edited by:
Yafeng Ma, Ingham Institute of Applied Medical Research, AustraliaReviewed by:
Andrea Lancia, San Matteo Hospital Foundation (IRCCS), ItalyYupeng Wu, First Affiliated Hospital of Fujian Medical University, China
Copyright © 2024 Dincman, Karam, Giordano, Li, Drusbosky, Gourdin, Howe and Lilly. This is an open-access article distributed under the terms of the Creative Commons Attribution License (CC BY). The use, distribution or reproduction in other forums is permitted, provided the original author(s) and the copyright owner(s) are credited and that the original publication in this journal is cited, in accordance with accepted academic practice. No use, distribution or reproduction is permitted which does not comply with these terms.
*Correspondence: Toros A. Dincman, ZGluY21hbnRAbXVzYy5lZHU=