 Meike Kaehler1
 Pia Osteresch1
 Axel Künstner2,3
 Stella Juliane Vieth1Daniela Esser4Marius Möller2,3
 Hauke Busch2,3Inga Vater5Malte Spielmann5,6
 Ingolf Cascorbi1*
 Inga Nagel1,5
- 1Institute of Experimental and Clinical Pharmacology, University Hospital Schleswig-Holstein, Campus Kiel, Kiel, Germany
- 2Medical Systems Biology Group, University of Lübeck, Lübeck, Germany
- 3Institute of Cardiogenetics, University of Lübeck, Lübeck, Germany
- 4Institute of Clinical Chemistry, University Hospital Schleswig-Holstein, Kiel, Germany
- 5Institute of Human Genetics, University Hospital Schleswig-Holstein, Kiel, Germany
- 6Institute of Human Genetics, University Hospital Schleswig-Holstein, Lübeck, Germany
Introduction: Resistance in anti-cancer treatment is a result of clonal evolution and clonal selection. In chronic myeloid leukemia (CML), the hematopoietic neoplasm is predominantly caused by the formation of the BCR::ABL1 kinase. Evidently, treatment with tyrosine kinase inhibitors (TKIs) is tremendously successful. It has become the role model of targeted therapy. However, therapy resistance to TKIs leads to loss of molecular remission in about 25% of CML patients being partially due to BCR::ABL1 kinase mutations, while for the remaining cases, various other mechanisms are discussed.
Methods: Here, we established an in vitro-TKI resistance model against the TKIs imatinib and nilotinib and performed exome sequencing.
Results: In this model, acquired sequence variants in NRAS, KRAS, PTPN11, and PDGFRB were identified in TKI resistance. The well-known pathogenic NRAS p.(Gln61Lys) variant provided a strong benefit for CML cells under TKI exposure visible by increased cell number (6.2-fold, p < 0.001) and decreased apoptosis (-25%, p < 0.001), proving the functionality of our approach. The transfection of PTPN11 p.(Tyr279Cys) led to increased cell number (1.7-fold, p = 0.03) and proliferation (2.0-fold, p < 0.001) under imatinib treatment.
Discussion: Our data demonstrate that our in vitro-model can be used to study the effect of specific variants on TKI resistance and to identify new driver mutations and genes playing a role in TKI resistance. The established pipeline can be used to study candidates acquired in TKI-resistant patients, thereby providing new options for the development of new therapy strategies to overcome resistance.
1 Introduction
Despite tremendous advances within the last decades, therapy failure is still a significant burden in anti-cancer therapy. Tumor cells tend to escape chemotherapy by clonal evolution and selection of resistant subclones, resulting in a relapse in therapy. Next-generation sequencing aims to find promising candidate variants in resistant cancer cell sublines. Such approach may further be helpful for molecular tumor boards to adapt the targeted therapy regimen for each patient (1).
The myeloproliferative syndrome chronic myeloid leukemia (CML) became a role model for effective and successful targeted therapy. CML is a rare neoplasm, mainly caused by reciprocal translocation t(9;22)(q34;q11), resulting in the formation of the BCR::ABL1 fusion gene (2). In many cases, it is successfully treated using tyrosine kinase inhibitors (TKIs), especially the 2-phenylaminopyrimidine imatinib, which binds to the BCR::ABL1 kinase and, thereby, prevents phosphorylation of downstream targets (3). Although overall 10-year survival rates are high at 83%, 20 to 25% of all patients suffer from therapy failure within five years of treatment (4, 5). Second and third-generation TKIs, namely nilotinib, dasatinib, bosutinib, and ponatinib, were developed to overcome such resistances with variable success (6, 7). TKI resistance occurs either dependent or independent from BCR::ABL1 kinase alterations. The first-mentioned is predominantly caused by mutations in BCR::ABL1 (e.g., ABL1 p.(Tyr253His), p.(Glu255Val) or p.(Thr315Ile)) preventing binding of the TKIs to the kinase domain or by BCR::ABL1 gene amplification and overexpression (8). For BCR::ABL1-independent resistance, several mechanisms are discussed, e.g., overexpression of drug efflux transporters, especially the ATP binding cassette (ABC) transporter family members p-glycoprotein (P-gp, ABCB1) or breast cancer resistance protein (BCRP, ABCG2), the adaption of signaling pathways or deregulation of gene expression (9, 10). In addition, genetic aberrations, e.g., trisomy 8 or mutations affecting runt-related transcription factor 1 (RUNX1), were shown to contribute to the progression into blast crisis or selection of TKI-resistant clones in patients (11, 12).
Besides clinical studies, in vitro-models can be applied to study mechanisms of drug resistance in detail. Such models are pivotal tools as findings derived from these models were successfully translated into the clinic, e.g., to predict drug efficacy and improve treatment protocols (13). Drug resistance of a tumor cell line can be acquired in vitro by exposure to slowly increasing anticancer drug concentrations or by pulse treatment.
Here, we used exome sequencing to study genetic variants in a TKI resistance CML in vitro-model. For this purpose, we established biological replicates of imatinib and nilotinib resistance. We report on sequence variants evolving in imatinib and nilotinib resistance development. Further, we investigate the influence of the candidate variants PTPN11 p.(Tyr279Cys), PDGFRB p.(Glu578Gln), and NRAS p.(Gln61Lys) on the response to TKI treatment.
2 Materials and methods
2.1 Reagents, cell lines, and generation of resistant cells
If not indicated otherwise, chemicals and reagents were obtained from Sigma-Aldrich (Munich, Germany) or Carl Roth (Karlsruhe, Germany).
K-562 cells (RRID: CVCL_0004), established from the pleural effusion of a 53-year-old woman (14), were obtained from the German Collection of Microorganisms and Cell Cultures (DSMZ, Braunschweig, Germany). Cell maintenance, generation of biological replicates of TKI-resistant sublines, and analyses of cell line authenticity were described elsewhere (15, 16). Cells were resistant against lowIM (0.5 µM imatinib), highIM (2 µM imatinib), lowN (0.05 µM nilotinib) and highN (0.1 µM nilotinib). The concentrations were chosen to reflect the clinically typical range of estimated imatinib plasma concentration, as well as the 20-fold higher potency of nilotinib.
2.2 RNA and DNA extraction
Total RNA was isolated using E.Z.N.A Total RNA kit 1 (Omega bio-tek, Norcross, GA, USA). Cell line DNA was purified using Gentra Puregene Kit (Qiagen, Hilden, Germany).
2.3 Exome sequencing
Exome sequencing was performed using Illumina InView Human Exome Advance sequencing technology, a random-primed cDNA library, 60x coverage, and 2 x 150 bp read length at Eurofins Genomics (Ebersberg, Germany). Raw data was mapped against GRCh38. Exome data was processed similarly to Künstner et al. (17). For the detailed bioinformatic analysis, see supplement.
2.4 MiSeq
Exome sequencing data was validated using Next Generation Sequencing (NGS) SBS technology with Illumina MiSeq after PCR amplicon preparation with the Nextera XT Sequencing Kit (Illumina, San Diego USA). For this purpose, amplicons of the respective genes were generated using gene-specific primers, primer-specific annealing temperatures and MyTaq DNA Polymerase (Meridian Bioscience, Memphis, TN, USA). (Supplementary Table 1). Genomic DNA from 2 µM imatinib resistant K-562 cells replicate 2, and 0.1 µM nilotinib resistant K-562 cells replicate 2 served as templates. PCR products were extracted using GeneJet Gel Extraction Kit (Thermo Fisher Scientific, Darmstadt, Germany) according to the manufacturer’s recommendations. MiSeq was performed according to the manufacturer’s protocol, as already described (18).
2.5 Genome-wide expression analyses
Microarrays were performed using Clariom S Arrays (Affymetrix; Thermo Fisher Scientific) as previously described (16). Briefly, RNA was isolated using miRVANA microRNA isolation kit (Thermo Fisher), and 100 ng were hybridized onto the arrays according to the manufacturer’s protocol. Further details about data processing and analysis are given in the supplement.
2.6 Whole-cell lysates and immunoblotting
Whole-cell lysates and immunoblotting were performed as described elsewhere (19, 20). Blots were probed with the following antibodies obtained from Santa Cruz or CST (Danvers, MA, USA): phospho-ERK: Cat# sc-7383, RRID AB_627545, 1:1000; ERK: Cat# sc-514302, RRID : AB_2571739, 1:1000; SHP2: Cat# 3397, RRID: AB_2174959, 1:1000; PDGFRβ: Cat# sc-374573, RRID: AB_10990921, 1:100; pan-RAS: Cat# sc-166691, RRID: AB_2154229, 1: 200; GAPDH: Cat# sc-47724, RRID: AB_627678, 1:2000; anti-rabbit: Cat# 926-32211, RRID: AB_621843; Cat# 926-926-68071, RRID: AB_10956166; anti-mouse: Cat# 926-32210, RRID: AB_621842, Cat# 926-680707, RRID: AB_10956588; all 1:10,000, LiCOR (Bad Homburg, Germany). Primary antibodies were diluted in Intercept/TBS blocking solution (LiCOR) supplemented with 0.2% Tween-20, secondary antibodies were diluted in TBS supplemented with 0.1% Tween-20. Total protein staining was performed using Revert 700 Total Protein Stain Solution according to the manufacturer’s protocol (LiCOR). Densitometry was performed using Empiria Studio 1.2 (LiCOR).
2.7 Inhibition assay
PTPN11 phosphatase activity was blocked using the allosteric inhibitor RMC-4550 (ProbeChem, Shanghai, China). For this purpose, 1 x 10⁶ cells per sample were seeded onto 12 well plates and incubated with 1.5 µM RMC-4450 for 3 h in a cell culture incubator. Subsequently, cells were collected, and immunoblotting was performed as described above.
2.8 Cloning
The coding regions of PTPN11 (NM_002834.5) and NRAS (NM_002524.5) were amplified using cDNA from highIM-R2 and highN-R2 cells. PDGFRB coding plasmid was obtained from Sino Biological (NM_002609.3, HG10514-G, Eschborn, Germany). The amplicons were cloned into the pSelect-puromycin-mcs vector (Sigma-Aldrich) using the CloneAmp HiFi PCR premix (Takara) with gene-specific primers and primer-specific annealing temperatures (Supplementary Table S1) including the restriction enzymes BamHI and NcoI/NheI (NEB), cloning enhancer and the In-Fusion HD Kit (Takara). PDGFRB p.(Glu578Gln) was inserted using Q5 site-directed mutagenesis kit (NEB) using the primers PDGFRB_Glu578Gln_F and PDGFRB_Glu578Gln_R at 60°C annealing temperature and 3 min elongation time according to the manufacturer’s protocol (Supplementary Table S1). Sequence identity was confirmed using Sanger sequencing.
2.9 Transient and stable transfection
Transient transfection was performed using nucleofection and the nucleofector 2 b device (Lonza, Cologne, Germany). 2 x 10⁶ cells were transfected with 5 or 10 µg of the respective plasmid or empty vector control for plasmid transfection or 100 nM Ambion Silencer Select s11524 or negative control #1 for siRNA-mediated knockdown of PTPN11. 24 h after transfection, cells were seeded onto respective cell culture plates to analyze cellular fitness followed by 24-48 h exposure to 2 µM imatinib or 100 nM nilotinib or used for expression analyses as described elsewhere. After incubation time, cells were subducted for subsequent cellular fitness assays as described below. Stably transfected cells were generated by selecting puromycin-resistant cells after 4 weeks of exposure to 1 µg/ml puromycin (Invivogen, Toulouse, France).
2.10 Cellular fitness assays
Cellular fitness was analyzed as previously described (16, 18, 19). Briefly, cell numbers were obtained by trypan blue staining, WST-1 (Sigma-Aldrich), Caspase Glo 9 Assay (Promega), Bromodeoxyuridine proliferation assay (Merck, Darmstadt, Germany), and MKI ELISA Kit (MyBioSource, San Diego, CA, USA) according to the manufacturers’ recommendations. Data was analyzed by normalizing TKI-treated to non-treated samples, followed by statistical analyses as described below. For analyses of total cell number, proliferation, and apoptosis during the development of imatinib resistance, 0.5 x 10⁶ cells/ml were seeded into cell culture flasks and exposed to 0.1 µM imatinib for 21 days. Cells were counted and cultivated dependent on the cell density. After 21 days, Ki-67 expression and caspase 9 activity were measured as described above. The analyses of 0.2 and 0.3 µM imatinib were performed accordingly.
2.11 Statistical analysis
Unless not stated otherwise, statistical analysis was performed using one-way ANOVA, Dunnett’s test and/or student’s t-test and the GraphPad prism software (Version 8.0 for Windows, San Diego California, USA).
3 Results
3.1 Genetic analyses reveal large differences between biological replicates of imatinib and nilotinib resistance
To analyze clonal evolution in TKI resistance, imatinib and nilotinib-resistant sublines derived from TKI-sensitive K-562 cells were established by step-wise exposure to increasing TKI concentrations (Figure 1A). Cell lines developing resistance against 0.5 µM imatinib (lowIM) or 2 µM imatinib (highIM), as well as 0.05 µM nilotinib (lowN) or 0.1 µM nilotinib (highN) were obtained generating four biological replicate cell lines of imatinib and two of nilotinib resistance (Figure 1B). Subsequently, genetic variants in these twelve TKI-resistant sublines were analyzed by exome sequencing and compared to TKI-sensitive K-562 cells.
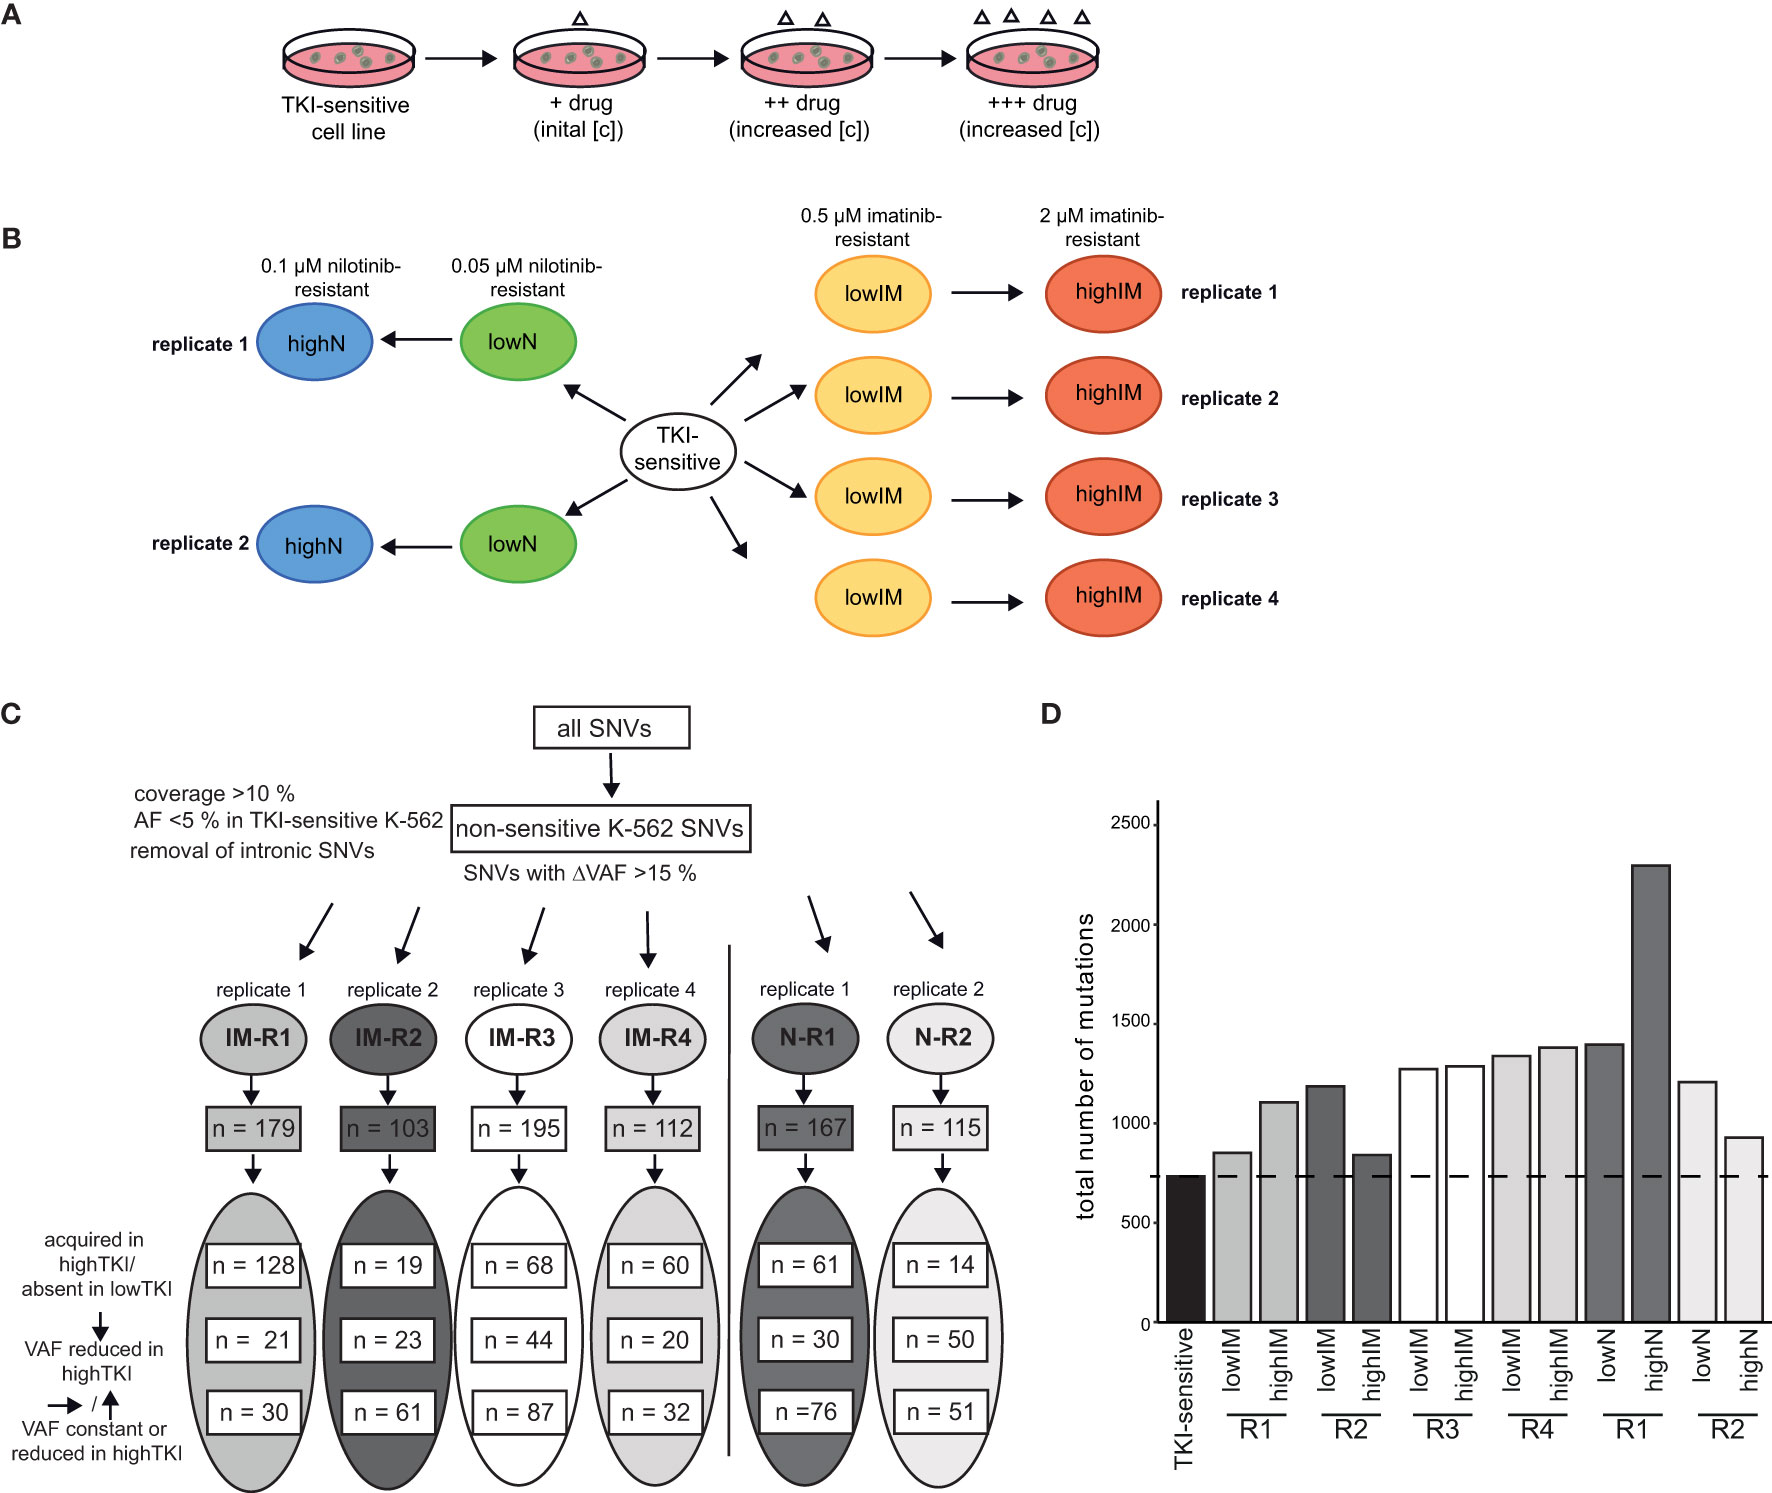
Figure 1 Analyses of genetic aberrations in TKI-resistant sublines. (A) Schematic representation of the generation of TKI-resistant cell lines in vitro. TKI-sensitive cells were exposed to an initial drug concentration (IM: 0,1 µM; N: 0.01 µM). When the cellular proliferation rate was restored, the drug concentration was stepwise increased (IM: 0.3, 0.5, 0.7. 1.0, 1.5 and 2 µM; N: 0.02, 0.05, 0.07 and 0.1 µM). (B) Overview of the TKI-resistant sublines used for the present study: Four imatinib-resistant sublines, resistant against low (0.5) and high (2 µM) imatinib, and two nilotinib-resistant sublines, resistant against low (0.05) and high (0.1 µM) nilotinib, were analyzed and compared to TKI-sensitive K-562 cells. (C) Analysis pipeline for the TKI-resistant cell lines. Using a coverage of >10%, the removal of SNVs already present in TKI-sensitive cells (VAF < 0.05) and removal of deep intronic SNVs, SNVs with a difference in the variant allele frequency (VAF) >15% between TKI-sensitive and resistant cell lines were obtained. The numbers indicate the SNVs clustered into variants acquired in highTKI/absent in lowTKI, variants with reduced VAF in highTKI and variants with constant or reduced VAF the high TKI-resistant cell lines compared to low TKI-resistant cells. (D) Total number of mutations in the TKI-resistant sublines. IM, imatinib; N, nilotinib; TKI, tyrosine kinase inhibitor; R, replicate.
First, non-intronic single nucleotide variants (SNVs) exclusively present in TKI-resistant cells were identified by excluding SNVs present in TKI-sensitive K-562 (VAF < 0.05) and applying a ΔVAF > 15% in the TKI-resistant sublines compared to TKI-sensitive cells. The number of variants differed between 103 and 195 in the TKI-resistant sublines (Figure 1C, Supplementary Table S2). For IM-R1 and IM-R4, the majority of SNVs, 128 and 60, respectively, were newly acquired in highIM, whereas for IM-R2 and IM-R3, as well as in N-R1 and N-R2, the majority of SNVs were already present in the respective lowIM or lowN sublines (IM-R2: 61, IM-R3: 87, N-R1: 76, N-R2: 51, Figure 1C). The total number of SNVs differed between the biological replicates of TKI resistance but increased compared to TKI-sensitive cells in all TKI-resistant cell lines (Figure 1D). However, for N-R1, a strong increase in the total SNV number was detected in highN compared to lowN, while in highIM-R2, as well as in highN-R2, the total number of SNVs was lower compared to lowIM-R2 or lowN-R2 cells, respectively (Figure 1D). To generate insight into the mutational processes, we determined the mutational signatures (COSMIC, https://doi.org/10.11093/nar/gky1015) of the variants that were acquired in the TKI-resistant sublines (VAF < 5% in TKI-sensitive K-562, △VAF > 15% between TKI-sensitive and -resistant K-562 cells). In all sublines, the signatures of unknown etiology, SBS40, showed the strongest signal (Supplementary Figure S1).
As proteins interact in protein-protein-interaction (PPI) networks, this can be analyzed using network-based approaches, such as network propagation. Following this idea, mutations in single genes (protein) can be viewed as ‘heat sources’ in a PPI network. This heat can diffuse through the rest of the network using an iterative process until a steady state is reached. Proteins close to the mutated protein get higher propagation scores than distant proteins following the biological assumption that proteins underlying similar phenotypes tend to interact with one another (21, 22). Accordingly, the protein-protein interaction network of acquired variants was determined
Three clusters were revealed for the resistant cell lines and 14 clusters for gene sets with highIM-R1, -R3 and -R4 being a distinct cluster separate from the other tested resistant sublines (Figure 2A). To compare the network propagation with gene expression data, genome-wide expression analyses of the TKI-resistant cell lines and gene set variation analyses were performed [(16), Figure 2B]. The resulting pattern of enriched pathways was highly similar to one of the protein-protein interaction network derived from the mutational pattern (Figure 2A].
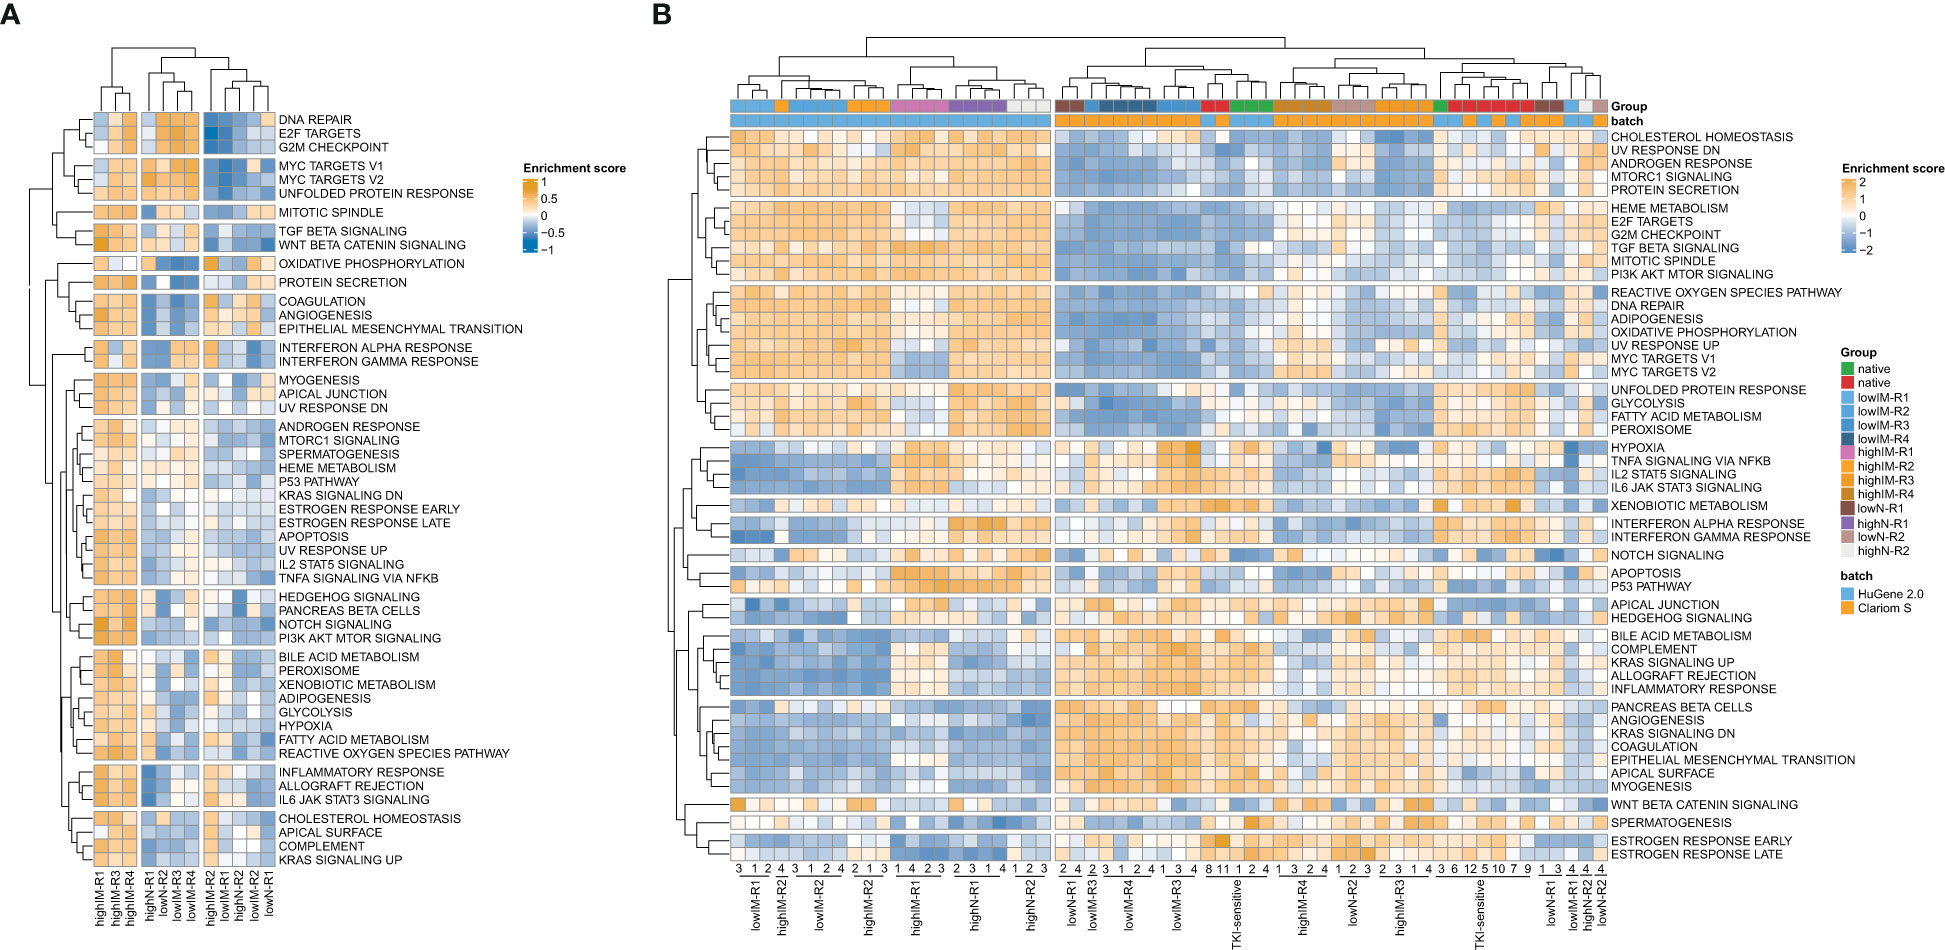
Figure 2 Pathway networks in TKI resistance. (A) Network propagation of SNVs with ΔVAF>0.15 in the TKI-resistant sublines compared to TKI-sensitive cells. (B) Scaled enrichment scores of the gene set variation analysis (GSVA) in TKI resistance. Genome-wide gene expression data was obtained from Clariom S arrays, as well as the dataset GSE203442. IM, imatinib; N, nilotinib; R, replicate.
3.2 In vitro-TKI resistance is associated with pathogenic variants in well-known oncogenes
To identify potential driver mutations in the TKI-resistant sublines, acquired SNVs (with the respective AF ≤ 5% in sensitive K-562 cells) were compared to a list of 568 mutational cancer driver genes previously published by Martínez-Jiménez et al. (23) (Figure 3A, Table 1). Between two and five of the detected mutations in each TKI-resistant cell line were mapped to genes from the mutational cancer driver gene list. Among the acquired variants were the well-known pathogenic RAS-family mutation KRAS (KRAS proto-oncogene, GTPase) p.(Ala59Thr) (ClinVar ID: 12581; lowIM-R3: 8.7%, highIM-R3: 66.6%) in IM-R3, KRAS p.(Gly12Asp) in IM-R4 (ClinVar ID: 12582; lowIM-R4: absent; highIM-R4: 29%, Figures 3A, B), as well as NRAS (NRAS proto-oncogene, GTPase) p.(Gln61Lys) (ClinVar ID: 73058; lowN: 29.2%, highN: 33.3%, Figures 3A, C) in N-R2. Further, two pathogenic KMT2D (lysine methyltransferase 2D) variants p.(Leu3266Val) and p.(Arg191Trp) (ClinVar ID: 449928) were acquired in IM-R3 (lowIM-R3: 9%, highIM-R3: 37%, Figures 3A, B). Moreover, PTPN11 (protein tyrosine phosphatase non-receptor 11) p.(Tyr279Cys) was detected in IM-R2 (ClinVar ID: 13328; lowIM-R2: absent; highIM-R2: 69%, Figures 3A, B). In this cell line, the previously unknown PDGFRB (platelet-derived growth factor receptor beta) variant p.(Glu578Gln) was also detected (lowIM-R2: absent, highIM-R2: 28%, Figures 3A, B, Table 1). The gain of these SNVs likely explains the development of TKI resistance in the respective cell lines.
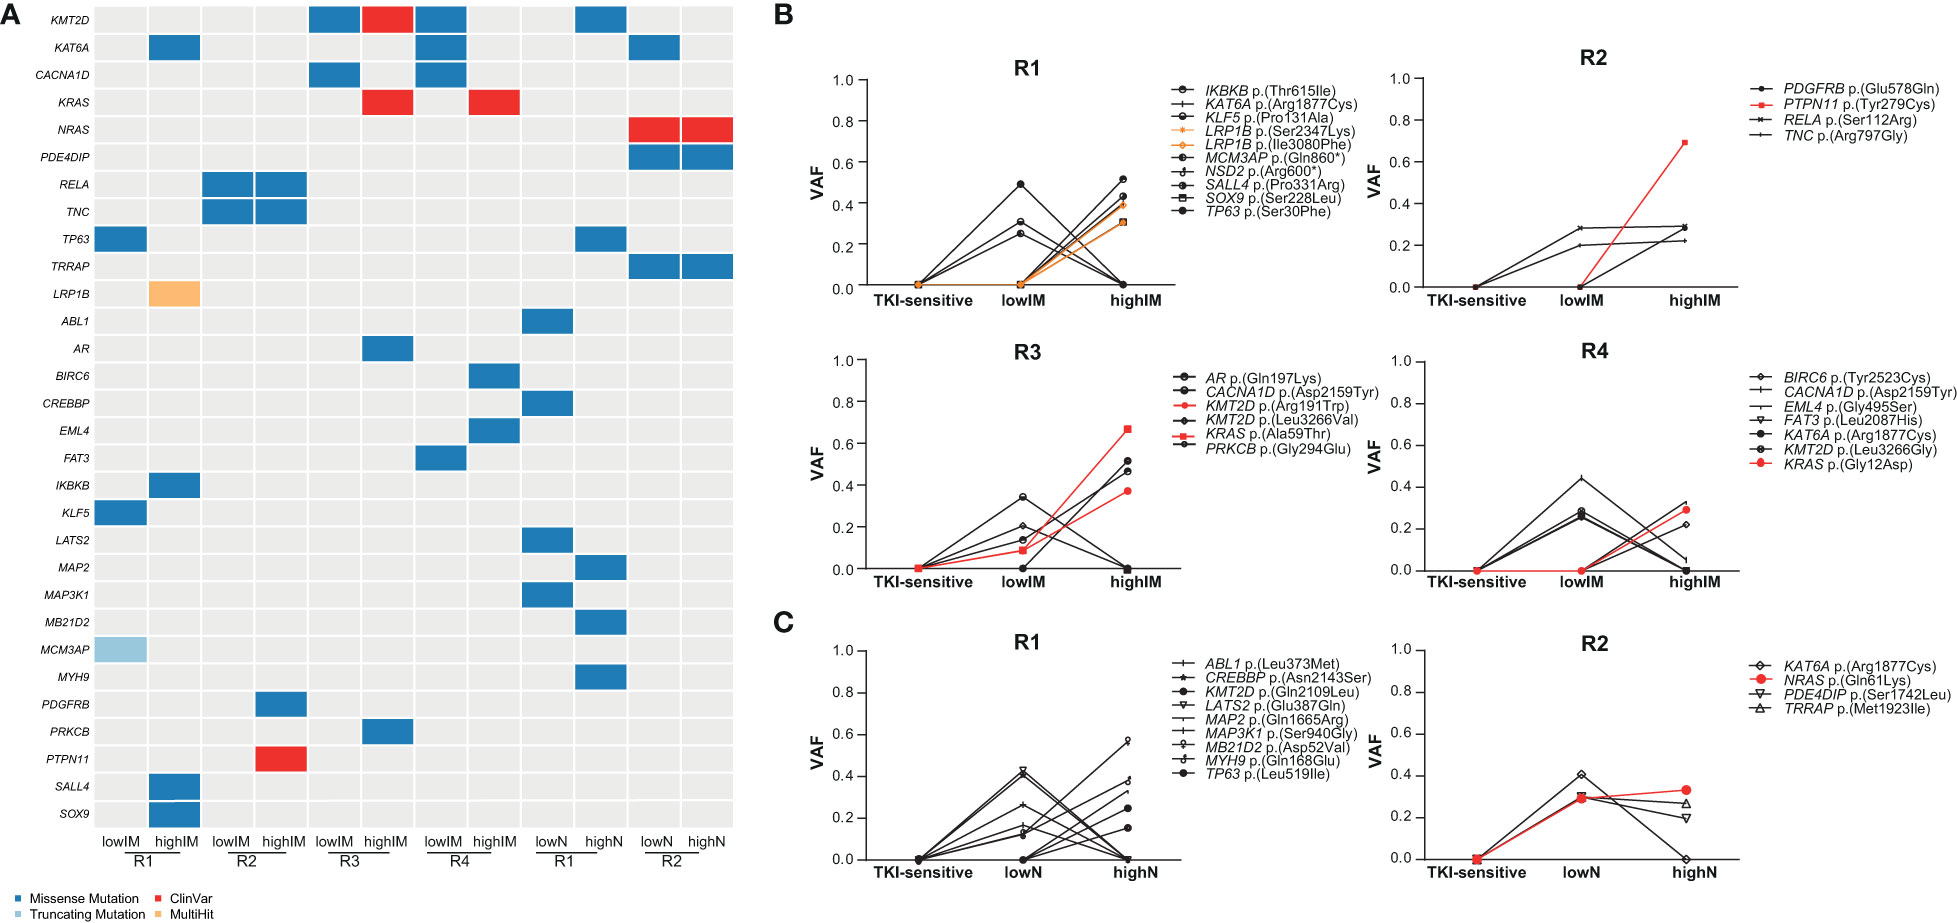
Figure 3 Identification of putative candidate driver variants in TKI resistance. (A) Oncoplot showing potential candidate driver mutations in the TKI-resistant cell lines obtained from association with a list of mutational oncogenes from Martínez-Jiménez et al. (23). Dark blue: missense mutations, light blue: truncating mutations, Red: ClinVar mutation, orange: multihit variants. (B, C) Proportion of SNVs in the TKI-resistant replicate cell lines shown as variant allele frequencies (VAFs). Red indicates ClinVar, orange multihit variants. IM, imatinib; N, nilotinib; R, replicate.
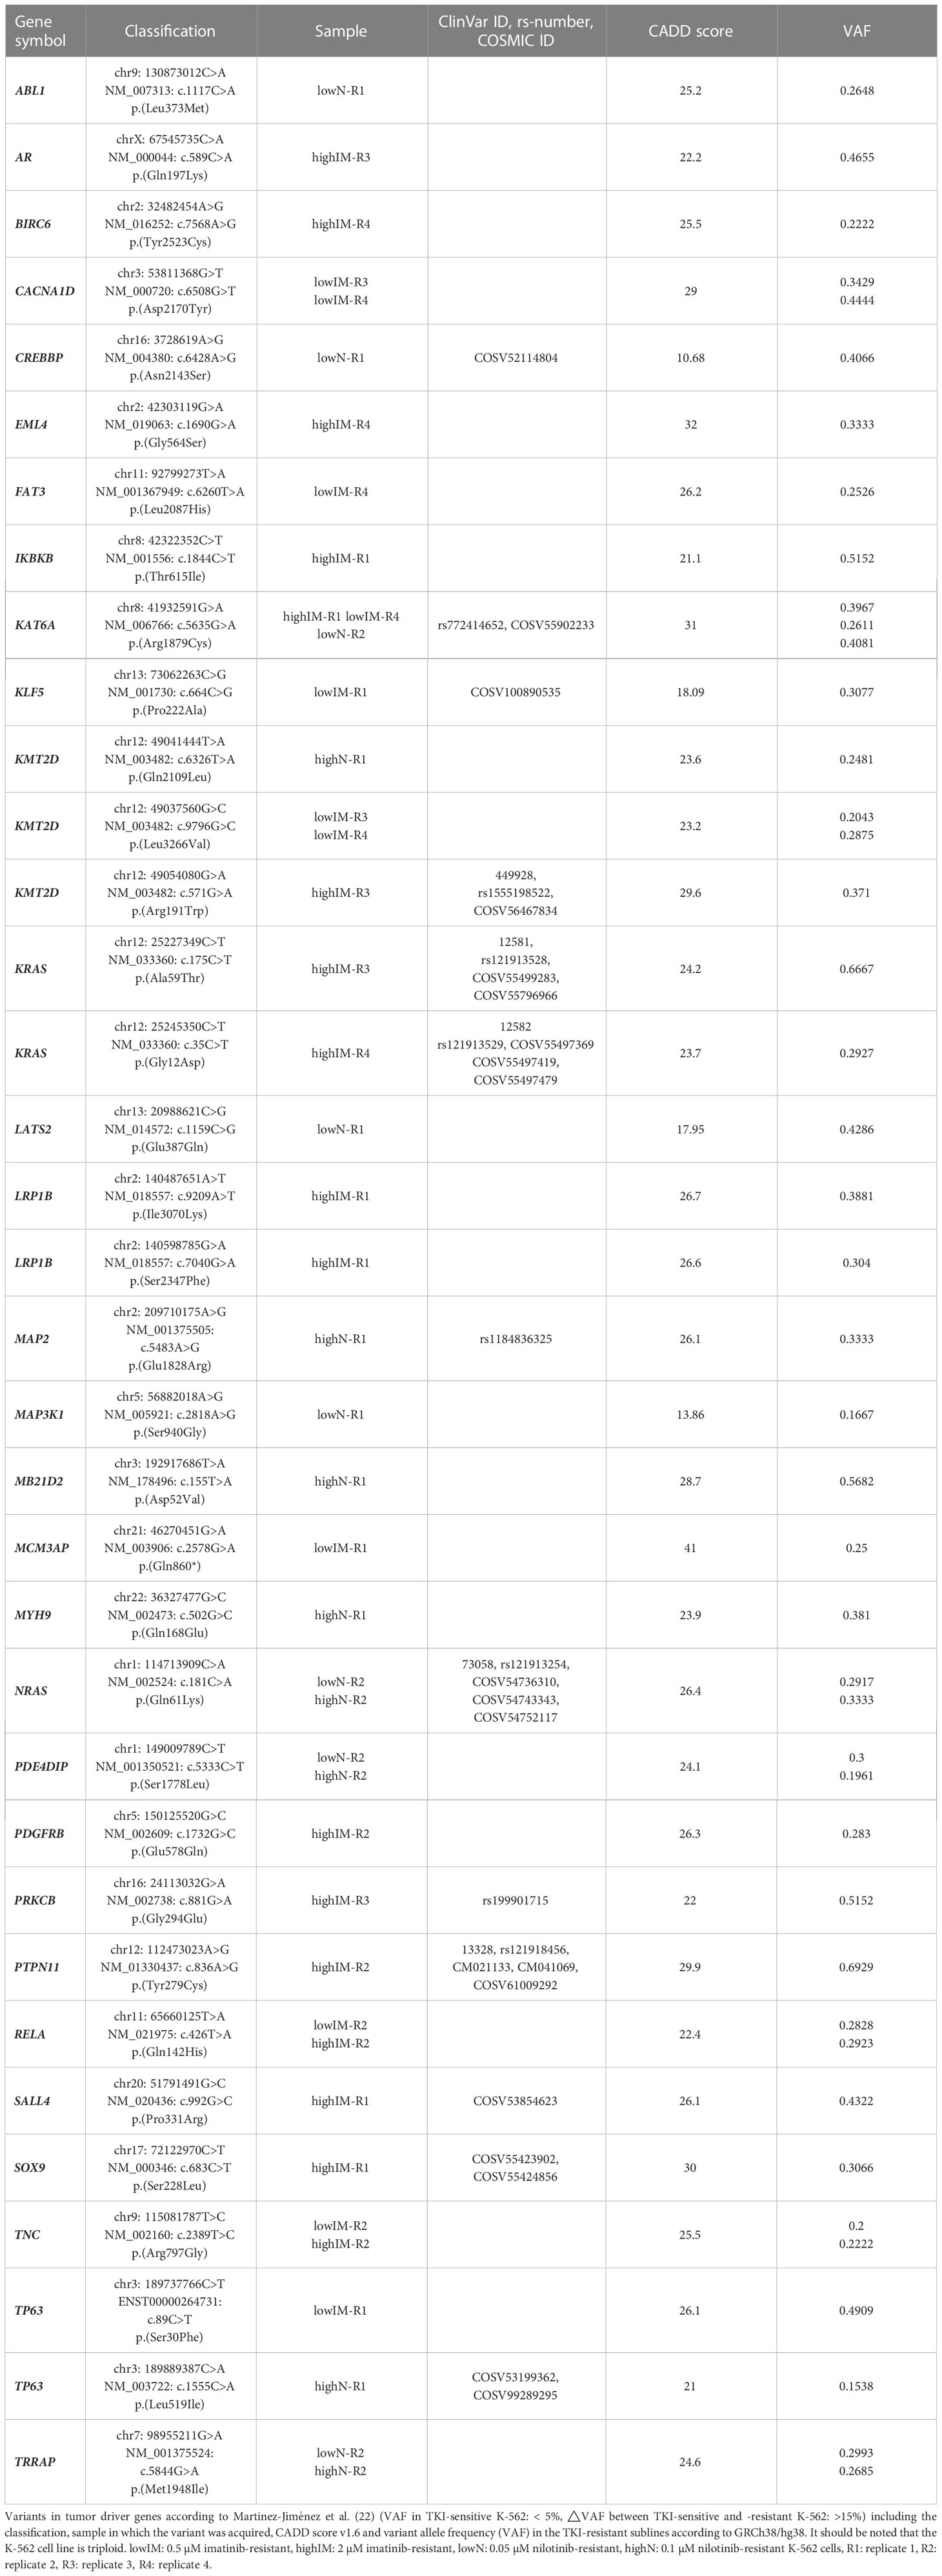
Table 1 Variants in tumor driver genes acquired in TKI resistance.
As ABL mutations are frequently the reason for TKI failure, mutations in this gene were also taken into focus showing two variants of unknown significance p.(Leu373Met) in lowN-R1 and p.(Glu208Asp) (VAF: 7%) in highIM-R4, as well as the known pathogenic kinase-domain mutation p.(Glu274Lys), with the latter likely associated with the TKI resistance (VAF: 10%, Figure 3A).
3.3 NRAS p.(Gln61Lys) impairs the response to TKI treatment
Presence of variants in NRAS, KRAS as well as PTPN11, PDGFRB, RELA, and KMT2D in the TKI-resistant sublines pointed to recurrent pathway changes, especially in Ras-MAP-kinase signaling (Figure 2; Figure 4A). As NRAS p.(Gln61Lys) is a well-known driver mutation, described in various cancer types and associated with malignancy and tumor progression, the effect of this mutation in our in vitro-model was analyzed to investigate whether it is solely sufficient for the development of TKI resistance and if this effect is detectable with our in vitro-model (Supplementary Table S3). To address this, TKI sensitive K-562 cells were transfected with either NRAS wild-type or the p.(Gln61Lys) variant. The response to nilotinib was analyzed measuring cell number, metabolic rate activity, apoptosis, and proliferation rates. Successful transfection of K-562 cells led to a 4.4-fold increase in cell number after NRAS WT (p < 0.001) and 6.2-fold after p.(Gln61Lys) transfection compared to the negative control (p < 0.001, Figure 4B). In addition, metabolic activity was increased in NRAS WT (1.2-fold, p = 0.002) and p.(Gln61Lys)-transfected cells (5.2-fold, p < 0.001; Figure 4B), while apoptosis, visible on the level of caspase 9 activation, was decreased (WT: 25%; p < 0.001; p.(Gln61Lys): 59%, p< 0.001; Figure 4A). However, proliferation measured by Ki-67 expression was not significantly altered between the cell lines (Figure 4B). A similar effect was also observed under imatinib exposure, as cell number (62%, p = 0.008) and metabolic activity (3.7-fold, p < 0.001) were increased and apoptosis was reduced after NRAS p.(Gln61Lys) transfection (-45%, p = 0.003), while proliferation did not significantly change (Supplementary Figure S2). Overall, our data demonstrate that the presence of NRAS p.(Gln61Lys) is solely sufficient to promote TKI resistance.
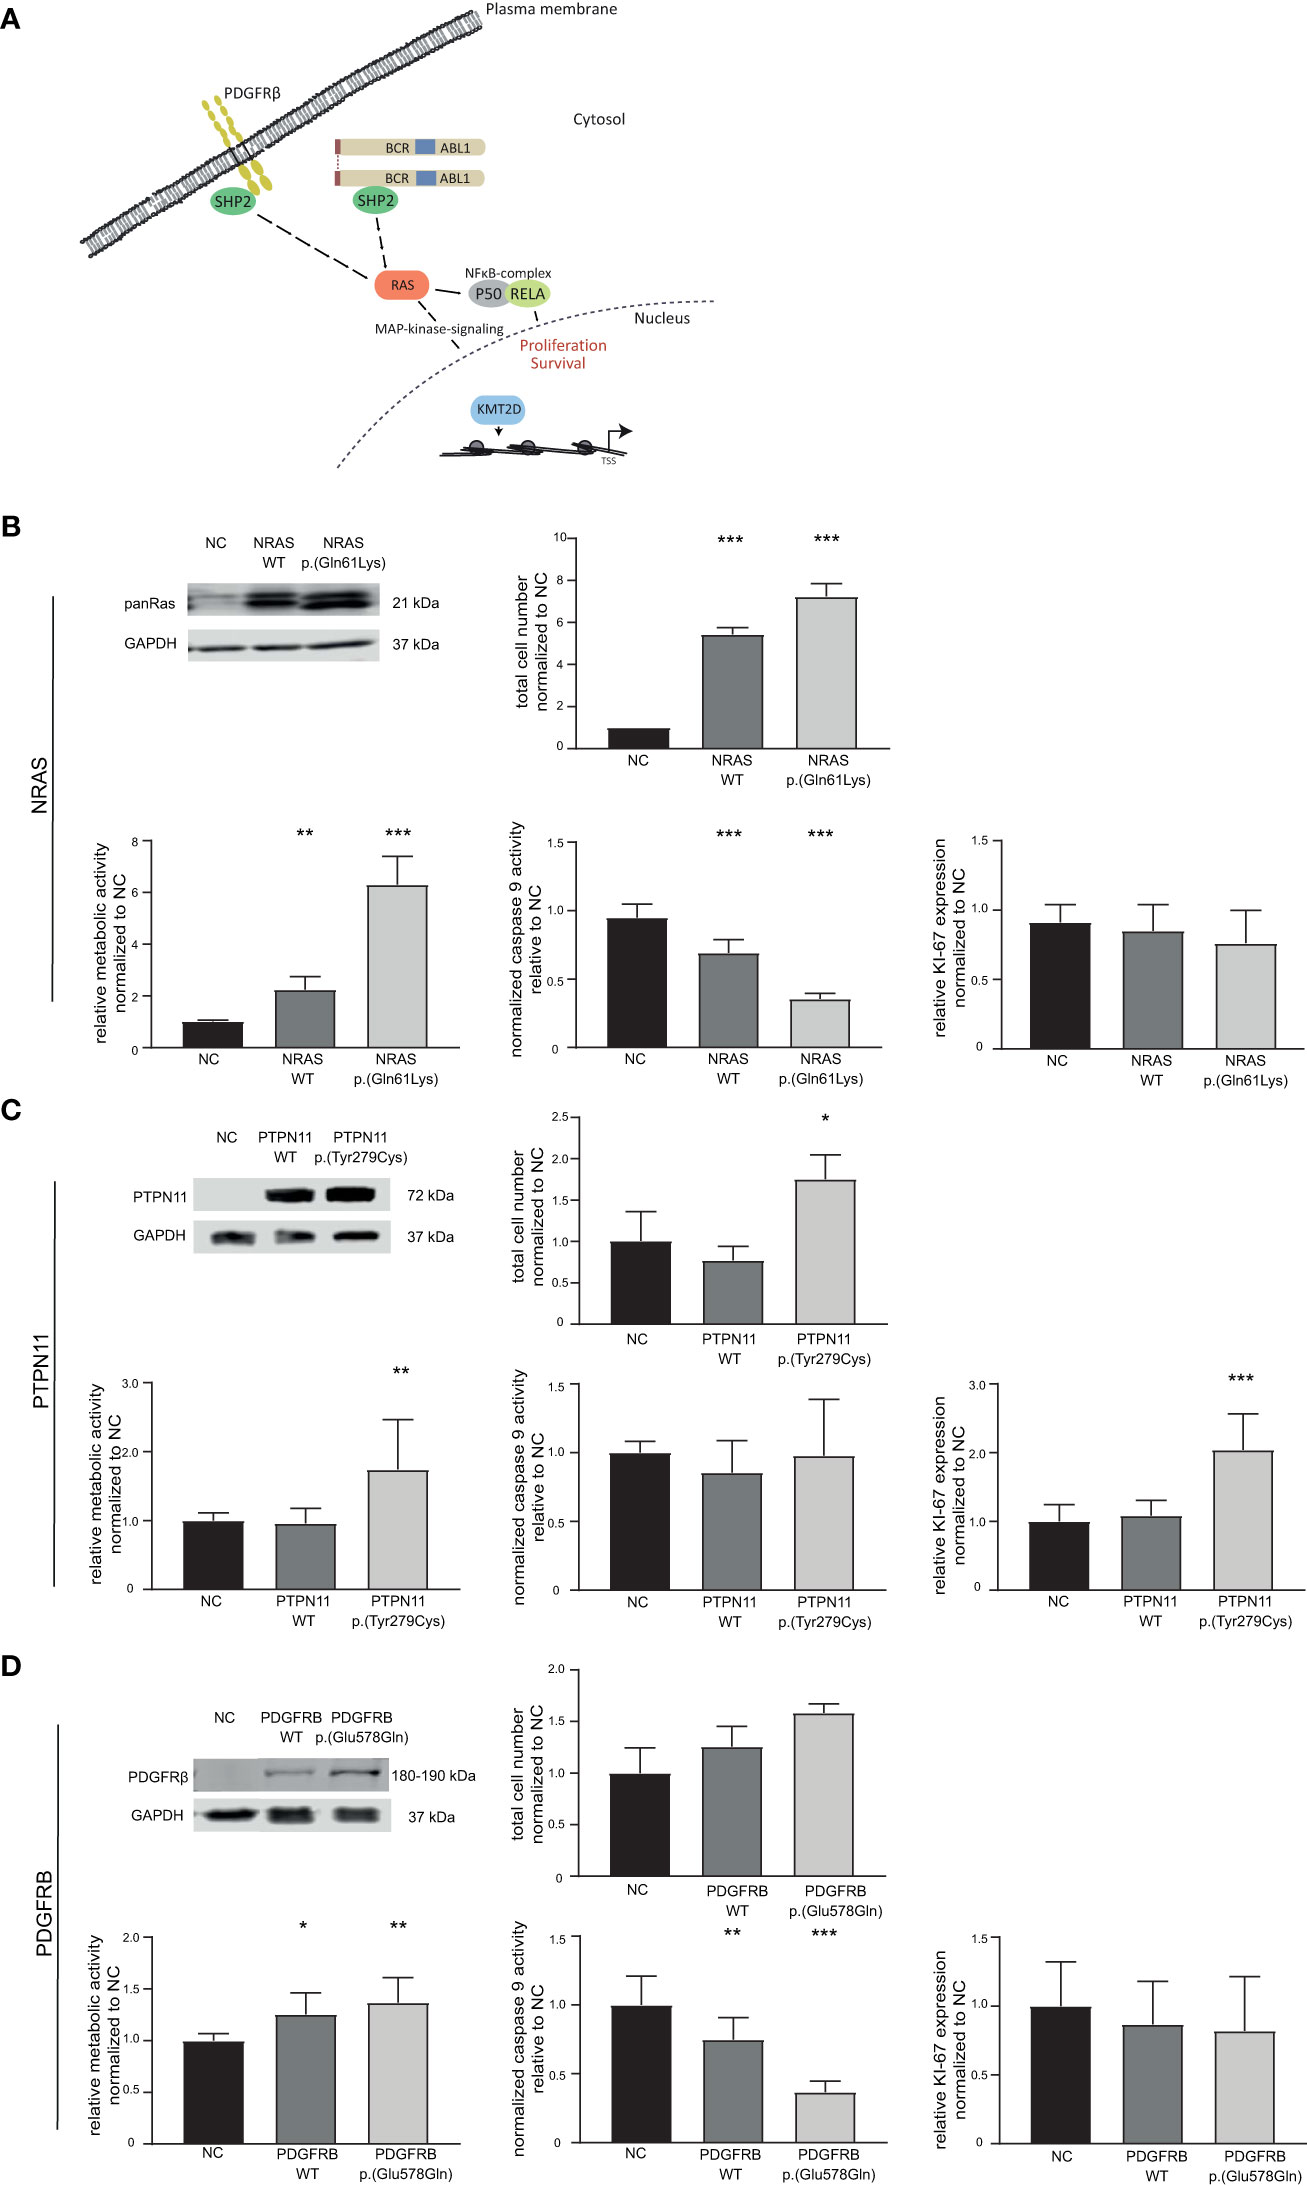
Figure 4 Effect of candidate variants NRAS p.(Gln61Lys), PTPN11 p.(Tyr279Cys) and PDGFRB p.(Glu578Gln) on the response to TKI treatment. (A) Graphical representation of the pathways affected by variants in the candidate genes NRAS/KRAS, PTPN11 (encoding SHP2), PDGFRB and KMT2D. (B–D) Top left: Western Blot of successful transfection of wild-type (WT) and variant into TKI-sensitive K-562 cells compared to GAPDH. Cellular fitness after WT and variant transfection and 48 h nilotinib exposure (0.1 µM) for (B) NRAS WT and p.(Gln61Lys), as well as imatinib exposure (2 µM) for (C) PTPN11 WT and p.(Tyr279Cys) and (D) PDGFRB WT and p.(Glu578Gln). Top right: Total cell number analyzed using trypan blue staining. Bottom left: Metabolic activity measured by WST assay. Bottom middle: Caspase 9 activity analyzed by caspase 9-Glo assay. Bottom right: Ki-67 expression to investigate cellular proliferation. Data was normalized to respective negative control (NC) and analyzed using Two-way ANOVA followed by Dunnett’s test. N = 3. Error bars indicate standard deviation. *p < 0.05, **p < 0.01, ***p < 0.001.
3.4 PTPN11 p.(Tyr279Cys), but not PDGFRB p.(Glu578Gln) promote the development of imatinib resistance
Using our established in vitro-analysis pipeline, we focused on the PTPN11 p.(Tyr279Cys) variant (IM-R2: VAF: 48%, Supplementary Table S3). Successful transfection of PTPN11 p.(Tyr279Cys) into sensitive K-562 cells led to an increase in cell number (1.7-fold, p = 0.03), accompanied by an increase in metabolic activity (1.7-fold, p = 0.005) and proliferation (2.0-fold, p < 0.001). Nevertheless, a change in apoptosis was not observed (Figure 4C).
PTPN11 p.(Tyr279Cys) is a well-known pathogenic germline variant associated with Leopard- and Noonan-syndrome (24, 25). However, this particular variant’s role in cancer and CML is widely unknown. To investigate the effect of PTPN11 p.(Tyr279Cys) in imatinib resistance and on the context-dependent protein function, first, PTPN11 expression was analyzed in the imatinib-resistant sublines showing no expression differences compared to TKI-sensitive K-562 cells (Supplementary Figure S3). As several studies indicated a loss of catalytic function for PTPN11 p.(Tyr279Cys) (26), we hypothesized that the observed effect could be due to altered phosphatase activity. To address this, TKI-sensitive K-562 cells were exposed to the PTPN11 inhibitor RMC-4450, and the effects on Ras-MAP-kinase signaling were analyzed on the level of ERK activation. As expected, PTPN11 inhibition reduced the phosphorylation of ERK (Supplementary Figure S4A). To investigate if PTPN11 blockade alters the response to imatinib, an siRNA-mediated knockdown of PTPN11 was performed to mimic reduced protein levels (Supplementary Figure S4B). The knockdown cells were subsequently exposed to imatinib resulting in decreased metabolic activity (-32%, p < 0.001) and BrdU incorporation (-33%, p = 0.02), while apoptosis was not altered (Supplementary Figure S4C). Moreover, PTPN11 inhibition was performed in the imatinib-resistant cell lines to investigate the extent of pathway addiction in these cells. Interestingly, PTPN11 inhibition only resulted in reduced ERK-phosphorylation in highIM-R2 (-1.3-fold, p = 0.04), but not in the other resistant sublines (Supplementary Figure S4D). The siRNA-mediated knockdown of PTPN11 in this cell line showed a slight decrease in imatinib susceptibility, as BrdU incorporation was 1.3-fold increased (p = 0.02), while metabolic activity and apoptosis were not altered (Supplementary Figures S4E, F).
As a further candidate variant, we analyzed PDGFRB p.(Glu578Gln), as PDGFRB is a well-known target of imatinib (IM-R2: VAF: 34%, Supplementary Table S3). Although overexpression of PDGFRB p.(Glu578Gln) did not lead to a significant increase in cell number, metabolic activity was increased (WT: 1.3-fold, p = 0.01; p.(Glu578Gln): 1.4-fold, p = 0.002) and caspase 9 activity reduced after WT and p.(Glu578Gln) transfection (WT: 25%, p = 0.007; p.(Glu578Gln): 74%, p < 0.001). Analyses of proliferation measured by Ki-67 expression did not reveal significant differences (Figure 4D).
Next, stably transfected cell lines expressing either PTPN11 WT or p.(Tyr279Cys), as well as PDGFRB WT or p.(Glu578Gln) were generated. These cell lines were exposed to low dose imatinib (0.1 to 0.3 µM) and the total cell number was analyzed during the development of imatinib resistance in a time-frame of 21 days (Figure 5). An increase in the cell number of PTPN11 p.(Tyr279Cys)-expressing cells were detected in all tested imatinib concentrations, while the other cell lines showed no differences compared to the negative control-transfected cells (Figure 5A). As PTPN11 p.(Tyr279Cys) seemed to promote an advantage for the cells during the development of imatinib resistance, proliferation and apoptosis in these cell lines after two weeks of exposure to the respective imatinib concentration was analyzed. Compared to WT and negative control-transfected cells, no significant increase in the proliferation of p.(Y279)-transfected cells was detected (Figure 5B). An imatinib dose-dependent effect was observed in WT-expressing cells on apoptosis (0.1 µM: -53%, p < 0.001; 0.2 µM: +40%, p < 0.001; 0.3 µM: -19%, p < 0.001), while cells harboring p.(Tyr279Cys) showed reduced apoptosis in 0.1 µM (74%, p < 0.001) and 0.2 µM imatinib-resistant cells (53%, p < 0.001), but not in resistance to 0.3 µM imatinib (Figure 5C).
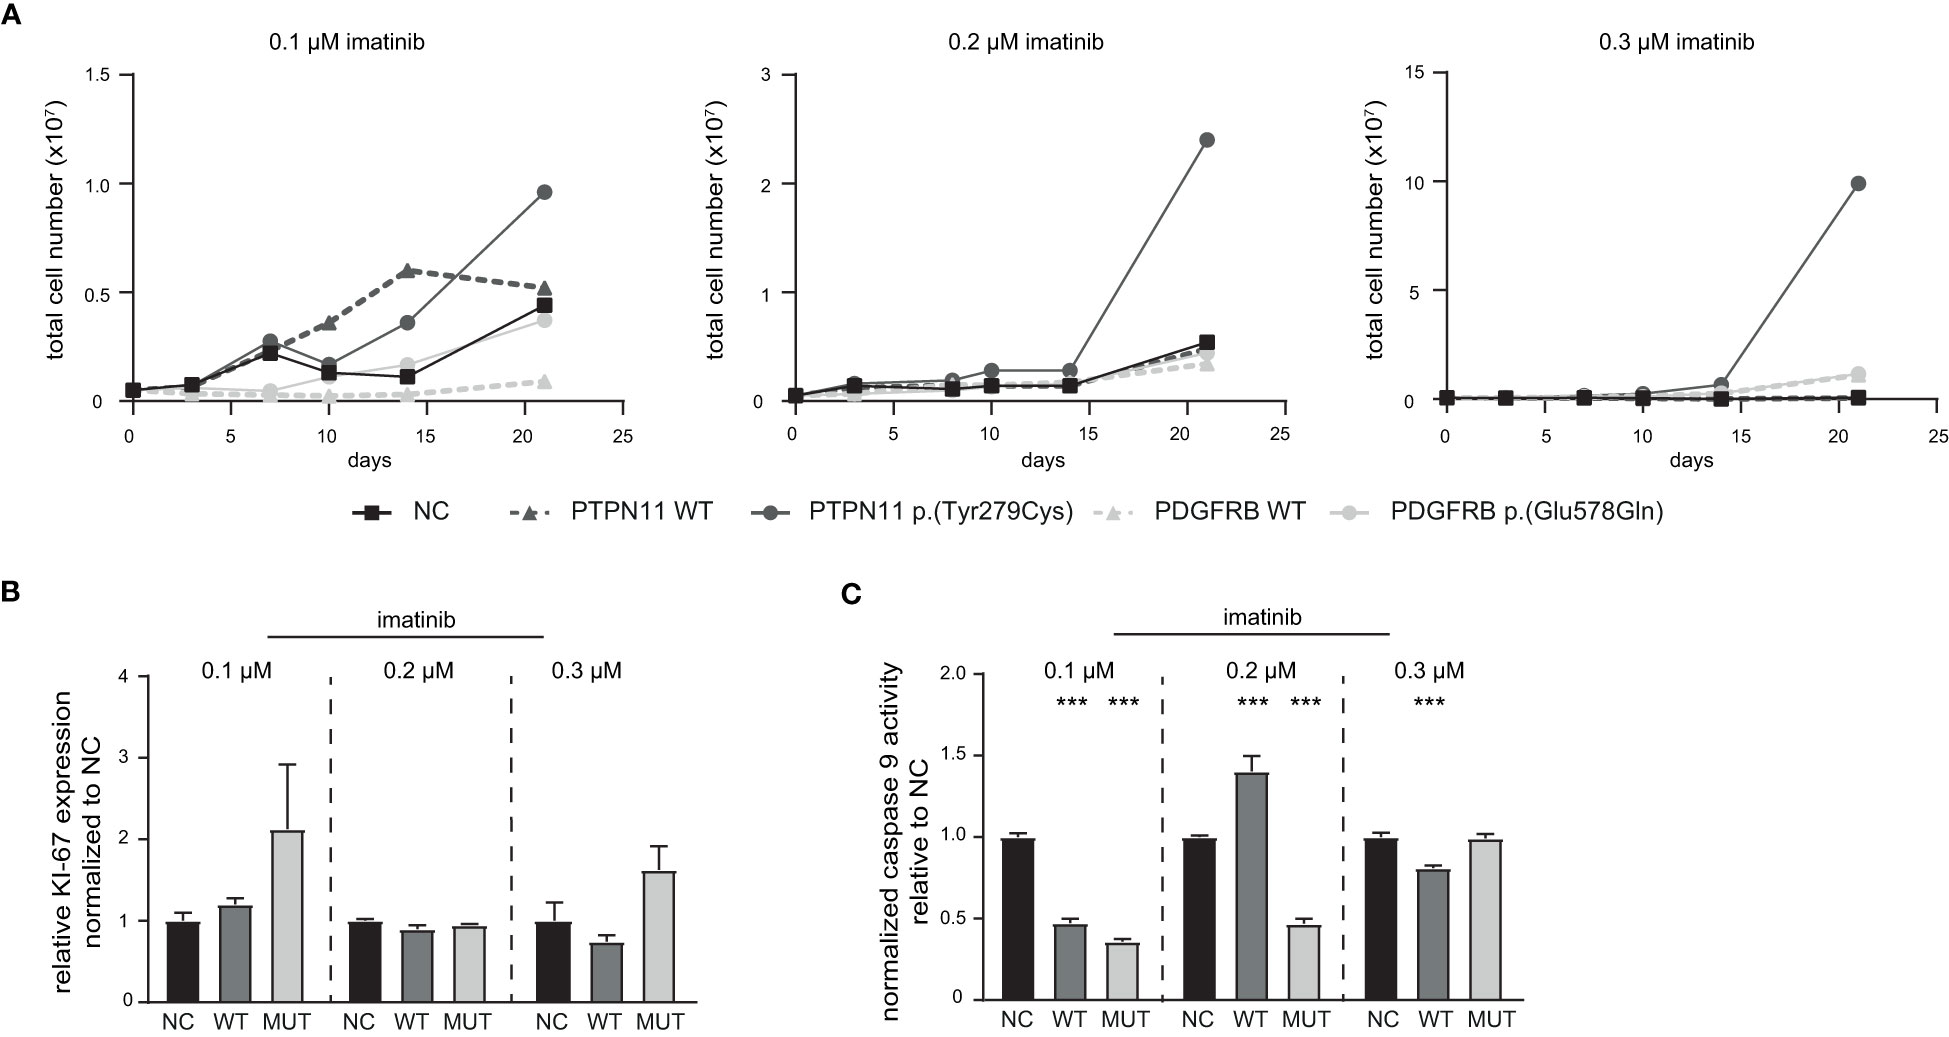
Figure 5 Influence of PTPN11 p.(Tyr279Cys) and PDGFRB p.(Glu578Gln) on the development of imatinib resistance. Stably transfected cells expressing either PTPN11 wild-type (WT), p.(Tyr279Cys), or PDGFRB WT or p.(Glu578Gln) were exposed to increasing concentrations of imatinib. (A) Cells were cultivated with the respective imatinib concentration and the total cell number was analyzed using trypan blue staining for 0.1, 0.2, and 0.3 µM imatinib within 21 days. Black: Negative control (NC); dark grey: PTPN11; light grey: PDGFRB; solid line: mutation; dashed line: WT. (B) Ki-67 expression to analyze proliferation and (C) Caspase 9 activity of PTPN11 WT and p.(Tyr279Cys) transfected cells after 21 days of treatment with the respective imatinib concentration measured by caspase 9-Glo assay. Data were normalized to NC. Statistical analysis was performed using two-way ANOVA followed by Dunnett’s test. N = 3. Error bars indicate standard deviation. ***p < 0.001.
4 Discussion
Tumor cells undergoing anti-cancer therapy underlie clonal evolution and selection, a major obstacle to successful treatment. In chronic myeloid leukemia, 20-25% of patients suffer from therapy failure within 5 years of TKI treatment (5). In half of the patients, mutations in the BCR::ABL1 kinase are detected, resulting in loss of TKI binding and, subsequently, resistance (4). For the other half of the patients, the resistance mechanisms are unknown. To generate insights into mechanisms of TKI resistance, an in vitro-TKI resistance model derived from TKI-sensitive K-562 CML cells during long-term drug exposure was established. For this purpose, biological replicates of imatinib and nilotinib resistance were generated obtaining sublines resistant against 0.5 and 2 µM imatinib, and 0.05 and 0.1 µM nilotinib, respectively. In CML patients, the imatinib plasma levels varied between 0.34 and 3.4 µM (27, 28). Thus, the imatinib concentrations of 0.5 and 2 µM were used to reflect the fluctuations. As nilotinib is known to have a 20-fold higher potency than imatinib (6), cells resistant to a maximum of 0.1 µM were used for the present study.
Large differences between the sublines were observed analyzing the mutational landscape of the TKI-resistant cell lines. The two cell lines harboring variants in the oncogene KRAS (highIM-R3, highIM-R4), showed a high similarity in the protein-protein interaction network compared to TKI-sensitive K-562 cells. These are likely to be addressed by the overall gained variants and are also visible in the gene expression profiles. Although the number of variants gradually increased during the development of imatinib resistance in both cell lines, in IM-R3 KRAS p.(Ala59Thr) accompanied by KMT2D p.(Arg191Trp) are likely to be crucial for resistance. In IM-R4, the combination of the well-known KRAS p.(Gly12Asp) mutation and a low-frequency mutation in ABL p.(Glu274Lys) are possibly central for resistance. Consistent with these results, RAS mutations are known to be tumor driver variants in myeloid neoplasia and have also been identified in CML patients with therapy failure (29, 30). However, with an incidence of only 5%, mutations in RAS seem to be a rare event in chronic myeloid leukemia (29, 31). In general, the KRAS-mutated cells showed a similar network propagation cluster compared to TKI-sensitive cells pointing to restored Ras-MAP-kinase signaling being the underlying resistance mechanisms.
In N-R2, the NRAS p.(Gln61Lys) mutation apparently occurs early during the development of nilotinib resistance. This well-known mutation occurs in 13-25% malignant melanoma and 1-6% colorectal cancer patients, but also other tumors harbor this mutation, e.g., neuroblastoma, non-small cell lung cancer or leukemia (32). However, the pattern of NRAS mutations in leukemia varies widely from solid tumors with a predominance for the observed p.(Gln61) (38%) and p.(Gly12) (36%) missense mutations (29, 33). The p.(Gln61Lys) mutation leads to constitutive NRAS activation. It is the reason for therapy failure, as observed, e.g., for epidermal growth factor receptor (EGFR) inhibition, which makes alternative therapies necessary (34). We found that expression of NRAS p.(Gln61Lys) promotes survival of CML cells under TKI exposure by reduction of apoptosis and increased cell viability, showing that this mutation is likely the main cause of resistance of our nilotinib-resistant subline N-R2. As NRAS p.(Gln61Lys) is already present in lowN and provides a strong benefit for the clones harboring this mutation, this indicates clonal selection and might also be a reason for the quite low overall number of mutations in this resistant subline compared to the other cell lines. Overall, these findings show that our in vitro-CML drug resistance model is suitable for detecting genetic aberrations promoting TKI resistance, among them pathogenic variants that have already been detected in other tumor entities. Therefore, we used the established analysis pipeline to investigate further candidate mutations.
Similar to N-R2, the overall number of acquired variants was quite low for IM-R2. Although the PTPN11 p.(Tyr279Cys) and PDGFRB p.(Glu578Gln) variants were acquired in the late development of TKI resistance in highIM-R2, the allele frequencies were high in this cell line. This indicates a benefit for the clones harboring these variants. PTPN11/SHP2 is a non-receptor phosphatase involved in fine-tuning of cell signaling by binding to its adaptor proteins Grb2 and Gab1 and is considered a positive regulator of RAS signaling (35). PTPN11 germline variants are present in 50% of patients suffering from Noonan-syndrome, an autosomal dominant disorder associated with heart failure and facial dysmorphia (25), or Leopard syndrome, a genetic disease mainly leading to heart and skin anomalies (24). In about 85% of patients, missense variants in PTPN11 are observed, including the variant p.(Tyr279Cys), as detected in the present study. Further, somatic PTPN11 variants occur in 34% of juvenile myelomonocytic leukemia and were also detected in other myelodysplastic syndromes, yet to a smaller extent (36). The main observed variants in PTPN11 affect residues in the N-terminal Src homology (N-SH2) or the protein tyrosine phosphatase (PTP) domain interacting surface and likely result in a gain of function. This led to the description of PTPN11 as an atypical phosphatase with oncogenic properties, which makes PTPN11 a suitable target for cancer therapy (36, 37). It was shown that inhibition of PTPN11 might be an effective strategy to overcome NRAS-dependent resistance in neuroblastoma or KIT-induced myeloproliferative diseases (38, 39).
In the present study, a decreased imatinib response in the presence of PTPN11 p.(Tyr279Cys) was observed with increased proliferation rates. In CML, PTPN11 variant (NM_002834.5:c.1529A>T) p.(Gln510Leu), which is also a known variant in Noonan-syndrome (RCV001261023.1), was detected in a patient suffering from blast crisis after 10 years of TKI treatment (40). Further, it was demonstrated that PTPN11 is necessary for BCR::ABL1-induced hematologic neoplasms, as its deletion compromised induction of CML in mice (41). In a study in K-562 cells, it was shown that PTPN11 phosphorylation is induced during imatinib exposure as well as resistance and PTPN11 inhibition is able to restore TKI response (42). However, for p.(Tyr279Cys) in Leopard syndrome, a loss of catalytic activity was demonstrated (26, 43). It is likely that the observed variant in PTPN11 results in an alteration of the phosphatase activity, which contributes to the development of TKI resistance. Nevertheless, further studies are necessary to investigate the effect of PTPN11 p.(Tyr279Cys) in more detail. The relevance of PTPN11 in CML is also stressed by findings on CD34+ CML stem cells harboring the pathogenic PTPN11 p.(Gly60Val) resulting in sustained Ras-MAP-signaling pathway activation. Interestingly, the resistance in these cells could be overcome by synergistic usage of TKIs and integrated stress response inhibitors that prevent the cellular response to the external and internal stress stimuli, such as imatinib (44). This could be a very promising approach in TKI-resistant CML patients.
We detected the PDGFRB p.(Glu578Gln) variant in the same imatinib-resistant subline. This tyrosine kinase is a known target of imatinib and is implicated in multiple diseases, e.g., dermatofibrosarcoma protuberans or myofibromatosis (45). Several variants, but also genetic rearrangements, in PDGFRB were shown to be associated with TKI resistance (46). The observed p.(Glu578Gln) variant is located in the juxtamembrane portion of the protein and has not been described yet. Interestingly, it was shown that PTPN11 can suppress transformation induced by PDGFRB, suggesting a strong link between these two proteins (47). Therefore, it can be hypothesized that the two variants in PDGFRB and PTPN11 can circumvent imatinib-induced BCR::ABL1 inhibition and contribute to the manifestation of TKI resistance. Thus, monitoring of variants in these genes should be performed in TKI-relapsed CML patients.
For IM-R1 and N-R1, no clear candidate driver variants were observed. Moreover, these cells clustered apart from the other cell lines in the network propagation. Potentially, the clones have a diverse mechanism of resistance which is reflected by a diverse pattern of variants. As previously mentioned, CML resistance occurs either due to BCR::ABL1-dependent or -independent mechanisms. It is widely known that especially mutations in BCR::ABL1 affect TKI-response and lead to relapse due to the uprising of mutated clones (48). Beyond BCR::ABL1, variants in the epigenetic modulator DNA (cytosine-5)-methyltransferase 3A (DNMT3A), the polycomb group protein additional sex comb-like 1 (ASXL1), runt-related transcription factor 1 (RUNX1) and Tet methylcytosine dioxygenase 2 (TET2) were shown to be associated with therapy failure indicating defective epigenetic DNA regulation in TKI-resistant CML as already described for other myeloproliferative syndromes (12, 49–51). In the present study, we did not detect variants in these genes but identified several putative candidate genes that likely contribute to TKI resistance. With NRAS, KRAS, PTPN11, and KMT2D, we detected variants in genes that were shown to be mutated in low frequencies in blast crisis, but to a lower extent also in chronic phase CML (52). These findings suggest an NGS-based screening of TKI-resistant patients without BCR::ABL1 mutations to identify potential variants responsible for therapy failure. Either detected variants or the altered downstream pathways could be future therapeutic options to be targeted by synergistic approaches to overcome TKI resistance.
In conclusion, the TKI-resistant sublines newly acquired candidate driver mutations, especially the well-known NRAS p.(Gln61Lys), KRAS p.(Ala59Thr) and p.(Gly12Asp), but also PTPN11 p.(Tyr279Cys) affected the same signaling pathway. The gain of these variants likely explains the main mechanism resistance in the respective cell lines. It shows that such models are potentially useful to get insight into mechanisms of drug resistance and to find novel tumor driver genes or novel driver mutations. This knowledge can be used to better interpret TKI resistance in patients and, vice versa, our in vitro-model can be used to analyze and assess mutations observed in resistant patients. This strategy can open new options for the development of new therapy strategies.
Data availability statement
The datasets presented in this study can be found in online repositories. The whole exome sequencing data of TKI-resistant cell lines have been submitted to the European Nucleotide Archive (ENA) and is publicly available under accession number PRJEB60565. Genome-wide expression datasets are available in the GEO repository GSE227347.
Author contributions
MK and IN conceptualized the study and designed the research. PO and SV performed the experiments. AK, DE, MM, IV, MK, and IN analyzed the data. MK and IN interpreted the data. HB, MS and IC provided methodology. MK and IN wrote the original draft. All authors read and approved the final version of the manuscript.
Funding
This study was funded by a grant from the Medical Faculty of the University of Kiel. HB acknowledges funding by the Deutsche Forschungsgemeinschaft (DFG, German Research Foundation) under Germany’s Excellence Strategy – EXC22167-390884018.
Acknowledgments
We thank Irina Naujoks, Anna Jürgensen and Britta Schwarten for outstanding technical assistance. We thank the Institute of Clinical Molecular Biology in Kiel for providing Sanger sequencing, as partly supported by the DFG Clusters of Excellence “Precision Medicine in Chronic Inflammation” and “ROOTS”. We thank Claudia Becher from the Institute of Human Genetics in Kiel for her technical assistance. AK thanks the computational support from the OMICS compute cluster at the University of Lübeck.
Conflict of interest
The authors declare that the research was conducted in the absence of any commercial or financial relationships that could be construed as a potential conflict of interest.
Publisher’s note
All claims expressed in this article are solely those of the authors and do not necessarily represent those of their affiliated organizations, or those of the publisher, the editors and the reviewers. Any product that may be evaluated in this article, or claim that may be made by its manufacturer, is not guaranteed or endorsed by the publisher.
Supplementary material
The Supplementary Material for this article can be found online at: https://www.frontiersin.org/articles/10.3389/fonc.2023.1200897/full#supplementary-material
References
1. Luchini C, Lawlor RT, Milella M, Scarpa A. Molecular tumor boards in clinical practice. Trends Cancer (2020) 6:738–44. doi: 10.1016/j.trecan.2020.05.008
2. Deininger MW, Goldman JM, Melo JV. The molecular biology of chronic myeloid leukemia. Blood (2000) 96:3343–56. doi: 10.1182/blood.V96.10.3343
3. Druker BJ, Guilhot F, O’brien SG, Gathmann I, Kantarjian H, Gattermann N, et al. Five-year follow-up of patients receiving imatinib for chronic myeloid leukemia. N Engl J Med (2006) 355:2408–17. doi: 10.1056/NEJMoa062867
4. Milojkovic D, Apperley J. Mechanisms of resistance to imatinib and second-generation tyrosine inhibitors in chronic myeloid leukemia. Clin Cancer Res (2009) 15:7519–27. doi: 10.1158/1078-0432.CCR-09-1068
5. Hochhaus A, Larson RA, Guilhot F, Radich JP, Branford S, Hughes TP, et al. Long-term outcomes of imatinib treatment for chronic myeloid leukemia. N Engl J Med (2017) 376:917–27. doi: 10.1056/NEJMoa1609324
6. Baccarani M, Deininger MW, Rosti G, Hochhaus A, Soverini S, Apperley JF, et al. European LeukemiaNet recommendations for the management of chronic myeloid leukemia: 2013. Blood (2013) 122:872–84. doi: 10.1182/blood-2013-05-501569
7. Soverini S, De Benedittis C, Papayannidis C, Paolini S, Venturi C, Iacobucci I, et al. Drug resistance and BCR-ABL kinase domain mutations in Philadelphia chromosome-positive acute lymphoblastic leukemia from the imatinib to the second-generation tyrosine kinase inhibitor era: the main changes are in the type of mutations, but not in the frequency of mutation involvement. Cancer (2014) 120:1002–9. doi: 10.1002/cncr.28522
8. Zabriskie MS, Eide CA, Tantravahi SK, Vellore NA, Estrada J, Nicolini FE, et al. BCR-ABL1 compound mutations combining key kinase domain positions confer clinical resistance to ponatinib in ph chromosome-positive leukemia. Cancer Cell (2014) 26:428–42. doi: 10.1016/j.ccr.2014.07.006
9. Bixby D, Talpaz M. Seeking the causes and solutions to imatinib-resistance in chronic myeloid leukemia. Leukemia (2011) 25:7–22. doi: 10.1038/leu.2010.238
10. Kaehler M, Cascorbi I. Pharmacogenomics of impaired tyrosine kinase inhibitor response: lessons learned from chronic myelogenous leukemia. Front Pharmacol (2021) 12:696960. doi: 10.3389/fphar.2021.696960
11. Eiring AM, Deininger MW. Individualizing kinase-targeted cancer therapy: the paradigm of chronic myeloid leukemia. Genome Biol (2014) 15:461. doi: 10.1186/s13059-014-0461-8
12. Schmidt M, Rinke J, Schafer V, Schnittger S, Kohlmann A, Obstfelder E, et al. Molecular-defined clonal evolution in patients with chronic myeloid leukemia independent of the BCR-ABL status. Leukemia (2014) 28:2292–9. doi: 10.1038/leu.2014.272
13. Mirabelli P, Coppola L, Salvatore M. Cancer cell lines are useful model systems for medical research. Cancers (Basel) (2019) 11:1098. doi: 10.3390/cancers11081098
14. Lozzio CB, Lozzio BB. Human chronic myelogenous leukemia cell-line with positive Philadelphia chromosome. Blood (1975) 45:321–34. doi: 10.1182/blood.V45.3.321.321
15. Turrini E, Haenisch S, Laechelt S, Diewock T, Bruhn O, Cascorbi I. MicroRNA profiling in K-562 cells under imatinib treatment: influence of miR-212 and miR-328 on ABCG2 expression. Pharmacogenet Genomics (2012) 22:198–205. doi: 10.1097/FPC.0b013e328350012b
16. Kaehler M, Litterst M, Kolarova J, Bohm R, Bruckmueller H, Ammerpohl O, et al. Genome-wide expression and methylation analyses reveal aberrant cell adhesion signaling in tyrosine kinase inhibitor-resistant CML cells. Oncol Rep (2022) 48:144. doi: 10.3892/or.2022.8355
17. Kunstner A, Schwarting J, Witte HM, Bernard V, Stolting S, Kusch K, et al. Integrative molecular profiling identifies two molecularly and clinically distinct subtypes of blastic plasmacytoid dendritic cell neoplasm. Blood Cancer J (2022) 12:101. doi: 10.1038/s41408-022-00699-1
18. Kaehler M, Dworschak M, Rodin JP, Ruemenapp J, Vater I, Penas EMM, et al. Zfp36l1 plays an ambiguous role in the regulation of cell expansion and negatively regulates Cdkn1a in chronic myeloid leukemia cells. Exp Hematol (2021) 99:54–64. doi: 10.1016/j.exphem.2021.05.006
19. Kaehler M, Ruemenapp J, Gonnermann D, Nagel I, Bruhn O, Haenisch S, et al. MicroRNA-212/ABCG2-axis contributes to development of imatinib-resistance in leukemic cells. Oncotarget (2017) 8:92018–31. doi: 10.18632/oncotarget.21272
20. Waetzig V, Haeusgen W, Andres C, Frehse S, Reinecke K, Bruckmueller H, et al. Retinoic acid-induced survival effects in SH-SY5Y neuroblastoma cells. J Cell Biochem (2019) 120:5974–86. doi: 10.1002/jcb.27885
21. Menche J, Sharma A, Kitsak M, Ghiassian SD, Vidal M, Loscalzo J, et al. Disease networks. uncovering disease-disease relationships through the incomplete interactome. Science (2015) 347:1257601. doi: 10.1126/science.1257601
22. Cowen L, Ideker T, Raphael BJ, Sharan R. Network propagation: a universal amplifier of genetic associations. Nat Rev Genet (2017) 18:551–62. doi: 10.1038/nrg.2017.38
23. Martinez-Jimenez F, Muinos F, Sentis I, Deu-Pons J, Reyes-Salazar I, Arnedo-Pac C, et al. A compendium of mutational cancer driver genes. Nat Rev Cancer (2020) 20:555–72. doi: 10.1038/s41568-020-0290-x
24. Sarkozy A, Digilio MC, Dallapiccola B. Leopard syndrome. Orphanet J Rare Dis (2008) 3:13. doi: 10.1186/1750-1172-3-13
25. El Bouchikhi I, Belhassan K, Moufid FZ, Iraqui Houssaini M, Bouguenouch L, Samri I, et al. Noonan syndrome-causing genes: molecular update and an assessment of the mutation rate. Int J Pediatr Adolesc Med (2016) 3:133–42. doi: 10.1016/j.ijpam.2016.06.003
26. Tartaglia M, Martinelli S, Stella L, Bocchinfuso G, Flex E, Cordeddu V, et al. Diversity and functional consequences of germline and somatic PTPN11 mutations in human disease. Am J Hum Genet (2006) 78:279–90. doi: 10.1086/499925
27. Leveque D, Maloisel F. Clinical pharmacokinetics of imatinib mesylate. In Vivo (Athens Greece) (2005) 19:77–84. doi: 10.2165/00003088-200544090-00001
28. Picard S, Titier K, Etienne G, Teilhet E, Ducint D, Bernard MA, et al. Trough imatinib plasma levels are associated with both cytogenetic and molecular responses to standard-dose imatinib in chronic myeloid leukemia. Blood (2007) 109:3496–9. doi: 10.1182/blood-2006-07-036012
29. Fernandez-Medarde A, Santos E. Ras in cancer and developmental diseases. Genes Cancer (2011) 2:344–58. doi: 10.1177/1947601911411084
30. Waanders E, Gu Z, Dobson SM, Antic Z, Crawford JC, Ma X, et al. Mutational landscape and patterns of clonal evolution in relapsed pediatric acute lymphoblastic leukemia. Blood Cancer Discovery (2020) 1:96–111. doi: 10.1158/0008-5472.BCD-19-0041
31. Ouerhani S, Bougatef K, Soltani I, Elgaaied AB, Abbes S, Menif S. The prevalence and prognostic significance of KRAS mutation in bladder cancer, chronic myeloid leukemia and colorectal cancer. Mol Biol Rep (2013) 40:4109–14. doi: 10.1007/s11033-013-2512-8
32. De Roock W, De Vriendt V, Normanno N, Ciardiello F, Tejpar S. KRAS, BRAF, PIK3CA, and PTEN mutations: implications for targeted therapies in metastatic colorectal cancer. Lancet Oncol (2011) 12:594–603. doi: 10.1016/S1470-2045(10)70209-6
33. Munoz-Maldonado C, Zimmer Y, Medova M. A comparative analysis of individual RAS mutations in cancer biology. Front Oncol (2019) 9:1088. doi: 10.3389/fonc.2019.01088
34. De Roock W, Claes B, Bernasconi D, De Schutter J, Biesmans B, Fountzilas G, et al. Effects of KRAS, BRAF, NRAS, and PIK3CA mutations on the efficacy of cetuximab plus chemotherapy in chemotherapy-refractory metastatic colorectal cancer: a retrospective consortium analysis. Lancet Oncol (2010) 11:753–62. doi: 10.1016/S1470-2045(10)70130-3
35. Shi ZQ, Yu DH, Park M, Marshall M, Feng GS. Molecular mechanism for the shp-2 tyrosine phosphatase function in promoting growth factor stimulation of erk activity. Mol Cell Biol (2000) 20:1526–36. doi: 10.1128/MCB.20.5.1526-1536.2000
36. Tartaglia M, Niemeyer CM, Fragale A, Song X, Buechner J, Jung A, et al. Somatic mutations in PTPN11 in juvenile myelomonocytic leukemia, myelodysplastic syndromes and acute myeloid leukemia. Nat Genet (2003) 34:148–50. doi: 10.1038/ng1156
37. Liu Q, Qu J, Zhao M, Xu Q, Sun Y. Targeting SHP2 as a promising strategy for cancer immunotherapy. Pharmacol Res (2020) 152:104595. doi: 10.1016/j.phrs.2019.104595
38. Mali RS, Ma P, Zeng LF, Martin H, Ramdas B, He Y, et al. Role of SHP2 phosphatase in KIT-induced transformation: identification of SHP2 as a druggable target in diseases involving oncogenic KIT. Blood (2012) 120:2669–78. doi: 10.1182/blood-2011-08-375873
39. Valencia-Sama I, Ladumor Y, Kee L, Adderley T, Christopher G, Robinson CM, et al. NRAS status determines sensitivity to SHP2 inhibitor combination therapies targeting the RAS-MAPK pathway in neuroblastoma. Cancer Res (2020) 80:3413–23. doi: 10.1158/0008-5472.CAN-19-3822
40. Sklarz LM, Wittke C, Krohn S, GROßE-Thie C, Junghanss C, Murua Escobar H, et al. Genetic mutations in a patient with chronic myeloid leukemia showing blast crisis 10 years after presentation. Anticancer Res (2018) 38:3961–6. doi: 10.21873/anticanres.12682
41. Gu S, Sayad A, Chan G, Yang W, Lu Z, Virtanen C, et al. SHP2 is required for BCR-ABL1-induced hematologic neoplasia. Leukemia (2018) 32:203–13. doi: 10.1038/leu.2017.250
42. Li X, Pang J, Xue W, Wang Y, Tian T, Elgehama A, et al. Inducible SHP-2 activation confers resistance to imatinib in drug-tolerant chronic myeloid leukemia cells. Toxicol Appl Pharmacol (2018) 360:249–56. doi: 10.1016/j.taap.2018.09.044
43. Liu WS, Wang RR, Li WY, Rong M, Liu CL, Ma Y, et al. Investigating the reason for loss-of-function of src homology 2 domain-containing protein tyrosine phosphatase 2 (SHP2) caused by Y279C mutation through molecular dynamics simulation. J Biomol Struct Dyn (2020) 38:2509–20. doi: 10.1080/07391102.2019.1634641
44. Dudka W, Hoser G, Mondal SS, Turos-Korgul L, Swatler J, Kusio-Kobialka M, et al. Targeting integrated stress response with ISRIB combined with imatinib treatment attenuates RAS/RAF/MAPK and STAT5 signaling and eradicates chronic myeloid leukemia cells. BMC Cancer (2022) 22:1254. doi: 10.1186/s12885-022-10289-w
45. Moura D, De Oliveira JRM. The master of puppets: pleiotropy of PDGFRB and its relationship to multiple diseases. J Mol Neurosci (2020) 70:2102–6. doi: 10.1007/s12031-020-01618-4
46. Bastie JN, Garcia I, Terre C, Cross NC, Mahon FX, Castaigne S. Lack of response to imatinib mesylate in a patient with accelerated phase myeloproliferative disorder with rearrangement of the platelet-derived growth factor receptor beta-gene. Haematologica (2004) 89:1263–4.
47. Jazayeri A, Mcgee J, Shimamura T, Cross SB, Bejcek BE. SHP-2 can suppress transformation induced by platelet-derived growth factor. Exp Cell Res (2000) 254:197–203. doi: 10.1006/excr.1999.4741
48. Von Bubnoff N, Schneller F, Peschel C, Duyster J. BCR-ABL gene mutations in relation to clinical resistance of Philadelphia-chromosome-positive leukaemia to STI571: a prospective study. Lancet (2002) 359:487–91. doi: 10.1016/S0140-6736(02)07679-1
49. Delhommeau F, Dupont S, Della Valle V, James C, Trannoy S, Masse A, et al. Mutation in TET2 in myeloid cancers. N Engl J Med (2009) 360:2289–301. doi: 10.1056/NEJMoa0810069
50. Asada S, Fujino T, Goyama S, Kitamura T. The role of ASXL1 in hematopoiesis and myeloid malignancies. Cell Mol Life Sci (2019) 76:2511–23. doi: 10.1007/s00018-019-03084-7
51. Ochi Y, Yoshida K, Huang YJ, Kuo MC, Nannya Y, Sasaki K, et al. Clonal evolution and clinical implications of genetic abnormalities in blastic transformation of chronic myeloid leukaemia. Nat Commun (2021) 12:2833. doi: 10.1038/s41467-021-23097-w
Keywords: chronic myeloid leukemia, drug resistance, imatinib, nilotinib, PTPN11, PDGFRB, NRAS, KRAS
Citation: Kaehler M, Osteresch P, Künstner A, Vieth SJ, Esser D, Möller M, Busch H, Vater I, Spielmann M, Cascorbi I and Nagel I (2023) Clonal evolution in tyrosine kinase inhibitor-resistance: lessons from in vitro-models. Front. Oncol. 13:1200897. doi: 10.3389/fonc.2023.1200897
Received: 05 April 2023; Accepted: 24 May 2023;
Published: 13 June 2023.
Edited by:
Chung Hoow Kok, University of Adelaide, AustraliaReviewed by:
Ahmet Emre Eskazan, Istanbul University-Cerrahpasa, TürkiyeJignesh D. Dalal, Case Western Reserve University, United States
Mario Tiribelli, University of Udine, Italy
Copyright © 2023 Kaehler, Osteresch, Künstner, Vieth, Esser, Möller, Busch, Vater, Spielmann, Cascorbi and Nagel. This is an open-access article distributed under the terms of the Creative Commons Attribution License (CC BY). The use, distribution or reproduction in other forums is permitted, provided the original author(s) and the copyright owner(s) are credited and that the original publication in this journal is cited, in accordance with accepted academic practice. No use, distribution or reproduction is permitted which does not comply with these terms.
*Correspondence: Ingolf Cascorbi, Y2FzY29yYmlAcGhhcm1ha29sb2dpZS51bmkta2llbC5kZQ==