 Mengchao Xue
 Rongyang Li
 Kun Wang
 Zheng Ma
 Hui Tian
95% of researchers rate our articles as excellent or good
Learn more about the work of our research integrity team to safeguard the quality of each article we publish.
Find out more
ORIGINAL RESEARCH article
Front. Oncol. , 18 September 2023
Sec. Thoracic Oncology
Volume 13 - 2023 | https://doi.org/10.3389/fonc.2023.1196778
This article is part of the Research Topic Imaging in Non-Small Cell Lung Cancer vol. II View all 9 articles
Background: At present, how to identify the benign or malignant nature of small (≤ 2 cm) solitary pulmonary nodules (SPN) are an urgent clinical challenge. This retrospective study aimed to develop a clinical prediction model combining clinical and radiological characteristics for assessing the probability of malignancy in SPNs measuring ≤ 2 cm.
Method: In this study, we included patients with SPNs measuring ≤ 2 cm who underwent pulmonary resection with definite pathology at Qilu Hospital of Shandong University from January 2020 to December 2021. Clinical features, preoperative biomarker results, and computed tomography characteristics were collected. The enrolled patients were randomized at a ratio of 7:3 into a training cohort of 775 and a validation cohort of 331. The training cohort was used to construct the predictive model, while the validation cohort was used to test the model independently. Univariate and multivariate logistic regression analyses were performed to identify independent risk factors. The prediction model and nomogram were established based on the independent risk factors. The receiver operating characteristic (ROC) curve was used to evaluate the identification ability of the model. The calibration power was evaluated using the Hosmer–Lemeshow test and calibration curve. The clinical utility of the nomogram was also assessed by decision curve analysis (DCA).
Result: A total of 1,106 patients were included in this study. Among them, the malignancy rate of SPNs was 85.08% (941/1,106). We finally identified the following six independent risk factors by logistic regression: age, carcinoembryonic antigen, nodule shape, calcification, maximum diameter, and consolidation-to-tumor ratio. The area under the ROC curve (AUC) for the training cohort was 0.764 (95% confidence interval [CI]: 0.714–0.814), and the AUC for the validation cohort was 0.729 (95% CI: 0.647–0.811), indicating that the prediction accuracy of nomogram was relatively good. The calibration curve of the predictive model also demonstrated a good calibration in both cohorts. DCA proved that the clinical prediction model was useful in clinical practice.
Conclusion: We developed and validated a predictive model and nomogram for estimating the probability of malignancy in SPNs measuring ≤ 2 cm. With the application of predictive models, thoracic surgeons can make more rational clinical decisions while avoiding overtreatment and wasting medical resources.
With the development and popularity of high-resolution computed tomography (HRCT) as a dominating approach for lung cancer screening, the detection rate of isolated solitary pulmonary nodules (SPNs) has significantly increased in recent years (1–3). Large sample sizes of lung cancer screening trials have shown that the detection rate of SPNs ranges from 8 to 51%, with the vast majority being approximately 20% (4). An SPN is defined as a single, focal, round, hyperdense lung shadow ≤ 3 cm in diameter, surrounded by the lung parenchyma, without pulmonary atelectasis, lymph node enlargement, or pleural effusion (5, 6). Among them, an SPN with a size ≤ 20 mm is defined as small SPN (7). Although SPN size is an independent risk factor for malignancy (8–10), approximately 67.5–78% of small SPNs are malignant (7). The ability to accurately distinguish the degree of malignancy of an SPN is critical to providing patients with more beneficial and personalized treatment, which is currently a research hotspot and difficult area of clinical work (11).
Screening for lung cancer using low-dose computed tomography is an effective modality that can reduce mortality from lung cancer (12, 13). However, the qualitative diagnosis of SPNs measuring ≤ 2 cm remains a challenge for thoracic surgeons. The fact that the pathological results of small SPNs are usually confirmed by invasive or minimally invasive methods imposes a heavy burden on patients and healthcare systems (14). Therefore, a non-invasive method to identify benign and malignant SPNs is highly beneficial to clinical practice. At present, many factors have been identified to help determine the nature of SPNs before surgery. For example, previous studies have demonstrated the value of combined cytokine and tumor marker assays for the differential diagnosis of benign and malignant SPNs, which can improve the accuracy of early lung cancer diagnosis (15–23). Radiological characteristics, such as consolidation-to-tumor ratio (CTR), nodule diameter, presence of spiculation, and location in the lobe, are also increasingly used in the diagnosis of early lung cancer (9, 24–26). Among them, CTR has been a hotspot in lung cancer imaging research in recent years. Many studies have also confirmed that it can be used as the main reference index for judging the malignancy of early lung cancer and for sub-lobar resection, and it is also an independent correlate of recurrence and prognosis of early lung cancer (27–32).
To date, there have been many predictive models for SPN diagnosis, such as the most classic Mayo model, Brock University model, Peking University People’s (PKUPH) model, VA model, and so on. Most of these models have achieved more than 80% diagnostic accuracy. However, each model has its own shortcomings and needs to be further optimized.
The aim of this study was to establish a new predictive model and nomogram to assist in the identification of benign and malignant SPNs measuring ≤ 2 cm based on clinical characteristics, imaging features, and hematological biomarkers, which can help thoracic surgeons make more rational clinical decisions.
This single-center study was approved by the Institutional Review Board of Qilu Hospital of Shandong University (registration number: KYLL-202008-023-1). Owing to the retrospective nature of the study, the need for written informed consent was waived. All methods were performed in accordance with the Declaration of Helsinki.
This was a retrospective study of patients with small SPNs who underwent minimally invasive pulmonary resection with definite pathological results from January 2020 to December 2021 at Qilu Hospital of Shandong University. The inclusion criteria were as follows: (1) patients with a single intra-pulmonary nodule suggested by chest computed tomography (CT) within 1 month before surgery, (2) SPN with a maximum diameter ≤ 2 cm, (3) absence of pulmonary atelectasis and active inflammatory imaging in the lung, and (4) clear pathological findings obtained by surgical resection. The exclusion criteria were as follows: (1) patients aged< 18 years, (2) patients undergoing thoracotomy, (3) incomplete perioperative data, and (4) patients with a history of other malignant disease within 5 years.
All enrolled patients were randomly assigned to the training cohort and validation cohort at a ratio of 7:3 using a random split sample method. The training cohort was used to develop the prediction nomogram, while the validation cohort was used to test the performance of the nomogram.
Eligible patients’ data were collected from the database of Qilu Hospital of Shandong University as follows: (1) demographic data: age, sex, body mass index, smoking history, and preoperative comorbidities such as hypertension, diabetes, and chronic obstructive pulmonary disease (COPD); (2) pre-operative assessment data: percentage of the predicted forced expiratory volume in 1 second, percentage of the predicted value of maximal voluntary ventilation, and American Society of Anesthesiologists score; (3) laboratory blood test indicators: lactate dehydrogenase, serum amyloid, serum 5′-nucleotidase, blood sugar, serum complement C1q, blood type, albumin, lymphocytes, neutrophils, eosinophils, basophils, monocytes, erythrocytes, hemoglobin, platelets, derivative prognostic nutritional index (PNI), neutrophil-lymphocyte ratio (NLR), platelet-lymphocyte ratio (PLR), monocyte-lymphocyte ratio (MLR), derived neutrophil-to-lymphocyte ratio (dNLR), neutrophil to lymphocyte and platelet ratio (NLPR), systemic inflammatory response syndrome, the aggregate index of systemic inflammation (AISI), systemic inflammation index (SII), and pan-immune-inflammation value (PIV); (4) lung cancer tumor markers: pro-gastrin-releasing peptide, squamous cell carcinoma, cytokeratin 19-fragments, carcinoembryonic antigen (CEA), carcinoma antigen 125, and neuron-specific enolase; (5) imaging characteristics on CT: nodule location (centrality or peripherality), nodule shape (regular or not), spiculation (sunburst appearance), cavitation signs, calcification, vascular penetration sign, pleural adhesions, bronchus sign, lobulation, lymph node enlargement sign, pleural effusion sign, maximum tumor diameter, and CTR; and (6) postoperative pathological results.
The period of blood collection from patients in this study was standardized, and all patients had their blood obtained in a fasting and tranquil condition on the morning of the second day of hospitalization. All patients’ blood test results were acquired within one week before surgery.
All chest CT tests, including the whole chest scan, were performed in the supine position. Single scans were taken while holding one’s breath and breathing deeply. The measures were taken by two radiologists with more than five years of experience in chest radiology. Two radiologists independently measured each imaging feature, and any discrepancies were reevaluated by a third radiologist with more than 20 years of experience in chest radiography. Consensus was used to resolve conflicts. The centrality of location was defined as an SPN measuring ≤ 2 cm being located within the inner two-thirds of the lung parenchyma on axial CT images, while peripherality was defined as a nodule located within the outer third. Spiculation was defined as strands that spread from the nodal margins into the lung parenchyma but did not contact the pleural surface. Cavitation signs were defined as gas-filled spaces considered transparent or low-attenuation regions. Calcification was defined as having one of the following patterns on CT imaging: stratification, central nodule, diffusion, or popcorn pattern. The vascular penetration sign was defined as the presence of a vessel crossing the node observed on CT images. Linear attenuation toward the pleura or the primary or secondary fissure from the SPN is known as a pleural adhesion. Direct bronchial involvement of nodules is known as the CT bronchial sign. Lobulation was defined as a wavy or scalloped portion of the lesion surface and strands extending from the nodal margins into the lung parenchyma. The lymph node enlargement sign was an enlargement of the mediastinal lymph nodes that can be observed on the CT image. Lymph node enlargement is defined as a short axis of lymph nodes > 1 cm on CT images. The pleural effusion sign was defined as a blunting of the angle of the rib diaphragm visible on CT images. CTR was the ratio of the diameter of the solid component of the pulmonary nodule to the maximum diameter of the nodule. PNI, NLR, dNLR, MLR, NLPR, SIRI, AISI, SII, and PIV were calculated using the following formulas:
Data from the training cohort was analyzed using univariate analysis to assess all factors affecting the probability of SPN malignancy. Then, to find independent predictors, multivariate logistic regression was performed. All factors with P values less than 0.05 in the univariate analysis were included in further multivariate logistic regression analysis. R statistical software (Windows version 4.2.1, http://www.r-project.org/) was used to create the prediction model and nomogram introducing meaningful independent risk factors in the multivariate analysis. A score for each variable was calculated using the regression model, and the predicted probability of malignancy could be derived by summing the scores of the individual variables.
The performance of the predictive nomogram was assessed by discriminatory power, calibration, and clinical utility. Discriminative power is the ability of a model to correctly distinguish between events and non-events. We used receiver operating characteristic (ROC) curves to assess the identification efficiency of the predictive nomogram (33). Calibration measures how well the predicted probabilities agree with the actual results. The Hosmer–Lemeshow test was used to assess the calibration capability, with a P value greater than 0.05 indicating satisfactory calibration (34). Then, a nomogram calibration curve was formed to further evaluate the calibration. Internal validation was performed by using a bootstrapping method that was repeated 1,000 times (35). Decision curve analysis (DCA) was used to assess the clinical utility of the predictive nomogram based on the net benefits of different threshold probabilities (36). Based on the ROC curve analysis of the training cohort, the optimal cutoff value was determined when the Youden index (sensitivity + specificity - 1) reached its maximum value.
All statistical analyses were performed using SPSS 26.0 (SPSS Inc., Chicago, Illinois, USA) and R statistical software (Windows version 4.2.1, http://www.r-project.org/). Normally distributed continuous variables were expressed as the mean ± standard deviation and compared using Student’s t-test. For non-normally distributed continuous variables, the data were expressed as median (interquartile range) and compared by the Mann–Whitney U test between the two groups. Categorical variables were compared using Pearson’s chi-square test or Fisher’s exact test. Bilateral P values of< 0.05 were considered statistically significant.
The procedure for identifying and selecting eligible patients is shown in Figure 1. Our study initially included 2213 initial patients who underwent surgery from January 2020 to December 2021 at our hospital. All initial patients were consecutive and were not selected. A total of 1,106 eligible patients were included in our study after a cascade of screening. Among them, the malignancy rate of SPNs measuring ≤ 2 cm was 85.08% (941/1106). Enrolled patients were then randomly assigned to either the training cohort (n = 775) or validation cohort (n = 331) at a ratio of 7:3, and there were no significant differences in all variables between the two cohorts (Table 1). Patients were divided into malignant and benign groups according to the malignancy or non-malignancy of SPNs. The characteristics of the two groups in the training and validation cohorts are shown in Table 2.
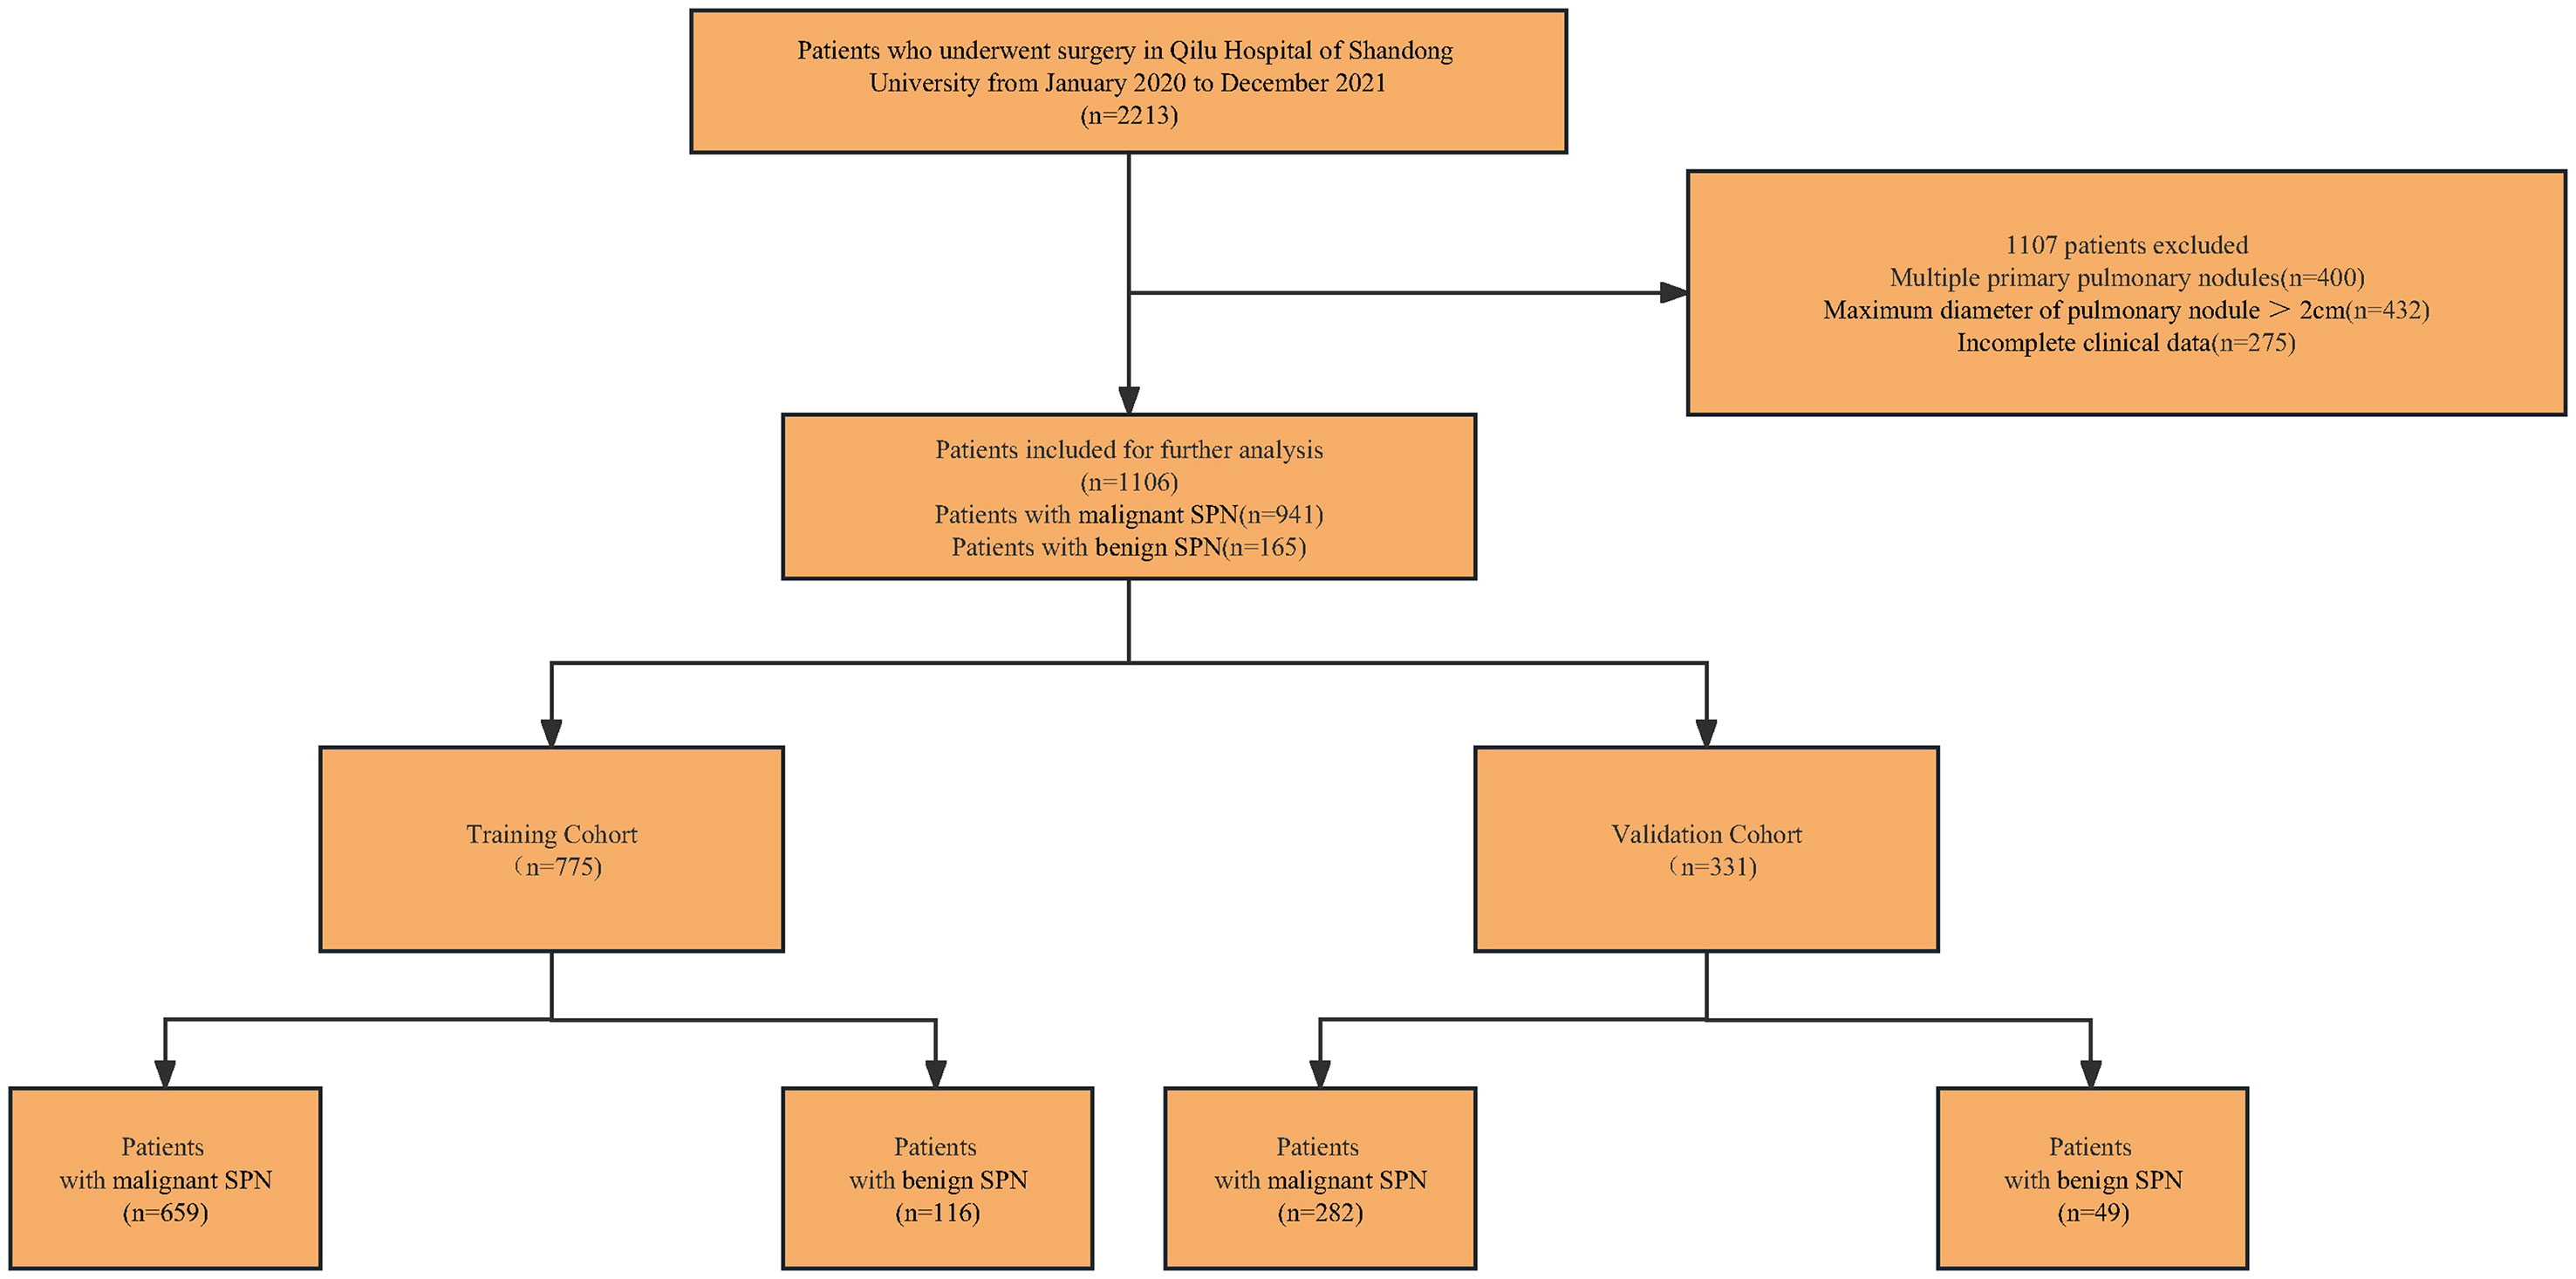
Figure 1 Flow diagram of patient selection through the study. SPN, solitary pulmonary nodules.
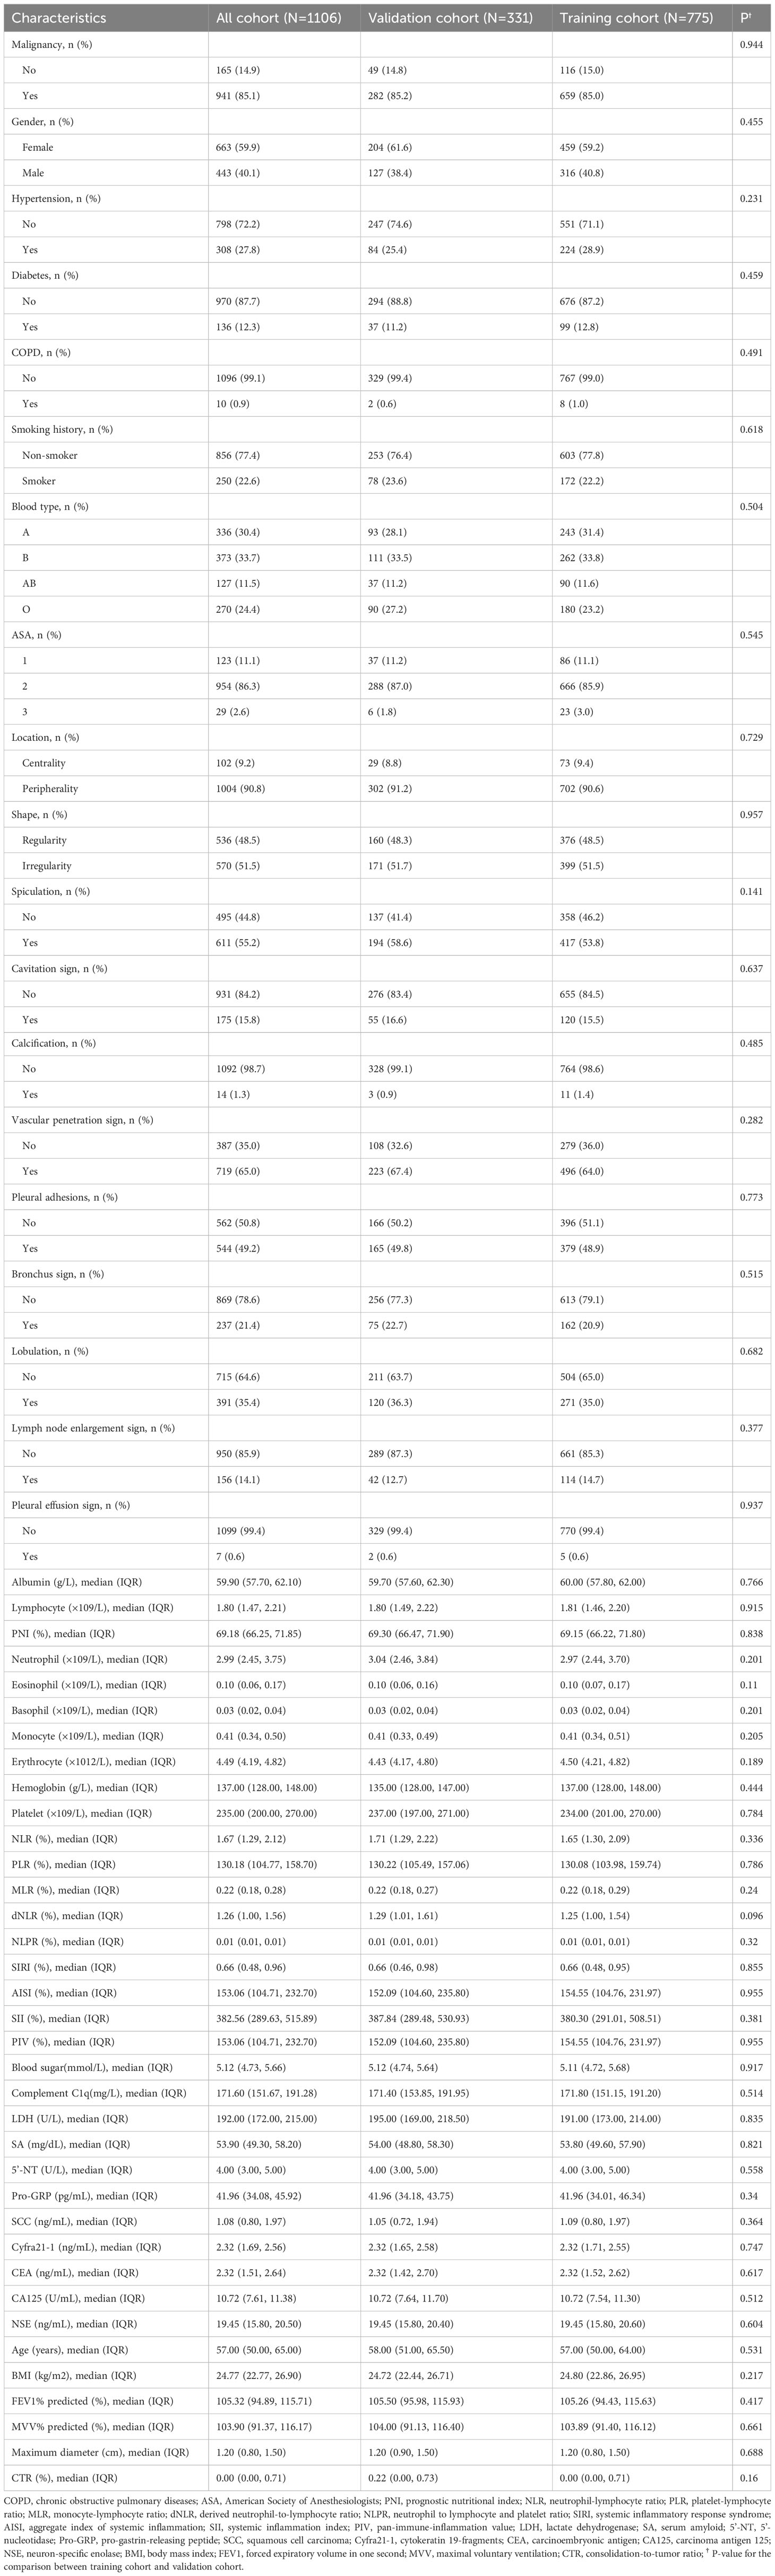
Table 1 Patients’ characteristics of the training cohort and validation cohort.
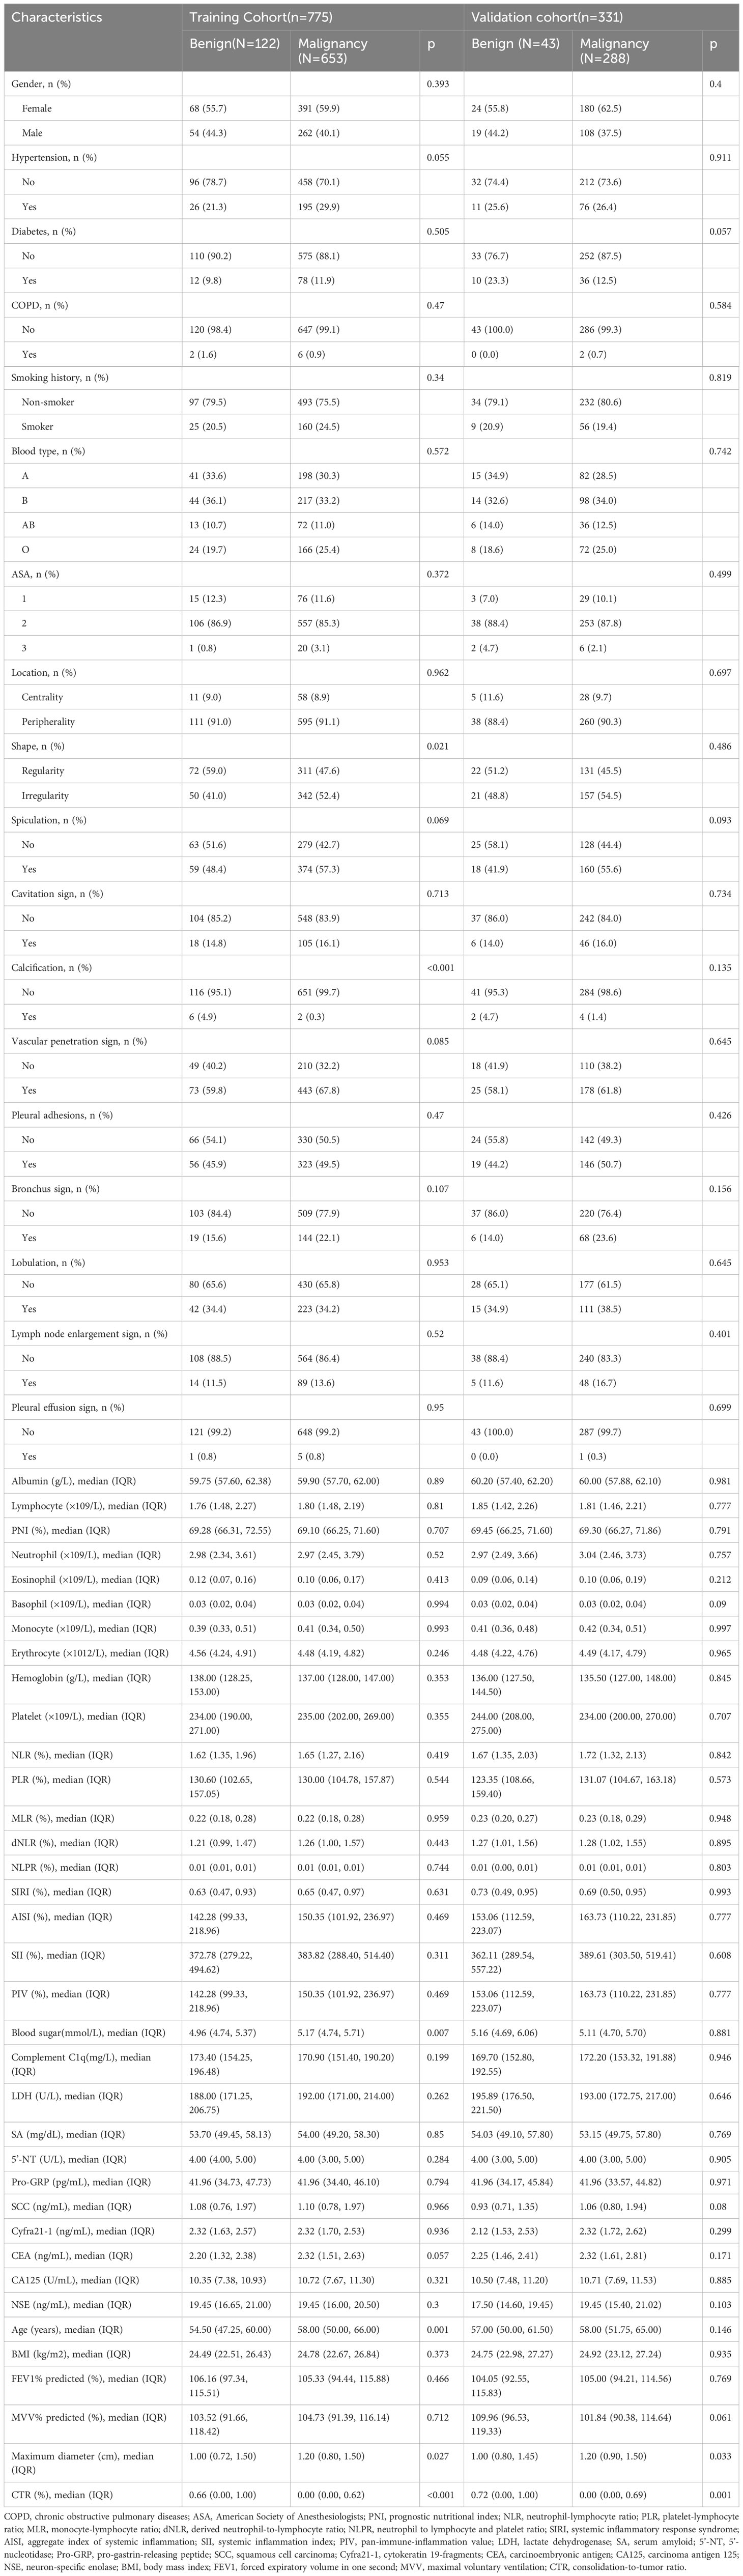
Table 2 Clinical characteristics of patients with benign and malignant SPNs measuring ≤ 2cm in the training cohort and validation cohort.
Univariate and multivariate logistic regression analyses were performed in the training cohort to explore independent risk factors for SPN benignity and malignancy (Table 3). Univariate analysis showed that age, CEA, shape, calcification, maximum tumor diameter, and CTR were potential risk factors for SPNs measuring ≤ 2 cm (P< 0.05). Further multivariate logistic regression by including variables with a univariate P value< 0.05 showed that CTR (odds ratio [OR] = 0.081; 95% confidence interval [CI]: 0.043–0.147; P< 0.001), calcification (yes vs. no; OR = 0.050; 95% CI: 0.005–0.355; P = 0.006), age (OR = 1.025; 95% CI: 1.005–1.046; P = 0.013), maximum tumor diameter (OR = 3.927; 95% CI: 2.192–7.204; P< 0.001), CEA (OR = 1.265; 95% CI: 1.057–1.556; P = 0.018), and nodule shape (regularity vs. irregularity; OR = 1.577; 95% CI: 1.013–2.470; P = 0.045) were risk factors. The forest plot for the multivariate logistic regression analysis is shown in Figure 2.
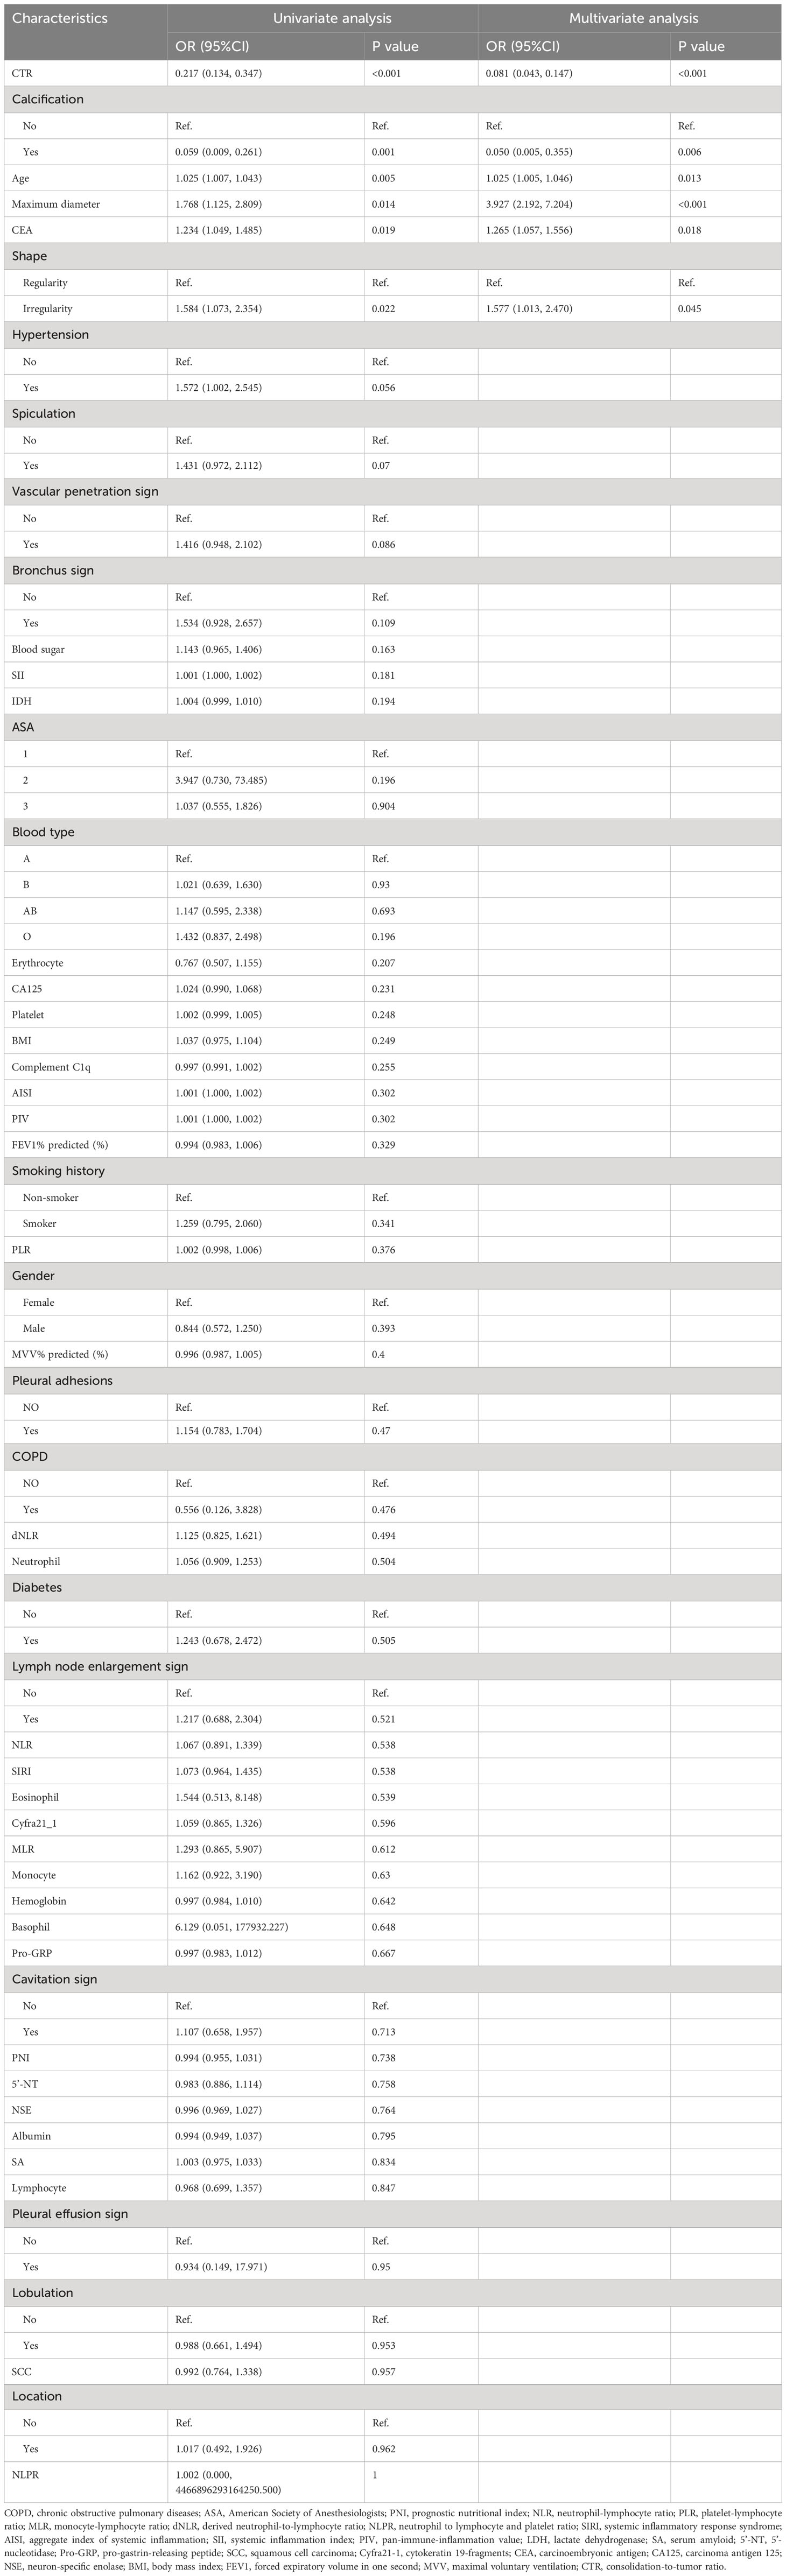
Table 3 Univariate and multivariate logistic regression analysis of the training cohort.
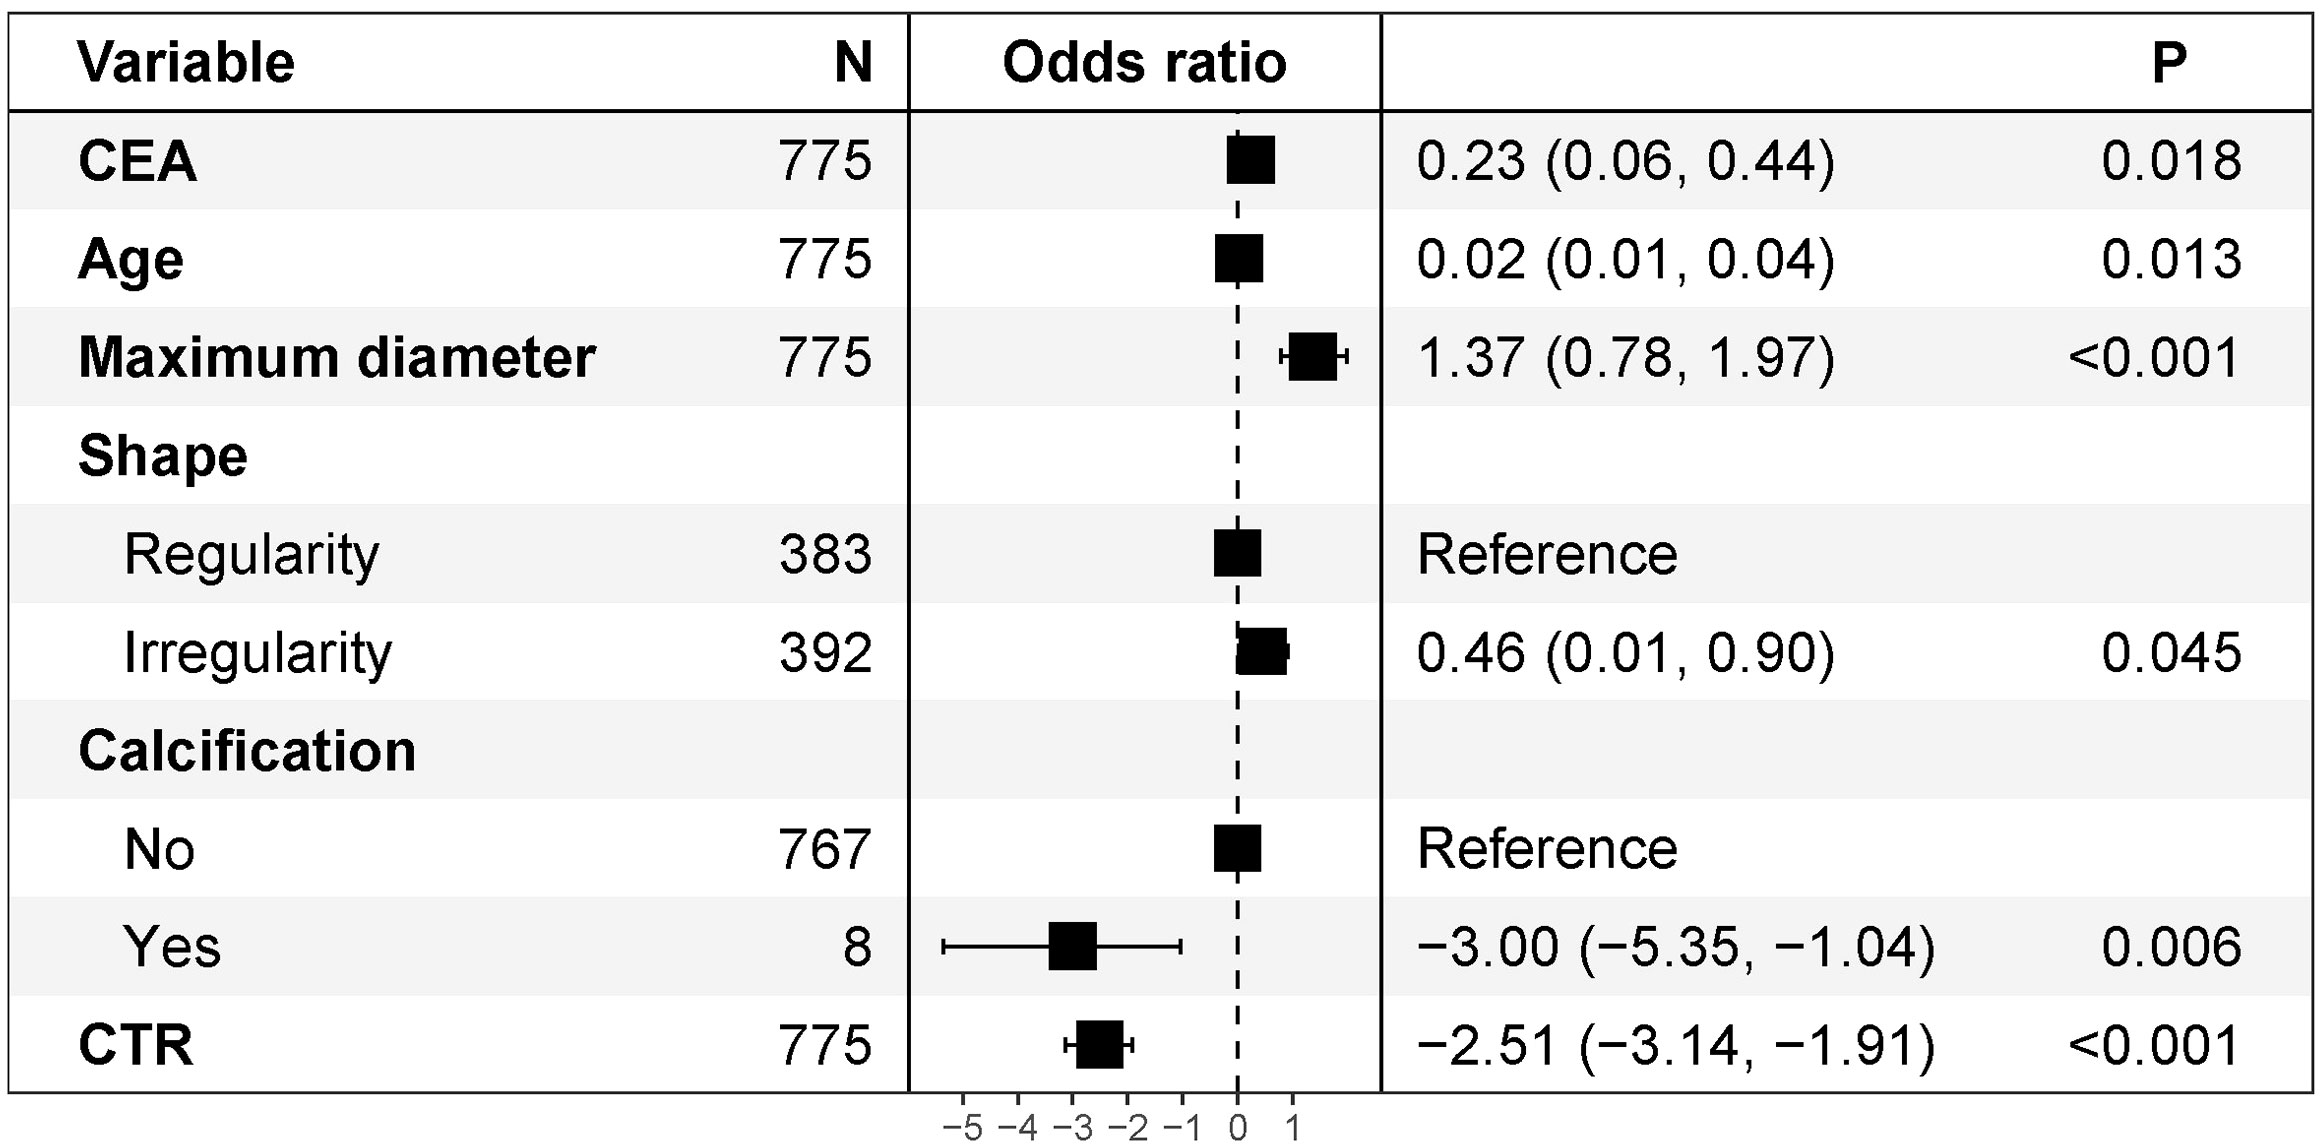
Figure 2 Multivariate logistic regression analysis of forest plots. CEA, carcinoembryonic antigen; CTR, consolidation-to-tumor ratio.
All six independent risk factors for SPNs measuring ≤ 2 cm were included to build the logistic regression model. The predicted probability of malignancy for small SPNs could be calculated by using the following formula: ln (p/1-p) = -2.511 × CTR + 1.368 × maximum diameter - 2.997 × calcification (no = 0; yes = 1) + 0.025 × age + 0.235 × CEA + 0.455 × shape (regularity = 0; irregularity = 1) - 0.941. Based on the above formula, a malignancy probability prediction nomogram for SPNs measuring ≤ 2 cm was drawn using R statistical software (Figure 3). As shown in this nomogram, there are a total of nine axes, and axes 2–7 represent the six variables in the prediction model. The estimated score for each risk factor can be calculated by plotting a line perpendicular to the highest point axis and can be further summed to obtain the total score. The total point axis is then used to predict the probability of malignancy for SPNs before surgery, and the appropriate surgical procedure can then be further selected.
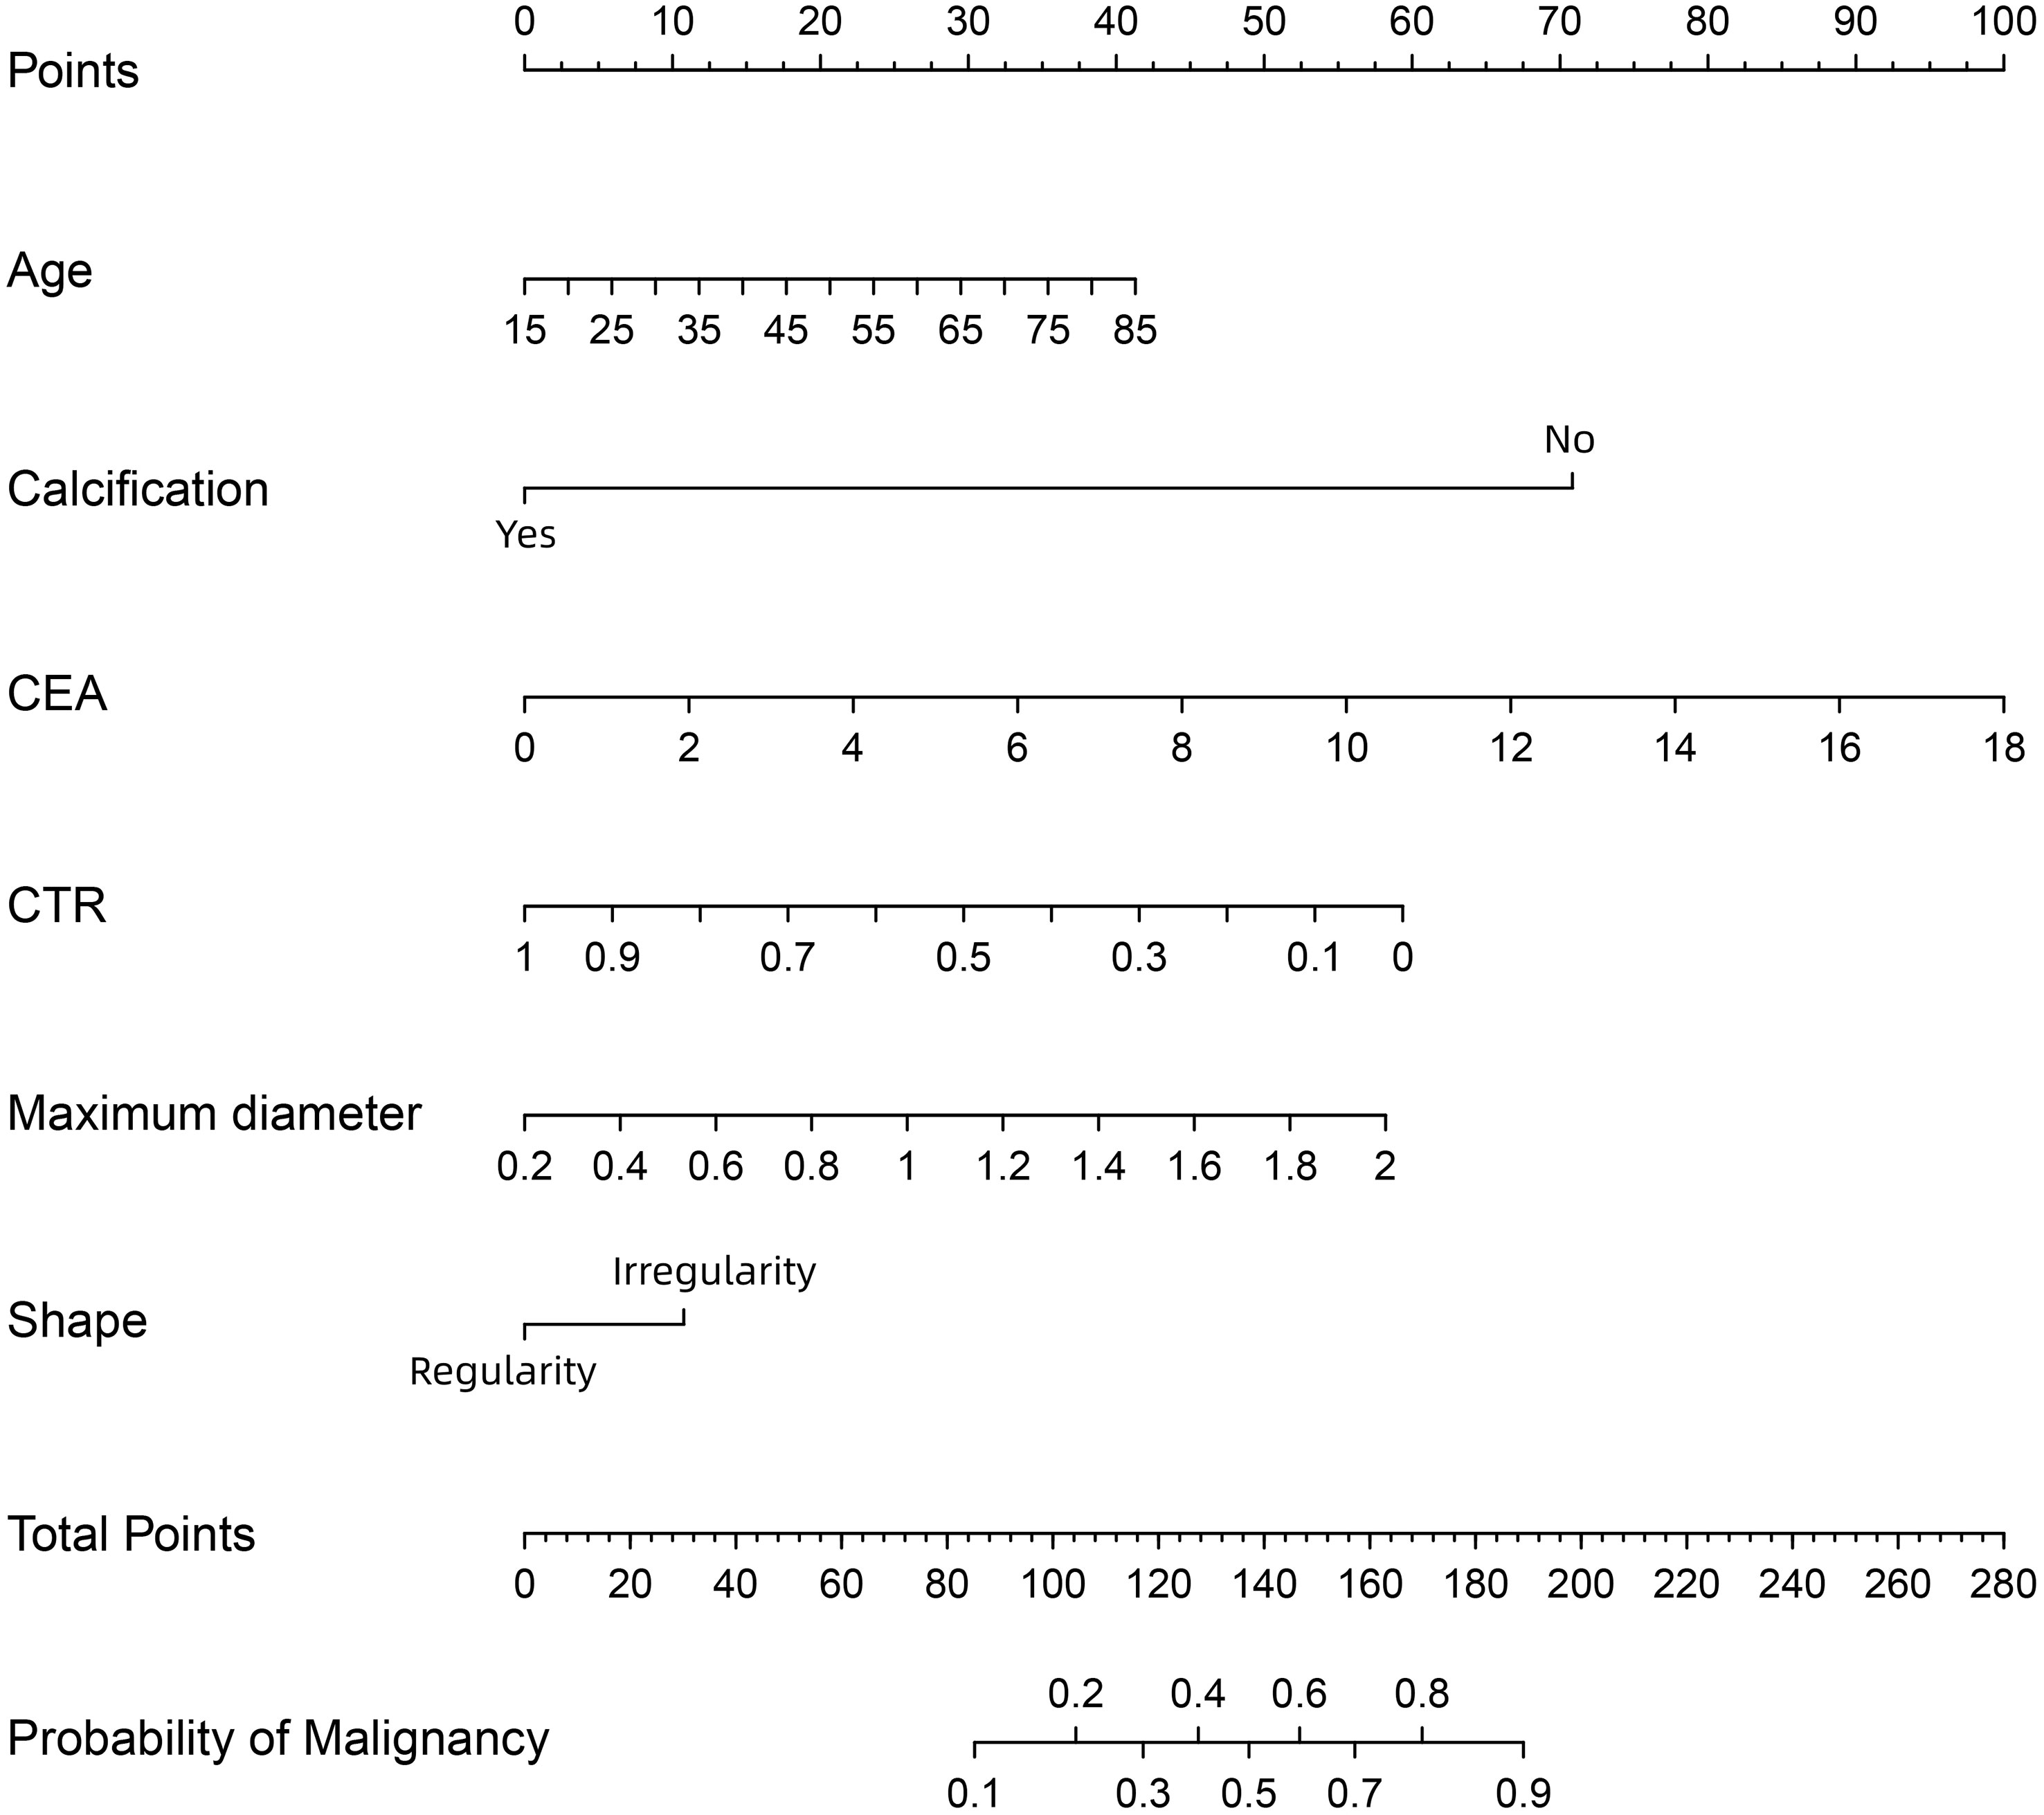
Figure 3 A nomogram for predicting the probability of malignancy in SPN measuring ≤ 2 cm. CEA, carcinoembryonic antigen; CTR, consolidation-to-tumor ratio. There are a total of 9 axes, and axes 2-7 represent the 6 variables in the prediction model. The estimated score for each risk factor can be calculated by plotting a line perpendicular to the highest point axis, and can be further summed to obtain the total score. The total point axis is then used to predict the probability of malignancy for SPN measuring ≤ 2 cm before surgery.
The discriminative power of the predictive model and nomogram was assessed by the ROC curve (Figure 4). The area under the curve (AUC) for the training cohort was 0.764 (95% CI: 0.714–0.814), and the AUC for the validation cohort was 0.729 (95% CI: 0.647–0.811), indicating a relatively good predictive accuracy of the nomogram. The cut-off value for the ROC curve of the training cohort was 0.819, and the sensitivity and specificity were 0.680 and 0.766, respectively (Table 4). Calibration power was evaluated using the Hosmer–Lemeshow test and calibration plots. P values for the Hosmer–Lemeshow test were 0.4348 for the training cohort and 0.3175 for the validation cohort, indicating a negligible difference between the predicted probability and actual observed probability. The calibration plots for the training (Figure 5A) and validation (Figure 5B) cohorts also demonstrate a good calibration of the predictive nomogram.
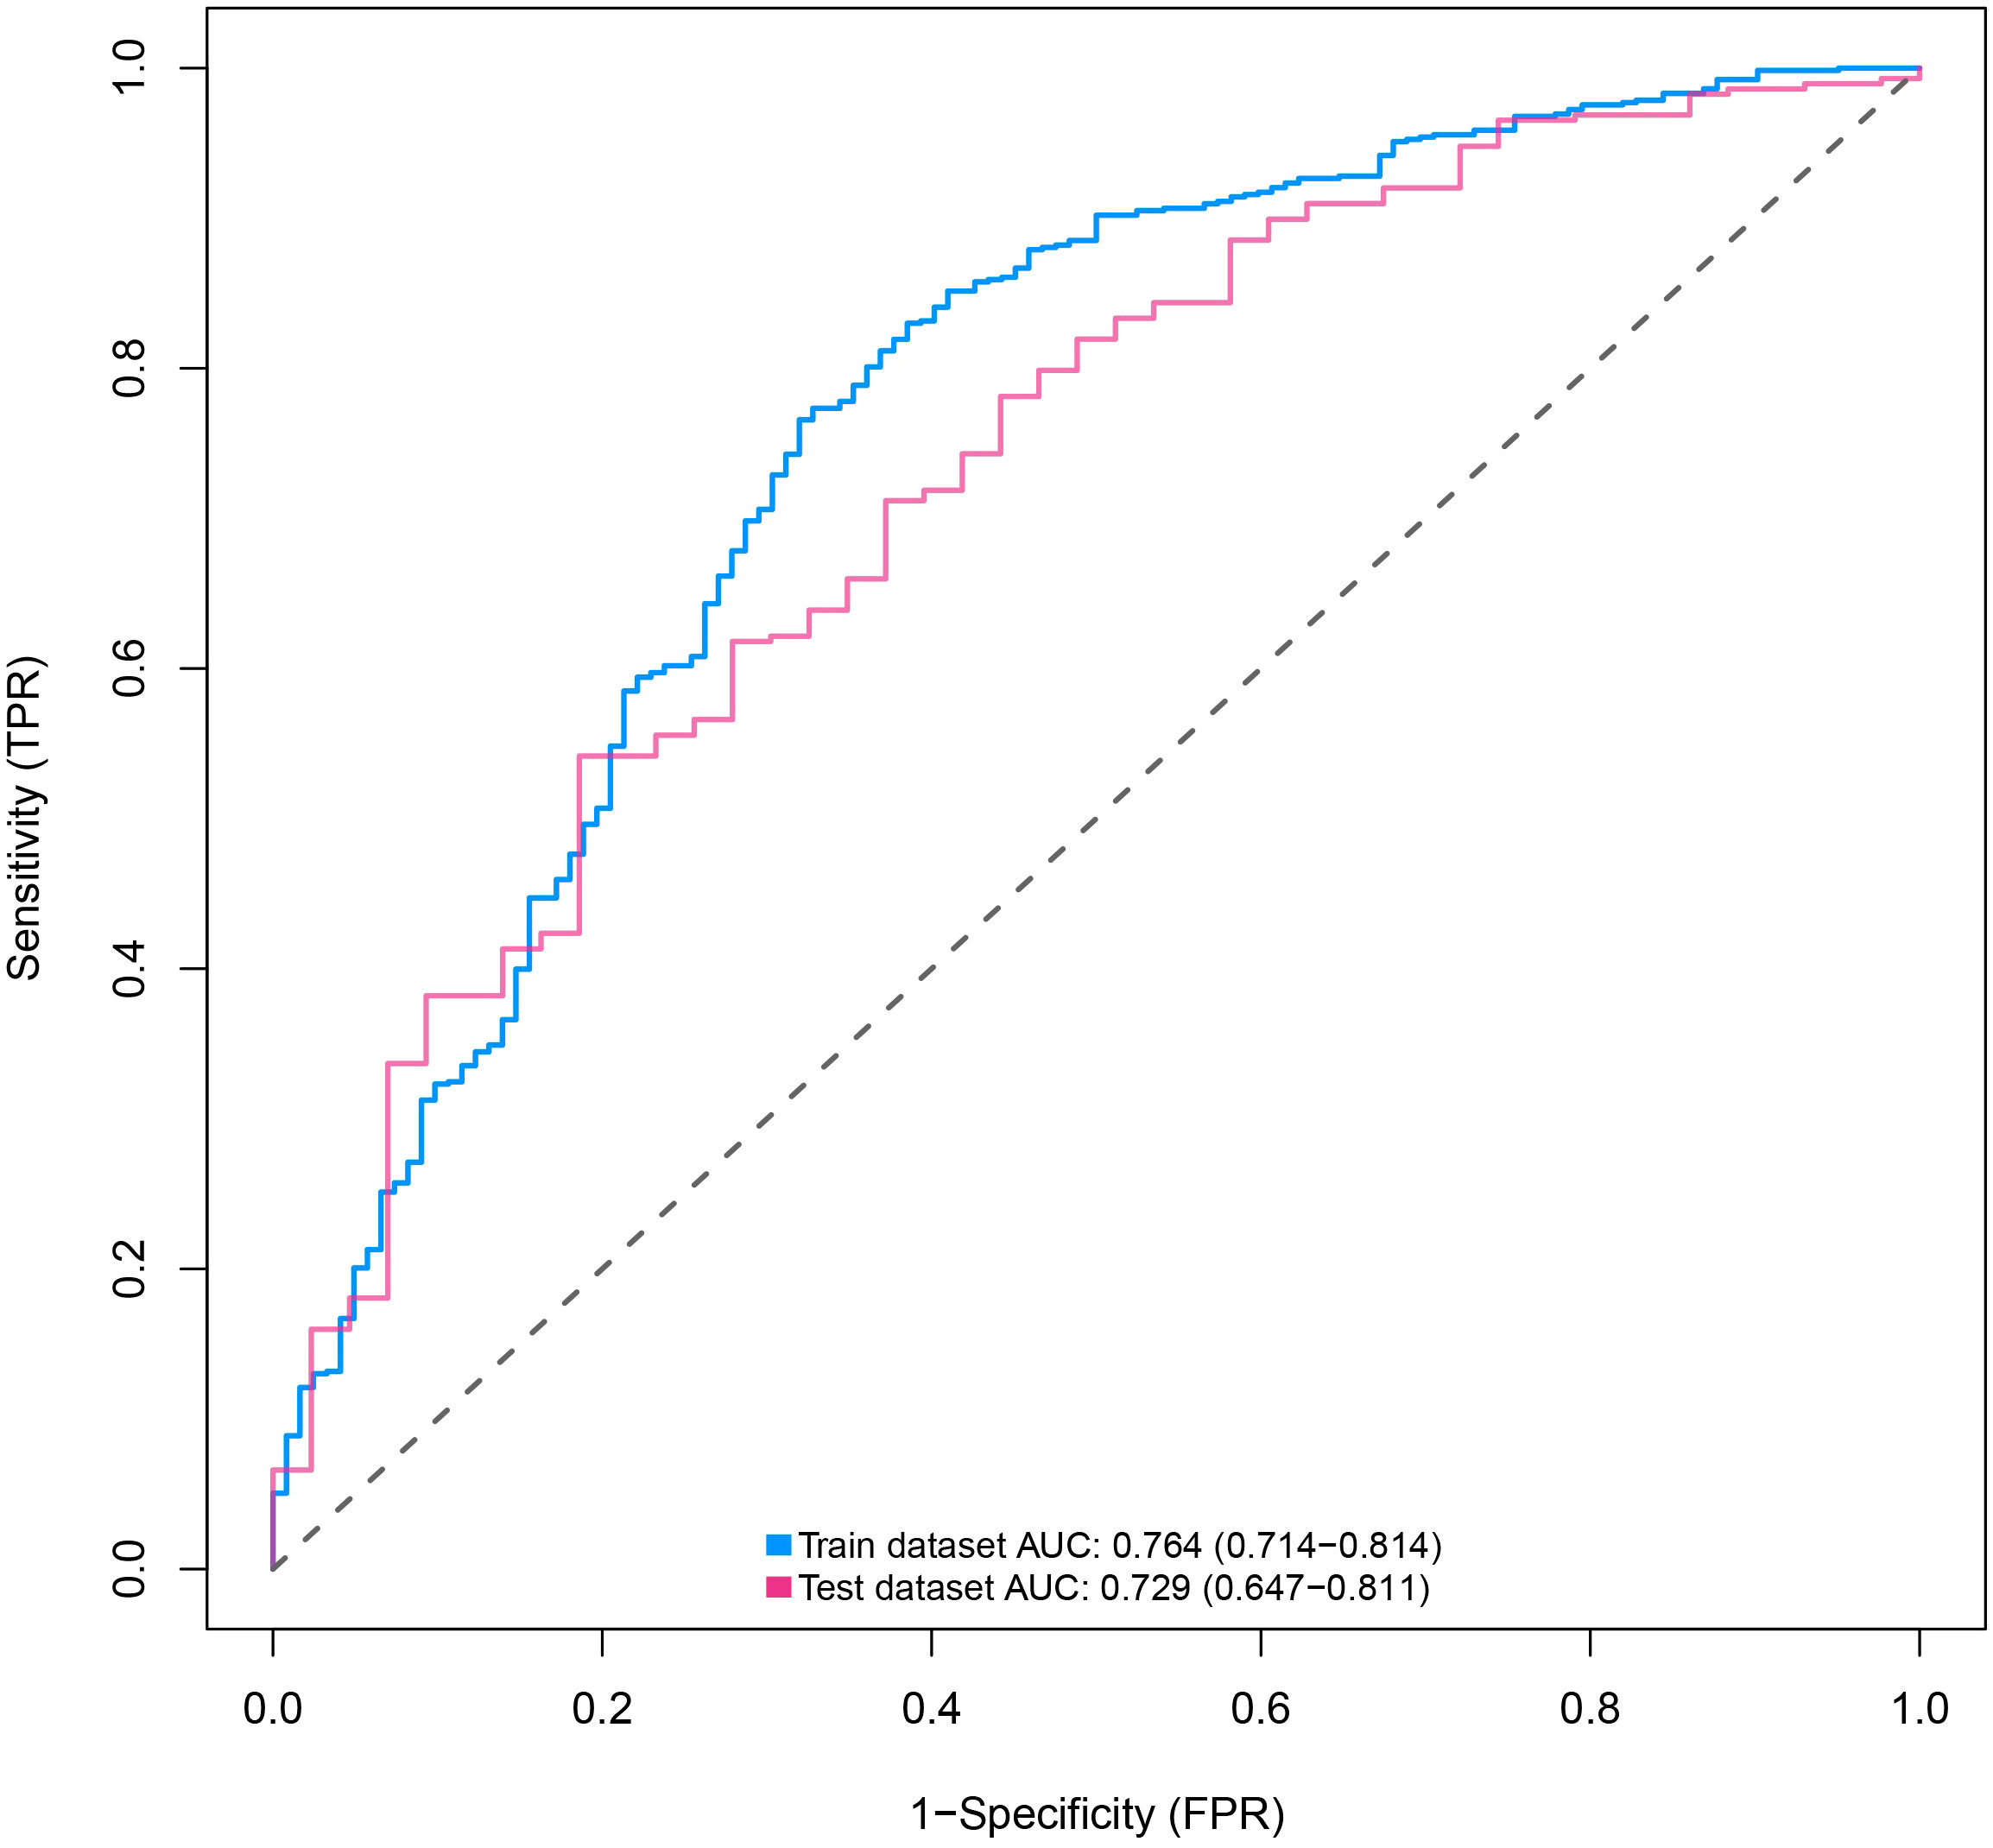
Figure 4 ROC curves of nomograms for predicting the malignancy of SPN within 2 cm in the training and validation cohorts predicting. ROC, receiver operating characteristic; AUC, area under the ROC curve; SPN, solitary pulmonary nodule.

Table 4 Results of ROC curve for training cohort.
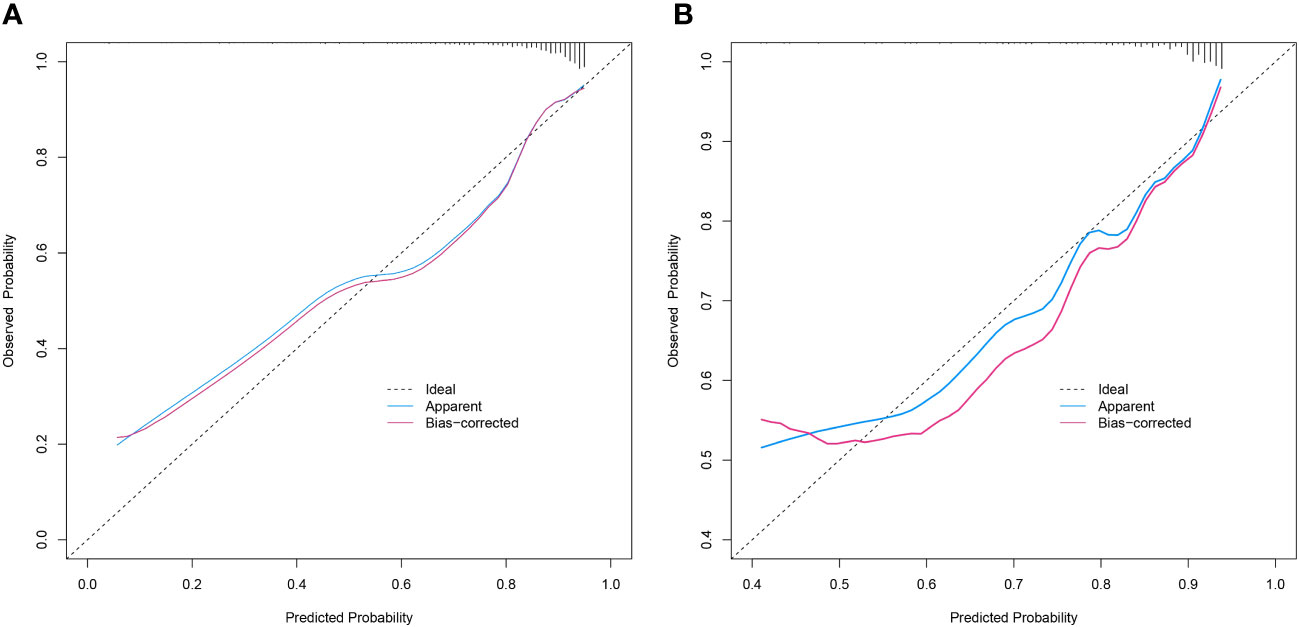
Figure 5 Calibration curves of the prediction nomogram in the training cohort (A) and validation cohort (B). The X-axis represents the probability predicted by the nomogram and the Y-axis represents the actual probability of malignancy of SPN within 2 cm. The black dashed line represents the ideal curve, the blue solid line represents the apparent curve (non-corrected), and the red solid line represents the bias-corrected curve by bootstrapping (B = 1000 repetitions). SPN, solitary pulmonary nodule.
DCA was used to assess the clinical utility of the predictive nomogram (Figures 6A, B). The results show that the nomogram provided greater net benefit and broader threshold probabilities for predicting the risk of malignancy in SPNs measuring ≤ 2 cm in both the training and validation cohorts, indicating that the nomogram is clinically useful.
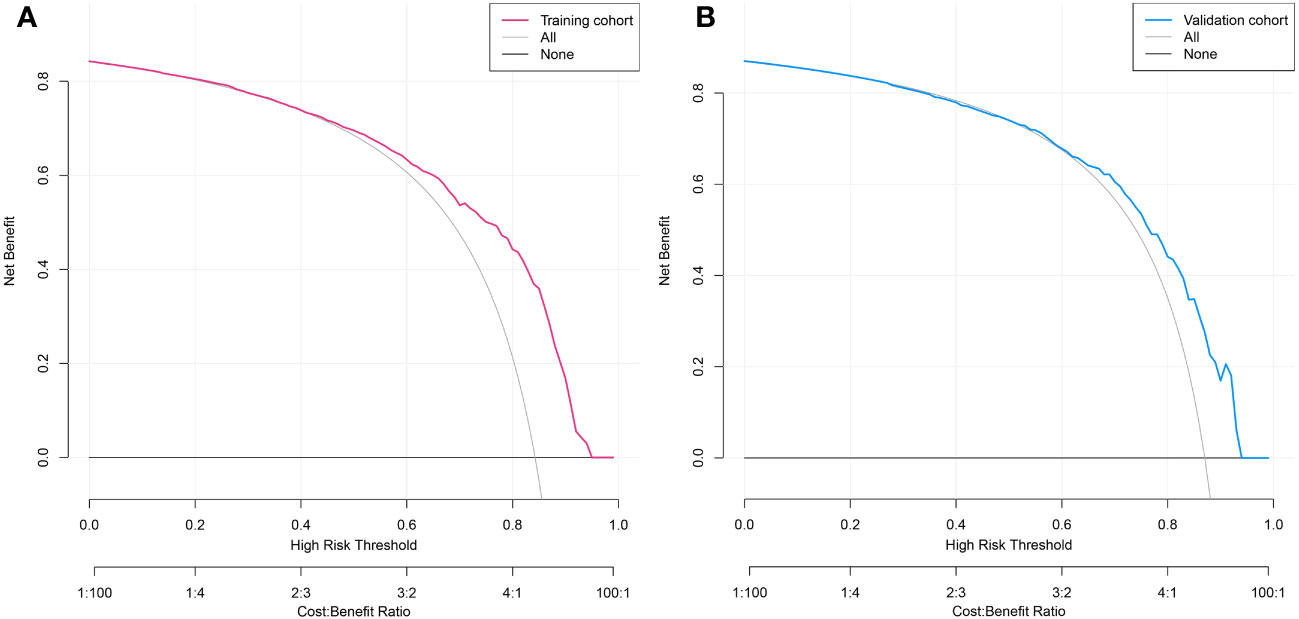
Figure 6 Decision curve analysis of predicted nomogram in the training cohort (A) and validation cohort (B). The y-axis measures net gain, with the black line representing the assumption of patients whose SPNs within 2 cm are benign and the gray line representing the assumption of patients whose SPNs measuring ≤2 cm are malignant. The red line in Figure 6A represents the training cohort, and the blue line in Figure 6B represents the validation cohort.
At present, the most frequent cause of cancer-related death is lung cancer (37–39). Most lung cancers are at an advanced stage when detected and have a poor prognosis. Enhancing the diagnosis rate of early-stage lung cancer to provide proper and rational treatment is crucial to increasing the survival rate (40). Several recent institutional retrospective studies have suggested that survival and recurrence rates may be the same for lobectomy and sub-lobar resection in patients with small lung cancers measuring ≤ 2 cm. Therefore, the management of patients with growing SPNs of 2 cm or smaller is a high priority for clinicians. In this study, we developed a clinical prediction model and designed a nomogram with good predictive performance for assessing the malignancy of small SPNs. This predictive nomogram can be used to estimate the probability of nodal malignancy in patients with SPNs measuring ≤ 2 cm, and thoracic surgeons can make more rational clinical decisions while avoiding overtreatment and wasting medical resources.
In this study, multivariate logistic regression analysis showed that age, CEA, shape, calcification, maximum tumor diameter, and CTR were independent predictors for estimating SPN malignancy. Based on these results, a clinical prediction model for SPNs measuring ≤ 2 cm was developed by incorporating one general clinical indicator (age), four imaging indicators (shape, calcification, maximum tumor diameter, and CTR), and one laboratory indicator (CEA). Although various independent risk factors in this model have been previously reported (41–50), not one has yet included CTR along with clinical and laboratory indicators to predict the malignancy of SPNs measuring ≤ 2 cm.
Some patients have clinical features that are considered risk factors for lung malignancy, such as advancing age, sex, smoking history, and chronic obstructive pulmonary disease (24, 41, 42, 51–55). Age has been shown to independently influence the malignancy of SPNs, and the risk of lung cancer incidence increases significantly with age (41, 42, 51, 54). The results of the present study are consistent with the above findings. In addition, sex is a major risk factor for the development of lung cancer, with women being more likely to develop lung cancer (24, 42, 51). Smoking history and COPD are also risk factors and promote the development and progression of lung cancer (55). In the present study, SPN malignancy did not differ significantly by sex, smoking history, lung function, and history of comorbid diseases including COPD, but this does not mean that these clinical characteristics are not associated with malignant SPNs. In future studies, the epidemiological factors of SPNs can be further explored by expanding the sample size, enriching the potential risk factors, and conducting multicenter prospective studies.
Some patients have hematological indicators that are considered risk factors for lung malignancy, such as tumor markers (43, 56–58). In addition, in recent years, the direction of research has gradually shifted to inflammatory factors (59–61). Several articles have demonstrated that inflammatory factors are associated with lung cancer prognosis (62–65). However, few articles have demonstrated that inflammatory factors are associated with lung carcinogenesis. Therefore, in the present study, we included not only tumor markers but also other hematological correlates, various types of leukocytes, and several inflammatory indicators derived from them. Inflammatory cells are an important component of the tumor microenvironment, and the inflammatory response plays a critical role in cancer development and progression and may be associated with systemic inflammation (19). Unfortunately, the present study did not investigate a definite association between inflammatory indicators and malignancy. Until now, studies have reported the association of inflammatory indicators with lung cancer prognosis and early recurrence (66–75). However, the association of inflammatory indicators with early lung carcinogenesis remains to be further investigated. However, no article has reported the association of inflammatory indicators with the development of early lung cancer. Inflammatory indicators may be normal in early-stage lung cancer. An association between the two could not be found in the present study. Among the various tumor markers, CEA is a polysaccharide protein complex involved in cell adhesion, which is usually absent or present in very small amounts in the blood of healthy adults and is thought to be associated with poor prognosis of tumors. Serum CEA levels are closely related to the pathological stage of lung cancer. Grunnet and Sorensen found that CEA was more significantly elevated in the serum of lung cancer patients than in patients with benign lesions (P< 0.05) (76). Our findings in which CEA was an independent predictor of malignant SPNs are consistent with previous findings (43, 44, 57, 76).
A number of additional imaging features also contribute to the risk stratification of patients with SPNs measuring ≤ 2 cm, including location, shape, spiculation, cavitation sign, calcification, vascular penetration sign, pleural adhesions, bronchus sign, lobulation, lymph node enlargement sign, pleural effusion sign, maximum tumor diameter, and CTR (77). We collected the above-mentioned imaging features of the patients, and after analysis, four independent predictors associated with the malignancy of SPNs measuring ≤ 2 cm were screened. Irregular nodules are a common finding in lung cancer screening (78, 79). Malignant nodules are more likely to have irregular, lobulated, or needle-like margins because of the spread of malignant cells within the lung mesenchyme and fibrosis within the tumor. Benign nodules are associated with smooth, rounded borders and exhibit a benign growth pattern. Calcification is a common CT feature of pulmonary tuberculosis and is usually considered a benign sign (79). Lung calcification results from deposition of calcium, mostly as a result of healing inflammation. Malignant tumors rarely have calcified foci, but mainly the nodules keep growing and clinically invade other healthy tissues. She et al. indicated that the risk of malignancy in SPNs increased 1.1-fold with a 1-mm increase in nodule diameter (80). However, Chen et al. did not find a diameter-related association with malignancy in small SPNs (81). Our study showed that the risk of malignancy positively correlated with the maximum diameter of the SPNs measuring ≤ 2 cm. CTR is currently the most commonly used indicator for the management of ground glass nodules (82). However, it is important to note that CTR is only an indicator for malignant nodules and it is generally used to predict the aggressiveness of nodules. It is generally accepted that a lower CTR corresponds to less aggressive behavior, while a higher CTR indicates a more aggressive tumor (83–88). A prospective radiological study for non-invasive prediction of pathological findings of clinical stage IA peripheral lung cancer by HRCT scan was conducted by the Japanese Clinical Oncology Study Group (JCOG0201) (27). The results of this study showed that pathological non-invasive carcinomas could be predicted by CTR values with a maximum tumor diameter ≤ 2 cm and a CTR ≤ 0.25, with a specificity of 98.7% for lung cancer. The 7.1-year follow-up results of this study concluded that both tumor maximum diameter ≤ 2 cm and CTR ≤ 0.25, and tumor maximum diameter ≤3 cm and CTR ≤ 0.5 on HRCT scans were good predictors of non-invasive pathology, with a 5-year overall survival rate of approximately 97% in both groups (89). In the present study, the role of CTR was contrary to previous findings, which may be because of the high number and proportion of in situ carcinomas with purely ground glass traits in the collected data.
The Mayo model was the most widely used model for predicting malignant SPN, and the PKUPH model claimed to be superior to traditional models. The Brock model is a more accurate predictive tool based on CT and clinical information description. However, these models did not involve clinical biomarkers. Foreign prediction models are not suitable for mainland Chinese populations. Some predictive models incorporate more advanced and quantitative imaging findings, such as CT attenuation and tumor diameter growth rates, in their assessments[5, 6]. However, these imaging data are rarely recognized and used by doctors since they are difficult to get, hard to conduct, and difficult to standardize. Our predictive model has the following advantages over previously published predictive models. First, we collected a relatively large number of small SPN cases and randomly divided them into a training cohort and an internal test cohort, which makes our conclusions more convincing. Second, surpassing previous work, we collected the most comprehensive clinical data and imaging data and provided a clear pathological diagnosis for each patient. Third, all important risk factors in the nomogram are available and prevalent in clinical practice. Fourth, the ROC, calibration, and DCA curves of the training cohort of the model perform well, and the accuracy and reliability of the model are satisfactory. Thus, our model can aid clinicians and facilitate a more individualized risk prediction for each patient.
There are some limitations to this study that need to be considered. First, owing to the retrospective nature of the study, we could not avoid potential selection bias. For example, we only included patients who underwent surgical resection in our department; otherwise, they would have been excluded, which is a selection bias. Second, our data were obtained from a single center with a relatively small sample size. The predictive model was only validated internally, so the selection bias present in the training cohort may also be present in the validation cohort. These reasons may limit the generalizability of our predictive nomogram and may also present some uncontrolled confounding factors. Therefore, the model requires further studies involving multiple centers and adequate samples to validate our results. Despite these limitations, the results of the internal validation suggest that the model will yield good results when applied to other populations. The independent risk factors identified in this study that preoperatively predict the probability of malignancy of SPNs measuring ≤ 2 cm, and the developed predictive nomogram may inform clinical decision-making by thoracic surgeons and pave the way for future research in this area.
We developed a clinical nomogram for predicting the probability of malignancy of SPNs measuring ≤ 2 cm based on clinical and radiological characteristics, and the nomogram had good predictive performance. The nomogram could predict the probability of nodal malignancy in preoperative patients with SPNs measuring ≤ 2 cm, improving the diagnostic efficacy of lung malignancies and providing additional clinical reference information and diagnostic evidence to guide clinicians in the next step of intervention and subsequent treatment modalities.
The original contributions presented in the study are included in the article/Supplementary Material. Further inquiries can be directed to the corresponding authors.
The studies involving humans were approved by Institutional Review Board of Qilu Hospital of Shandong University (registration number: KYLL-202008-023-1). The studies were conducted in accordance with the local legislation and institutional requirements. The participants provided their written informed consent to participate in this study.
Conceptualization: HT and MX. Methodology: RL. Software: MX. Validation: ZM and RL. Formal analysis: MX. Investigation: ZL and JL. Resources: ZL and JL. Data curation: WL and HZ. Writing—original draft preparation: MX. Writing—review and editing: MX and RL. Visualization: MX and HT. Supervision: HT and YT. Project administration: HT and YT. All authors contributed to the article and approved the submitted version.
This work was funded by National Key Research and Development Program (2021YFC2500904, and 2021YFC2500905) and Natural Science Foundation of Shandong Province (ZR2021LSW006).
We would like to thank Editage for English language editing.
The authors declare that the research was conducted in the absence of any commercial or financial relationships that could be construed as a potential conflict of interest.
All claims expressed in this article are solely those of the authors and do not necessarily represent those of their affiliated organizations, or those of the publisher, the editors and the reviewers. Any product that may be evaluated in this article, or claim that may be made by its manufacturer, is not guaranteed or endorsed by the publisher.
The Supplementary Material for this article can be found online at: https://www.frontiersin.org/articles/10.3389/fonc.2023.1196778/full#supplementary-material
1. Khan AN, Al-Jahdali HH, Irion KL, Arabi M, Koteyar SS. Solitary pulmonary nodule: A diagnostic algorithm in the light of current imaging technique. Avicenna J Med (2011) 1(2):39–51. doi: 10.4103/2231-0770.90915
2. Choromańska A, Macura KJ. Evaluation of solitary pulmonary nodule detected during computed tomography examination. Pol J Radiol (2012) 77(2):22–34. doi: 10.12659/pjr.882967
3. Horeweg N, van Rosmalen J, Heuvelmans MA, van der Aalst CM, Vliegenthart R, Scholten ET, et al. Lung cancer probability in patients with Ct-detected pulmonary nodules: A prespecified analysis of data from the nelson trial of low-dose Ct screening. Lancet Oncol (2014) 15(12):1332–41. doi: 10.1016/s1470-2045(14)70389-4
4. Gould MK, Donington J, Lynch WR, Mazzone PJ, Midthun DE, Naidich DP, et al. Evaluation of individuals with pulmonary nodules: when is it lung cancer? Diagnosis and management of lung cancer, 3rd Ed: american college of chest physicians evidence-based clinical practice guidelines. Chest (2013) 143(5 Suppl):e93S–e120S. doi: 10.1378/chest.12-2351
5. Harzheim D, Eberhardt R, Hoffmann H, Herth FJ. The solitary pulmonary nodule. Respiration (2015) 90(2):160–72. doi: 10.1159/000430996
6. Ampel NM. The solitary pulmonary nodule. N Engl J Med (2003) 349(16):1575. doi: 10.1056/nejm200310163491617
7. Li GC, Fu YF, Cao W, Shi YB, Wang T. Computed tomography-guided percutaneous cutting needle biopsy for small (≤ 20 Mm) lung nodules. Med (Baltimore) (2017) 96(46):e8703. doi: 10.1097/md.0000000000008703
8. Li Y, Chen KZ, Sui XZ, Bu L, Zhou ZL, Yang F, et al. [Establishment of a mathematical prediction model to evaluate the probability of Malignancy or benign in patients with solitary pulmonary nodules]. Beijing Da Xue Xue Bao Yi Xue Ban (2011) 43(3):450–4.
9. Li Y, Chen KZ, Wang J. Development and validation of a clinical prediction model to estimate the probability of Malignancy in solitary pulmonary nodules in Chinese people. Clin Lung Cancer (2011) 12(5):313–9. doi: 10.1016/j.cllc.2011.06.005
10. Xiao F, Liu D, Guo Y, Shi B, Song Z, Tian Y, et al. Novel and convenient method to evaluate the character of solitary pulmonary nodule-comparison of three mathematical prediction models and further stratification of risk factors. PloS One (2013) 8(10):e78271. doi: 10.1371/journal.pone.0078271
11. Lin H, Zhong WZ, Yang XN, Zhang XC, Yang JJ, Zhou Q, et al. A clinical model to estimate the pretest probability of lung cancer, based on 1198 pedigrees in China. J Thorac Oncol (2012) 7(10):1534–40. doi: 10.1097/JTO.0b013e3182641b82
12. Aberle DR, Adams AM, Berg CD, Black WC, Clapp JD, Fagerstrom RM, et al. Reduced lung-cancer mortality with low-dose computed tomographic screening. N Engl J Med (2011) 365(5):395–409. doi: 10.1056/NEJMoa1102873
13. de Koning HJ, van der Aalst CM, de Jong PA, Scholten ET, Nackaerts K, Heuvelmans MA, et al. Reduced lung-cancer mortality with volume Ct screening in a randomized trial. N Engl J Med (2020) 382(6):503–13. doi: 10.1056/NEJMoa1911793
14. Chen W, Zhu D, Chen H, Luo J, Fu H. Predictive model for the diagnosis of benign/malignant small pulmonary nodules. Med (Baltimore) (2020) 99(15):e19452. doi: 10.1097/md.0000000000019452
15. Kim GR, Hur J, Lee HJ, Nam JE, Kim YJ, Hong YJ, et al. Analysis of tumor markers in cytological fluid obtained from computed tomography-guided needle aspiration biopsies for the diagnosis of ground-glass opacity pulmonary lesions. Cancer Cytopathol (2013) 121(4):214–22. doi: 10.1002/cncy.21244
16. DeCotiis C, Hu Y, Greenberg AK, Huie M, Tsay JC, Pass H, et al. Inflammatory cytokines and non-small cell lung cancer in a Ct-scan screening cohort: background review of the literature. Cancer biomark (2016) 16(2):219–33. doi: 10.3233/cbm-150559
17. Seemann MD, Beinert T, Fürst H, Fink U. An evaluation of the tumour markers, carcinoembryonic antigen (Cea), cytokeratin marker (Cyfra 21-1) and neuron-specific enolase (Nse) in the differentiation of Malignant from benign solitary pulmonary lesions. Lung Cancer (1999) 26(3):149–55. doi: 10.1016/s0169-5002(99)00084-7
18. Zhang M, Zhuo N, Guo Z, Zhang X, Liang W, Zhao S, et al. Establishment of a mathematic model for predicting Malignancy in solitary pulmonary nodules. J Thorac Dis (2015) 7(10):1833–41. doi: 10.3978/j.issn.2072-1439.2015.10.56
19. Mantovani A, Allavena P, Sica A, Balkwill F. Cancer-related inflammation. Nature (2008) 454(7203):436–44. doi: 10.1038/nature07205
20. McKeown DJ, Brown DJ, Kelly A, Wallace AM, McMillan DC. The relationship between circulating concentrations of C-reactive protein, inflammatory cytokines and cytokine receptors in patients with non-small-cell lung cancer. Br J Cancer (2004) 91(12):1993–5. doi: 10.1038/sj.bjc.6602248
21. Brenner DR, Fanidi A, Grankvist K, Muller DC, Brennan P, Manjer J, et al. Inflammatory cytokines and lung cancer risk in 3 prospective studies. Am J Epidemiol (2017) 185(2):86–95. doi: 10.1093/aje/kww159
22. Biaoxue R, Hua L, Wenlong G, Shuanying Y. Increased serum amyloid a as potential diagnostic marker for lung cancer: A meta-analysis based on nine studies. BMC Cancer (2016) 16(1):836. doi: 10.1186/s12885-016-2882-0
23. Yuh YJ, Kim SR. Actate dehydrogenase (Ldh) as a tumor marker for non-small cell lung cancer. Cancer Res Treat (2002) 34(5):339–44. doi: 10.4143/crt.2002.34.5.339
24. Swensen SJ, Silverstein MD, Ilstrup DM, Schleck CD, Edell ES. The probability of Malignancy in solitary pulmonary nodules. Application to small radiologically indeterminate nodules. Arch Intern Med (1997) 157(8):849–55. doi: 10.1001/archinte.1997.00440290031002
25. Gould MK, Ananth L, Barnett PG. A clinical model to estimate the pretest probability of lung cancer in patients with solitary pulmonary nodules. Chest (2007) 131(2):383–8. doi: 10.1378/chest.06-1261
26. McWilliams A, Tammemagi MC, Mayo JR, Roberts H, Liu G, Soghrati K, et al. Probability of cancer in pulmonary nodules detected on first screening Ct. N Engl J Med (2013) 369(10):910–9. doi: 10.1056/NEJMoa1214726
27. Suzuki K, Koike T, Asakawa T, Kusumoto M, Asamura H, Nagai K, et al. A prospective radiological study of thin-section computed tomography to predict pathological noninvasiveness in peripheral clinical Ia lung cancer (Japan clinical oncology group 0201). J Thorac Oncol (2011) 6(4):751–6. doi: 10.1097/JTO.0b013e31821038ab
28. Hattori A, Suzuki K, Takamochi K, Wakabayashi M, Aokage K, Saji H, et al. Prognostic impact of a ground-glass opacity component in clinical stage ia non-small cell lung cancer. J Thorac Cardiovasc Surg (2021) 161(4):1469–80. doi: 10.1016/j.jtcvs.2020.01.107
29. Succony L, Rassl DM, Barker AP, McCaughan FM, Rintoul RC. Adenocarcinoma spectrum lesions of the lung: detection, pathology and treatment strategies. Cancer Treat Rev (2021) 99:102237. doi: 10.1016/j.ctrv.2021.102237
30. Tsutani Y, Suzuki K, Koike T, Wakabayashi M, Mizutani T, Aokage K, et al. High-risk factors for recurrence of stage I lung adenocarcinoma: follow-up data from jcog0201. Ann Thorac Surg (2019) 108(5):1484–90. doi: 10.1016/j.athoracsur.2019.05.080
31. Zhang P, Li T, Tao X, Jin X, Zhao S. Hrct features between lepidic-predominant type and other pathological subtypes in early-stage invasive pulmonary adenocarcinoma appearing as a ground-glass nodule. BMC Cancer (2021) 21(1):1124. doi: 10.1186/s12885-021-08821-5
32. Huang H, Ye B. [Research progress in the effect of consolidation tumor ratio on the diagnosis and treatment of early-stage peripheral lung cancer]. Zhongguo Fei Ai Za Zhi (2022) 25(10):764–70. doi: 10.3779/j.issn.1009-3419.2022.102.40
33. Obuchowski NA, Bullen JA. Receiver Operating Characteristic (Roc) curves: review of methods with applications in diagnostic medicine. Phys Med Biol (2018) 63(7):07tr1. doi: 10.1088/1361-6560/aab4b1
34. Nattino G, Pennell ML, Lemeshow S. Assessing the goodness of fit of logistic regression models in large samples: A modification of the hosmer-lemeshow test. Biometrics (2020) 76(2):549–60. doi: 10.1111/biom.13249
35. Rosenfeld JP, Donchin E. Resampling (Bootstrapping) the mean: A definite do. Psychophysiology (2015) 52(7):969–72. doi: 10.1111/psyp.12421
36. Vickers AJ, Holland F. Decision curve analysis to evaluate the clinical benefit of prediction models. Spine J (2021) 21(10):1643–8. doi: 10.1016/j.spinee.2021.02.024
37. Didkowska J, Wojciechowska U, Mańczuk M, Łobaszewski J. Lung cancer epidemiology: contemporary and future challenges worldwide. Ann Transl Med (2016) 4(8):150. doi: 10.21037/atm.2016.03.11
38. Rolfo C, Passiglia F, Ostrowski M, Farracho L, Ondøichová T, Dolcan A, et al. Improvement in lung cancer outcomes with targeted therapies: an update for family physicians. J Am Board Fam Med (2015) 28(1):124–33. doi: 10.3122/jabfm.2015.01.140072
39. Siegel RL, Miller KD, Jemal A. Cancer statistics, 2018. CA Cancer J Clin (2018) 68(1):7–30. doi: 10.3322/caac.21442
40. Alberg AJ, Brock MV, Ford JG, Samet JM, Spivack SD. Epidemiology of lung cancer: diagnosis and management of lung cancer, 3rd Ed: American College of chest physicians evidence-based clinical practice guidelines. Chest (2013) 143(5 Suppl):e1S–e29S. doi: 10.1378/chest.12-2345
41. Bates JHT, Hamlington KL, Garrison G, Kinsey CM. Prediction of lung cancer risk based on age and smoking history. Comput Methods Programs BioMed (2022) 216:106660. doi: 10.1016/j.cmpb.2022.106660
42. Toumazis I, Bastani M, Han SS, Plevritis SK. Risk-based lung cancer screening: A systematic review. Lung Cancer (2020) 147:154–86. doi: 10.1016/j.lungcan.2020.07.007
43. Guida F, Sun N, Bantis LE, Muller DC, Li P, Taguchi A, et al. Assessment of lung cancer risk on the basis of a biomarker panel of circulating proteins. JAMA Oncol (2018) 4(10):e182078. doi: 10.1001/jamaoncol.2018.2078
44. Wang S, Tian S, Li Y, Zhan N, Guo Y, Liu Y, et al. Development and validation of a novel scoring system developed from a nomogram to identify Malignant pleural effusion. EBioMedicine (2020) 58:102924. doi: 10.1016/j.ebiom.2020.102924
45. Wang S, Chen A, Yang L, Cai L, Xie Y, Fujimoto J, et al. Comprehensive analysis of lung cancer pathology images to discover tumor shape and boundary features that predict survival outcome. Sci Rep (2018) 8(1):10393. doi: 10.1038/s41598-018-27707-4
46. Xiang Y, Sun Y, Gao W, Han B, Chen Q, Ye X, et al. [Establishment of a predicting model to evaluate the probability of Malignancy or benign in patients with solid solitary pulmonary nodules]. Zhonghua Yi Xue Za Zhi (2016) 96(17):1354–8. doi: 10.3760/cma.j.issn.0376-2491.2016.17.011
47. Zhou L, Zhou Z, Liu F, Sun H, Zhou B, Dai L, et al. Establishment and validation of a clinical model for diagnosing solitary pulmonary nodules. J Surg Oncol (2022) 126(7):1316–29. doi: 10.1002/jso.27041
48. Xia C, Liu M, Li X, Zhang H, Li X, Wu D, et al. Prediction model for lung cancer in high-risk nodules being considered for resection: development and validation in a chinese population. Front Oncol (2021) 11:700179. doi: 10.3389/fonc.2021.700179
49. Tammemagi M, Ritchie AJ, Atkar-Khattra S, Dougherty B, Sanghera C, Mayo JR, et al. Predicting Malignancy risk of screen-detected lung nodules-mean diameter or volume. J Thorac Oncol (2019) 14(2):203–11. doi: 10.1016/j.jtho.2018.10.006
51. Muller DC, Johansson M, Brennan P. Lung cancer risk prediction model incorporating lung function: development and validation in the Uk Biobank prospective cohort study. J Clin Oncol (2017) 35(8):861–9. doi: 10.1200/jco.2016.69.2467
52. Krist AH, Davidson KW, Mangione CM, Barry MJ, Cabana M, Caughey AB, et al. Screening for lung cancer: us preventive services task force recommendation statement. Jama (2021) 325(10):962–70. doi: 10.1001/jama.2021.1117
53. Mouronte-Roibás C, Leiro-Fernández V, Fernández-Villar A, Botana-Rial M, Ramos-Hernández C, Ruano-Ravina A. Copd, emphysema and the onset of lung cancer. A Systematic Review. Cancer Lett (2016) 382(2):240–4. doi: 10.1016/j.canlet.2016.09.002
54. MacMahon H, Austin JH, Gamsu G, Herold CJ, Jett JR, Naidich DP, et al. Guidelines for management of small pulmonary nodules detected on ct scans: A statement from the fleischner society. Radiology (2005) 237(2):395–400. doi: 10.1148/radiol.2372041887
55. Zulueta JJ, Wisnivesky JP, Henschke CI, Yip R, Farooqi AO, McCauley DI, et al. Emphysema scores predict death from copd and lung cancer. Chest (2012) 141(5):1216–23. doi: 10.1378/chest.11-0101
56. Moro D, Villemain D, Vuillez JP, Delord CA, Brambilla C. Cea, Cyfra21-1 and scc in non-small cell lung cancer. Lung Cancer (1995) 13(2):169–76. doi: 10.1016/0169-5002(95)00485-8
57. Dai H, Liu J, Liang L, Ban C, Jiang J, Liu Y, et al. Increased lung cancer risk in patients with interstitial lung disease and elevated Cea and Ca125 serum tumour markers. Respirology (2014) 19(5):707–13. doi: 10.1111/resp.12317
58. Pastor A, Menéndez R, Cremades MJ, Pastor V, Llopis R, Aznar J. Diagnostic value of Scc, Cea and Cyfra 21.1 in lung cancer: A bayesian analysis. Eur Respir J (1997) 10(3):603–9.
59. Zhao N, Ruan M, Koestler DC, Lu J, Salas LA, Kelsey KT, et al. Methylation-derived inflammatory measures and lung cancer risk and survival. Clin Epigenet (2021) 13(1):222. doi: 10.1186/s13148-021-01214-2
60. Grieshober L, Graw S, Barnett MJ, Thornquist MD, Goodman GE, Chen C, et al. Methylation-derived neutrophil-to-lymphocyte ratio and lung cancer risk in heavy smokers. Cancer Prev Res (Phila) (2018) 11(11):727–34. doi: 10.1158/1940-6207.Capr-18-0111
61. Sanchez-Salcedo P, de-Torres JP, Martinez-Urbistondo D, Gonzalez-Gutierrez J, Berto J, Campo A, et al. The neutrophil to lymphocyte and platelet to lymphocyte ratios as biomarkers for lung cancer development. Lung Cancer (2016) 97:28–34. doi: 10.1016/j.lungcan.2016.04.010
62. Mizuguchi S, Izumi N, Tsukioka T, Komatsu H, Nishiyama N. Neutrophil-lymphocyte ratio predicts recurrence in patients with resected stage 1 non-small cell lung cancer. J Cardiothorac Surg (2018) 13(1):78. doi: 10.1186/s13019-018-0763-0
63. Shoji F, Kozuma Y, Toyokawa G, Yamazaki K, Takeo S. Complete blood cell count-derived inflammatory biomarkers in early-stage non-small-cell lung cancer. Ann Thorac Cardiovasc Surg (2020) 26(5):248–55. doi: 10.5761/atcs.oa.19-00315
64. Suzuki R, Lin SH, Wei X, Allen PK, Welsh JW, Byers LA, et al. Prognostic significance of pretreatment total lymphocyte count and neutrophil-to-lymphocyte ratio in extensive-stage small-cell lung cancer. Radiother Oncol (2018) 126(3):499–505. doi: 10.1016/j.radonc.2017.12.030
65. Yang HB, Xing M, Ma LN, Feng LX, Yu Z. Prognostic significance of neutrophil-lymphocyteratio/platelet-lymphocyteratioin lung cancers: A meta-analysis. Oncotarget (2016) 7(47):76769–78. doi: 10.18632/oncotarget.12526
66. Watanabe K, Noma D, Masuda H, Masuda M. Preoperative inflammation-based scores predict early recurrence after lung cancer resection. J Thorac Dis (2021) 13(5):2812–23. doi: 10.21037/jtd-20-3458
67. Luo H, Ge H, Cui Y, Zhang J, Fan R, Zheng A, et al. Systemic inflammation biomarkers predict survival in patients of early stage non-small cell lung cancer treated with stereotactic ablative radiotherapy - a single center experience. J Cancer (2018) 9(1):182–8. doi: 10.7150/jca.21703
68. Isaksson J, Wennström L, Branden E, Koyi H, Berglund A, Micke P, et al. Highly elevated systemic inflammation is a strong independent predictor of early mortality in advanced non-small cell lung cancer. Cancer Treat Res Commun (2022) 31:100556. doi: 10.1016/j.ctarc.2022.100556
69. Kobayashi S, Karube Y, Inoue T, Araki O, Maeda S, Matsumura Y, et al. Advanced lung cancer inflammation index predicts outcomes of patients with pathological stage Ia lung adenocarcinoma following surgical resection. Ann Thorac Cardiovasc Surg (2019) 25(2):87–94. doi: 10.5761/atcs.oa.18-00158
70. Tang Y, Ji Y, Yang M. Prognostic value of pre-treatment advanced lung cancer inflammation index in non-small cell lung cancer: A meta-analysis. Biomarkers (2022) 27(5):441–7. doi: 10.1080/1354750x.2022.2055147
71. Aduquaye M, Dube S, Bashir B, Chowdhury A, Ahmed N, Leylek A, et al. Impact of pre-treatment Nlr and other hematologic biomarkers on the outcomes of early-stage non-small-cell lung cancer treated with stereotactic body radiation therapy. Curr Oncol (2022) 29(1):193–208. doi: 10.3390/curroncol29010019
72. Kobayashi S, Karube Y, Matsumura Y, Nishihira M, Inoue T, Araki O, et al. Inflammatory risk factors for early recurrence of non-small cell lung cancer within one year following curative resection. World J Surg (2020) 44(10):3510–21. doi: 10.1007/s00268-020-05612-0
73. Jeong E, Hyun SH, Moon SH, Cho YS, Kim BT, Lee KH. Relation between tumor Fdg uptake and hematologic prognostic indicators in stage I lung cancer patients following curative resection. Med (Baltimore) (2017) 96(5):e5935. doi: 10.1097/md.0000000000005935
74. Pinato DJ, Shiner RJ, Seckl MJ, Stebbing J, Sharma R, Mauri FA. Prognostic performance of inflammation-based prognostic indices in primary operable non-small cell lung cancer. Br J Cancer (2014) 110(8):1930–5. doi: 10.1038/bjc.2014.145
75. Huang W, Wang S, Zhang H, Zhang B, Wang C. Prognostic significance of combined fibrinogen concentration and neutrophil-to-lymphocyte ratio in patients with resectable non-small cell lung cancer. Cancer Biol Med (2018) 15(1):88–96. doi: 10.20892/j.issn.2095-3941.2017.0124
76. Grunnet M, Sorensen JB. Carcinoembryonic antigen (Cea) as tumor marker in lung cancer. Lung Cancer (2012) 76(2):138–43. doi: 10.1016/j.lungcan.2011.11.012
77. Jacob M, Romano J, Ara Jo D, Pereira JM, Ramos I, Hespanhol V. Predicting lung nodules Malignancy. Pulmonology (2022) 28(6):454–60. doi: 10.1016/j.pulmoe.2020.06.011
78. Wang Y, van Klaveren RJ, van der Zaag-Loonen HJ, de Bock GH, Gietema HA, Xu DM, et al. Effect of nodule characteristics on variability of semiautomated volume measurements in pulmonary nodules detected in a lung cancer screening program. Radiology (2008) 248(2):625–31. doi: 10.1148/radiol.2482070957
79. Xu DM, van Klaveren RJ, de Bock GH, Leusveld A, Zhao Y, Wang Y, et al. Limited value of shape, margin and Ct density in the discrimination between benign and Malignant screen detected solid pulmonary nodules of the nelson trial. Eur J Radiol (2008) 68(2):347–52. doi: 10.1016/j.ejrad.2007.08.027
80. She Y, Zhao L, Dai C, Ren Y, Jiang G, Xie H, et al. Development and validation of a nomogram to estimate the pretest probability of cancer in chinese patients with solid solitary pulmonary nodules: A multi-institutional study. J Surg Oncol (2017) 116(6):756–62. doi: 10.1002/jso.24704
81. Chen XB, Yan RY, Zhao K, Zhang DF, Li YJ, Wu L, et al. Nomogram for the prediction of Malignancy in small (8-20 mm) indeterminate solid solitary pulmonary nodules in chinese populations. Cancer Manag Res (2019) 11:9439–48. doi: 10.2147/cmar.S225739
82. Hattori A, Suzuki K, Matsunaga T, Fukui M, Tsushima Y, Takamochi K, et al. Tumour standardized uptake value on positron emission tomography is a novel predictor of adenocarcinoma in situ for C-stage Ia lung cancer patients with a part-solid nodule on thin-section computed tomography scan. Interact Cardiovasc Thorac Surg (2014) 18(3):329–34. doi: 10.1093/icvts/ivt500
83. Shao W, Zhang Z, Liu Z, Zhang Z, Sun H, Wang X, et al. The value of pulmonary nodule diameter and consolidation/tumor rate in the prediction of lymph node metastasis in early-stage (Ct1n0m0) lung adenocarcinoma. Transl Cancer Res (2021) 10(1):38–46. doi: 10.21037/tcr-20-2548
84. Kuriyama K, Seto M, Kasugai T, Higashiyama M, Kido S, Sawai Y, et al. Ground-glass opacity on thin-section Ct: value in differentiating subtypes of adenocarcinoma of the lung. AJR Am J Roentgenol (1999) 173(2):465–9. doi: 10.2214/ajr.173.2.10430155
85. Kim EA, Johkoh T, Lee KS, Han J, Fujimoto K, Sadohara J, et al. Quantification of ground-glass opacity on high-resolution Ct of small peripheral adenocarcinoma of the lung: pathologic and prognostic implications. AJR Am J Roentgenol (2001) 177(6):1417–22. doi: 10.2214/ajr.177.6.1771417
86. Aoki T, Nakata H, Watanabe H, Nakamura K, Kasai T, Hashimoto H, et al. Evolution of peripheral lung adenocarcinomas: Ct findings correlated with histology and tumor doubling time. AJR Am J Roentgenol (2000) 174(3):763–8. doi: 10.2214/ajr.174.3.1740763
87. Kodama K, Higashiyama M, Yokouchi H, Takami K, Kuriyama K, Mano M, et al. Prognostic value of ground-glass opacity found in small lung adenocarcinoma on high-resolution Ct scanning. Lung Cancer (2001) 33(1):17–25. doi: 10.1016/s0169-5002(01)00185-4
88. Suzuki K, Asamura H, Kusumoto M, Kondo H, Tsuchiya R. “Early” Peripheral lung cancer: prognostic significance of ground glass opacity on thin-section computed tomographic scan. Ann Thorac Surg (2002) 74(5):1635–9. doi: 10.1016/s0003-4975(02)03895-x
Keywords: solitary pulmonary nodules, radiological characteristics, predictive model, nomogram, diagnosis
Citation: Xue M, Li R, Wang K, Liu W, Liu J, Li Z, Ma Z, Zhang H, Tian H and Tian Y (2023) Nomogram combining clinical and radiological characteristics for predicting the malignant probability of solitary pulmonary nodules measuring ≤ 2 cm. Front. Oncol. 13:1196778. doi: 10.3389/fonc.2023.1196778
Received: 30 March 2023; Accepted: 04 September 2023;
Published: 18 September 2023.
Edited by:
Giuseppe Cardillo, Thoracic Surgery, ItalyReviewed by:
Andrea Imperatori, University of Insubria, ItalyCopyright © 2023 Xue, Li, Wang, Liu, Liu, Li, Ma, Zhang, Tian and Tian. This is an open-access article distributed under the terms of the Creative Commons Attribution License (CC BY). The use, distribution or reproduction in other forums is permitted, provided the original author(s) and the copyright owner(s) are credited and that the original publication in this journal is cited, in accordance with accepted academic practice. No use, distribution or reproduction is permitted which does not comply with these terms.
*Correspondence: Hui Tian, dGlhbmh1aXFsQGVtYWlsLnNkdS5lZHUuY24=; Yu Tian, dGlhbnl1OTMwMzE0QGVtYWlsLnNkdS5lZHUuY24=
Disclaimer: All claims expressed in this article are solely those of the authors and do not necessarily represent those of their affiliated organizations, or those of the publisher, the editors and the reviewers. Any product that may be evaluated in this article or claim that may be made by its manufacturer is not guaranteed or endorsed by the publisher.
Research integrity at Frontiers
Learn more about the work of our research integrity team to safeguard the quality of each article we publish.