 Yu Zhang
 Yuanying Shi1†
 Liefu Ye
 Yongbao Wei
 Wenxin Chen
- 1Department of Nuclear Medicine, Shengli Clinical Medical College of Fujian Medical University, Fuzhou, China
- 2Department of Nuclear Medicine, Fujian Provincial Hospital, Fuzhou, China
- 3Department of Nuclear Medicine, Fujian Research Institute of Nuclear Medicine, Fuzhou, China
- 4Department of Urology, Shengli Clinical Medical College of Fujian Medical University, Fuzhou, China
- 5Department of Urology, Fujian Provincial Hospital, Fuzhou, China
Purpose: This prospective study aimed to evaluate the difference between 99mTc-PSMA single-photon emission computed tomography (SPECT)/CT and multiparametric magnetic resonance imaging (mpMRI) in the detection of primary prostate cancer (PCa).
Materials and methods: Fifty-six men with suspected PCa between October 2019 and November 2022 were prospectively enrolled in this study. The median age of the patients was 70 years (range, 29-87 years). Patients were divided into high-(Gleason score>7, n=31), medium- (Gleason score=7, n=6) and low-risk groups (Gleason score < 7, n=6). All patients underwent 99mTc-PSMA SPECT/CT and mpMRI at an average interval of 3 days (range, 1-7 days). The maximum standardized uptake value (SUVmax), the minimum apparent diffusion coefficient (ADCmin), and their ratio (SUVmax/ADCmin) were used as imaging parameters to distinguish benign from malignant prostatic lesions.
Results: Of the 56 patients, 12 were pathologically diagnosed with a benign disease, and 44 were diagnosed with PCa. 99mTc-PSMA SPECT/CT and mpMRI showed no significant difference in the detection of primary PCa (kappa =0.401, P=0.002), with sensitivities of 97.7% (43/44) and 90.9% (40/44), specificities of 75.0% (9/12) and 75.0% (9/12), and AUC of 97.4% and 95.1%, respectively. The AUC of SUVmax/ADCmin was better than those of SUVmax or ADCmin alone. When SUVmax/ADCmin in the prostatic lesion was >7.0×10³, the lesion was more likely to be malignant. When SUVmax/ADCmin in the prostatic lesion is >27.0×10³, the PCa patient may have lymph node and bone metastases. SUVmax was positively correlated with the Gleason score (r=0.61, P=0.008), whereas ADCmin was negatively correlated with the Gleason score (r=-0.35, P=0.023). SUVmax/ADCmin was positively correlated with the Gleason score (r=0.59, P=0.023). SUVmax/ADCmin was the main predictor of the high-risk group, with an optimal cut-off value of 15.0×10³.
Conclusions: The combination of 99mTc-PSMA SPECT/CT and mpMRI can improve the diagnostic efficacy for PCa compared with either modality alone; SUVmax/ADCmin is a valuable differential diagnostic imaging parameter.
Introduction
Prostate cancer (PCa) is one of the most common malignancies in men (1). Early diagnosis and accurate grading of PCa are of great significance for formulating therapeutic strategies and improving prognosis (2). Multiparametric magnetic resonance imaging (mpMRI) is a well-established tool for the appraisal of primary PCa and has shown high affectability (3, 4). Prostate biopsy remains the gold standard for PCa diagnosis. In addition to providing evidence for diagnosis, the pathological results can also provide the classification and grouping information of PCa. Ultrasound-guided puncture biopsy still has a high false-negative rate of 20-25%, and there are complications such as bleeding, infection, pain, and urinary retention (3). Therefore, it is important to explore a noninvasive preoperative diagnosis method for PCa to improve puncture accuracy and avoid unnecessary biopsy. Current strategies used to locally stage PCa and recognize the exact location of disease foci depend on the results of systematic or targeted biopsies and mpMRI. However, mpMRI has limited specificity (4–6). Although targeted mpMRI biopsies have significantly improved the identification of clinical PCa, there is still over a 30% chance of missing primary PCa in men (7). Therefore, additional complementary methods are required to better characterize and identify primary PCa.
Prostate-specific membrane antigen (PSMA) is a type II transmembrane protein that is overexpressed on the surface of 90% of PCa cells. Its expression positively correlates with the degree of malignancy (8). Published studies have demonstrated the superiority of 68Ga/18F-PSMA PET/CT or PET/MR in the detection of primary PCa. However, PET/CT or PET/MR is not widely available in less developed countries, and far fewer institutions have PET/CT or PET/MR devices than SPECT/CT devices. The limited production of 68Ga from 68Ge-68Ga generator and 18F from cyclotron, combined with the relatively short half-life of 68Ga (67.71 min) and 18F (109.8min), results in the need for multiple rounds of production per day to maintain patient use, limiting the number of patient tests per day. Although clinical SPECT system sensitivity and resolution are not as good as those of PET, the recent combination of SPECT and CT and the ability to quantify tissue radioactivity concentration in absolute units have resulted in a significant improvement in imaging quality. 99mTc, available from 99Mo-99mTc generators, is a nuclide routinely used in SPECT imaging, has good physical properties (half-life is 361.2 min), and is inexpensive and widely available. Thus, 99mTc-based PSMA ligands are a cost-effective clinical alternative. Our previous study showed that 99mTc-labelled PSMA molecular probe (99mTc-HYNIC-Glu-Urea-A, herein referred to as 99mTc-PSMA) single-photon emission computed tomography (SPECT)/CT can display bone metastases of PCa with high sensitivity and specificity (9), with only a small amount of radiation uptake in the intestinal tract and no significant radiation uptake in other major organs (10). However, to our knowledge, 99mTc-PSMA SPECT/CT has rarely been reported for the diagnosis of primary PCa. In recent years, with the development of imaging technology, mpMRI including functional sequences such as diffusion weighted imaging(DWI) had been widely used in the diagnosis and preoperative localization of PCa (5). The ADCmin from DWI reflects the degree of diffusion of water molecules in the tumor tissue. SUVmax represents PSMA expression associated with the biological characteristics of tumors. Our study aimed to evaluate the difference between 99mTc-PSMA SPECT/CT and mpMRI for the detection of primary PCa.
Materials and methods
Ethical approval
This study was approved by the ethics committee of Fujian Provincial Hospital (reference number, K2019-10-017) and conducted in compliance with the principles of the Declaration of Helsinki. Furthermore, informed consent was obtained from all participants and/or their legal guardians.
Sample size calculation
We conducted a prospective head-to-head observational study to analyze the diagnostic efficacy between 99mTc-PSMA SPECT/CT and mpMRI in treatment-naive PCa. In this study, the sensitivity and specificity of 99mTc-PSMA SPECT/CT and mpMRI in the diagnosis of PCa were assumed to be greater than 50% (H0 = 50%). Referring to similar published literature on 68Ga-PSMA PET/CT and mpMRI (11), a sensitivity and specificity value of 80% was assumed. PASS 11 software (Power Analysis and Sample Size, NCSS, LLC) was used to estimate the required sample size. Assuming α=0.05 (unilateral), β=0.1, and a 1:1 ratio between the groups, the calculations indicated that at least 46 patients needed to be included in the study. Consequently, 56 individuals were enrolled in this study.
Patient selection
Fifty-six men were enrolled in this study between October 2019 and November 2022. The inclusion criteria were as follows (2): ① digital rectal examination touching the prostate nodules; ② transrectal ultrasound suspected PCa; ③ PSA>10 ng/mL or progressive PSA increase (12); ④ no treatment administered before the scan; and ⑤ complete medical records, control data, and clinical follow-up results. The exclusion criteria were as follows: ① the presence of severe syndromes that were difficult to manage; ② active or upcoming participation in other clinical drug trials; ③ lack of regular review or follow-up results; ④ a second primary tumor, and ⑤ inability to obtain relevant contrast imaging and clinical data. All eligible patients underwent 99mTc-PSMA SPECT/CT and mpMRI at an average interval of 3 days (1–7 days). None of the patients received antineoplastic therapy between the two scans. After both scans were completed, a transrectal needle prostate biopsy was performed. The patient characteristics are presented in Table 1.
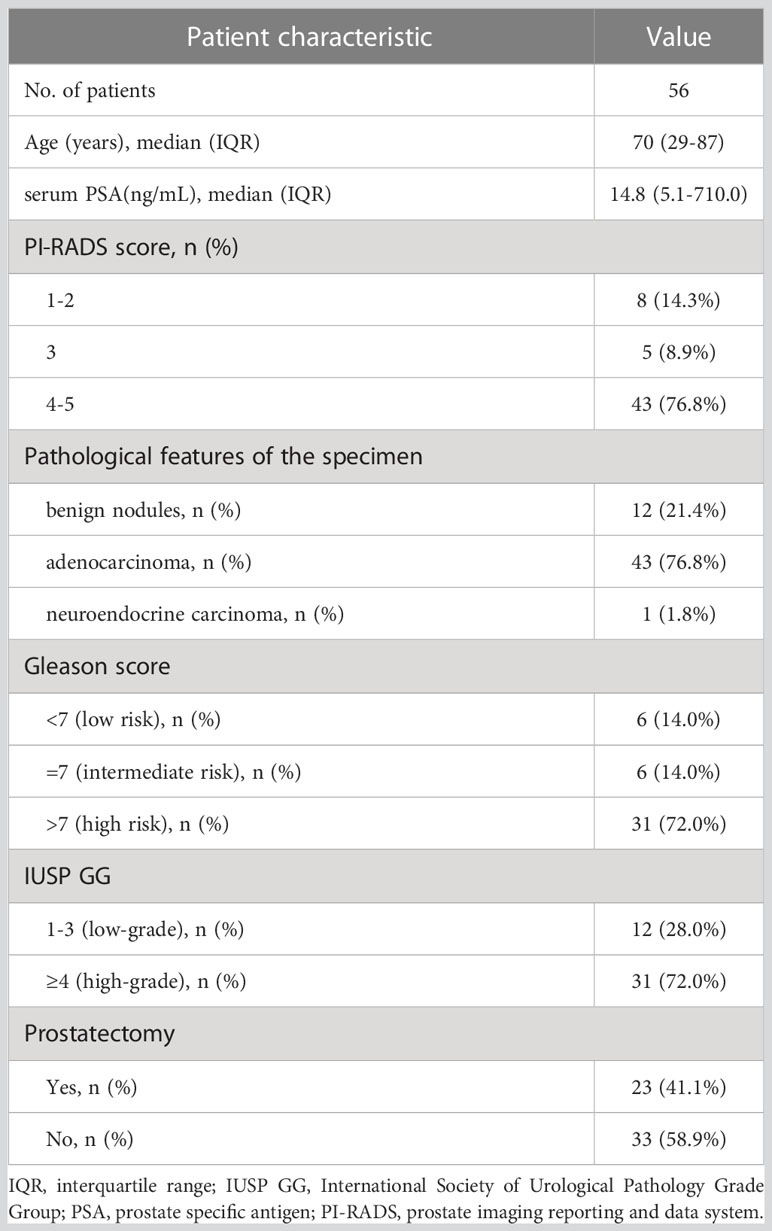
Table 1 Patient characteristics.
99mTc-PSMA SPECT/CT acquisition protocol
The PSMA lyophilized kit (HYNIC-PSMA) (patent number,Zl202010878750.4) was provided by the Shanghai Engineering Research Centre of Molecular Imaging Probes. The synthesis procedure has been reported previously (9). The radiochemical purity was>95%. All patients were injected intravenously with a dose of 0.74 GBq (20 mCi) 99mTc-PSMA. Whole-body planar imaging and regional (neck-pelvic) SPECT/CT were performed 2 h after injection using a Discovery NM/CT 670Pro (GE, USA) with low-energy, high-resolution collimators. The image acquisition protocol was as follows: planar imaging: peak energy 140 keV (99mTc) and scan velocity 15 cm/min in a 256×1025 matrix. Regional SPECT/CT: camera matrix size 128×128, zoom 1.0, rotation 360°, and 30 s/frame for 60 frames. Low-dose CT (130 keV; 60 mA) was used.
mpMRI acquisition protocol
mpMRI was performed with a high-field system (Magnetom Prisma 3.0T, Siemens, The Germany) using a standardized protocol with pelvic external phased-array coils. The sequences included: transverse T1-weighted imaging (T1WI) (repetition time [TR]=500ms, echo time [TE]=12ms, field-of-view [FOV]=20 cm×20 cm, matrix=320×256); T2-weighted imaging (T2WI) (TR=5800ms, TE=106ms, FOV=20 cm×20 cm, matrix=320×256); fat-suppression spectral presaturation attenuated inversion recovery-T2WI (TR=5800ms, TE=97ms, FOV=20 cm×20 cm, matrix=320×240), and diffusion weighted imaging (DWI) (TR=5100ms, TE=64ms, FOV=20 cm×20 cm, matrix=114×114, b=50s/mm2, 600 s/mm2, 1500 s/mm2, 3000 s/mm2). The section thickness of each sequence was 3.5 mm.
Image analysis
99mTc-PSMA SPECT/CT and mpMRI images were independently read by two nuclear medicine physicians and two radiologists, respectively. The readers were blinded to the mpMRI and 99mTc-PSMA SPECT/CT clinical reports and other readers’ findings. 99mTc-PSMA SPECT/CT and mpMRI were performed on a workstation (Xeleris, General Electric, Waukesha, WI) and (syngo.via, Siemens Healthineers, respectively). The locations of lesions on mpMRI and 99mTc-PSMA SPECT/CT images were compared, and lesions with the same locations on the two scans were selected as the primary lesion to extract parameters for analysis.
Diagnostic criteria for primary PCa
On mpMRI, combined with the reconstructed apparent diffusion coefficient (ADC) images, a lesion with a prostate imaging reporting and data system (PI-RADS) score > 3 was considered a positive lesion (PCa) (13). The lesions’ region of interest (ROI) was delineated, and the lowest ADC (ADCmin) was calculated. On SPECT/CT, areas with higher imaging agent uptake than normal prostate tissue after excluding physiological uptake were considered positive lesions (PCa). For imaging-based quantification analysis, Q.Metrix software (Q.Metrix GE Healthcare) was used (14). Acquisition information, including camera sensitivity, activities in full and empty syringes, administration time, and scan time, was input into the system. The volume of interest (VOI) was delineated, and the NM was 0.4. The calculated maximum standardized uptake value (SUV) voxel volume was 3.2×10⁻³ mL. VOI-related quantitative parameters were automatically generated, and SUVmax was used for quantitative analysis.
Diagnostic criteria for PCa metastases
On mpMRI, ①lymph node metastases: round, short-axis diameter>8 mm, uneven signals in lymph nodes on T2WI, irregular boundaries, and evident enhancement on dynamic contrast-enhanced (DCE) (15); ② bone metastases: low signal intensity on T1WI and T2WI, limited diffusion on DWI, and early enhancement after contrast agent injection on DEC (16, 17). On SPECT/CT, ①lymph node and bone metastases: uptake than normal tissue(lesion SUVmax≥liver SUVmax) after excluding lacrimal glands, salivary glands, kidneys, bladder and intestines physiological uptake. The SUVmax of all focal SPECT-positive sites was determined based on the ROI basis (17). In the quantification analysis, the size of each SPECT-positive bone and lymph node correlated with the SUVmax.
Validation of findings
Prostate needle biopsies were performed in all participants. We used a protocol for transperineal MRI/PSMA-ultrasound fusion targeted and systematic biopsy. In brief, the image-guide (cognitive guidance, MRI/US and PSMA/US) technique was used. Targeted and systematic biopsies were performed in the same session. The number of biopsy cores was as follows: 3-4 cores for targeted biopsy and 10-12 cores for systematic biopsy. If the biopsy results were positive, patients with surgical indications underwent radical prostatectomy, and the pathological results were based on the gross specimen. For patients without surgical indications, pathological results were based on biopsy results. If the needle biopsy results are negative and the clinical symptoms are highly indicative of PCa, the patient’s serum PSA value and imaging (mpMRI, 99mTc-PSMA SPECT/CT) should be followed up for 3-6 months. If the disease does not progress, PCa could be excluded. If the disease progresses, an additional needle biopsy should be performed (12). Not all bone and lymph node lesions showed positive pathological results. Thus, the validated method reported in previous studies was used (9, 17). All patients were followed up for at least 6 months (or until death). Serum PSA levels were reviewed every 3 months for all patients. The subsequent therapeutic schedule options depended on the patient’s condition, including radical prostatectomy, local radiation therapy, and chemotherapy. Future imaging modalities were selected according to their respective clinical needs and were not bound by a specific protocol. Patients who met at least one of the following conditions were metastases: ① Response to therapy (hormone therapy and radiation) and subsequent serum PSA decline were confirmed by follow-up examination (MRI, CT, PET, etc.); ② two or more imaging examinations recommended metastases, and ③ PSA≥100 ng/mL, suggesting distant metastases (18).
Statistical analysis
Data analysis was performed using SPSS 19.0 software (statistical product and service solutions, Chicago, Illinois). McNemar’s test was used to compare the cancer detection concordance rates between 99mTc-PSMA SPECT/CT and mpMRI. The Mann-Whitney U test was used to compare the differences in quantitative diagnostic parameters among the different groups. Receiver operating characteristic (ROC) analysis was performed to evaluate the sensitivity, specificity, area under the ROC curve (AUC), and a cut-off value of each parameter. The Kruskal-Wallis test was used to compare the differences in quantitative diagnostic parameters among different tumor size groups. The correlation between the Gleason Score and SUVmax, ADCmin, and SUVmax/ADCmin was evaluated using Spearman correlation analysis. Logistic regression analysis was used to calculate predictors of the Gleason score. P<0.05 was considered statistically significant.
Results
Overall results
Among the 56 participants, 44 (78.5%) were diagnosed with PCa, and 12 (21.5%) with prostate hyperplasia (BPH). A flowchart illustrating the participant inclusion procedure is shown in Figure 1. Among the 44 patients with PCa, one (2%) had neuroendocrine carcinoma, and 43 (98%) had adenocarcinoma. The surgical indications were judged by the urological surgeon according to the clinical status of the patient (2).The 23 patients with PCa diagnosed by puncture underwent robot-assisted laparoscopic radical prostatectomy (RP); postoperative pathology results were consistent with those of puncture in 11 (11/23,47.8%) patients. 12 (12/23,52.2%) patients with PCa experienced pathological upgrading. The Gleason score of patients who underwent surgery was based on the surgical specimen, and the Gleason score of patients who did not undergo surgery was based on the puncture specimen. Among 44 patients with PCa, 23 (52.3%) had metastases.
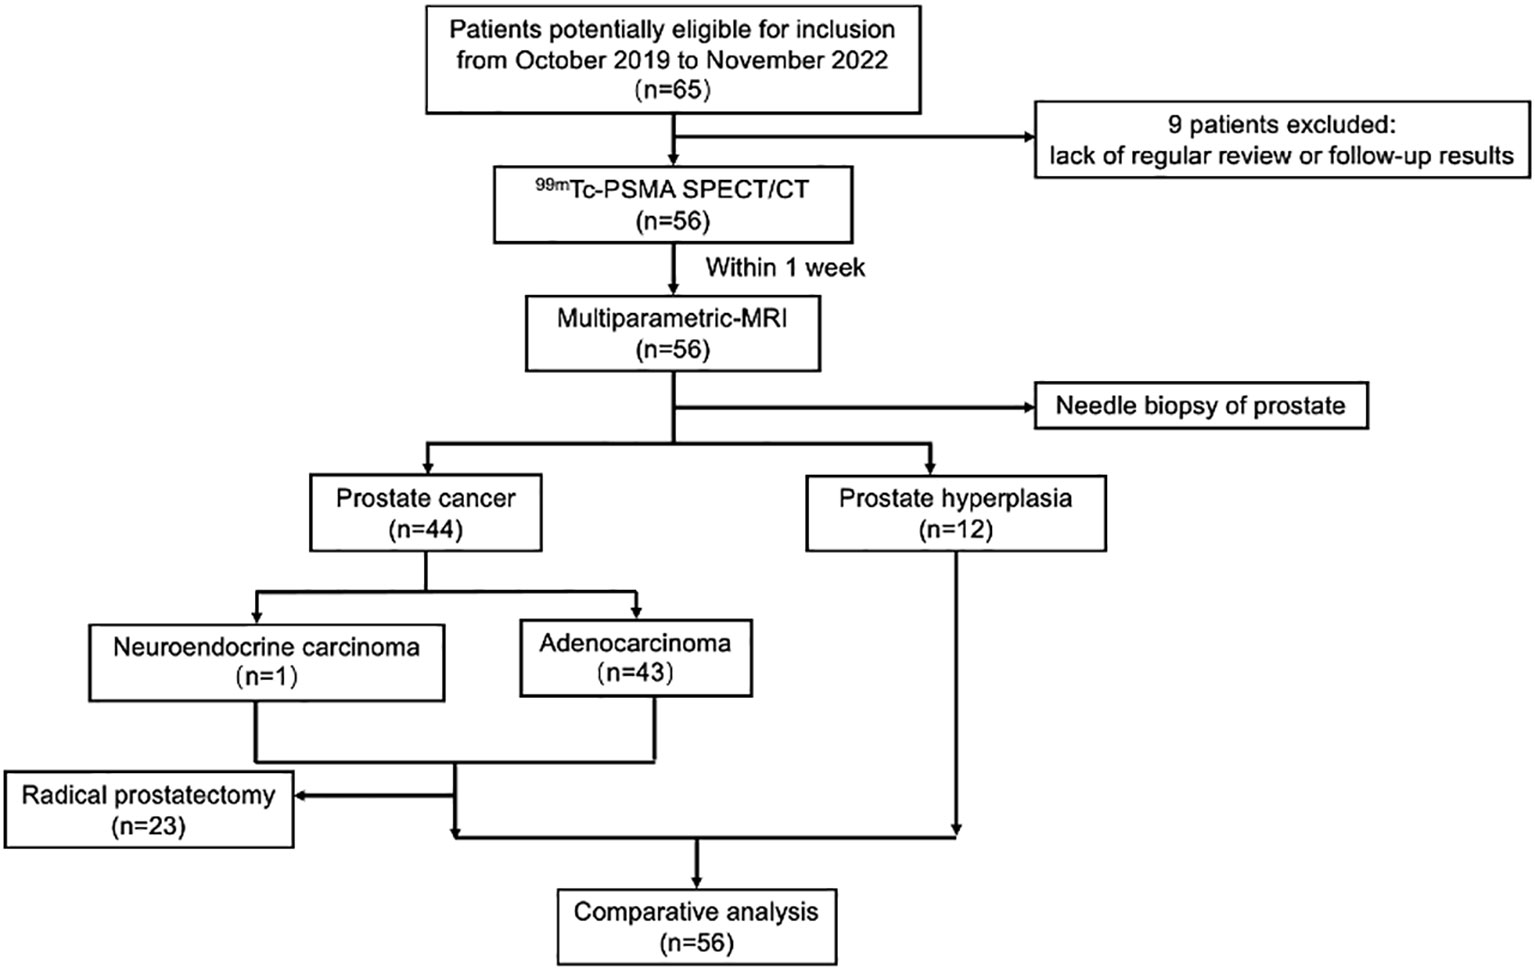
Figure 1 Flowchart of participant selection in the study. 99mTc-PSMA SPECT/CT, 99mTc-labelled prostate-specific membrane antigen molecular probe single photon emission computed tomography; MRI, magnetic resonance imaging.
Sensitivity and specificity analyses
For all 56 patients, the sensitivity of 99mTc-PSMA SPECT/CT and mpMRI in detecting primary PCa was 97.7% (43/44) and 90.9% (40/44), respectively; the difference was not statistically significant (χ2 = 0.102, P=0.749). Their specificity was 75.0% (9/12) and 75.0% (9/12), respectively, with no statistically significant difference (χ2 = 1.333, P=0.248) (Table 2). ROC curve analysis revealed an accuracy, as measured by AUC, of 97.4% (95% CI. 93.7%-100.0%) for 99mTc-PSMA, 95.1% (95% CI. 88.8%-100.0%) for mpMRI, and 98.2% (95% CI. 95.2%-100.0%) for 99mTc-PSMA+mpMRI (Figure 2).
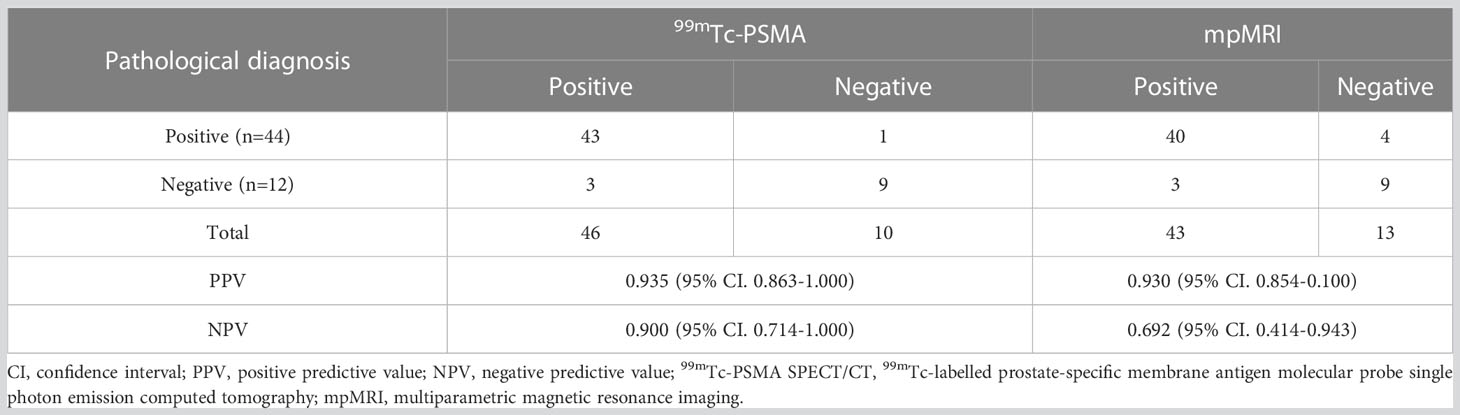
Table 2 99mTc-PSMA SPECT/CT and mpMRI in the diagnosis of primary prostate cancer.
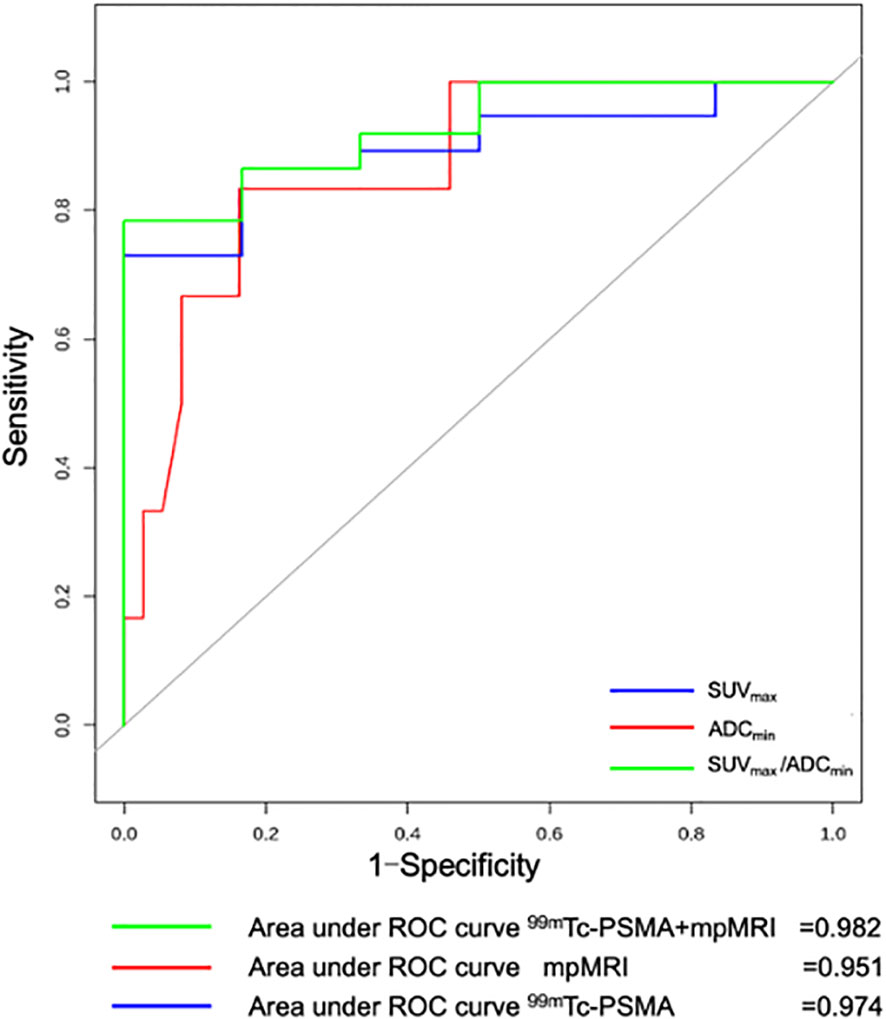
Figure 2 Receiver operating curve (ROC) for 99mTc-PSMA SPECT/CT, mpMRI, and 99mTc-PSMA SPECT/CT+ mpMRI for detection of primary prostate cancer (n=56). 99mTc-PSMA SPECT/CT, 99mTc-labelled prostate-specific membrane antigen molecular probe single photon emission computed tomography; mpMRI, multiparametric magnetic resonance imaging; SUVmax, maximum standardized uptake value; ADCmin, the minimum apparent diffusion coefficient.
Differences in quantitative parameters among different groups
The Mann-Whitney U test was used to compare differences in quantitative diagnostic parameters among the different groups (Table 2). The SUVmax/ADCmin of the PCa group was significantly higher than that of the BPH group, and the SUVmax/ADCmin of the subgroup with metastases was higher than that of the subgroup without metastasis (Table 2). In 99mTc-PSMA SPECT/CT combined with mpMRI, when the cut-off value for SUVmax/ADCmin was set at 7.0×10³, the sensitivity and specificity of SUVmax/ADCmin in PCa were 93.2% (95%CI.85.7%-100.0%) and 100.0% (95%CI.100.0%-100.0%), respectively, with a Youden index of 0.932 and an AUC of 0.982 (95% CI. 95.2%-100.0%) (Figure 3). When the cut-off value for SUVmax/ADCmin was set at 27.0×10³, the sensitivity and specificity of SUVmax/ADCmin in PCa with metastases was 76.2% (95%CI.58.0%-99.4%) and 73.9% (95%CI.56.0%-91.9%), respectively, with a Youden index=0.501 and AUC=0.760 (95% CI. 61.0%-91.0%) (Figure 3A).
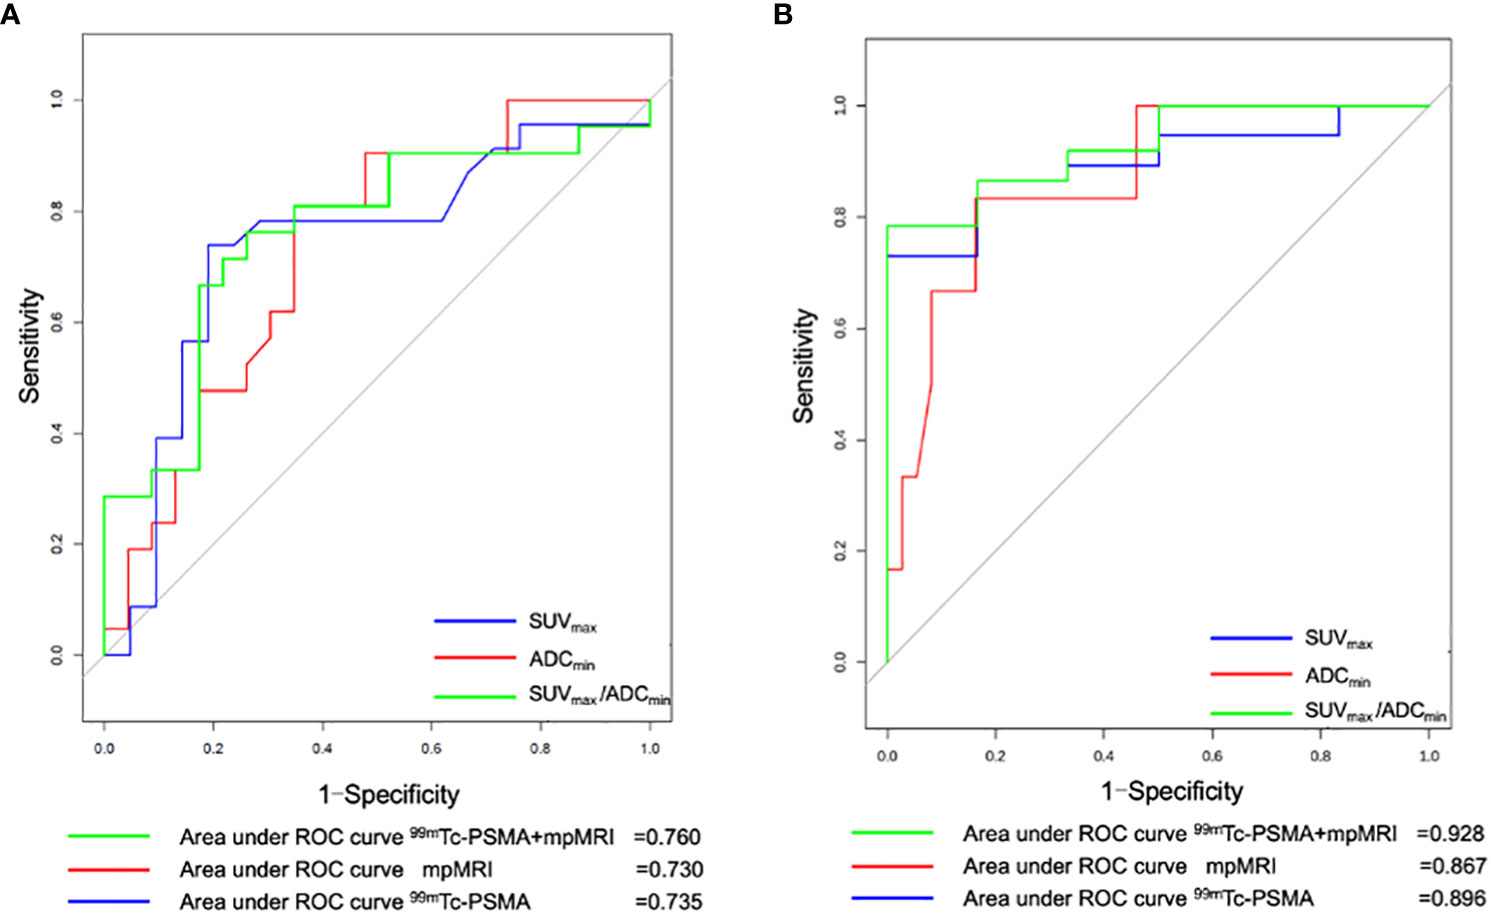
Figure 3 Receiver operating curve (ROC) for (A)99mTc-PSMA SPECT/CT, mpMRI, and 99mTc-PSMA SPECT/CT+ mpMRI for detecting prostate cancer with metastases (n=44) and for (B) 99mTc-PSMA SPECT/CT, mpMRI and 99mTc-PSMA SPECT/CT+ mpMRI for detection of prostate cancer with Gleason score ≥7 (n=43). 99mTc-PSMA SPECT/CT, 99mTc-labelled prostate-specific membrane antigen molecular probe single photon emission computed tomography; mpMRI, multiparametric magnetic resonance imaging; SUVmax, maximum standardized uptake value; ADCmin, the minimum apparent diffusion coefficient.
Difference between tumor size and quantitative parameters
The 44 prostatic lesions detected were grouped according to their maximum tumor diameter: G1 (7/44, maximum diameter < 1.0 cm), G2 (23/44, maximum diameter: 1.0 cm-3.0 cm), and G3 (14/44, maximum diameter > 3.0 cm). The Kruska–Wallis test was used to compare the differences in quantitative diagnostic parameters among different tumor size groups. There were differences in SUVmax/ADCmin among the tumor size groups; the larger the tumor size, the larger the SUVmax/ADCmin value (Figure 4).
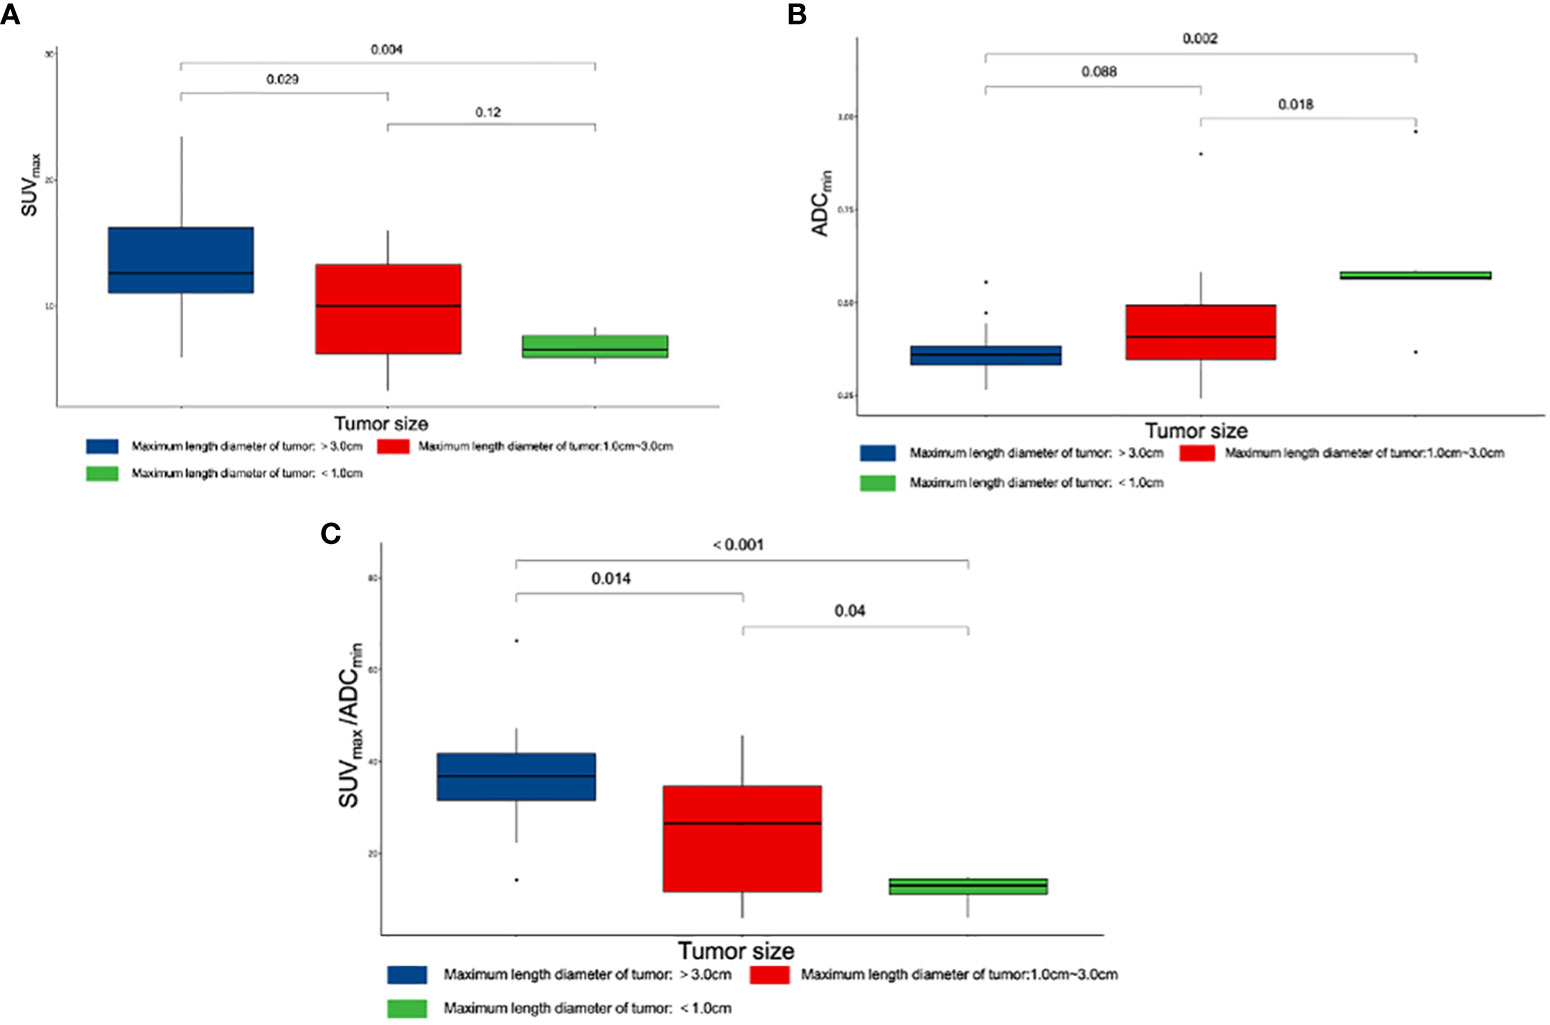
Figure 4 Box plot of different parameters and tumor size. (A) Differences among SUVmax and tumor size. (B) Differences among ADCmin and tumor size. (C) Differences among SUVmax/ADCmin and tumor size. SUVmax, maximum standardized uptake value; ADCmin, the minimum apparent diffusion coefficient.
Relationship between Gleason score and quantitative parameters
Gleason scoring is unsuitable for treating neuroendocrine PCa (19). Therefore, 43 patients with PCa were enrolled in this cohort study. Spearman correlation analysis was used, and the results revealed that ADCmin showed a weak negative correlation with Gleason score (r=-0.35, P=0.023), whereas SUVmax (r=0.61, P=0.008) and SUVmax/ADCmin (r=0.59, P=0.023) showed a moderate positive correlation with Gleason score (Figure 5). Based on the Gleason score, the patients were divided into high-(Gleason score>7, n=31), medium- (Gleason score=7a, n=4;Gleason score=7b, n=2) and low-risk groups (Gleason score < 7, n=6). According to the Mann-Whitney U test, there were statistical differences in SUVmax, ADCmin, and SUVmax/ADCmin between the high-, medium- and low-risk groups (all P < 0.05) (Table 3). With the presence of a high-risk group (yes=1, no=0) as the dependent variable, and age, serum PSA level, and SUVmax/ADCmin as the independent variables, logistic regression analysis showed that SUVmax/ADCmin was independently correlated with the presence of a high-risk group; for every 1×10³ increase in SUVmax/ADCmin, the detection rate of the high-risk group increased by 55.7% (OR=1.557, P=0.042). When the cut-off value for SUVmax/ADCmin was set at 15.0×10³, the sensitivity and specificity of SUVmax/ADCmin in the high-risk PCa group were 78.4% (95%CI.65.1%-91.6%) and 100.0% (95%CI.100.0%-100.0%), respectively, with a Youden index of 0.784 and AUC of 0.928 (95% CI. 84.0%-100.0%) (Figure 3B) (Table 4).
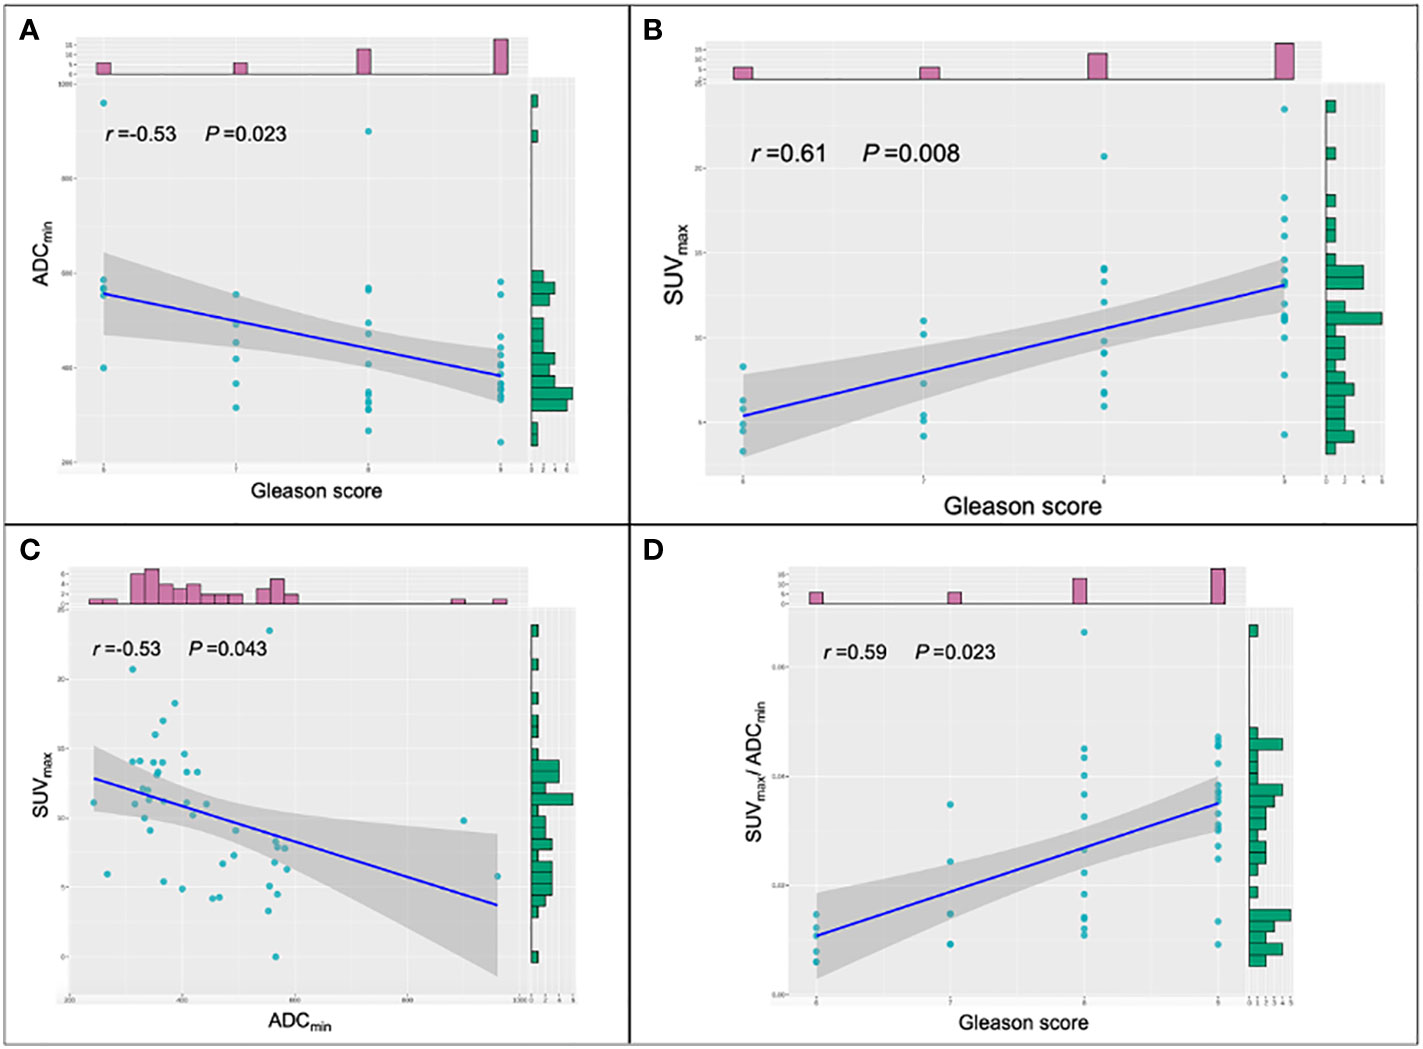
Figure 5 Scatter plots of the different parameters and Gleason score. (A) Correlations among ADCmin and Gleason score in prostate cancer (PCa) lesions. (B) Correlations among SUVmax and Gleason score in PCa lesions. (C) Correlations among SUVmax and ADCmin in PCa lesions. (D) Correlations among SUVmax/ADCmin and Gleason score in PCa lesions. SUVmax, maximum standardized uptake value; ADCmin, the minimum apparent diffusion coefficient.
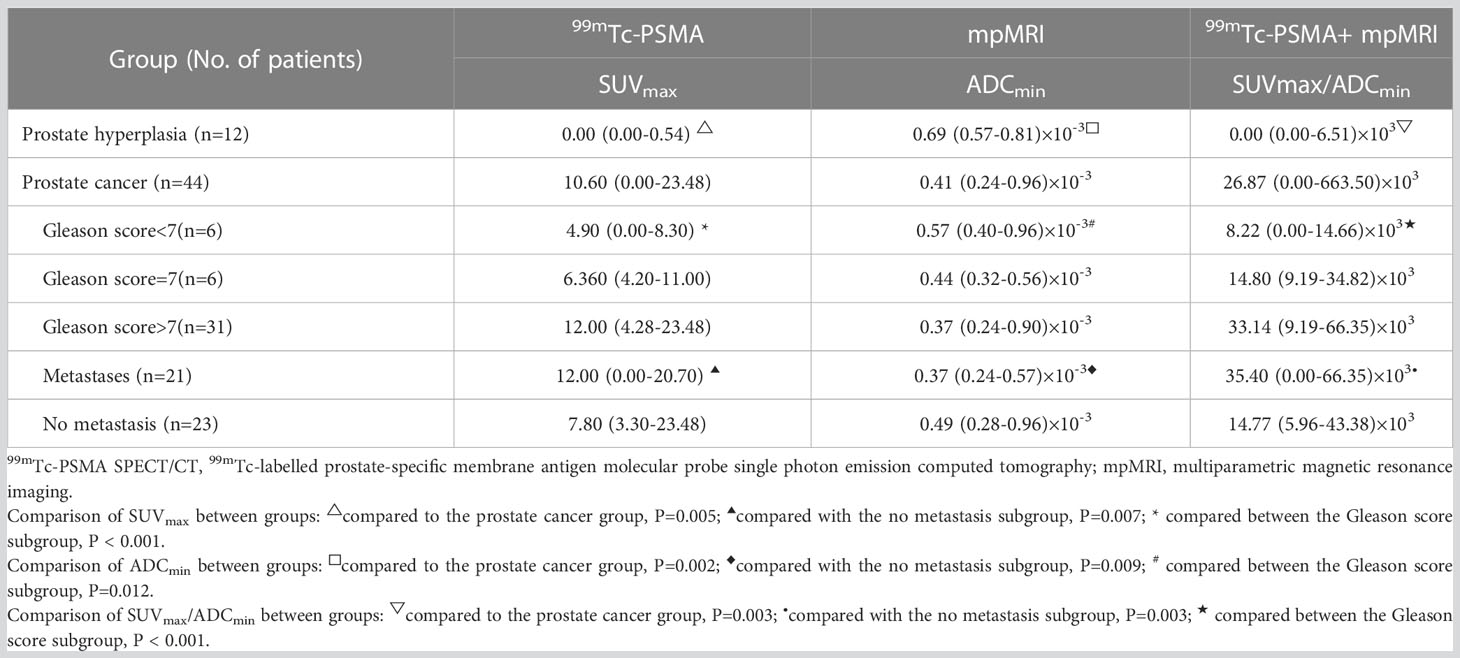
Table 3 Difference between the three diagnostic parameters among different groups.
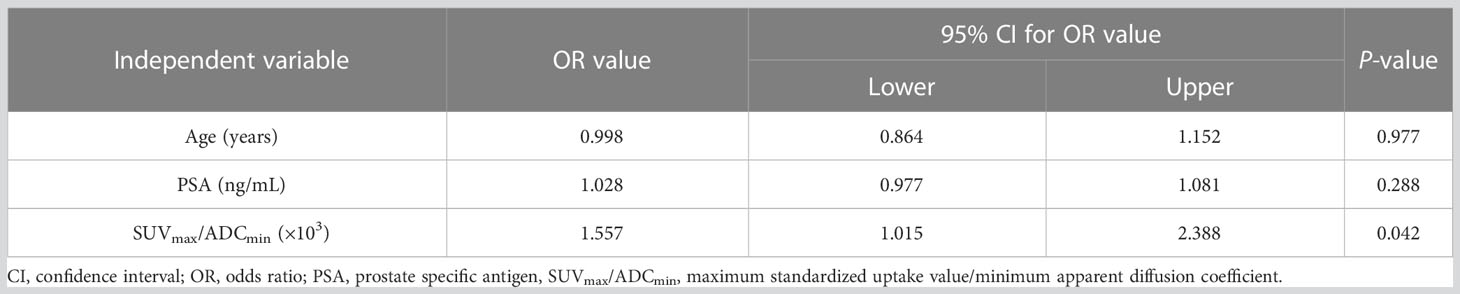
Table 4 Multivariate logistic regression analysis of related factors of Gleason score.
Discussion
The labeling method for 99mTc-HYNIC-Glu-Urea-A(99mTc-PSMA) is simple and has high radiochemical purity (10). Previous studies have demonstrated the high diagnostic efficacy of 99mTc-PSMA SPECT/CT in detecting recurrent biochemical lesions after radical prostatectomy and bone metastases of PCa (9, 20). With the introduction of imaging technology, the diagnosis and initial management of localized PCa are increasingly dependent on imaging findings. 99mTc-PSMA SPECT/CT is predominantly used in the primary PCa staging of regional and distant diseases. However, little is known about the value of 99mTc-PSMA SPECT/CT for the primary detection of lesions within the prostate. To our knowledge, this is the first comparison between 99mTc-PSMA SPECT/CT and mpMRI for primary PCa lesions.
In our cohort study, 99mTc-PSMA SPECT/CT and mpMRI had limited specificity for detecting primary PCa lesions. SUVmax and ADCmin are important quantitative parameters in SPECT/CT and mpMRI, respectively. Typical PCa foci showed localized high-uptake foci on 99mTc-PSMA SPECT/CT and low-signal foci on mpMRI ADC maps (Figure 6). Previous studies on PCa detection by PET have shown that there may be a certain degree of correlation between mpMRI and PET parameters in the same PCa lesion; that is, SUVmax and ADCmin were negatively correlated (21, 22). Therefore, it is essential to study whether combining these two imaging techniques can further improve the diagnostic efficacy of PCa. In our study, SUVmax was positively correlated with the Gleason score, while ADCmin was negatively correlated. Based on the above results, we combined the two parameters and used the ratio to construct a new parameter (SUVmax/ADCmin) to obtain a more significant correlation with the Gleason score. The results of this study are consistent with our expectations. SUVmax/ADCmin was positively correlated with the Gleason score, which was also consistent with previous 68Ga-PSMA PET/CT and mpMRI-related research results (23–25). In addition, Schmidkonz et al. confirmed that SUVmax in prostatic lesions could be used to predict primary PCa and lymph node and bone metastases. This may be the higher the uptake of PSMA in prostatic lesions, the higher the malignancy of the lesions, resulting in an increased risk of bone or lymph node metastasis (25). However, approximately 10% of patients with primary PCa have low PSMA expression (26). Some false-negative results were obtained in the clinical setting when SUVmax was used separately. The ratio SUVmax/ADCmin synthesizes the expression of PSMA and the degree of diffusion of water molecules (27). The present study found that the diagnostic efficacy of SUVmax/ADCmin was better than that of SUVmax or ADCmin alone. SUVmax/ADCmin may be used as a predictive parameter for PCa, helping to distinguish benign and malignant lesions of PCa and determine whether there were metastases. The result was also consistent with previous 18F-choline PET/MRI related research (21). Zhang et al. conducted a retrospective 68Ga-PSMA-11 PET/CT analysis of 42 patients with moderate-and high-risk PCa who underwent RP, and found that SUVmax in local prostate lesions was significantly higher in the group with pelvic lymph node metastases than in the group without lymph node metastases (28). In our study, the larger the prostatic lesion size, the higher the SUVmax/ADCmin. When SUVmax/ADCmin in the prostatic lesion was >7.0×10³, the lesion was more likely to be malignant. When SUVmax/ADCmin in the prostatic lesion is >27.0×10³, the patient with PCa may have lymph node and bone metastases. Hence, we postulated that SUVmax combined with ADCmin (SUVmax/ADCmin) might decrease bias and improve diagnostic accuracy.
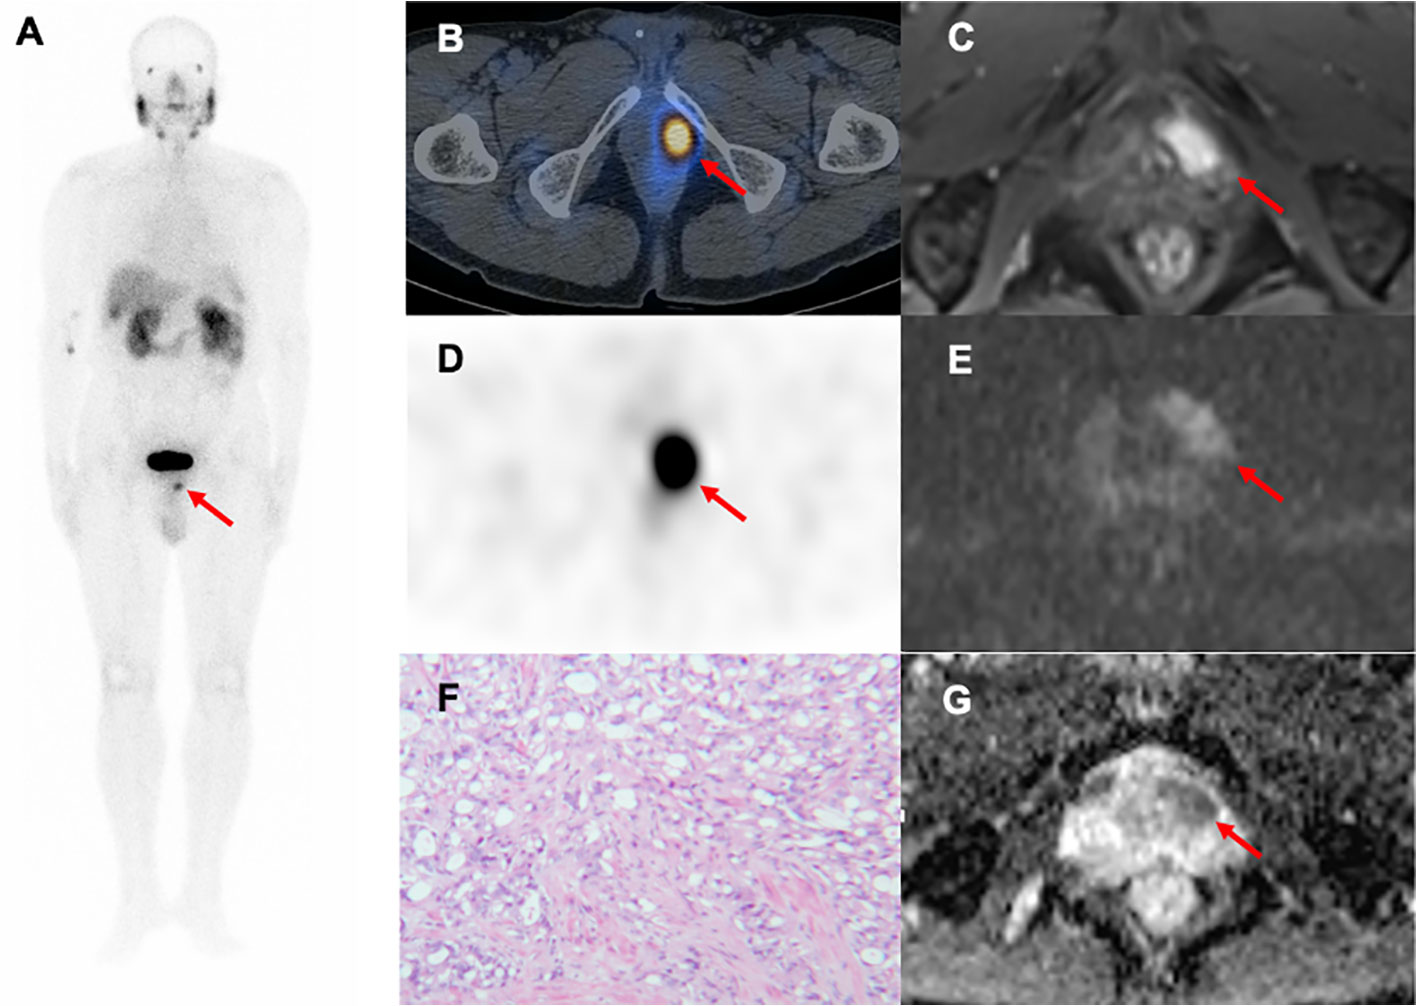
Figure 6 A 79-year-old man with progressive dysuria. The PSA level was 15.31 ng/mL at the time of 99mTc-PSMA SPECT/CT and mpMRI. Whole-body planar 99mTc-PSMA (A) and transverse SPECT/CT (B, D) showed foci of increased PSMA uptake in the left-anterior (red arrow, SUVmax=13.10, SUVmax/ADCmin=16.7×103). Hypointense signals were shown on apparent diffusion coefficient (ADC) (G), red arrow), and hyperintense signals on diffusion-weighted imaging (DWI) (E), red arrow) in the left transitional band of the prostatic apex. Dynamic contrast-enhanced (DCE) scanning was significantly enhanced (C), red arrow). (F) Prostatic lesion was confirmed pathologically as prostate cancer (hematoxylin and eosin (HE) staining, 100×magnification; Gleason score: 4 + 5 = 9). 99mTc-PSMA SPECT/CT, 99mTc-labelled prostate-specific membrane antigen molecular probe single photon emission computed tomography; mpMRI, multiparametric magnetic resonance imaging; SUVmax, maximum standardized uptake value; ADCmin, the minimum apparent diffusion coefficient.
The prognosis of PCa is closely related to the Gleason score grading system (29). The Gleason score is a critical indicator of the pathological results of prostate biopsy. In the previous study on PSMA, Kasperzyk et al. evaluated the expression of PSMA in PCa tissues by immunohistochemical staining, and found that Gleason score in the group with high PSMA expression was significantly higher than that in the group with low PSMA expression (30). Uprimny et al. retrospectively analyzed the 68Ga-PSMA-11 PET/CT examination data of 90 patients with PCa confirmed by prostate biopsy, and found that SUVmax was significantly positively correlated with Gleason score (31).In our study, patients with PCa were divided into high-,medium- and low-risk groups with a Gleason score of 7 as the cut-off value. Our results showed that SUVmax/ADCmin was the main predictor of the high-risk group, with an optimal cut-off value of 15.0×10³. This suggests that SUVmax/ADCmin ratio is a useful imaging parameter for evaluating tumor biology and prognosis, which may significantly impact the selection of therapeutic strategies.
This study had some limitations. Among the 44 patients diagnosed with PCa, 21 did not undergo RP, and gross specimens could not be obtained; only puncture biopsy could be used as the final pathological result. The pathological grading of puncture lesions may differ from actual grading. Furthermore, this was a single-center study with a small sample size, and the conclusions should be verified in a large-scale sample cohort. We did not evaluate the role of SUVmax/ADCmin in predicting prognosis at follow-up. However, this exploratory study is still valuable as the first clinical quantitative application of 99mTc-PSMA SPECT/CT combined with mpMRI in PCa lesions. In a future study, we aim to develop a novel analytical approach based on a radiomics quantitative model derived from 99mTc-PSMA SPECT/CT and mpMRI for noninvasive prediction of intraprostatic lesions in patients with PCa and prognosis.
Conclusion
In this prospective study, our results revealed that combined 99mTc-PSMA SPECT/CT and mpMRI had a higher diagnostic accuracy for detecting treatment-naive PCa than either modality alone. In addition, SUVmax/ADCmin is a promising molecular imaging parameter for diagnosing PCa and evaluating its biological behavior.
Data availability statement
The raw data supporting the conclusions of this article will be made available by the authors, without undue reservation.
Ethics statement
The studies involving humans were approved by the ethics committee of Fujian Provincial Hospital. The studies were conducted in accordance with the local legislation and institutional requirements. The participants provided their written informed consent to participate in this study. Written informed consent was obtained from the individual(s) for the publication of any potentially identifiable images or data included in this article.
Author contributions
Conceptualization: WC. Data curation: YZ. Formal analysis: YZ. Investigation: YZ. Methodology: YZ. Project administration: WC and ZL. Resources: WC, TL, YW, and LY. Software: YZ and YS. Supervision: WC and ZL. Validation: WC and ZL. Visualization: YZ and YS. Roles/Writing-original draft: YZ. Writing- review & editing: WC. All authors contributed to the article and approved the submitted version.
Funding
This work was supported by Startup Fund for scientific research, Fujian Medical University (2021QH1282) and Fujian Provincial Department of Finance (MCZ [2021] No. 0917).
Acknowledgments
The authors thank our Urology colleagues, who referred the patients to our SPECT centre, and technical support from Dr. Shaoli Song (from the department of nuclear medicine, Fudan University Shanghai Cancer Center, Shanghai, China).
Conflict of interest
The authors declare that the research was conducted in the absence of any commercial or financial relationships that could be construed as a potential conflict of interest.
Publisher’s note
All claims expressed in this article are solely those of the authors and do not necessarily represent those of their affiliated organizations, or those of the publisher, the editors and the reviewers. Any product that may be evaluated in this article, or claim that may be made by its manufacturer, is not guaranteed or endorsed by the publisher.
References
1. Miller KD, Nogueira L, Mariotto AB, Rowland JH, Yabroff KR, Alfano CM, et al. Cancer treatment and survivorship statistics, 2019. CA Cancer J Clin (2019) 69(5):363–85. doi: 10.3322/caac.21565
2. Schaeffer EM, Srinivas S, Adra N, An Y, Barocas D, Bitting R, et al. NCCN guidelines® Insights: Prostate cancer, version 1.2023. J Natl Compr Canc Netw (2022) 20(12):1288–98. doi: 10.6004/jnccn.2022.0063
3. Ahmed HU, El-Shater Bosaily A, Brown LC, Gabe R, Kaplan R, Parmar MK, et al. Diagnostic accuracy of multi-parametric MRI and TRUS biopsy in prostate cancer (PROMIS): a paired validating confirmatory study. Lancet (2017) 389(10071):815–22. doi: 10.1016/S0140-6736(16)32401-1
4. von Hardenberg J, Borkowetz A, Siegel F, Kornienko K, Westhoff N, Jordan TB, et al. GESRU academics prostate cancer group in cooperation with the working group of focal and microtherapy of the german society of urology (DGU). Potential candidates for focal therapy in prostate cancer in the era of magnetic resonance imaging-targeted biopsy: A large multicenter cohort study. Eur Urol Focus (2021) 7(5):1002–10. doi: 10.1016/j.euf.2020.09.015
5. Maier SE, Wallström J, Langkilde F, Johansson J, Kuczera S, Hugosson J, et al. Prostate cancer diffusion-weighted magnetic resonance imaging: Does the choice of diffusion-weighting level matter? J Magn Reson Imaging (2022) 55(3):842–53. doi: 10.1002/jmri.27895
6. Patel HD, Koehne EL, Shea SM, Fang AM, Gorbonos A, Quek ML, et al. Systematic versus Targeted Magnetic Resonance Imaging/Ultrasound Fusion Prostate Biopsy among Men with Visible Lesions. J Urol (2022) 207(1):108–17. doi: 10.1097/JU.0000000000002120
7. Johnson DC, Raman SS, Mirak SA, Kwan L, Bajgiran AM, Hsu W, et al. Detection of individual prostate cancer foci via multiparametric magnetic resonance imaging. Eur Urol (2019) 75(5):712–20. doi: 10.1016/j.eururo.2018.11.031
8. Krohn T, Verburg FA, Pufe T, Neuhuber W, Vogg A, Heinzel A, et al. [(68)Ga]PSMA-HBED uptake mimicking lymph node metastasis in coeliac ganglia: an important pitfall in clinical practice. Eur J Nucl Med Mol Imaging (2015) 42(2):210–4. doi: 10.1007/s00259-014-2915-3
9. Zhang Y, Lin Z, Li T, Wei Y, Yu M, Ye L, et al. Head-to-head comparison of 99mTc-PSMA and 99mTc-MDP SPECT/CT in diagnosing prostate cancer bone metastasis: a prospective, comparative imaging trial. Sci Rep (2022) 12(1):15993. doi: 10.1038/s41598-022-20280-x
10. Xu X, Zhang J, Hu S, He S, Bao X, Ma G, et al. 99mTc-labeling and evaluation of a HYNIC modified small-molecular inhibitor of prostate-specific membrane antigen. Nucl Med Biol (2017) 48:69–75. doi: 10.1016/j.nucmedbio.2017.01.010
11. Berger I, Annabattula C, Lewis J, Shetty DV, Kam J, Maclean F, et al. 68Ga-PSMA PET/CT vs. mpMRI for locoregional prostate cancer staging: correlation with final histopathology. Prostate Cancer Prostatic Dis (2018) 21(2):204–11. doi: 10.1038/s41391-018-0048-7
12. Schaeffer E, Srinivas S, Antonarakis ES, Armstrong AJ, Bekelman JE, Cheng H, et al. NCCN guidelines insights: Prostate cancer, version 1.2021. J Natl Compr Canc Netw (2021) 19(2):134–43. doi: 10.6004/jnccn.2021.0008
13. Weinreb JC, Barentsz JO, Choyke PL, Cornud F, Haider MA, Macura KJ, et al. PI-RADS prostate imaging - reporting and data system: 2015, version 2. Eur Urol (2016) 69(1):16–40. doi: 10.1016/j.eururo.2015.08.052
14. Dong F, Li L, Bian Y, Li G, Han X, Li M, et al. Standardized uptake value using thyroid quantitative SPECT/CT for the diagnosis and evaluation of graves' Disease: A prospective multicenter study. BioMed Res Int (2019) 2019:7589853. doi: 10.1155/2019/7589853
15. Schilham MGM, Zamecnik P, Privé BM, Israël B, Rijpkema M, Scheenen T, et al. Head-to-head comparison of 68Ga-prostate-specific membrane antigen PET/CT and ferumoxtran-10-enhanced MRI for the diagnosis of lymph node metastases in prostate cancer patients. J Nucl Med (2021) 62(9):1258–63. doi: 10.2967/jnumed.120.258541
16. Lecouvet FE, El Mouedden J, Collette L, Coche E, Danse E, Jamar F, et al. Can whole-body magnetic resonance imaging with diffusion-weighted imaging replace Tc-99m bone scanning and computed tomography for single-step detection of metastases in patients with high-risk prostate cancer? Eur Urol (2012) 62(1):68–75. doi: 10.1016/j.eururo.2012.02.020
17. Freitag MT, Radtke JP, Hadaschik BA, Kopp-Schneider A, Eder M, Kopka K, et al. Comparison of hybrid (68)Ga-PSMA PET/MRI and (68)Ga-PSMA PET/CT in the evaluation of lymph node and bone metastases of prostate cancer. Eur J Nucl Med Mol Imaging (2016) 43(1):70–83. doi: 10.1007/s00259-015-3206-3
18. Stattin K, Sandin F, Bratt O, Lambe M.. The Risk of Distant Metastases and Cancer Specific Survival in Men with Serum Prostate Specific Antigen Values above 100 ng/ml. J Urol (2015) 194(6):1594–600. doi: 10.1016/j.juro.2015.07.082
19. Swanson GP, Trevathan S, Hammonds KAP, Speights VO, Hermans MR. Gleason score evolution and the effect on prostate cancer outcomes. Am J Clin Pathol (2021) 155(5):711–7. doi: 10.1093/ajcp/aqaa130
20. Liu C, Zhu Y, Su H, Xu X, Zhang Y, Ye D, et al. Relationship between PSA kinetics and Tc-99m HYNIC PSMA SPECT/CT detection rates of biochemical recurrence in patients with prostate cancer after radical prostatectomy. Prostate (2018) 78(16):1215–21. doi: 10.1002/pros.23696
21. Wetter A, Lipponer C, Nensa F, Heusch P, Rübben H, Schlosser TW, et al. Quantitative evaluation of bone metastases from prostate cancer with simultaneous [18F] choline PET/MRI: combined SUV and ADC analysis. Ann Nucl Med (2014) 28(5):405–10. doi: 10.1007/s12149-014-0825-x
22. Rakheja R, Chandarana H, DeMello L, Jackson K, Geppert C, Faul D, et al. Correlation between standardized uptake value and apparent diffusion coefficient of neoplastic lesions evaluated with whole-body simultaneous hybrid PET/MRI. AJR Am J Roentgenol (2013) 201(5):1115–9. doi: 10.2214/AJR.13.11304
23. Ergül N, Yilmaz Güneş B, Yücetaş U, Toktaş MG, Çermik TF. 68Ga-PSMA-11 PET/CT in newly diagnosed prostate adenocarcinoma. Clin Nucl Med (2018) 43(12):e422–7. doi: 10.1097/RLU.0000000000002289
24. Jena A, Taneja R, Taneja S, Singh A, Kumar V, Agarwal A, et al. Improving diagnosis of primary prostate cancer with combined 68Ga-prostate-specific membrane antigen-HBED-CC simultaneous PET and multiparametric MRI and clinical parameters. AJR Am J Roentgenol (2018) 211(6):1246–53. doi: 10.2214/AJR.18.19585
25. Schmidkonz C, Cordes M, Beck M, Goetz TI, Schmidt D, Prante O, et al. SPECT/CT with the PSMA ligand 99mTc-MIP-1404 for whole-body primary staging of patients with prostate cancer. Clin Nucl Med (2018) 43(4):225–31. doi: 10.1097/RLU.0000000000001991
26. Eiber M, Weirich G, Holzapfel K, Souvatzoglou M, Haller B, Rauscher I, et al. Simultaneous 68Ga-PSMA HBED-CC PET/MRI improves the localization of primary prostate cancer. Eur Urol (2016) 70(5):829–36. doi: 10.1016/j.eururo.2015.12.053
27. Uslu-Beşli L, Bakır B, Asa S, Güner E, Demirdağ Ç, Şahin OE, et al. Correlation of SUVmax and apparent diffusion coefficient values detected by Ga-68 PSMA PET/MRI in primary prostate lesions and their significance in lymph node metastasis:preliminary results of an on-going study. Mol Imaging Radionucl Ther (2019) 28:104–11. doi: 10.4274/mirt.galenos.2019.63825
28. Zhang Q, Zang S, Zhang C, Fu Y, Lv X, Zhang Q, et al. Comparison of 68Ga-PSMA-11 PET-CT with mpMRI for preoperative lymph node staging in patients with intermediate to high-risk prostate cancer. J Transl Med (2017) 15(1):230. doi: 10.1186/s12967-017-1333-2
29. Fizazi K, Tran N, Fein L, Matsubara N, Rodriguez-Antolin A, Alekseev BY, et al. Abiraterone acetate plus prednisone in patients with newly diagnosed high-risk metastatic castration-sensitive prostate cancer (LATITUDE): final overall survival analysis of a randomised, double-blind, phase 3 trial. Lancet Oncol (2019) 20(5):686–700. doi: 10.1016/S1470-2045(19)30082-8
30. Kasperzyk JL, Finn SP, Flavin R, Fiorentino M, Lis R, Hendrickson WK, et al. Prostate-specific membrane antigen protein expression in tumor tissue and risk of lethal prostate cancer. Cancer Epidemiol Biomarkers Prev (2013) 22(12):2354–63. doi: 10.1158/1055-9965.EPI-13-0668
31. Uprimny C, Kroiss AS, Decristoforo C, Fritz J, von Guggenberg E, Kendler D, et al. 68Ga-PSMA-11 PET/CT in primary staging of prostate cancer: PSA and Gleason score predict the intensity of tracer accumulation in the primary tumour. Eur J Nucl Med Mol Imaging (2017) 44(6):941–9. doi: 10.1007/s00259-017-3631-6
Keywords: prostate-specific membrane antigen, magnetic resonance imaging, prostate cancer, single-photon emission computed tomography, technetium radioisotopes
Citation: Zhang Y, Shi Y, Ye L, Li T, Wei Y, Lin Z and Chen W (2023) Improving diagnostic efficacy of primary prostate cancer with combined 99mTc-PSMA SPECT/CT and multiparametric-MRI and quantitative parameters. Front. Oncol. 13:1193370. doi: 10.3389/fonc.2023.1193370
Received: 03 April 2023; Accepted: 31 July 2023;
Published: 11 September 2023.
Edited by:
Fabio Grizzi, Humanitas Research Hospital, ItalyReviewed by:
Manuela Andrea Hoffmann, Federal Ministry of Defence, GermanyShady Saikali, AdventHealth, United States
Copyright © 2023 Zhang, Shi, Ye, Li, Wei, Lin and Chen. This is an open-access article distributed under the terms of the Creative Commons Attribution License (CC BY). The use, distribution or reproduction in other forums is permitted, provided the original author(s) and the copyright owner(s) are credited and that the original publication in this journal is cited, in accordance with accepted academic practice. No use, distribution or reproduction is permitted which does not comply with these terms.
*Correspondence: Zhiyi Lin, OTEyOTIxOUBxcS5jb20=; Wenxin Chen, d2VueGluY2h6dEBhbGl5dW4uY29t
†These authors have contributed equally to this work