
94% of researchers rate our articles as excellent or good
Learn more about the work of our research integrity team to safeguard the quality of each article we publish.
Find out more
ORIGINAL RESEARCH article
Front. Oncol., 15 September 2023
Sec. Radiation Oncology
Volume 13 - 2023 | https://doi.org/10.3389/fonc.2023.1192908
 Huoqiang Wang1*†
 Yi Li1†
 Jiexi Han2
 Qin Lin3
 Long Zhao1
 Qiang Li1
 Juan Zhao1
 Haohao Li4
 Yiran Wang2
 Changlong Hu5*
Objective: The aim of this study was to develop a machine learning-based automatic analysis method for the diagnosis of early-stage lung cancer based on positron emission tomography/computed tomography (PET/CT) data.
Methods: A retrospective cohort study was conducted using PET/CT data from 187 cases of non-small cell lung cancer (NSCLC) and 190 benign pulmonary nodules. Twelve PET and CT features were used to train a diagnosis model. The performance of the machine learning-based PET/CT model was tested and validated in two separate cohorts comprising 462 and 229 cases, respectively.
Results: The standardized uptake value (SUV) was identified as an important biochemical factor for the early stage of lung cancer in this model. The PET/CT diagnosis model had a sensitivity and area under the curve (AUC) of 86.5% and 0.89, respectively. The testing group comprising 462 cases showed a sensitivity and AUC of 85.7% and 0.87, respectively, while the validation group comprising 229 cases showed a sensitivity and AUC of 88.4% and 0.91, respectively. Additionally, the proposed model improved the clinical discrimination ability for solid pulmonary nodules (SPNs) in the early stage significantly.
Conclusion: The feature data collected from PET/CT scans can be analyzed automatically using machine learning techniques. The results of this study demonstrated that the proposed model can significantly improve the accuracy and positive predictive value (PPV) of SPNs at the early stage. Furthermore, this algorithm can be optimized into a robotic and less biased PET/CT automatic diagnosis system.
Lung cancer is one of the most prevalent and deadliest types of cancer worldwide. Early detection and diagnosis of lung cancer are crucial for improving patient outcomes. At present, imaging techniques such as positron emission tomography (PET) and computed tomography (CT) are primarily utilized for diagnosing early-stage lung cancer. While CT imaging is commonly used for lung cancer screening and monitoring through morphological nodule characteristics, it presents challenges in differentiating pulmonary nodules (PNs) (1). Artificial intelligence has been gradually applied to improve CT-based cancer diagnoses, with a convolutional neural network (CNN) prediction model achieving an area under the curve (AUC) of 0.71 in distinguishing malignant from benign PNs (2). Ground glass opacity (GGO) status is considered a significant prognostic and staging-classification factor that can enhance prognostic accuracy in patients with a lung cancer tumor less than 3 cm for early-stage non-small cell lung cancer (NSCLC) (3, 4). These studies present a practical and alternative approach to automatically diagnosing lung cancer based on CT-derived features rather than complicated image analysis.
For a more detailed diagnosis of suspicious PNs based on localization and biomarkers, PET/CT is preferred (5), with a 96% accuracy in identifying adrenal metastases from benign adrenal masses in oncologic patients (6). PET scanning with 18Fluorine-Fluorodeoxyglucose (FDG) is commonly used to generate metabolic image information (7). PET/CT features enable a more accurate localization of an area of FDG uptake to the underlying anatomical structure. Glucose derivative metabolism generates biochemical parameters, including total lesion glycolysis (TLG), metabolic tumor volume (MTV), and standardized uptake values (SUVs), such as SUVmax and SUVmean, which have shown predictive ability for NSCLC tumor differentiation (8). TLG has been suggested as an indicator of survival for advanced stage NSCLC (9), while MTV and TLG have been identified as valuable predictors for patients with metastatic pheochromocytomas and paragangliomas (10), and better prognostic measures than SUVmax and SUVmean for NSCLC (11). Higher values of SUVmax, MTV and TLG have been reported to be associated with a higher risk of recurrence or death for surgical NSCLC patients (12). Recently, a machine learn-based image reconstruction method was reported for the detection of FDG-positive pulmonary nodules with a sensitivity and specificity of 69.2% and 84.5%, respectively (13).
The accurate interpretation of PNs using PET/CT imaging modality is predominantly reliant on the individual expertise and knowledge of the interpreter, resulting in significant variation in the obtained results. Consequently, the need arises to establish an unbiased evaluation system for PN analysis. However, due to the potential limitations of morphology and the variability of separated biochemical signals, there is a need to develop an optimized model for the automatic diagnosis of early-stage lung cancer. To address this, the present study employed a PET/CT generated dataset to construct a diagnostic model and evaluate its efficacy in various categories and applications.
This study was approved by the Institutional Ethics Committee of Shanghai Pulmonary Hospital affiliated to Shanghai Tongji University (K21-317), and the requirements for written informed consent were waived for the retrospective study. Data was collected from July 2019 to May 2021, and inclusion criteria included the availability of histopathology results with defined benign or malignant pulmonary nodules, primarily in T1/T2 stage. PET/CT data was collected from 1068 patients for modeling and further analysis. Prior to the PET/CT examination, patients were instructed to fast for at least 6 hours and serum glucose levels were monitored to ensure levels were less than 110 mg/dl before administration of 18F-FDG. PET images were obtained using a hybrid PET/CT scanner (Biograph mCT 64, Siemens, Germany) approximately 1 hour after intravenous injection of 3.7MBq/kg of 18F-FDG. CT scan parameters included a tube voltage of 120kV, automatic tube current modulation, pitch of 0.8, collimation of 16 * 1.2 mm, rotation time of 0.5 seconds, and reconstruction thickness of 5.0 mm. PET scans were performed using a three-dimensional model from the skull base to the middle of the thigh, with a scan time of 1.2 minutes. PET images were reconstructed using the TrueX+TOF (ultraHD-PET) method, with a reconstructed layer thickness of 5.0 mm and interval of 3.0 mm, and were corrected for CT attenuation. All collected data were processed using Syngo via Siemens Medical Systems for post-processing to reconstruct PET, CT, and PET/CT fusion images.
The modules of machine-learning method in this study were illustrated in Figure 1. Prior to model training, preprocessing was implemented on raw data to ensure structural expression and exclude outliers, as previously reported (14). Afterwards, a cohort of feature data was carried out for model training. Python 3.9 software (Python Software Foundation) was used to construct and test the model. Sixteen factors comprising clinical information and PET/CT factors were selected as candidate key factors, including age, gender, smoking history, maximum diameter, lobulation, spike, calcification, hole, GGO status, upper lobe location of the PNs, SUVmax, SUVmean, MTV (20%), MTV (40%), TLG (20%), and TLG (40%). Orthogonal partial least squares discrimination analysis (OPLS-DA) was used to discriminate between malignant and benign groups, and variable importance for the projection (VIP) scores were utilized to select key factors (15).
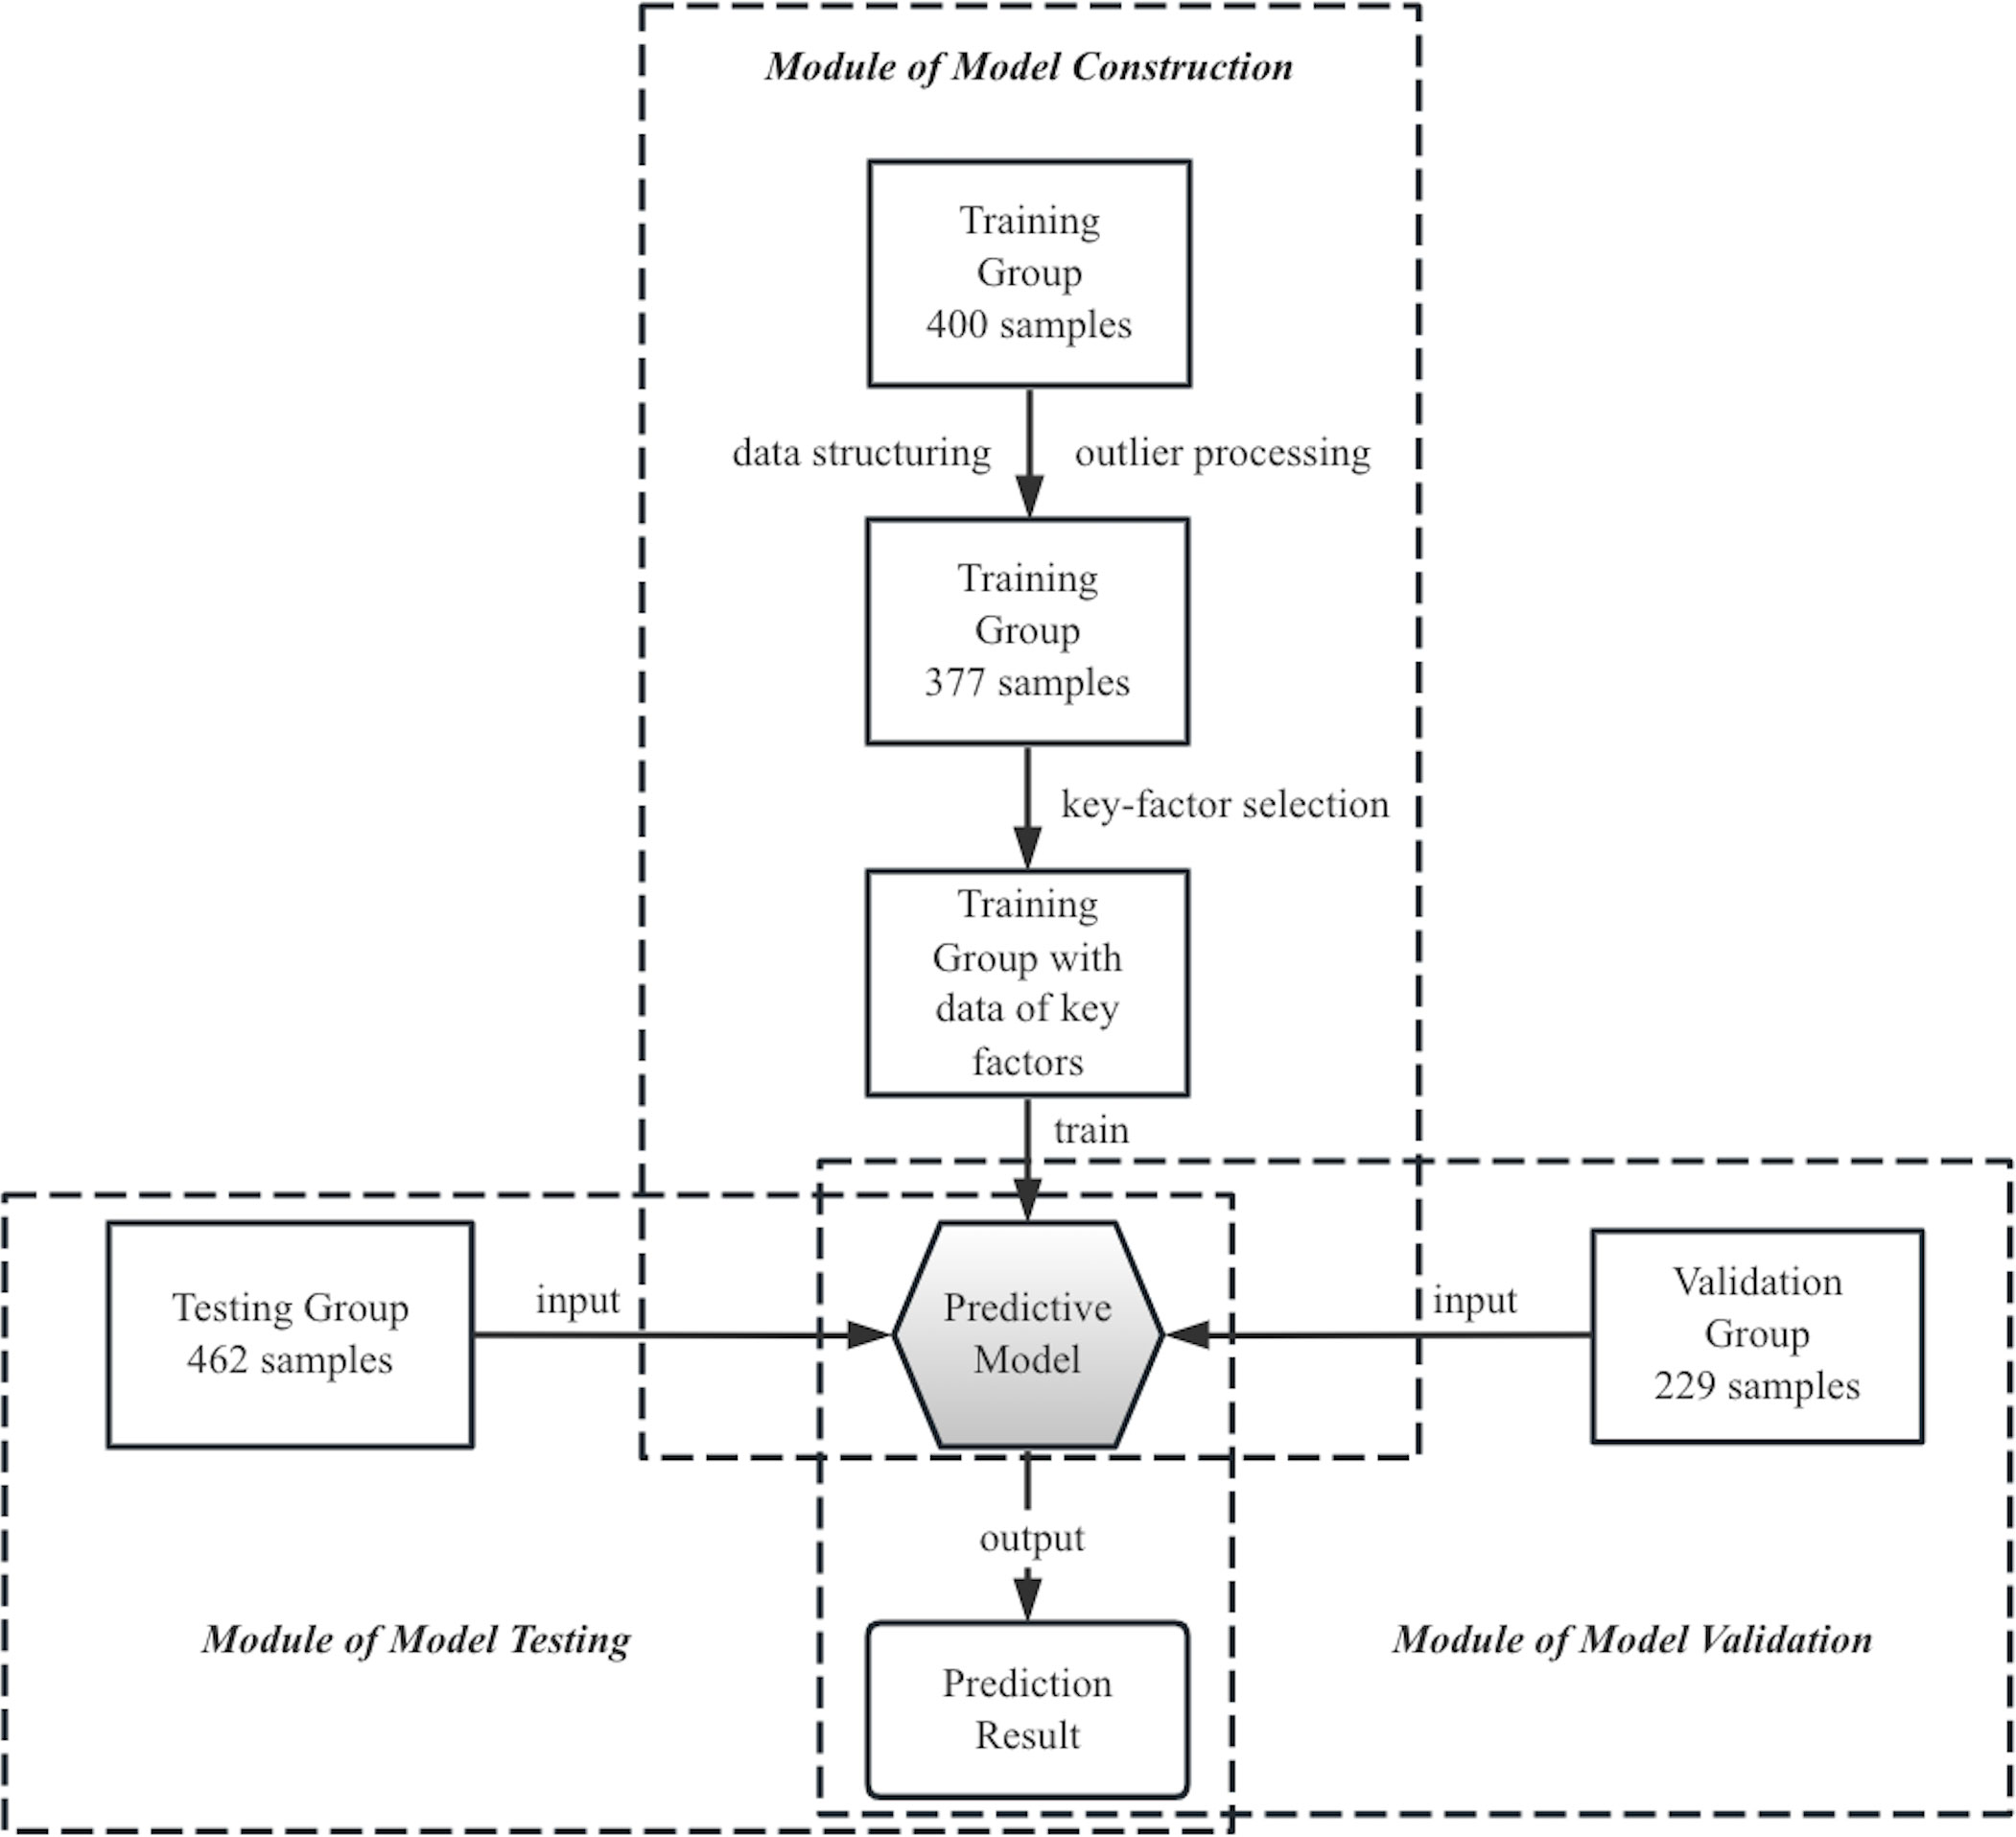
Figure 1 Modular description of the machine-learning-based method in this study. PET/CT images from a retrospective cohort of 200 NSCLC and 200 benign nodule patients were used as raw training data to build a predictive model, using twelve key factors. The diagnosis performance of this model was tested and validated in two separate cohorts comprising 462 and 229 patients, respectively.
The logistic regression algorithm was applied in the study, which is suitable for modeling the probability of a certain class or event existing (16) and predicting disease risk based on several clinical characteristics (17, 18). The algorithm was trained on a dataset containing 190 benign and 187 NSCLC samples retrospectively. Mathematically, the logistic regression algorithm is represented by a standard logistic function, which is a sigmoid function that takes any real input t and outputs a value between zero and one (16). It takes log-odds as input and gives probability as output in terms of logit. The standard logistic function is expressed as
where exp represents the powers of nature logarithm. It is assumed that t is a linear function with a set of variables
then t can be defined as
where represent the linear coefficients. The general logistic function can be written as
In the logistic model, p(x) is indicated as the probability of positive case. By implementing the gradient descent algorithm on the training data, an optimal solution was obtained, which led to the development of the predictive model represented by Eq. 4. The result of risky score was a probability between zero and one, thus diagnosis decision could be given.
Twelve key factors were finally enrolled, including gender, age, smoking history, nodule diameter, GGO status, spike, lobulation, calcification (19, 20), SUVmax, SUVmean, TLG (20%), MTV (40%). For setting principles of parameters and structuring the input data, factor of age represented sample’s age in years and that of nodule diameter was the pulmonary nodules maximal diameters in millimeters. Parameters for smoking history, spike, lobulation, and calcification were assigned a value of 1 if present and 0 if absent. Gender was assigned a value of 0.6 for female samples and 0 for male samples. GGO status was assigned a value of 1 for nodule size ≥3 cm, 0 for solid nodules, and -1 for other types (e.g., ground glass, ground glass opacity, and mixed ground glass opacity). The raw data of biochemical indications including SUVmax, SUVmean, TLG (20%), MTV (40%) were substituted in calculation. Coefficients of twelve key features for Eq. 4 is listed.
The machine-learning-based model was tested using a dataset collected between July 2020 to December 2020, which consisted of 378 lung cancer and 84 benign samples. Equations 4-5 were used to generate diagnosis results. A validation group, comprising 147 malignant and 82 benign samples, collected between December 2020 to May 2021, was used to further evaluate the model’s performance. Fourfold tables, receiver operating characteristic curves (21) and AUC were used to evaluate the model’s performance.
Python 3.9 and MetaboAnalyst 5.0 were used for statistical analysis and plot drawing. MetaboAnalyst 5.0, developed by members of the Wishart Research Group at the University of Alberta, is a free online tool for metabolomic data analysis. P<0.05 was considered statistically significant.
The study enrolled a total of 1068 patients, with the stage classification of malignant samples depicted in Figure 2. The majority of patients were diagnosed with early-stage lung cancer, with 78% classified as T1N0M0 and 17.1% classified as T2N0M0. The patients were grouped chronologically into three sets: a retrospective training group consisting of 377 patients (35.3% of all), a testing group with 462 patients (43.3% of all), and a validation group with 229 patients (21.4% of all).
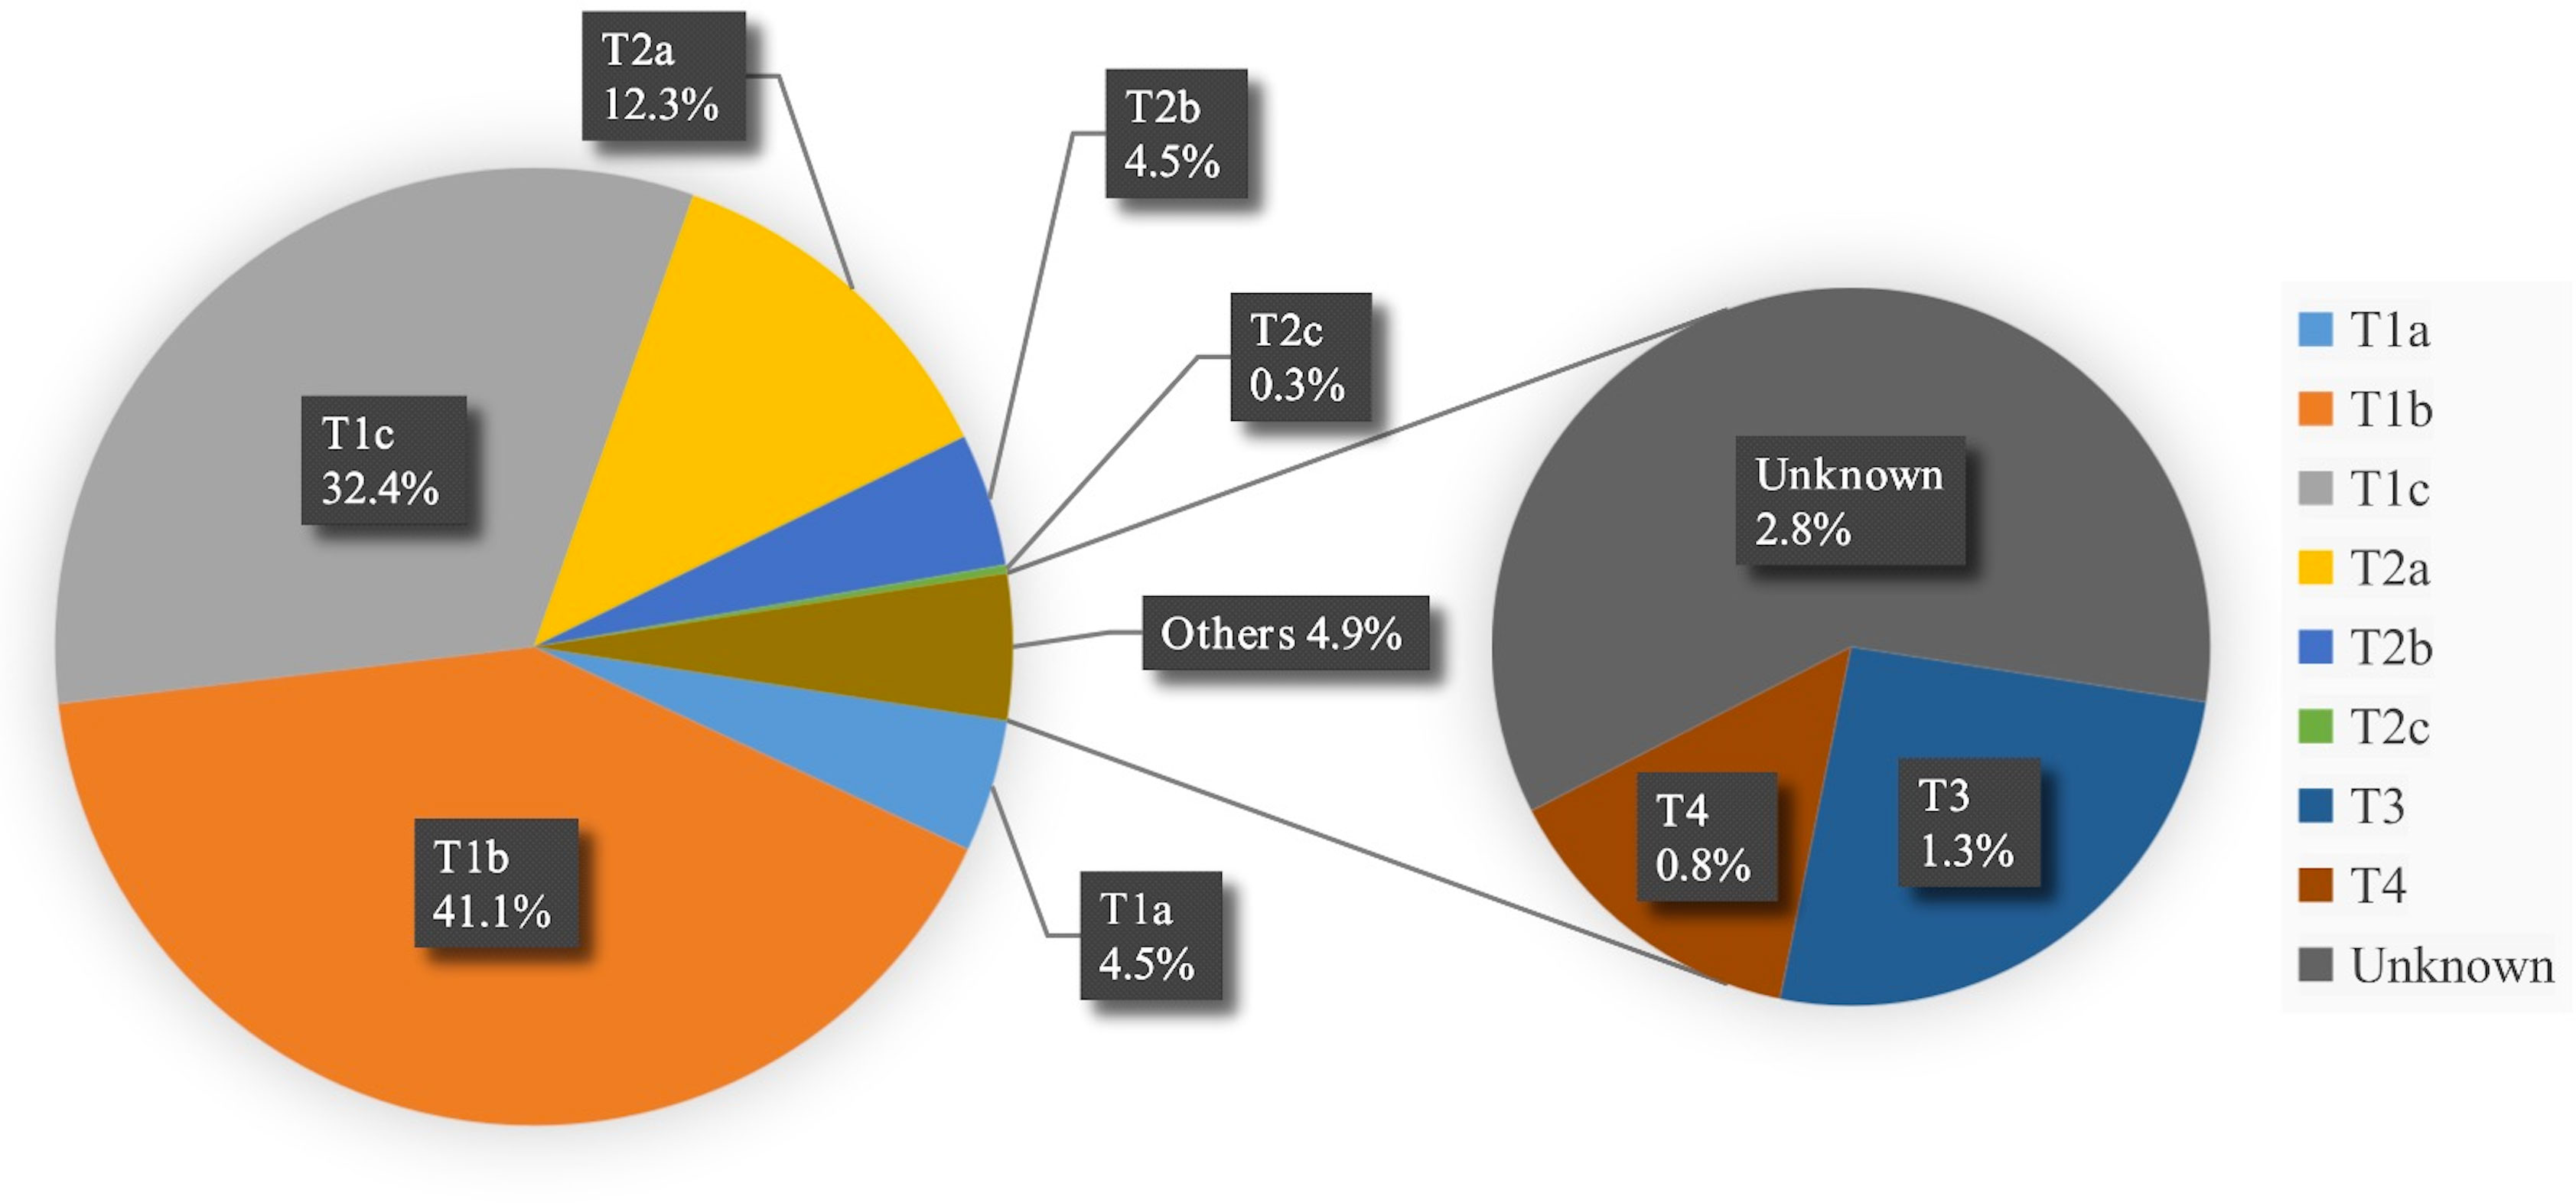
Figure 2 Stage statistical chart of malignant samples. * TNM system was utilized for the pathological staging of cancer in the dataset, wherein a letter or number is assigned to describe the tumor (T), node (N), and metastasis (M) categories to determine the stage.
The statistical characteristics of the samples are presented in Table 1, which indicates no significant differences in basic clinical information between malignant and benign groups. Morphological characteristics, the average maximal diameter of PNs was also in similar ranges. However, the samples clinically diagnosed as lung cancer exhibited distinct CT features, such as GGO status, spike, calcification, lobulation, and upper lobe. In terms of biochemical characteristics, malignant PNs had higher mean values of SUVmax, SUVmean, TLG (20%), and TLG (40%) but lower mean values of MTV (20%) and MTV (40%) than the benign ones.
To build a model that comprehensively reflected the influence of PET/CT parameters on lung cancer diagnosis, the parameters were evaluated synthetically. The OPLS-DA analysis showed a potential classification between the benign and non-small cell lung cancer (NSCLC) groups in the projection plot shown in Figure 3A. Based on the VIP score ranking in Figure 3B, lobulation, spike, GGO status, calcification, and the maximum diameter of PNs were considered important CT factors, while the PET indicators SUVmean, TLG (20%), and MTV (40%) were also included. The final predictive model, described by Eq. 4, comprised 12 key factors. The coefficients of the model indicated that spike, lobulation, SUVmean, and GGO status were the main contributors to lung cancer diagnosis, while calcification and SUVmax were more associated with benign PNs. The model achieved a sensitivity of 90.4% and specificity of 74.7% in the training cohort.
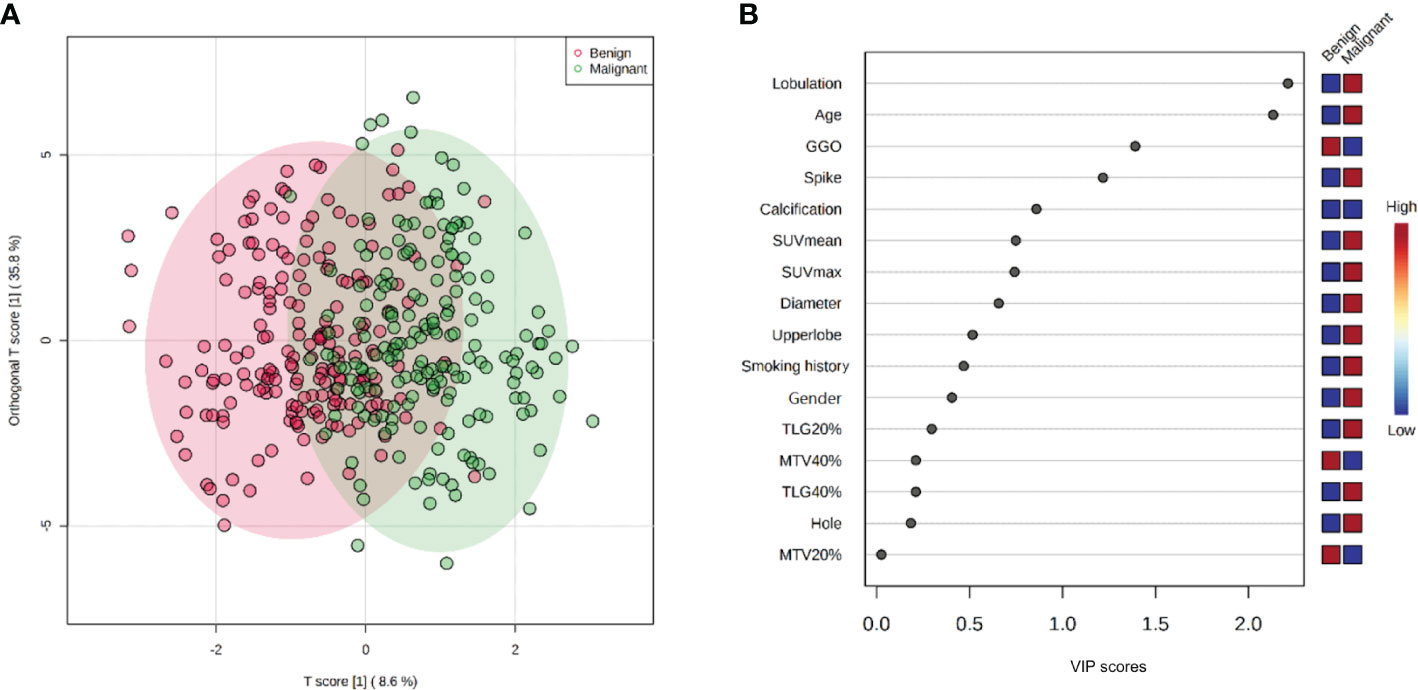
Figure 3 OPLS-DA and VIP score plots: (A) 2-D OPLS-DA score plot discriminated benign and malignant classes with inputted multivariate data. (B) VIP score plot showing the contribution of variables of the model. It was calculated as a weighted sum of the squared correlations between the OPLS-DA components and the original variable, which is an importance measure for variables in the OPLS-DA model. In VIP score plot, the discriminating factors are ranked in descending order of VIP score, the color boxes indicate whether factor was rising or falling (blue) in benign and malignant cases. These two plots jointly represent the effect and comparison of factors contribution for benign and malignant distinguishing.
Based on the model, the factor of SUV had higher VIP scores than smoking history and nodule diameter factors, and had much lower deviations than other biochemical factors (Figure 3B; Table 1), indicating its significant influence and good independence, and having expected advantages for early-stage lung cancer diagnosis. However, the commonly set threshold of SUVmax at around 2.5 to distinguish lung cancer from benign [if a patient had SUVmax higher than 2.5, it was prone to get a malignant diagnosis in clinical experience (22, 23)] was found to be insufficient, as the boxplot of benign samples showed a high probability of SUVmax values occurring within the range of 0 to 5 (with mean and median value of 3.4 and 2.6 shown in Table 1 and Figure 4). This suggests a high risk of misdiagnosis, particularly for benign cases, if a one-size-fits-all approach is taken. Therefore, a multivariate modeling approach that takes advantage of all the biochemical factors is more appropriate for accurate diagnosis. In comparison, the PET/CT model had an AUC of 0.89, while the CT model that was trained without any biochemical factor had an AUC of 0.83, as demonstrated in Figure 5. These findings highlight the potential of SUV as an important biochemical factor for early-stage lung cancer diagnosis, and emphasize the importance of a multivariate modeling approach in improving the accuracy of diagnosis.
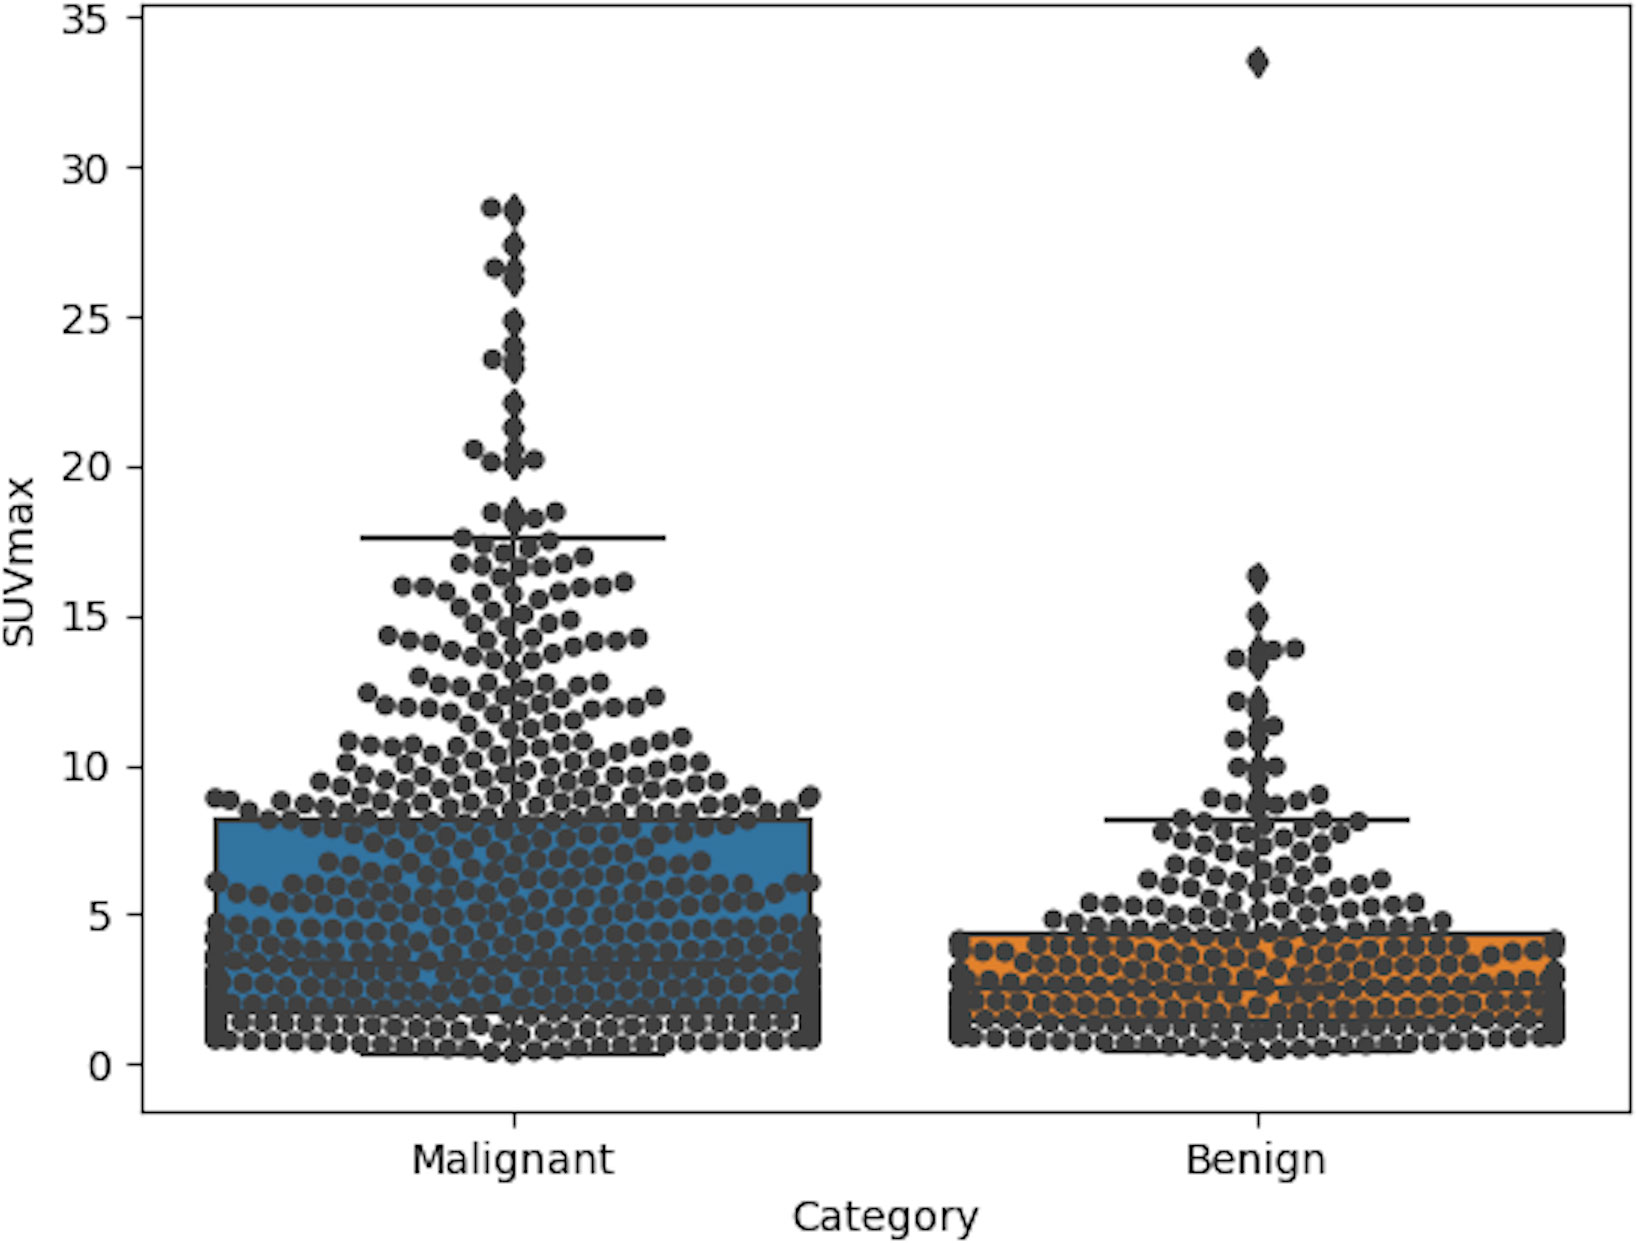
Figure 4 Boxplots of SUVmax in categories of malignant and benign for 1068 enrolled samples. In group of malignant, the mean and median value were 5.4 and 3.3, while those of benign group were about 3.4 and 2.6.
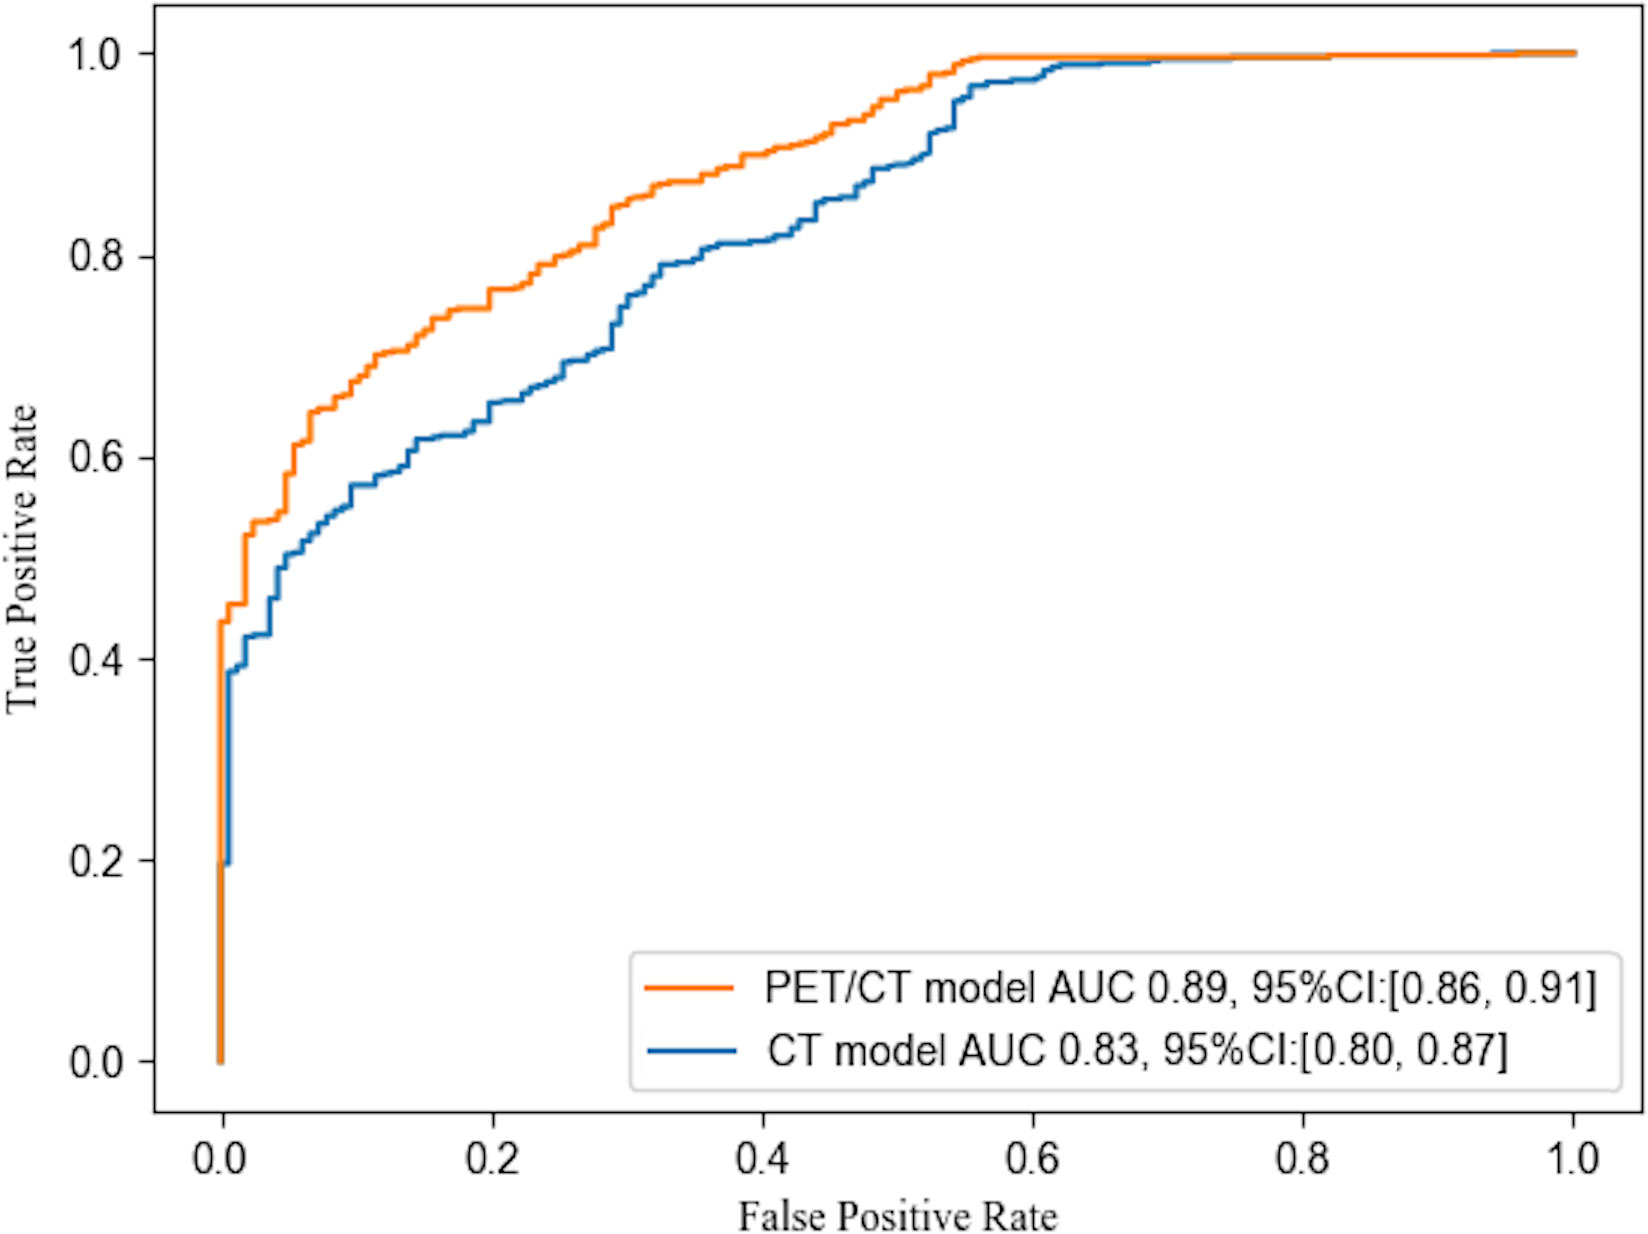
Figure 5 ROC curves of PET/CT model of this study and CT model without biochemical factors. The statistic included samples of testing and validation groups (with 525 lung cancer and 166 benign samples). The AUC values were 0.83 and 0.89 for the CT model and PET/CT model respectively.
The present study evaluated the diagnostic performance of an automatic diagnostic model for early-stage lung cancer using a testing and validation group approach. The model’s accuracy in both groups was 82.0% and 82.1%, respectively, at the cutoff value of 0.5 (Table 2). Despite different ratios of malignant and benign nodule samples, the results of the model were similar to previous studies and comparable (24). The testing group provided a less biased evaluation of the model in clinical diagnosis, and together with the validation group, ensured the reliability of the results, which are important for future large-scale clinical studies.
Upon statistical observation of the classifications, the testing and validation groups exhibited a pathological diagnosis of malignancy in the majority of GGO status samples. Specifically, out of 147 samples in the GGO status (GGO = -1 in the dataset), around 94.6% or 139 samples were diagnosed as malignant. Conversely, solid pulmonary nodules (SPN) samples (GGO = 0 or 1 in the dataset) had a relatively uncertain diagnostic result, with 70.8% or 386 malignancies in 545 SPN cases (Table 3). This trend reflects the clinical cases where patients with GGO status have a higher risk and a greater chance of being diagnosed as positive. In contrast, the SPN status introduces more ambiguity in the diagnosis (25, 26). It is notable that the conventional visual assessment of SPN on CT has a diagnostic accuracy of around 60% in distinguishing benign SPNs from malignant cases (27). Based on the data distribution and clinical difficulty, the classification of SPN warrants attention.
The study involved a testing and validation group comprising 545 cases of SPN. The diagnostic model demonstrated a positive predictive value (PPV) of 87.2% and an accuracy of 79.1%, which was notably superior to the PPV of 70.8% obtained from surgical outcome (Table 3). The decline in PPV between the overall and SPN cohorts was evaluated, revealing that the surgical results exhibited a greater decline of 6.8% (from 76.0% to 70.8%) compared to the model, which only declined by 2.6% (from 89.5% to 87.2%), as shown in Tables 2, 3.
Through mathematical computations, it has been observed that the varying maximum diameters of SPNs exhibit slight differences in their AUC values, with AUCs of 0.82, 0.87, and 0.89 for SPNs with maximum diameters of less than 15 mm, 16 to 30 mm, and greater than 30 mm, respectively. As the SPN diameter increases, the PPV and AUC values also increase, ranging from 78.1% to 89.7%, as presented in Table 3. It remains a great challenge to accurate discrimination of malignant and benign SPNs, especially in small-sized cases. In this investigation, for nodule size ≤ 15 mm, the proposed model was able to accurately diagnose 57 malignant and 53 benign nodule cases, resulting in a PPV of 78.1%. In contrast, clinical surgical findings revealed 56.9% PPV, defined 91 malignant and 69 benign cases (as shown in Table 3). The encouraging result of improving diagnosis PPV by 37.3% demonstrated a potential clinical applicability of this diagnosis model.
In this study, we utilized a machine-learning approach based on the logistic regression algorithm to develop a model for improving the diagnosis of early-stage lung cancer using PET and CT data. The featured data obtained can be automatically analyzed with minimal bias and without relying on expert knowledge. Our model performed very well in discriminating early lung nodules, especially in cases of SPN, which are considered the most challenging.
We compared the overall performance of our logistic model with previous PET/CT diagnostic studies, which included 100-300 patients, and employed various methods and key factors (11, 28–32). In contrast, our study employed a much larger dataset for testing and validation consisting of 691 samples. Our results indicated that the automatic model’s diagnostic performance was comparable to those of previous studies. We present a summary of these results in Table 4. Several models have been proposed for the diagnosis of NSCLC based on morphological information obtained from CT and/or metabolic information from PET. Among these models, the Mayo model is a well-established method for diagnosing malignant PNs based on clinical and imaging features (1, 33). In this study, we have compared the performance of our proposed model with the Mayo model (33) and the PeKing University People’s Hospital (PKUPH) model (34). Our findings, as illustrated in Figure 6, demonstrate that the AUC for our proposed model was significantly higher than the AUCs for both the Mayo model (0.62) and the PKUPH model (0.68), with an AUC of 0.89. These results suggest that our model with the inclusion of biochemical factors has improved the overall performance and accuracy compared to previous models. Moreover, our model with a large sample size of early-stage lung cancer nodules has the potential to enhance the prediction of early-stage lung cancer nodules.
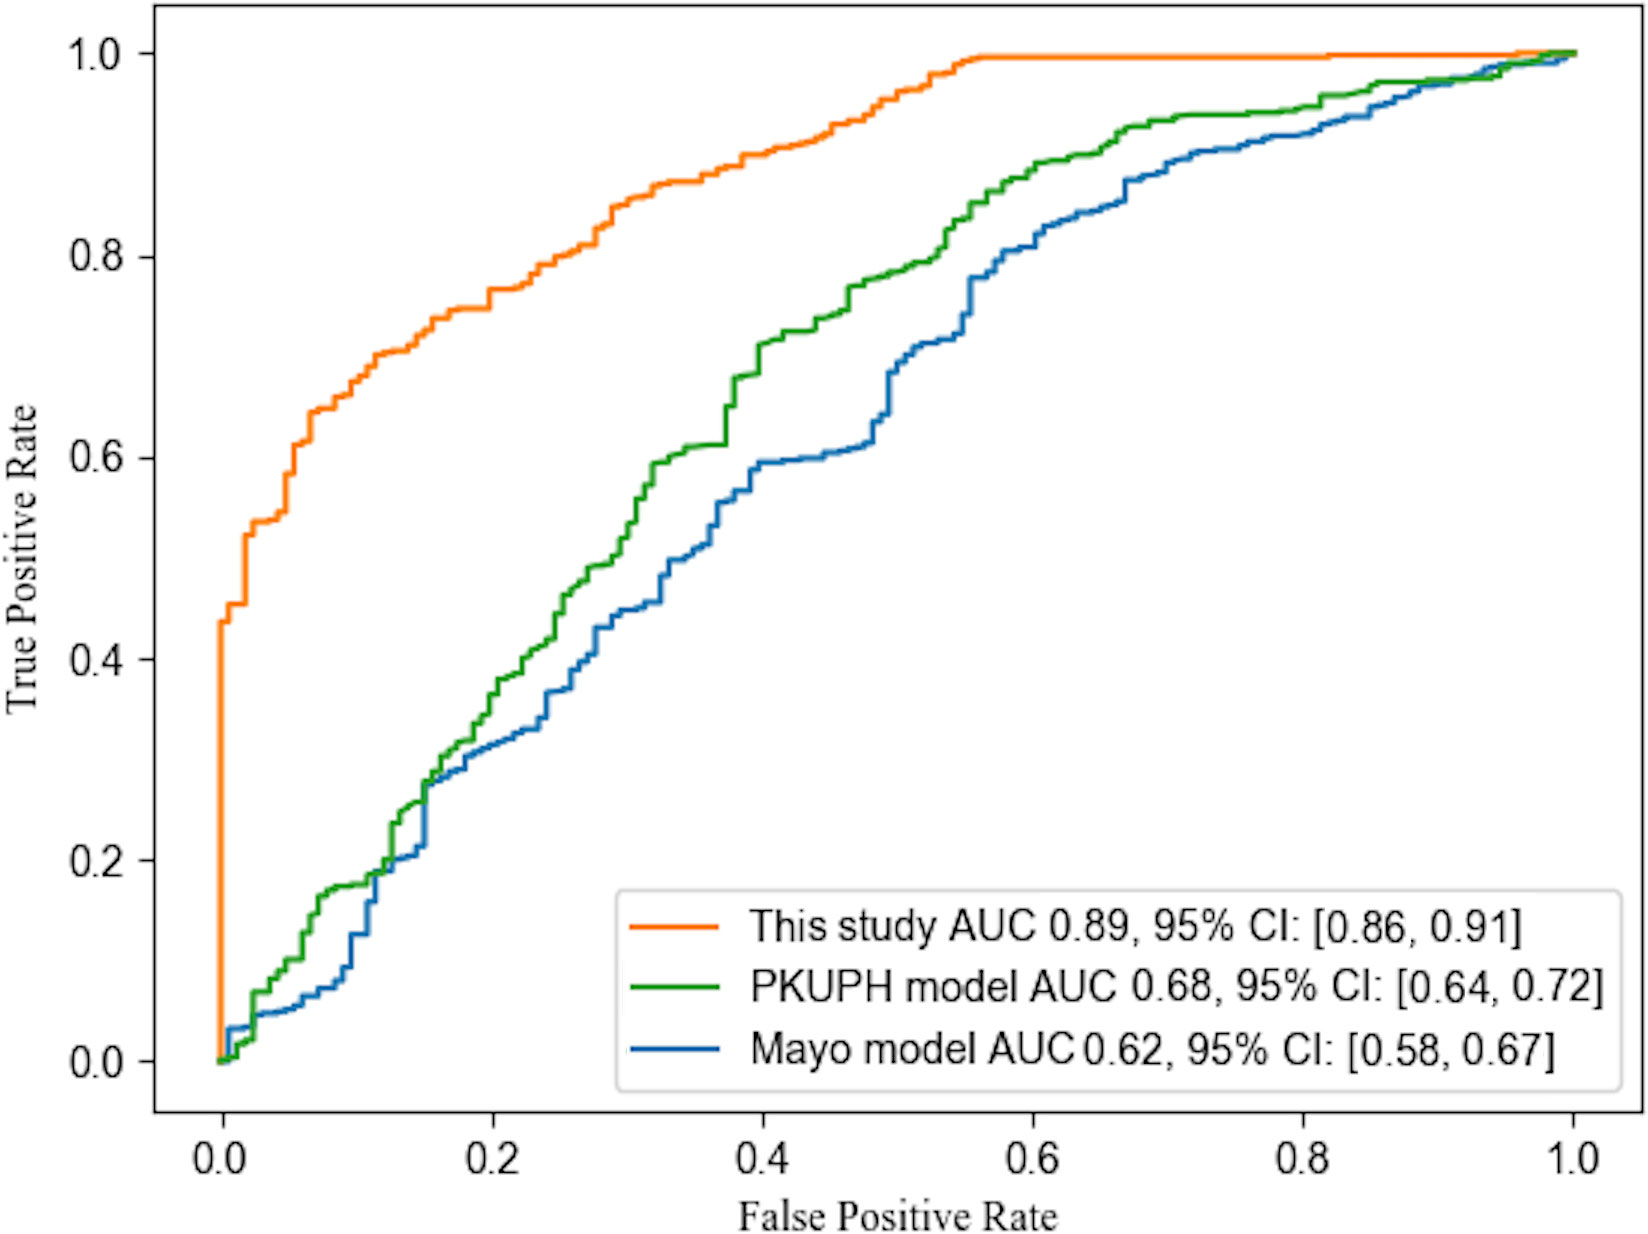
Figure 6 ROC curves of different models. The curves of Mayo and PKUPH model were plotted by calculating the same collection date in this study according to the published model.
In the testing and validation groups, which contained a total of 691 cases, experienced nuclear medicine physicians suggested 386 malignant nodules, 194 indeterminate nodules, and 111 benign nodules. Histopathology results showed that 374 and 140 nodules were truly malignant from the suggested malignant and indeterminate diagnoses, respectively, and 100 nodules were truly benign from the 111 benign diagnoses. Our model correctly identified 342 malignant and 6 benign nodules from the 386 PET/CT-diagnosed malignant nodules, 106 malignant and 32 benign nodules from the 194 PET/CT-diagnosed indeterminate nodules, and 6 malignant and 75 benign nodules from the 111 PET/CT-diagnosed benign nodules. The overall accuracy of nuclear medicine physicians was 88.9%, while that of the PET/CT model was 82.1%. This indicates the potential clinical applicability of this diagnosis model.
Clinically, various situations or departments may require different indication results, including initial diagnosis, radiology examination, preoperative examination and postoperative check, etc. This model can be easily adjusted to satisfy different clinical demands. For example, the cutoff could be adjusted as 0.7 to meet a much stricter PPV demands when the performance of positive diagnosis was concerned. A further multi-center investigation will be necessary to evaluate, optimize and finally further improve the diagnostics performance of this model.
In conclusion, a machine learning-based predictive model for diagnosis of early-stage lung cancer was created in this study with a diagnosis PPV of 89.5% and accuracy of 82.1% from testing and validation of 691 PNs. The combination of PET-derived biochemical signals with CT-derived morphological information improved the diagnosis performance of early-stage lung cancer. Additionally, the model exhibited significant discriminatory power for SPNs, thereby fulfilling certain unmet clinical demands. The automatic calculation algorithm employed by the model contributed to its robustness and reduced bias. To confirm the model, further research is required using data acquired from different PET scanners across multiple centers.
The raw data supporting the conclusions of this article will be made available by the authors, without undue reservation.
The studies involving humans were approved by the Institutional Ethics Committee of Shanghai Pulmonary Hospital affiliated to Shanghai Tongji University. The studies were conducted in accordance with the local legislation and institutional requirements. Written informed consent for participation was not required from the participants or the participants’ legal guardians/next of kin in accordance with the national legislation and institutional requirements.
CH, HW, and YW contributed to conception and design of the study. YL, QLi and LZ organized the database. JH and YL performed the statistical analysis. CH wrote the first draft of the manuscript. HW, JH, QLin, JZ and HL wrote sections of the manuscript. All authors contributed to the article and approved the submitted version.
This study was supported by Shanghai Pulmonary Hospital affiliated to Tongji University (FK1947), the Shanghai Small and Medium-Sized Enterprises Innovation Fund (210H1153500) and Natural Science Foundation of Shanghai (23ZR1425900).
Author JH and YW were employed by the company Shanghai miRAN Biotech Co.Ltd, China.
The remaining authors declare that the research was conducted in the absence of any commercial or financial relationships that could be construed as a potential conflict of interest.
All claims expressed in this article are solely those of the authors and do not necessarily represent those of their affiliated organizations, or those of the publisher, the editors and the reviewers. Any product that may be evaluated in this article, or claim that may be made by its manufacturer, is not guaranteed or endorsed by the publisher.
1. Swensen SJ, Silverstein M, Ilstrup DM, Schleck C, Edell ES. The probability of Malignancy in solitary pulmonary nodules: application to small radiologically indeterminate nodules. Arch Internal Med (1997) 157(8):849–55.
2. Zhang S, Han F, Liang Z, Tan J, Cao W, Gao Y, et al. An investigation of CNN models for differentiating Malignant from benign lesions using small pathologically proven datasets. Comput Med Imaging Graph. (2019) 77:101645.
3. Hattori A, Matsunaga T, Takamochi K, Oh S, Suzuki K. Prognostic impact of a ground glass opacity component in the clinical T classification of non-small cell lung cancer. J Thorac Cardiovasc Surg (2017) 154(6):2102–10.e1.
4. Aokage K, Miyoshi T, Ishii G, Kusumoto M, Nomura S, Katsumata S, et al. Influence of ground glass opacity and the corresponding pathological findings on survival in patients with clinical stage I non-small cell lung cancer. J Thorac Oncol (2018) 13(4):533–42.
5. Yamanaka R. Medical management of brain metastases from lung cancer (Review). Oncol Rep (2009) 22(6):1269–76.
6. Refaat R, Elghazaly H. Employing 18 F-FDG PET/CT for distinguishing benign from metastatic adrenal masses. Egyptian J Radiol Nucl Med (2017) 48(4):1065–71.
7. De Wever W, Stroobants S, Coolen J, Verschakelen JA. Integrated PET/CT in the staging of nonsmall cell lung cancer: technical aspects and clinical integration. Eur Respir J (2009) 33(1):201–12.
8. Duan XY, Wang W, Li M, Li Y, Guo YM. Predictive significance of standardized uptake value parameters of FDG-PET in patients with non-small cell lung carcinoma. Braz J Med Biol Res (2015) 48(ahead):267–72.
9. Yldrm F, Yurdakul AS, Zkaya S, Akdemir MZ, Ztürk C. Total lesion glycolysis by 18F-FDG PET/CT is independent prognostic factor in patients with advanced non-small cell lung cancer. Clin Respir J (2017) 11(5):602–11.
10. Patel D, Mehta A, Nilubol N, Dieckmann W, Pacak K, Kebebew E. Total 18F-FDG PET/CT metabolic tumor volume is associated with postoperative biochemical response in patients with metastatic pheochromocytomas and paragangliomas. Ann Surgery. (2016) 263(3):582–87.
11. Zhao M, Chang B, Wei Z, Yu H, Tian R, Yuan L, et al. The role of 18F-FDG uptake features in the differential diagnosis of solitary pulmonary lesions with PET/CT. World J Surg Oncol (2015) 13:271.
12. Liu J, Dong M, Sun X, Li W, Xing L, Yu J. Prognostic value of 18F-FDG PET/CT in surgical non-small cell lung cancer: A meta-analysis. PloS One (2016) 11(1):e0146195.
13. Schwyzer M, Martini K, Benz DC, Burger IA, Messerli M. Artificial intelligence for detecting small FDG-positive lung nodules in digital PET/CT: impact of image reconstructions on diagnostic performance. Eur Radiol (2020) 30(3):2031–40.
14. Grubbs FE. Procedures for detecting outlying observations in samples. Technometrics (1956) 11(1):1–21.
15. Trygg J, Wold S. Orthogonal projections to latent structures (O-PLS). J Chemometrics. (2010) 16(3).
17. Speed T. Statistical models: theory and practice, revised edition. Int Stat review. (2010) 78(3):457–58.
18. Truett J, Cornfield J, Kannel W. A multivariate analysis of the risk of coronary heart disease in Framingham. J Chron Dis (1967) 20(7):511–24.
19. Xiao F, Liu D, Guo Y, Shi B, Song Z, Tian Y, et al. Novel and convenient method to evaluate the character of solitary pulmonary nodule-comparison of three mathematical prediction models and further stratification of risk factors. PloS One (2013) 8(10):e78271.
20. Mercieca S, Belderbos J, van Loon J, Gilhuijs K, Julyan P, van Herk M. Comparison of SUVmax and SUVpeak based segmentation to determine primary lung tumour volume on FDG PET-CT correlated with pathology data. Radiother Oncol (2018) 129(2):227–33.
21. Gray JD, Kogan JF, Marrocco J, McEwen BS. Genomic and epigenomic mechanisms of glucocorticoids in the brain. Nat Rev Endocrinol (2017) 13(11):661–73.
22. Hashimoto Y, Tsujikawa T, Kondo C, Maki M, Kusakabe K. Accuracy of PET for diagnosis of solid pulmonary lesions with 18F-FDG uptake below the standardized uptake value of 2.5. J Nucl Med Off Publ Soc Nucl Med (2006) 47(3):426.
23. Berghmans T, Dusart M, Paesmans M, Hossein-Foucher C, Sculier JP. Primary tumor standardized uptake value (SUVmax) measured on fluorodeoxyglucose positron emission tomography (FDG-PET) is of prognostic value for survival in non-small cell lung cancer (NSCLC). J Thorac oncology: Off Publ Int Assoc Study Lung Cancer. (2008) 3(1):6–12.
24. Divisi D, Barone M, Bertolaccini L, Zaccagna G, Gabriele F, Crisci R. Diagnostic performance of fluorine-18 fluorodeoxyglucose positron emission tomography in the management of solitary pulmonary nodule: a meta-analysis. J Thorac Dis (2018) 10(Suppl 7):S779–S89.
25. Li F, Sone S, Abe H, Macmahon H, Doi K. Malignant versus benign nodules at CT screening for lung cancer: comparison of thin-section CT findings. Radiology (2004) 233(3):793–8.
26. Gould MK, Donington J, Lynch W, Mazzone PJ, Midthun DE, Naidich DP, et al. Evaluation of individuals with pulmonary nodules: when is it lung cancer?: diagnosis and management of lung cancer, 3rd ed: american college of chest physicians evidence-based clinical practice guidelines. Chest (2013) 143(5):e93S–e120S.
27. Pasawski M, Krzyzanowski K, ZOmaniec J, Gwizdak J. Morphological characteristics of Malignant solitary pulmonary nodules. Annales Universitatis Mariae Curie-Skłodowska Sectio D: Medicina. (2004) 59(1):6–13.
28. Chen S, Li X, Chen M, Yin Y, Li N, Li Y. Limited diagnostic value of Dual-Time-Point 18F-FDG PET/CT imaging for classifying solitary pulmonary nodules in granuloma-endemic regions both at visual and quantitative analyses. Eur J Radiol (2016) 85(10):1744–49.
29. Gibson G, Kumar AR, Steinke K, Bashirzadeh F, Roach R, Windsor M, et al. Risk stratification in the investigation of pulmonary nodules in a high-risk cohort: positron emission tomography/computed tomography outperforms clinical risk prediction algorithms. Intern Med J (2017) 47(12):1385–92.
30. Li S, Zhao B, Wang X, Yu J, Yan S, Lv C, et al. Overestimated value of 18F-FDG PET/CT to diagnose pulmonary nodules: Analysis of 298 patients. Clin Radiol (2014) 69(8):e352–7.
31. Perandini S, Soardi GA, Larici AR, Del Ciello A, Rizzardi G, Solazzo A, et al. Multicenter external validation of two Malignancy risk prediction models in patients undergoing 18F-FDG-PET for solitary pulmonary nodule evaluation. Eur Radiol (2017) 27(5):2042–46.
32. Sim YT, Goh YG, Dempsey MF, Han S, Poon FW. PET-CT evaluation of solitary pulmonary nodules: correlation with maximum standardized uptake value and pathology. Lung (2013) 191(6):625–32.
33. Herder GJ, Van Tinteren H, Golding RP, Kostense PJ, COmans E, Smit E, et al. Clinical prediction model to characterize pulmonary nodules: validation and added value of 18F-fluorodeoxyglucose positron emission tomography. Chest (2005) 128(4):2490–96.
Keywords: PET/CT, pulmonary nodule, lung cancer, diagnosis, machine-learning
Citation: Wang H, Li Y, Han J, Lin Q, Zhao L, Li Q, Zhao J, Li H, Wang Y and Hu C (2023) A machine learning-based PET/CT model for automatic diagnosis of early-stage lung cancer. Front. Oncol. 13:1192908. doi: 10.3389/fonc.2023.1192908
Received: 24 March 2023; Accepted: 04 September 2023;
Published: 15 September 2023.
Edited by:
Andrea Lancia, San Matteo Hospital Foundation (IRCCS), ItalyReviewed by:
Piergiorgio Cerello, National Institute of Nuclear Physics of Turin, ItalyCopyright © 2023 Wang, Li, Han, Lin, Zhao, Li, Zhao, Li, Wang and Hu. This is an open-access article distributed under the terms of the Creative Commons Attribution License (CC BY). The use, distribution or reproduction in other forums is permitted, provided the original author(s) and the copyright owner(s) are credited and that the original publication in this journal is cited, in accordance with accepted academic practice. No use, distribution or reproduction is permitted which does not comply with these terms.
*Correspondence: Changlong Hu, Y2xodUBmdWRhbi5lZHUuY24=; Huoqiang Wang, d2hxMjIxNkAxNjMuY29t
†These authors share first authorship
Disclaimer: All claims expressed in this article are solely those of the authors and do not necessarily represent those of their affiliated organizations, or those of the publisher, the editors and the reviewers. Any product that may be evaluated in this article or claim that may be made by its manufacturer is not guaranteed or endorsed by the publisher.
Research integrity at Frontiers

Learn more about the work of our research integrity team to safeguard the quality of each article we publish.