 Miłosz Rozynek1
 Daniel Gut2Iwona Kucybała1Ewa Strzałkowska-Kominiak3Zbisław Tabor2Andrzej Urbanik1
 Stanisław Kłęk4Wadim Wojciechowski1*
- 1Department of Radiology, Jagiellonian University Medical College, Krakow, Poland
- 2Department of Biocybernetics and Biomedical Engineering, AGH University of Science and Technology, Krakow, Poland
- 3Department of Statistics, Universidad Carlos III de Madrid, Madrid, Spain
- 4Surgical Oncology Clinic, Maria Skłodowska-Curie National Cancer Institute, Krakow, Poland
Objectives: We developed a method for a fully automated deep-learning segmentation of tissues to investigate if 3D body composition measurements are significant for survival of Head and Neck Squamous Cell Carcinoma (HNSCC) patients.
Methods: 3D segmentation of tissues including spine, spine muscles, abdominal muscles, subcutaneous adipose tissue (SAT), visceral adipose tissue (VAT), and internal organs within volumetric region limited by L1 and L5 levels was accomplished using deep convolutional segmentation architecture - U-net implemented in a nnUnet framework. It was trained on separate dataset of 560 single-channel CT slices and used for 3D segmentation of pre-radiotherapy (Pre-RT) and post-radiotherapy (Post-RT) whole body PET/CT or abdominal CT scans of 215 HNSCC patients. Percentages of tissues were used for overall survival analysis using Cox proportional hazard (PH) model.
Results: Our deep learning model successfully segmented all mentioned tissues with Dice’s coefficient exceeding 0.95. The 3D measurements including difference between Pre-RT and post-RT abdomen and spine muscles percentage, difference between Pre-RT and post-RT VAT percentage and sum of Pre-RT abdomen and spine muscles percentage together with BMI and Cancer Site were selected and significant at the level of 5% for the overall survival. Aside from Cancer Site, the lowest hazard ratio (HR) value (HR, 0.7527; 95% CI, 0.6487-0.8735; p = 0.000183) was observed for the difference between Pre-RT and post-RT abdomen and spine muscles percentage.
Conclusion: Fully automated 3D quantitative measurements of body composition are significant for overall survival in Head and Neck Squamous Cell Carcinoma patients.
1 Introduction
Head and neck squamous cell carcinoma (HNSCC) had 890,000 new cases and 450,000 new deaths in 2018, placing itself as the 6th most common cancer worldwide (1). It arises from the squamous epithelium of the oral cavity, oropharynx, larynx, and hypopharynx (2) and due to its anatomical location and clinical symptoms such as chronic pain of the throat, nonhealing ulcers, and odynophagia, it can cause a decrease in proper food intake. Additionally, as a consequence of the treatment schemas currently used, patients struggling with this disease could also suffer from the toxicity of radio- and chemotherapy (3, 4). Furthermore, cancer catabolic properties and lifestyle risk factors such as high alcohol consumption and nicotine dependence may also contribute to an increased risk of malnutrition in these patients (5).
Consequently, their muscle and adipose tissue can potentially have disturbed proportions and properties. It is an important issue that we should look at, considering that recent studies suggest that body composition (BC) has a significant impact on different clinical outcomes in oncology (6). There are a few ways to obtain information about the BC of the patient, from these methods cross-sectional imaging techniques including CT and magnetic resonance imaging are considered the gold standard (7). From those two imaging modalities, CT is more commonly used, especially in oncology. It is a routine diagnostic tool; therefore, almost every oncological patient has performed at least one and sometimes even more CT scans, in the case of patients with HNSCC PET/CT is the recommended diagnostic modality in the evaluation of distant metastases (4, 8). However, body composition analysis, although potentially important for a complete diagnosis, is not routinely used by clinicians. This is due to the fact that currently such a measurement needs to be performed by segmenting numerous cross-sectional images, which is a tedious and time-consuming task. The answer to this problem could be found in artificial intelligence, which can help radiologists perform automated and standardized body composition measurements (9).
In our study, we wanted to develop a Fully Automated Method for 3D segmentation of tissues within the volumetric body region limited by L1 and L5 levels and verify if those measurements are significant for the overall survival of patients treated due to head and neck squamous cell carcinoma. We also wanted to find out if Fully Automated 3D measurements of body composition are a better predictor of overall survival than manual 2D cross-sectional measurements derived from L3 level.
2 Materials and methods
2.1 Materials
We used two separate datasets: the first dataset was used to develop a deep learning model capable of fully automated 3D abdominal tissue segmentation. The other, on which our model was used to obtain quantitative measurements of body composition, was made up of imaging and clinical data of HNSCC patients.
2.1.1 Head and neck squamous cell carcinoma patients dataset
This dataset was retrieved from the Head and Neck Cancer CT atlas available in “The Cancer Imaging Archive” (TCIA) (10–12). TCIA provides anonymized data with consent obtained and ethical approval ensured by source institutions. It consists of clinical and imaging data of HNSCC patients treated with curative-intent radiotherapy (n=215). They were selected from the group of 2840 HNSCC patients hospitalized at MD Anderson Cancer Center from October 1, 2003, to August 31, 2013. The dataset comprised 215 HNSCC patients, 84,7% were male, mean age was 57,21 ± 9,79 years. Most patients (62,36%) had a smoking history. Each patient had histologically confirmed squamous cell carcinoma, the most common primary cancer site was the oropharynx (72,6%). 114 of 215 patients received a feeding tube. 59,1% received concurrent chemotherapy; in 98,4% of the cases, it was platinum-based. All patients were treated with radiotherapy (RT), the mean total dose was 68,73 ± 2,71 Gy. 212 patients had whole body PET/CT done before and after radiotherapy, in the case of 3 patients, an abdominal CT scan was used instead. GE Medical Systems’ Discovery RX, Discovery ST, and Discovery STE hybrid PET/CT scanners were utilized to acquire PET/CT scans subsequent to the intravenous administration of 18F-labeled fluorodeoxyglucose. CT scans, encompassing the abdominal area, were conducted using GE Medical Systems LightSpeed or Discovery CT750HD scanners. All the details for each examination, such as image type, date, study description, used scanner, and software specifications, can be found on the TCIA website (10). The summary of patient data can be found in Table 1. Aside from standard clinical information authors of the database also provided us with their manual 2D cross-sectional body composition measurements: Pre-RT L3 Skeletal Muscle Index (cm2/m2), Post-RT L3 Skeletal Muscle Index (cm2/m2), Pre-RT L3 Adiposity Index (cm2/m2) and Post-RT L3 Adiposity Index (cm2/m2). These indices were calculated by diving the cross-sectional area of selected tissue at the L3 level by the height of the patient. We used those 2D measurements to compare them with our fully automated 3D body composition measurements.
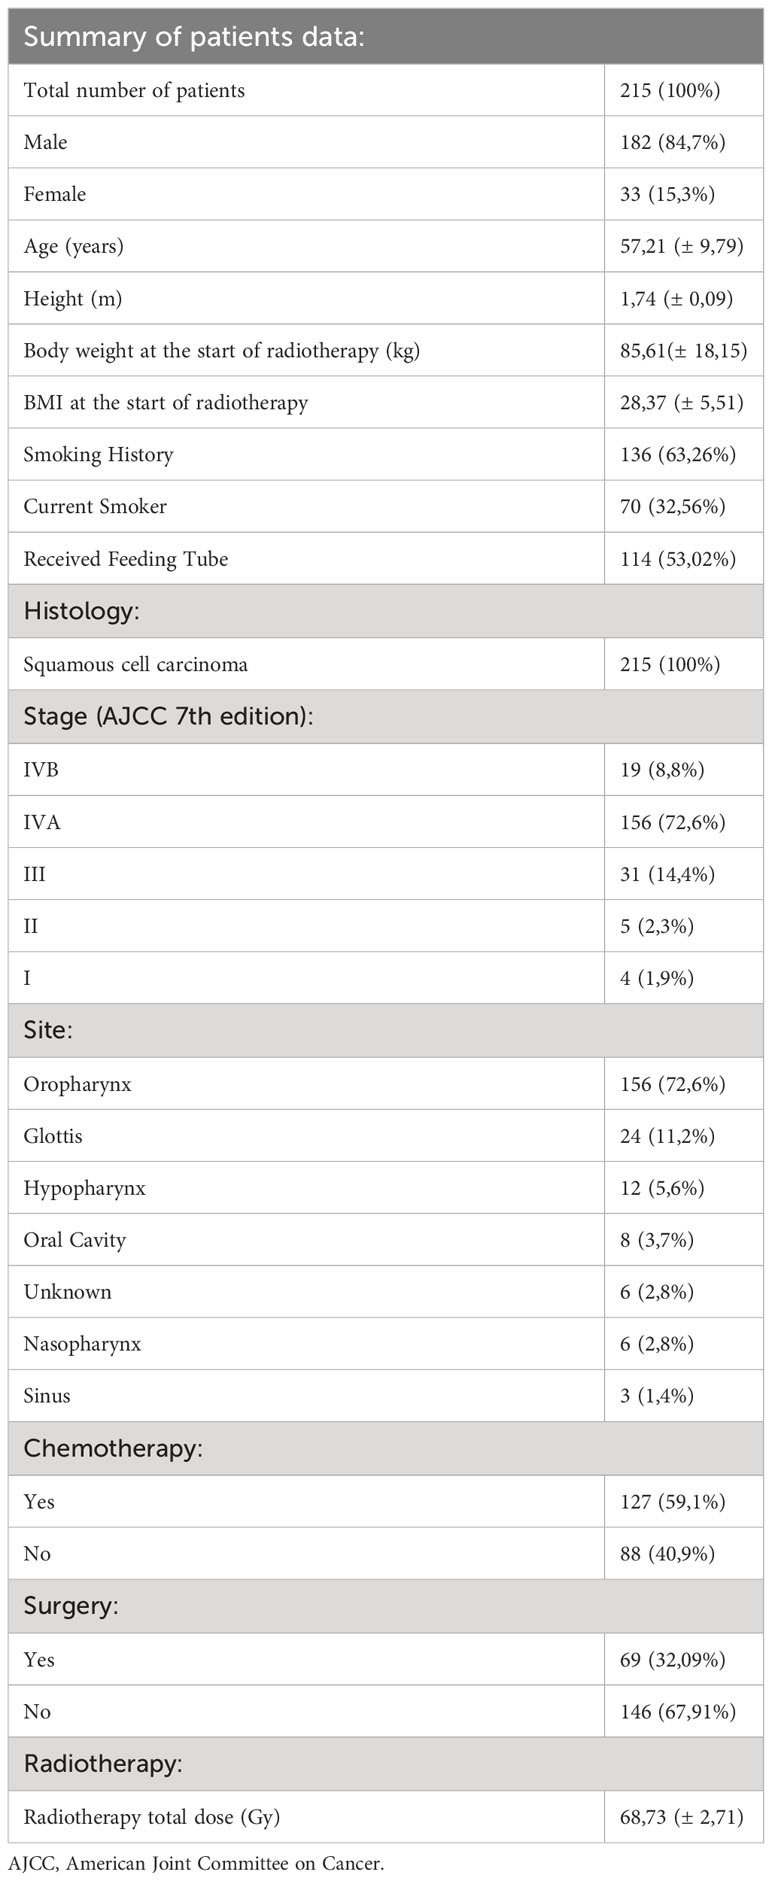
Table 1 Summary of patients and treatment characteristics.
2.1.2 Model training and testing dataset
The training and testing dataset comprised 140 CT examinations performed with the use of a helical 80-row CT scanner Aquilion PRIME 80 (Toshiba America Medical System, Irvine, CA, USA). The pixel size of the images was equal to 0.74 mm, while the slice thickness was equal to 5 mm. The images were coded with a contrast resolution equal to 2 bytes but, in accordance with the DICOM standard, only 12 bits were used to encode signal values with Hounsfield units. Further details concerning the dataset used to develop our model can be found elsewhere (13). From these 140 3D abdominal CT examinations, 560 2D slices were manually selected at levels corresponding to the centers of the lumbar vertebral bodies L1 to L5. The location of L1 and L5 slices within each CT examination was also recorded and used as a reference when creating a model for detecting an abdominal part of a CT image.
2.2 Methods
2.2.1 Automated assessment of tissues’ volumes
To develop a fully automated tissues volumes assessment method, we divided our task into two separate problems: detection of the volume of interest and segmentation of tissues of interest.
For detecting the volume of interest, the 3D CT examinations described in section 2.1.2 were split into 2D axial slices. All slices containing part of the lungs or parts of the pelvic bone were assigned a negative label, while the remaining slices were assigned a positive label. The 2D slices together with their labels were used to train an algorithm that detects volumes of interest.
The detection of the volume of interest (VOI) was accomplished using a deep convolution network. The detection problem was reformulated as a classification problem. An Inception-based classification network was trained to distinguish between positive and negative slices using the custom dataset described in the previous section. The volume of interest was defined as the range of axial slices between the lowest and the highest positive slice. The set of all 140 CT images was split into 5 folds and five models were trained until convergence using five-fold cross validation. The models that achieved the best performance during training on the validation sets were used on TCIA dataset. The classification accuracy was measured in terms of the distance between the respective borders of the volumes of interest in a reference (manual) selection and in automatically detected volumes of interest. In addition, we also calculated the common measures of classification quality: sensitivity, specificity, and accuracy by calculating macro averages of five confusion matrices for the five validation sets for the classification task.
For segmentation purposes, the boundaries of the spine, spine muscles, abdominal muscles, subcutaneous adipose tissue (SAT), and visceral adipose tissue (VAT) were manually outlined and served as the ground truth. Internal organs were also included as separate regions consisting of all pixels that were within the body cross section but were not included within the aforementioned classes. From the data set described in section 2.1.2 - 560 single-channel CT slices were split as follows: 420 images were randomly assigned to a training subset while the remaining 140 images were assigned to the testing subset.
The segmentation of abdominal tissues was done with a deep convolutional segmentation model - U-Net network (14). As shown in the study of Weston et al. (15) the U-Net based segmentation of abdominal tissues achieves an accuracy exceeding 95% in terms of Dice’s coefficient. We have used the U-Net model implemented in the nnUNet framework which includes several features improving the performance of the trained models like architecture to data adaptation, deep supervision, or learning rate strategy which makes this segmentation framework superior with respect to other segmentation models (16). Furthermore, the automated segmentation pipeline incorporates resampling and normalization methods, facilitating the standardization of images. This integration helps mitigate biases arising from variations in scanners and image qualities. We have trained the 2D version of U-Net – the volume of interest was split into 2D axial slices which were subsequently used to train and test the 2D U-Net network. According to recently published study Classical U-Net architecture presents themself as the most favorable option, which strikes a balance between accuracy and computational efficiency, making it appropriate choice for real-world applications such as automated body composition analysis (17). Both training and testing were run using default nnUNet settings. The training of segmentation was run until convergence on a training set. Five-fold cross-validation was used to train five models that were used as an ensemble at prediction time. During each fold training, the model which achieves the best performance on a validation set was saved and used at the prediction time.
The accuracy of segmentation was measured in terms of two standard segmentation quality metrics: Dice’s coefficient (DC) and Hausdorff distance (HD) with DC (HD) equal to 1 (0) for automated segmentation being the same as reference segmentation.
After training and testing on the custom dataset the deep segmentation U-Net model and the classification model were applied slice-by-slice to the Cancer Imaging Archive dataset described in section 2.1.1. A sample image of our automated segmentation applied to the TCIA dataset is shown in Figure 1.
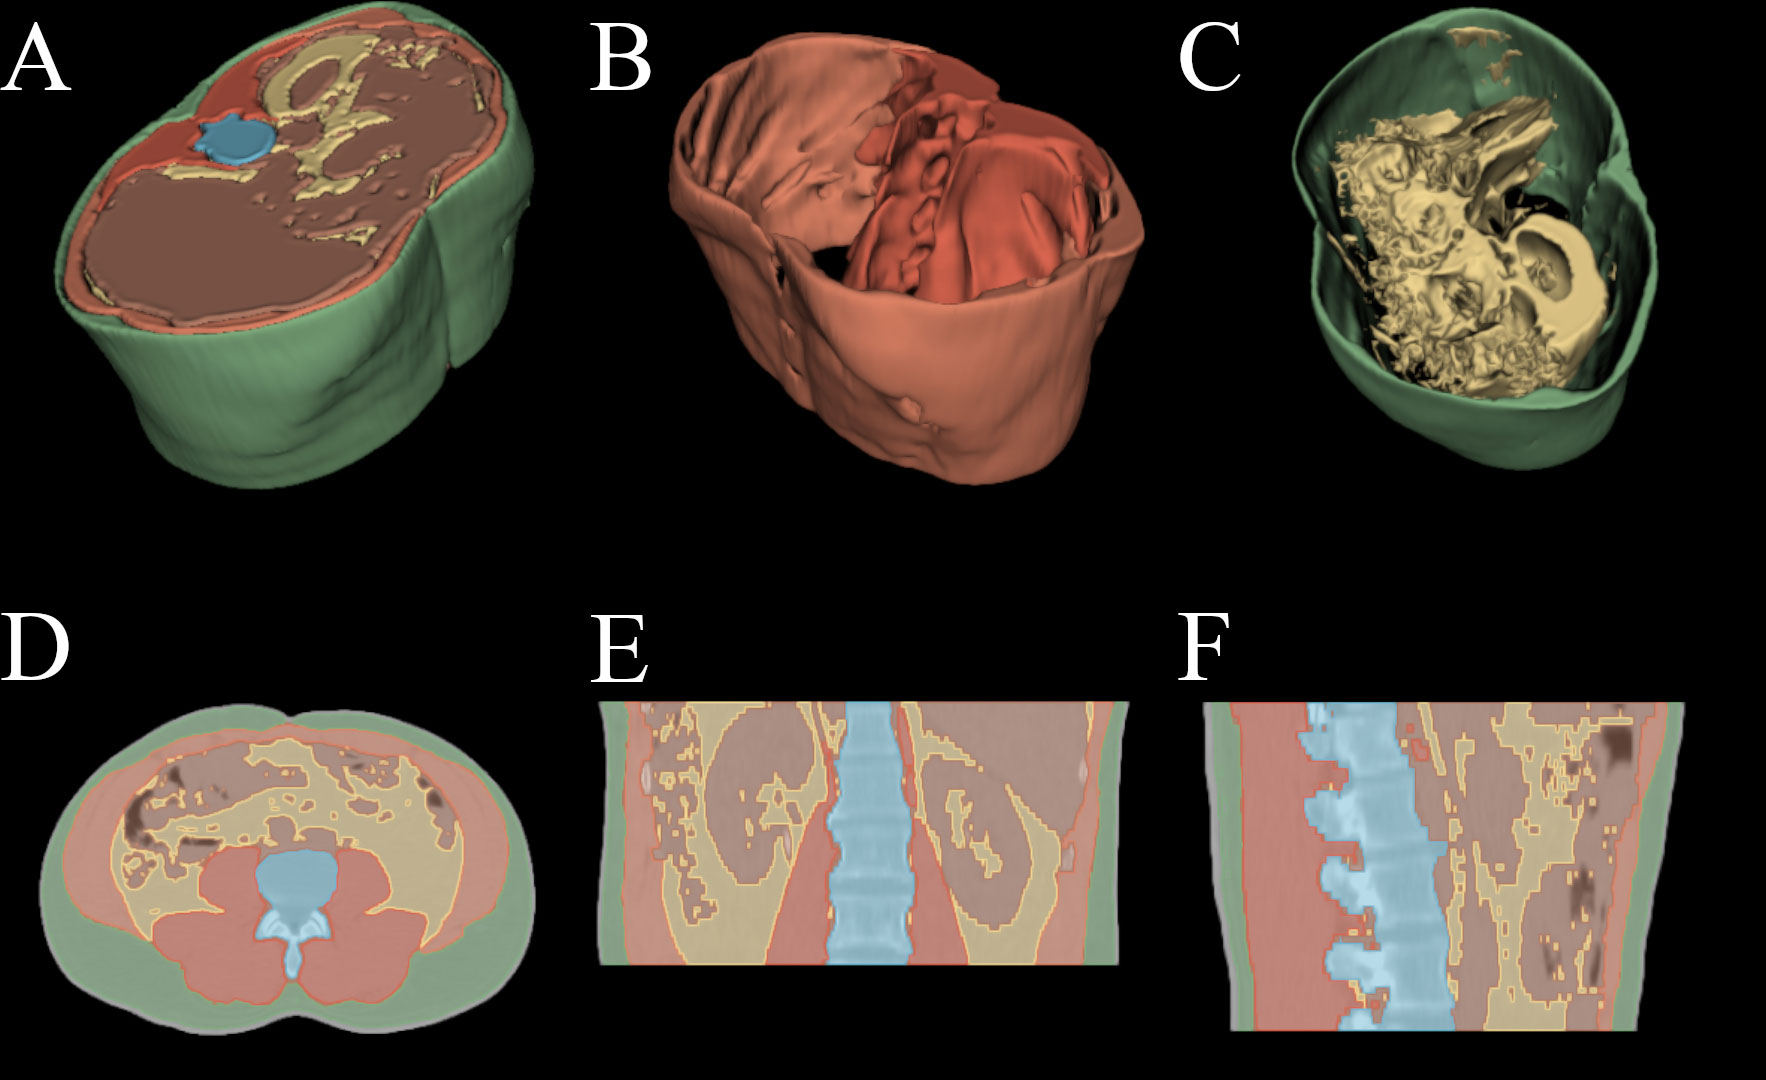
Figure 1 Automated segmentation applied to HNSCC patient PET/CT examination. (A) 3D render of all above mentioned tissues. (B) 3D render of spine and abdominal muscles. (C) 3D render of subcutaneous and visceral adipose tissue. (D) axial slice with overlayed segmentation mask. (E) coronal slice with overlayed segmentation mask. (F) sagittal slice with overlayed segmentation mask.
2.2.2 Survival analysis methods
We conducted a multivariate analysis using Cox proportional hazard (PH) model to check whether the parameters assessed by automated 3D body composition measurements and their changes are significant for overall survival time. For this, we considered all the important clinical data together with the PET/CT based body composition measurements. In particular, we included to the model the following variables: sex (m/f), age (cont.), height (cont.), stage (I-III/IV), T stage (T1-3/T4), N stage (N0/N1-3), Cancer Site (Oropharynx/Other site), Smoking History (Never/Ever), Current Smoker (Yes/No), Surgery (Yes/No), Concurrent chemoradiotherapy (Yes/No), Induction Chemotherapy (Yes/No), Received Feeding Tube (Yes/No), RT Total Dose (cont.) together with BMI, 2D manual measurements and our automated 3D measurements. All body composition measurements were collected both before and after the Radiotherapy. Furthermore, we reduced the number of categorical variables to those significant at the level of 10% in the univariate analysis (log-rank test). Although HPV-negative and HPV-positive carcinomas differ at the molecular level (4) in our data set, there were only 47 patients with known HPV status, of which 33 were positive. In the previously mentioned log-rank test differences in survival time between groups: HPV positive and HPV negative were not significant. Moreover, the preliminary correlation analysis showed a relatively strong dependence between SAT/VAT pre-treatment measurements and BMI measured before treatment. Hence, those two variables were excluded from our study. Additionally, the measurement of the spinal and abdominal muscles was only considered as a sum.
Furthermore, for 77 patients we observe the complete survival time, which gives us around 64% of censoring. We fitted the proportional hazard (PH) model where, along with patients characteristics, the Pre RT measurements together with the differences between pre RT and post RT measurements were taken into account. The statistical analysis was conducted using the coxph() routine from open-source statistical software R. We selected the final set of covariates using Akaike Information Criterium (AIC). We verified the PH assumption with the Schoenfeld test and checked for outliers and influential observations with deviance residuals and dfbetas, respectively. One influential observation was removed.
3 Results
3.1 Automated segmentation results
The mean shift between the bottom slices in manual and automated VOIs was equal to -0.6 ± 1.65 slices. The mean shift between the top slices in manual and automated VOIs was equal to 0.2 ± 1.0 slices. Additionally, sensitivity, specificity, and accuracy were equal to, respectively, 96.1%, 96.2%, and 96.2%. The detection of the bottom slices failed in three cases, the shift between the bottom slices in manual and automated VOIs was larger than 20 slices.
The results of testing the automated segmentation algorithm are presented in Table 2. The median values of Dice’s coefficient (0.95 and more) indicate that the overlap area between automated and manual segmentation is not less than 95% of the total area of the tissue. The median values of Hausdorff distance are greater than 6 voxels, which means that the relative shift of the boundaries of manual and automated segmentation can be as large as demonstrated in Table 2. However, because the values of Dice’s coefficient are high, these high values of Hausdorff distance are likely related to some small segmentation artefacts or anisotropic voxel size.
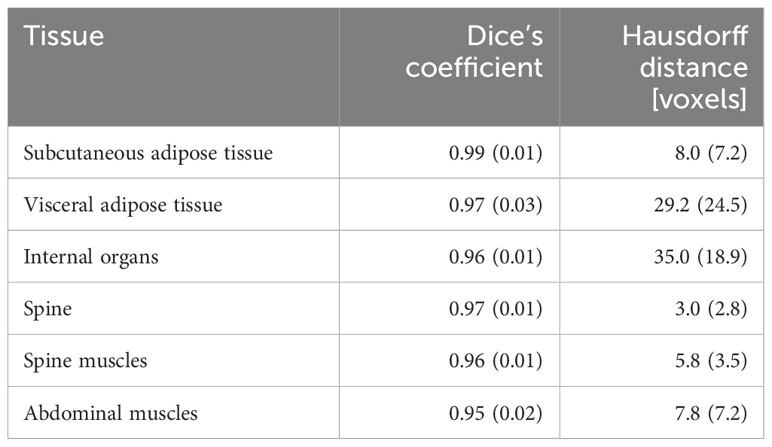
Table 2 The results of testing the quality of automated segmentation: values of Dice’s coefficient and Hausdorff distance (median and interquartile range) for the six segmented abdominal tissues.
3.2 Automated 3D body composition quantitative analysis results
The VOI detection and tissue segmentation models were applied to TCIA dataset described in section 2.1.1. Results were visually verified after which it was confirmed that they were of satisfactory diagnostic quality. The volumes of the tissues of interest within the VOI were then calculated from the results of the segmentation. We calculated both the average tissue volume within VOI (total tissue volume divided by the number of axial slices within the VOI) and the volume fraction of tissues (ratio of tissue volume to the total volume of all tissues) which percentage values were used for survival analysis. The summary of those measurements can be found in Table 3.
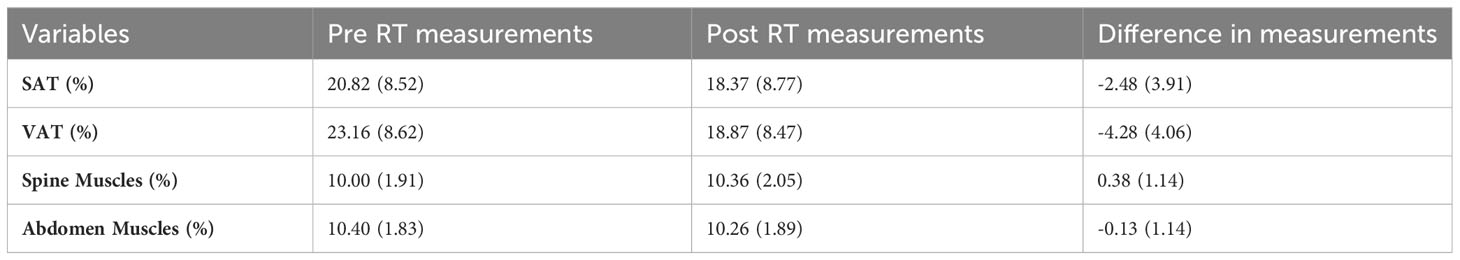
Table 3 The mean and standard deviation of body measurements pre RT, and post RT and their differences.
3.3 Survival analysis results
The results for the model described in Section 2.2.2 are found in Figure 2. The 3D measurements (difference between Pre-RT and post-RT Abdomen and Spine Muscles percentage, the difference between Pre-RT and post-RT VAT percentage, and the sum of Pre-RT Abdomen and Spine muscles percentage) together with BMI and Cancer Site were found significant at the level of 5%. No significance for overall survival was observed for the remaining 3D body composition measurements. Manual 2D body composition measurements including L3 skeletal muscle and adiposity index pre and post treatment weren’t significant in the aspect of overall survival.
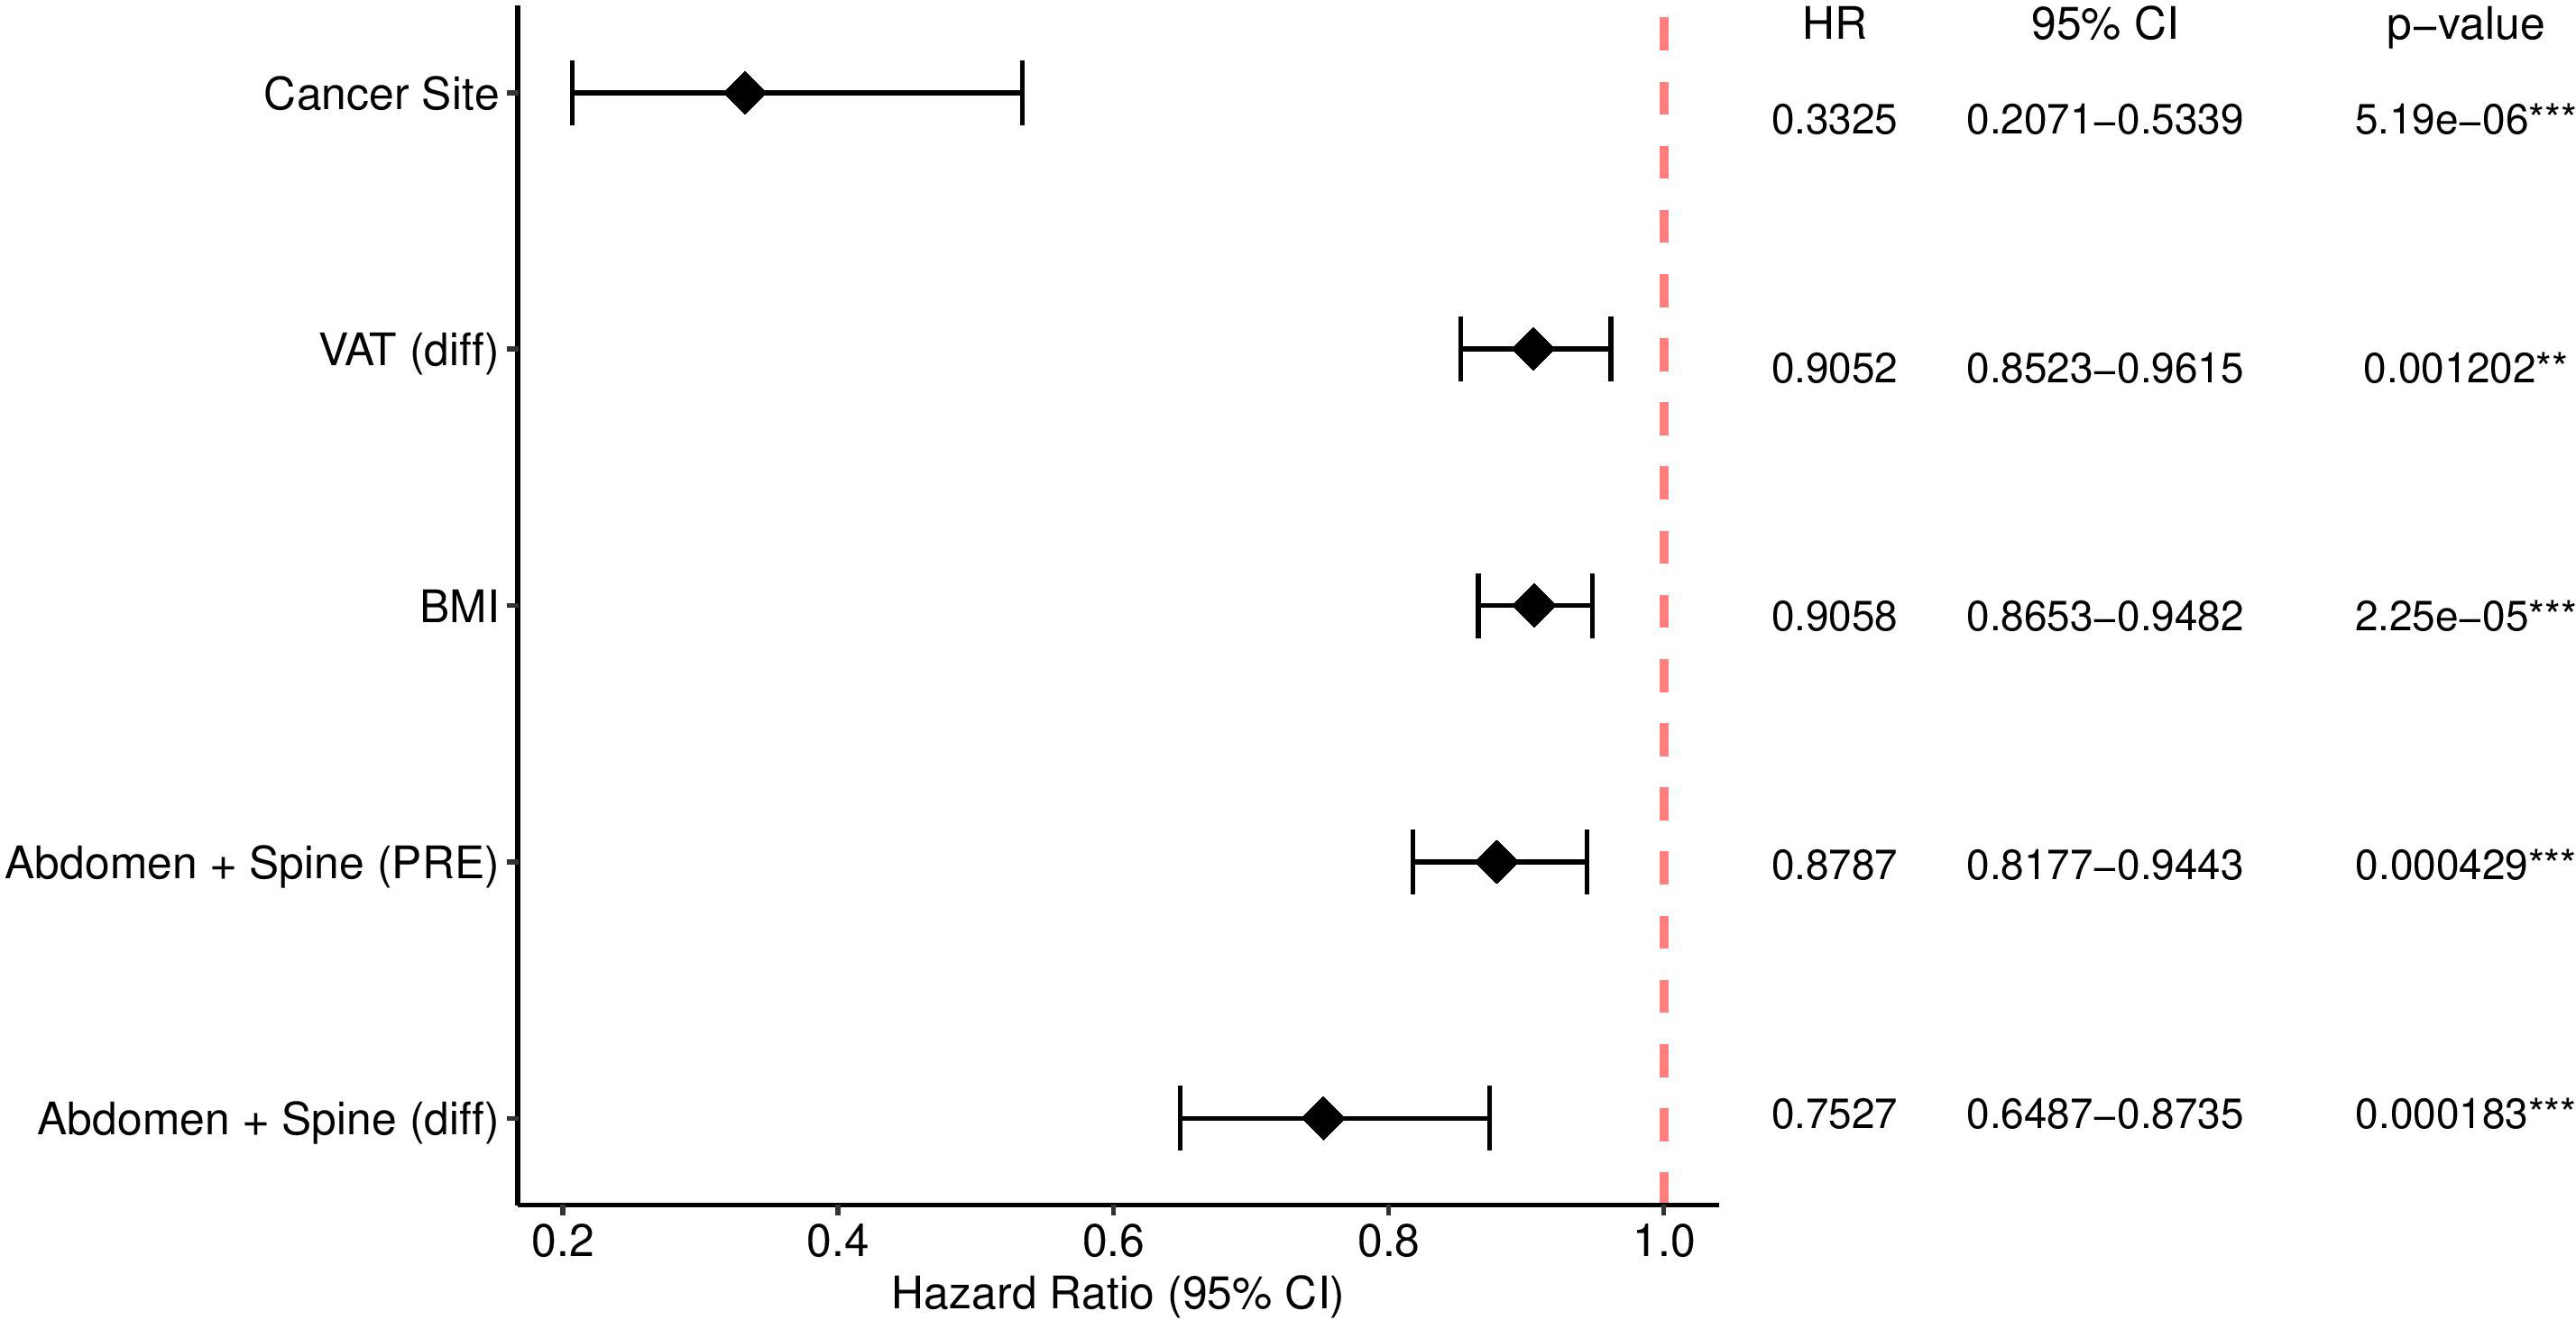
Figure 2 The Cox model with significance codes 0 ‘***’ 0.001 ‘**’ with e.g. “e-06” denotes 10 to the power -6.
4 Discussion
Body composition disturbances were negatively associated with different clinical outcomes in several groups of oncological patients (6). In this study, we developed a fully automated method for the 3D quantitative analysis of body composition and showed that these measurements are significant for the overall survival of patients with HNSCC. Furthermore, they were found to be a better indicator of overall survival than commonly used metrics – such as BMI and manual cross-sectional 2D measurements of adipose and muscle tissue. In the case of all analyzed patients, radiation therapy was used, which is crucial in curative intended treatment for head and neck malignancies. It can be used as a standalone treatment or in conjunction with surgery or chemotherapy (18).
To better understand the importance of skeletal muscle in oncological disorders, we should define the term sarcopenia - a generalized skeletal muscle disorder rooted in progressive and adverse muscle changes (19). It was associated with postoperative complications, poorer survival, and chemotherapy-induced toxicity in oncological disorders (20–23). Another component of body composition analysis, adipose tissue, is a well-documented factor contributing to the development of various types of cancer (24). Higher volumes of VAT were identified as a risk factor for unsuspected pulmonary embolism in hospitalized patients with gastrointestinal cancer (25). Visceral adipose tissue modulates cellular radiosensitivity in patients with esophageal adenocarcinoma (26), it was also found that it can be considered a prognostic indicator for patients with endometrial cancer (27). Male patients with non-clear cell renal carcinoma have a higher content of visceral adipose tissue (28).
Both sarcopenia and visceral adipose tissue volume and CT attenuation were associated with the outcomes of patients with head and neck cancer (29, 30). Radiologically measured body composition parameters commonly require abdominal CT, which in the case of a patient with HNSCC is available as part of a whole-body PET/CT scan. Manual segmentation of muscles and adipose tissue is very tedious; therefore, most researchers only use a single slice from the L3 level for BC evaluation. Although it can be an accurate method to assess sarcopenia and body composition (31), this is only an approximation that can vary between patients (32), in our study the indices calculated from manually determined 2D cross sectional areas were not found significant, contrary to our automated 3D measurements. However, previous studies conducted on different groups of patients with HNSCC showed that measurements at the level of L3 can also be associated with survival (33) similar to those taken from the neck region (34–36). Nevertheless, the more cross-section slices we use, the more accurate body composition analysis will be. The efficacy of our method hinges on precise segmentation of tissues within a volumetric body region confined between L1 and L5 levels. Nevertheless, due to considerable variability in patient anatomy, accurately segmenting tissues can pose challenges in certain cases. In order to address the influence of patient anatomy variability, we leveraged a dataset consisting of 560 single-channel CT slice examinations encompassing a wide spectrum of anatomical differences. This dataset encompassed patients with diverse body sizes and shapes. Despite the model robustness, clinical expertise remains paramount in complementing and validating the model output, safeguarding the highest standard of patient care and diagnostic accuracy.
Due to the rapid progress in the field of Artificial Intelligence, segmentation of medical images, which as stated before is crucial for BC analysis, is becoming less time-consuming and more accurate. Although there are several ways for achieving automated segmentation of tissues e.g., non-local means and morphological operations (37) we decided to utilize U-net model for automatic segmentation due to the large variability in the distribution of muscle and adipose tissue. Similar approach was used for different tissues with high variability e.g., prostate gland and its zones (38). Currently, there are already a few published studies describing methods for fully automated 3D BC analysis (15, 32), but to our knowledge, we conducted the only study in which these measurements were related to survival in HNSCC patients’ group.
AI rapid advancement is also intricately tied to the field of Radiomics, an emerging discipline focused on medical image analysis which provides ways for quality assessment of different tissues by employing advanced mathematical techniques to extract additional data, probing the nuanced spatial distribution of signal intensities and pixel interrelationships (39).Together with hybrid machine learning systems it was already used in several clinical settings such as prediction of cognitive decline in Parkinson’s disease (40) or prediction of progression-free survival outcome in head and neck cancer patients (41). Although, its potential in body composition studies hasn’t been widely studied, there are already few published papers describing its usage in prediction of survival in oncological patients (42–47).
This study has several limitations. In the case of study design, its retrospective nature must be considered because it comes with certain standard disadvantages. Additionally, although PET/CT is often used in current diagnosis schemas for head and neck cancer (48), not all patients in every clinical center have done it before and after radiation therapy treatment. In the case of body composition analysis, we only used quantitative measurements of muscles and adipose tissue, which is insufficient to fully describe their characteristics but was enough to find a correlation with overall survival.
Future studies should take into consideration not only the quantity of muscles and adipose tissue but also quality, furthermore, PET/CT is not only limited to the abdominal region so it can be used for body composition measurement from more regions which could lead to some new insights. Additionally, utilizing radiomic features derived from 3D body composition data alongside advanced machine learning algorithms can unlock deeper insights into predictive models for survival. This approach may uncover subtle patterns that are not readily apparent through visual inspection. While our initial study focuses on HNSCC patients, the methodology itself is not restricted to this specific population. By encouraging further research and collaboration to assess the generalizability of our approach on diverse patient cohorts, our study aims to contribute to the development of AI-based tools that can be applied effectively and safely in a broader range of clinical settings and patient populations.
5 Conclusion
Body composition was previously associated with the clinical results of oncological patients. In this study we presented that 3D body composition measurements for L1-L5 levels, acquired automatically using the deep neural network U-net model implemented in the nnUnet framework, have a significant impact on the overall survival time of patients with head and neck squamous cell carcinoma. Moreover, we found out that Fully Automated 3D quantitative measurements of body composition are a better indicator of overall survival than BMI and manual cross-sectional 2D measurements of adipose and muscle tissue. To fully describe the characteristics of body composition of HNSCC patients, further research that incorporates qualitative analysis of muscle and adipose tissue, is needed.
Data availability statement
Publicly available datasets were analyzed in this study. This data can be found here: https://wiki.cancerimagingarchive.net/pages/viewpage.action?pageId=24281354#242813540dfd743a8c3341f482a1cc44952110ec.
Ethics statement
The studies involving humans were approved by dataset source institution - University of Texas MD Anderson Cancer Center. Our research was a retrospective study of publicity available fully anonymized imaging and clinical data. The studies were conducted in accordance with the local legislation and institutional requirements. The participants provided their written informed consent to participate in this study.
Author contributions
MR: Conceptualization, Data curation, Investigation, Methodology, Project administration, Resources, Visualization, Writing-original draft, Writing-review & editing. DG: Conceptualization, Data curation, Formal analysis, Investigation, Methodology, Resources, Software, Visualization, Writing-review & editing. IK: Data curation, Investigation, Methodology, Resources, Writing-review & editing. ES-K: Data curation, Formal analysis, Software, Visualization, Writing-original draft, Writing-review & editing. ZT: Conceptualization, Data curation, Formal analysis, Investigation, Methodology, Resources, Software, Supervision, Visualization, Writing-original draft, Writing-review & editing. AU: Investigation, Supervision, Writing-review & editing. SK: Investigation, Supervision, Writing-review & editing. WW: Conceptualization, Investigation, Methodology, Resources, Supervision, Visualization, Writing-original draft, Writing-review & editing. All authors contributed to the article and approved the submitted version.
Conflict of interest
The authors declare that the research was conducted in the absence of any commercial or financial relationships that could be construed as a potential conflict of interest.
Publisher’s note
All claims expressed in this article are solely those of the authors and do not necessarily represent those of their affiliated organizations, or those of the publisher, the editors and the reviewers. Any product that may be evaluated in this article, or claim that may be made by its manufacturer, is not guaranteed or endorsed by the publisher.
Abbreviations
HNSCC, Head and Neck Squamous Cell Carcinoma; BC, Body Composition; TCIA, The Cancer Imaging Archive; CCRT, Concurrent Chemoradiation Therapy; DC, Dice’s Coefficient; HD, Hausdorff Distance; VOI, Volume of Interest; SAT, Subcutaneous Adipose Tissue; VAT, Visceral Adipose Tissue; HR, Hazard Ratio; PH, Proportional Hazard.
References
1. Johnson DE, Burtness B, Leemans CR, Lui VWY, Bauman JE, Grandis JR. Head and neck squamous cell carcinoma. Nat Rev Dis Primers (2020) 6:92. doi: 10.1038/s41572-020-00224-3
2. Solomon B, Young RJ, Rischin D. Head and neck squamous cell carcinoma: Genomics and emerging biomarkers for immunomodulatory cancer treatments. Semin Cancer Biol (2018) 52:228–40. doi: 10.1016/j.semcancer.2018.01.008
3. Grossberg AJ, Chamchod S, Fuller CD, Mohamed ASR, Heukelom J, Eichelberger H, et al. Association of body composition with survival and locoregional control of radiotherapy-treated head and neck squamous cell carcinoma. JAMA Oncol (2016) 2:782–9. doi: 10.1001/jamaoncol.2015.6339
4. Machiels JP, René Leemans C, Golusinski W, Grau C, Licitra L, Gregoire V. Squamous cell carcinoma of the oral cavity, larynx, oropharynx and hypopharynx: EHNS–ESMO–ESTRO Clinical Practice Guidelines for diagnosis, treatment and follow-up†. Ann Oncol (2020) 31:1462–75. doi: 10.1016/j.annonc.2020.07.011
5. Almada-Correia I, Neves PM, Mäkitie A, Ravasco P. Body composition evaluation in head and neck cancer patients: A review. Front Oncol (2019) 9:1112. doi: 10.3389/fonc.2019.01112
6. Brown JC, Feliciano EMC, Caan BJ. The evolution of body composition in oncology— epidemiology, clinical trials, and the future of patient care: Facts and numbers. J Cachexia Sarcopenia Muscle (2018) 9:1200–8. doi: 10.1002/jcsm.12379
7. Wang B, Torriani M. Artificial intelligence in the evaluation of body composition. Semin Musculoskelet Radiol (2020) 24:30–7. doi: 10.1055/s-0039-3400267
8. Pfister DG, Spencer S, Adelstein D, Adkins D, Anzai Y, Brizel DM, et al. Head and neck cancers, version 2.2020. JNCCN J Natl Compr Cancer Network (2020) 18:873–98. doi: 10.6004/jnccn.2020.0031
9. Rozynek M, Kucybała I, Urbanik A, Wojciechowski W. Use of artificial intelligence in the imaging of sarcopenia: A narrative review of current status and perspectives. Nutrition (2021) 89:111227. doi: 10.1016/j.nut.2021.111227
10. Grossberg AJ, Mohamed ASR, Elhalawani H, Bennett WC, Smith KE, Nolan TS, et al. Imaging and clinical data archive for head and neck squamous cell carcinoma patients treated with radiotherapy. Sci Data (2018) 5:180173. doi: 10.1038/sdata.2018.173
11. Grossberg A, Mohamed A, Elhalawani H, Bennett W, Smith K, Nolan T, et al. Data from Head and Neck Cancer CT Atlas. The Cancer Imaging Archive (2017). doi: 10.7937/K9/TCIA.2017.umz8dv6s
12. Clark K, Vendt B, Smith K, Freymann J, Kirby J, Koppel P, et al. The cancer imaging archive (TCIA): maintaining and operating a public information repository. J Digit Imaging (2013) 26:1045–57. doi: 10.1007/s10278-013-9622-7
13. Kucybała I, Tabor Z, Ciuk S, Chrzan R, Urbanik A, Wojciechowski W. A fast graph-based algorithm for automated segmentation of subcutaneous and visceral adipose tissue in 3D abdominal computed tomography images. Biocybern BioMed Eng (2020) 40:729–39. doi: 10.1016/j.bbe.2020.02.009
14. Ronneberger O, Fischer P, Brox T. U-Net: Convolutional Networks for Biomedical Image Segmentation BT - Medical Image Computing and Computer-Assisted Intervention – MICCAI 2015. Navab N, Hornegger J, Wells WM, Frangi AF, editors. Cham: Springer International Publishing (2015) p. 234–41.
15. Weston AD, Korfiatis P, Kline TL, Philbrick KA, Kostandy P, Sakinis T, et al. Automated abdominal segmentation of CT scans for body composition analysis using deep learning. Radiology (2019) 290:669–79. doi: 10.1148/radiol.2018181432
16. Isensee F, Jaeger PF, Kohl SAA, Petersen J, Maier-Hein KH. nnU-Net: a self-configuring method for deep learning-based biomedical image segmentation. Nat Methods (2021) 18:203–11. doi: 10.1038/s41592-020-01008-z
17. Gut D, Tabor Z, Szymkowski M, Rozynek M, Kucybała I, Wojciechowski W. Benchmarking of deep architectures for segmentation of medical images. IEEE Trans Med Imaging (2022) 41:3231–41. doi: 10.1109/TMI.2022.3180435
18. Alterio D, Marvaso G, Ferrari A, Volpe S, Orecchia R, Jereczek-Fossa BA. Modern radiotherapy for head and neck cancer. Semin Oncol (2019) 46:233–45. doi: 10.1053/j.seminoncol.2019.07.002
19. Cruz-Jentoft AJ, Bahat G, Bauer J, Boirie Y, Bruyère O, Cederholm T, et al. Sarcopenia: Revised European consensus on definition and diagnosis. Age Ageing (2019) 48:16–31. doi: 10.1093/ageing/afy169
20. Pamoukdjian F, Bouillet T, Lévy V, Soussan M, Zelek L, Paillaud E. Prevalence and predictive value of pre-therapeutic sarcopenia in cancer patients: A systematic review. Clin Nutr (2018) 37:1101–13. doi: 10.1016/j.clnu.2017.07.010
21. Rossi F, Valdora F, Bignotti B, Torri L, Succio G, Tagliafico AS. Evaluation of body Computed Tomography-determined sarcopenia in breast cancer patients and clinical outcomes: A systematic review. Cancer Treat Res Commun (2019) 21:100154. doi: 10.1016/j.ctarc.2019.100154
22. Yang M, Shen Y, Tan L, Li W. Prognostic value of sarcopenia in lung cancer: A systematic review and meta-analysis. Chest (2019) 156:101–11. doi: 10.1016/j.chest.2019.04.115
23. Yang Z, Zhou X, Ma B, Xing Y, Jiang X, Wang Z. Predictive value of preoperative sarcopenia in patients with gastric cancer: a meta-analysis and systematic review. J Gastrointestinal Surg (2018) 22:1890–902. doi: 10.1007/s11605-018-3856-0
24. Xiao J, Mazurak VC, Olobatuyi TA, Caan BJ, Prado CM. Visceral adiposity and cancer survival: a review of imaging studies. Eur J Cancer Care (Engl) (2018) 27:1–9. doi: 10.1111/ecc.12611
25. Xiao X, Wang Y, Gao Y, Xie Q, Zhou X, Lin L, et al. Abdominal visceral adipose tissue is associated with unsuspected pulmonary embolism on routine CT scans in patients with gastrointestinal cancer. Br J Radiol (2019) 92:11–3. doi: 10.1259/bjr.20190526
26. Mongan AM, Lynam-Lennon N, Doyle SL, Casey R, Carr E, Cannon A, et al. Visceral adipose tissue modulates radiosensitivity in oesophageal adenocarcinoma. Int J Med Sci (2019) 16:519–28. doi: 10.7150/ijms.29296
27. Celik E, Kizildag Yirgin I, Goksever Celik H, Engin G, Sozen H, Ak N, et al. Does visceral adiposity have an effect on the survival outcomes of the patients with endometrial cancer? J Obstetrics Gynaecology Res (2021) 47:560–9. doi: 10.1111/jog.14560
28. Greco F, Mallio CA, Grippo R, Messina L, Vallese S, Rabitti C, et al. Increased visceral adipose tissue in male patients with non-clear cell renal cell carcinoma. Radiologia Med (2020) 125:538–43. doi: 10.1007/s11547-020-01146-6
29. Wong A, Zhu D, Kraus D, Tham T. Radiologically defined sarcopenia affects survival in head and neck cancer: A meta-analysis. Laryngoscope (2021) 131:333–41. doi: 10.1002/lary.28616
30. Lee JW, Ban MJ, Park JH, Lee SM. Visceral adipose tissue volume and CT-attenuation as prognostic factors in patients with head and neck cancer. Head Neck (2019) 41:1605–14. doi: 10.1002/hed.25605
31. Zopfs D, Theurich S, Große Hokamp N, Knuever J, Gerecht L, Borggrefe J, et al. Single-slice CT measurements allow for accurate assessment of sarcopenia and body composition. Eur Radiol (2020) 30:1701–8. doi: 10.1007/s00330-019-06526-9
32. Koitka S, Kroll L, Malamutmann E, Oezcelik A, Nensa F. Fully automated body composition analysis in routine CT imaging using 3D semantic segmentation convolutional neural networks. Eur Radiol (2021) 31:1795–804. doi: 10.1007/s00330-020-07147-3
33. Findlay M, White K, Stapleton N, Bauer J. Is sarcopenia a predictor of prognosis for patients undergoing radiotherapy for head and neck cancer? A meta-analysis. Clin Nutr (2021) 40:1711–8. doi: 10.1016/j.clnu.2020.09.017
34. Chargi N, Bril SI, Swartz JE, Wegner I, Willems SW, de Bree R. Skeletal muscle mass is an imaging biomarker for decreased survival in patients with oropharyngeal squamous cell carcinoma. Oral Oncol (2020) 101:104519. doi: 10.1016/j.oraloncology.2019.104519
35. Chargi N, Wegner I, Markazi N, Smid E, de Jong P, Devriese L, et al. Patterns, predictors, and prognostic value of skeletal muscle mass loss in patients with locally advanced head and neck cancer undergoing cisplatin-based chemoradiotherapy. J Clin Med (2021) 10:1762. doi: 10.3390/jcm10081762
36. Choi Y, Ahn KJ, Jang J, Shin NY, Jung SL, Kim B, et al. Prognostic value of computed tomography-based volumetric body composition analysis in patients with head and neck cancer: Feasibility study. Head Neck (2020) 42:2614–25. doi: 10.1002/hed.26310
37. Heydarheydari S, Tahmasebi Birgani MJ, Rezaeijo SM. Auto-segmentation of head and neck tumors in positron emission tomography images using non-local means and morphological frameworks. Pol J Radiol (2023) 88:e364–9. doi: 10.5114/PJR.2023.130815
38. Rezaeijo SM, Nesheli SJ, Serj MF, Birgani MJT. Segmentation of the prostate, its zones, anterior fibromuscular stroma, and urethra on the MRIs and multimodality image fusion using U-Net model. Quant Imaging Med Surg (2022) 12:4786–804. doi: 10.21037/QIMS-22-115/COIF
39. van Timmeren JE, Cester D, Tanadini-Lang S, Alkadhi H, Baessler B. Radiomics in medical imaging—”how-to” guide and critical reflection. Insights Imaging (2020) 11:1–16. doi: 10.1186/s13244-020-00887-2
40. Hosseinzadeh M, Gorji A, Fathi Jouzdani A, Rezaeijo SM, Rahmim A, Salmanpour MR. Prediction of cognitive decline in parkinson’s disease using clinical and DAT SPECT imaging features, and hybrid machine learning systems. Diagnostics (2023) 13:1691. doi: 10.3390/DIAGNOSTICS13101691/S1
41. Salmanpour MR, Hosseinzadeh M, Rezaeijo SM, Rahmim A. Fusion-based tensor radiomics using reproducible features: Application to survival prediction in head and neck cancer. Comput Methods Programs BioMed (2023) 240:107714. doi: 10.1016/J.CMPB.2023.107714
42. Iwashita K, Kubota H, Nishioka R, Emoto Y, Kawahara D, Ishihara T, et al. Prognostic value of radiomics analysis of skeletal muscle after radical irradiation of esophageal cancer. Anticancer Res (2023) 43:1749–60. doi: 10.21873/ANTICANRES.16328
43. Iyer K, Beeche CA, Gezer NS, Leader JK, Ren S, Dhupar R, et al. CT-derived body composition is a predictor of survival after esophagectomy. J Clin Med (2023) 12:2106. doi: 10.3390/JCM12062106
44. Saalfeld S, Kreher R, Hille G, Niemann U, Hinnerichs M, Öcal O, et al. Prognostic role of radiomics-based body composition analysis for the 1-year survival for hepatocellular carcinoma patients. J Cachexia Sarcopenia Muscle (2023). doi: 10.1002/JCSM.13315
45. Lan Q, Guan X, Lu S, Yuan W, Jiang Z, Lin H, et al. Radiomics in addition to computed tomography-based body composition nomogram may improve the prediction of postoperative complications in gastric cancer patients. Ann Nutr Metab (2022) 78:316–27. doi: 10.1159/000526787
46. van der Kroft G, Wee L, Rensen SS, Brecheisen R, van Dijk DPJ, Eickhoff R, et al. Identifying radiomics signatures in body composition imaging for the prediction of outcome following pancreatic cancer resection. Front Oncol (2023) 13:1062937. doi: 10.3389/FONC.2023.1062937
47. Zhang Y, Tan W, Zheng Z, Wang J, Xing L, Sun X. Body composition and radiomics from 18F-FDG PET/CT together help predict prognosis for patients with stage IV non-small cell lung cancer. J Comput Assist Tomogr (2023). doi: 10.1097/RCT.0000000000001496
48. Schroeder C, Lee JH, Tetzner U, Seidel S, Kim SY. Comparison of diffusion-weighted MR imaging and 18F Fluorodeoxyglucose PET/CT in detection of residual or recurrent tumors and delineation of their local spread after (chemo) radiotherapy for head and neck squamous cell carcinoma. Eur J Radiol (2020) 130:109157. doi: 10.1016/j.ejrad.2020.109157
Keywords: body composition, artificial intelligence, head and neck cancer, overall survival, squamous cell carcinoma
Citation: Rozynek M, Gut D, Kucybała I, Strzałkowska-Kominiak E, Tabor Z, Urbanik A, Kłęk S and Wojciechowski W (2023) Fully automated 3D body composition analysis and its association with overall survival in head and neck squamous cell carcinoma patients. Front. Oncol. 13:1176425. doi: 10.3389/fonc.2023.1176425
Received: 28 February 2023; Accepted: 03 October 2023;
Published: 19 October 2023.
Edited by:
Abhishek Mahajan, The Clatterbridge Cancer Centre, United KingdomReviewed by:
Renjie He, University of Texas MD Anderson Cancer Center, United StatesSeyed Masoud Rezaeijo, Ahvaz Jundishapur University of Medical Sciences, Iran
Copyright © 2023 Rozynek, Gut, Kucybała, Strzałkowska-Kominiak, Tabor, Urbanik, Kłęk and Wojciechowski. This is an open-access article distributed under the terms of the Creative Commons Attribution License (CC BY). The use, distribution or reproduction in other forums is permitted, provided the original author(s) and the copyright owner(s) are credited and that the original publication in this journal is cited, in accordance with accepted academic practice. No use, distribution or reproduction is permitted which does not comply with these terms.
*Correspondence: Wadim Wojciechowski, d2FkaW0ud29qY2llY2hvd3NraUB1ai5lZHUucGw=