 Yan Zuo
 Qiufang Liu
 Nan Li
 Panli Li1
 Shaoli Song
- 1Department of Nuclear Medicine, Fudan University Shanghai Cancer Center, Shanghai, China
- 2Shanghai Key Laboratory of Bioactive Small Molecules, Fudan University, Shanghai, China
Purpose: To develop and interpret optimal predictive models to identify epidermal growth factor receptor (EGFR) mutation status and subtypes in patients with lung adenocarcinoma based on multicentric 18F-FDG PET/CT data, and further construct a prognostic model to predict their clinical outcome.
Methods: The 18F-FDG PET/CT imaging and clinical characters of 767 patients with lung adenocarcinoma from 4 cohorts were collected. Seventy-six radiomics candidates using cross-combination method to identity EGFR mutation status and subtypes were built. Further, Shapley additive explanations and local interpretable model-agnostic explanations were used for optimal models’ interpretation. Moreover, in order to predict the overall survival, a multivariate Cox proportional hazard model based on handcrafted radiomics features and clinical characteristics was constructed. The predictive performance and clinical net benefit of the models were evaluated via area under receiver operating characteristic (AUC), C-index and decision curve analysis.
Results: Among the 76 radiomics candidates, light gradient boosting machine classifier (LGBM) combined with recursive feature elimination wrapped LGBM feature selection method achieved best performance in predicting EGFR mutation status (AUC reached 0.80, 0.61, 0.71 in the internal test cohort and two external test cohorts, respectively). And extreme gradient boosting classifier combined with support vector machine feature selection method achieved best performance in predicting EGFR subtypes (AUC reached 0.76, 0.63, 0.61 in the internal test cohort and two external test cohorts, respectively). The C-index of the Cox proportional hazard model achieved 0.863.
Conclusions: The integration of cross-combination method and the external validation from multi-center data achieved a good prediction and generalization performance in predicting EGFR mutation status and its subtypes. The combination of handcrafted radiomics features and clinical factors achieved good performance in predicting prognosis. With the urgent needs of multicentric 18F-FDG PET/CT trails, robust and explainable radiomics models have great potential in decision making and prognosis prediction of lung adenocarcinoma.
Introduction
Lung adenocarcinoma is the main histological subtype of non-small cell lung cancer (1). EGFR is one of the most common tumor driver gene of lung adenocarcinoma. EGFR tyrosine kinase inhibitors (TKIs) are the main target drugs for the treatment of patients with EGFR mutations, which could improve their live condition and prolong their median survival (2, 3). Exon 19 deletion (E19) and exon 21 L858R missense (E21) are the two most common EGFR-TKIs-sensitive EGFR mutation subtypes. There is a difference in treatment strategy, response and prognosis between patients with EGFR E19 and E21 (4, 5). Therefore, identifying EGFR mutation status and subtypes are important for the treatment of patients with lung adenocarcinoma. Tissue sequence testing with biopsied or surgical tissues is the gold standard for EGFR gene mutation examination. However, many patients cannot undergo these invasive examinations due to some subjective psychological or objective physiological reasons. Furthermore, the biopsied or surgical section tissue cannot fully reflect the spatial heterogeneity and temporal heterogeneity of the tumor. Liquid biopsy is non-invasive and convenient but its stability and false-negative rate are not satisfying (6). Therefore, there is an urgent need for a non-invasive and accurate method to determine EGFR mutation status and subtypes, so as to facilitate accurate screening of patients suitable for EGFR TKIs targeted therapy and make better treatment decisions in clinical practice.
18Fluorine-fluorodeoxyglucose positron emission tomography-computed tomography (18F-FDG PET/CT) can simultaneously acquire anatomical structure and metabolic information of the tumor. There is a correlation between metabolic phenotype and gene mutations (7). It is well established that there is increased uptake of 18F-FDG in EGFR-mutated lung tumors (8–11). Therefore, 18F-FDG PET/CT-based method is promising to predict EGFR mutation status. Also, our previous study (12) has shown that machine learning model based on PET/CT handcrafted radiomics features (HRFs) achieved a good prediction performance in the identification of EGFR mutation status and subtypes in lung adenocarcinoma. Recently, the value of PET/CT-based HRFs in predicting EGFR mutation status, EGFR subtypes and prognosis had been well demonstrated (12–18), which involved different feature selection methods and machine learning algorithms. These different radiomics pipelines may lead to various predictive performance (19). Feature selection methods also have a great influence on clinical predictive models (20). However, it’s difficult to compare their performance and there is hardly no model that works well for multi-center data. To address this limitation, cross-combination of feature selection methods and classifiers based on 18F-FDG PET/CT HRFs have recently appeared and have proven effective in improving classification and diagnostic performance (21, 22). However, as far as we know, whether this method can be applied to predict EGFR mutation status and prognosis based on multi-center 18F-FDG PET/CT in lung adenocarcinoma is not fully investigated.
Furthermore, the widespread clinical application of prediction models based on machine learning is hindered because of unsatisfactory clinical trustworthiness, regardless of their huge potential for precision medicine. Interpretability is essential and extremely important to effectively understand, manage, and trust powerful artificial intelligence applications. Hence, explainable artificial intelligence (XAI) emerged and performed well in the models’ interpretation and transparency of the “black-box” problem (23). As two novel approaches of XAI, Shapley additive explanations (SHAP) and local interpretable model-agnostic explanations (LIME) have been successfully applied to medical field (24–27). However, hardly no EGFR-related predictive models involved model visualization and interpretation. Furthermore, the existing research results based on single center or small samples may have limited generalization performance, due to the differences in demographic distribution, medical imaging equipment and related imaging protocols in separate studies. Herein, we aimed to develop and interpret robust optimal predictive models to identify EGFR mutation status and subtypes based on multi-center 18F-FDG PET/CT data, and further construct a prognostic model to predict clinical outcome in patients with lung adenocarcinoma.
Materials and methods
Data collection
We retrospectively reviewed 92 cases of Shanghai Chest Hospital (SCH) and 88 cases from Renji Hospital Shanghai Jiao Tong University School of Medicine (RJ) between August 2016 and July 2017, and 452 cases from Fudan University Shanghai Cancer Center (FUSCC) between January 2016 and December 2019, who were pathologically diagnosed with lung adenocarcinoma and their EGFR mutation status and subtypes were determined. Moreover, 135 cases were enrolled from the public data set (https://wiki.cancerimagingarchive.net/display/Public/NSCLC+Radiogenomics). The patients’ inclusion and exclusion criteria were summarized in Figure 1 and Supplementary Material (Appendix E1). The demographic and clinical variables of the enrolled patients were detailed in Tables 1, 2. The institutional review board of FUSCC approved this retrospective study and the acquirement of informed consent was waived.
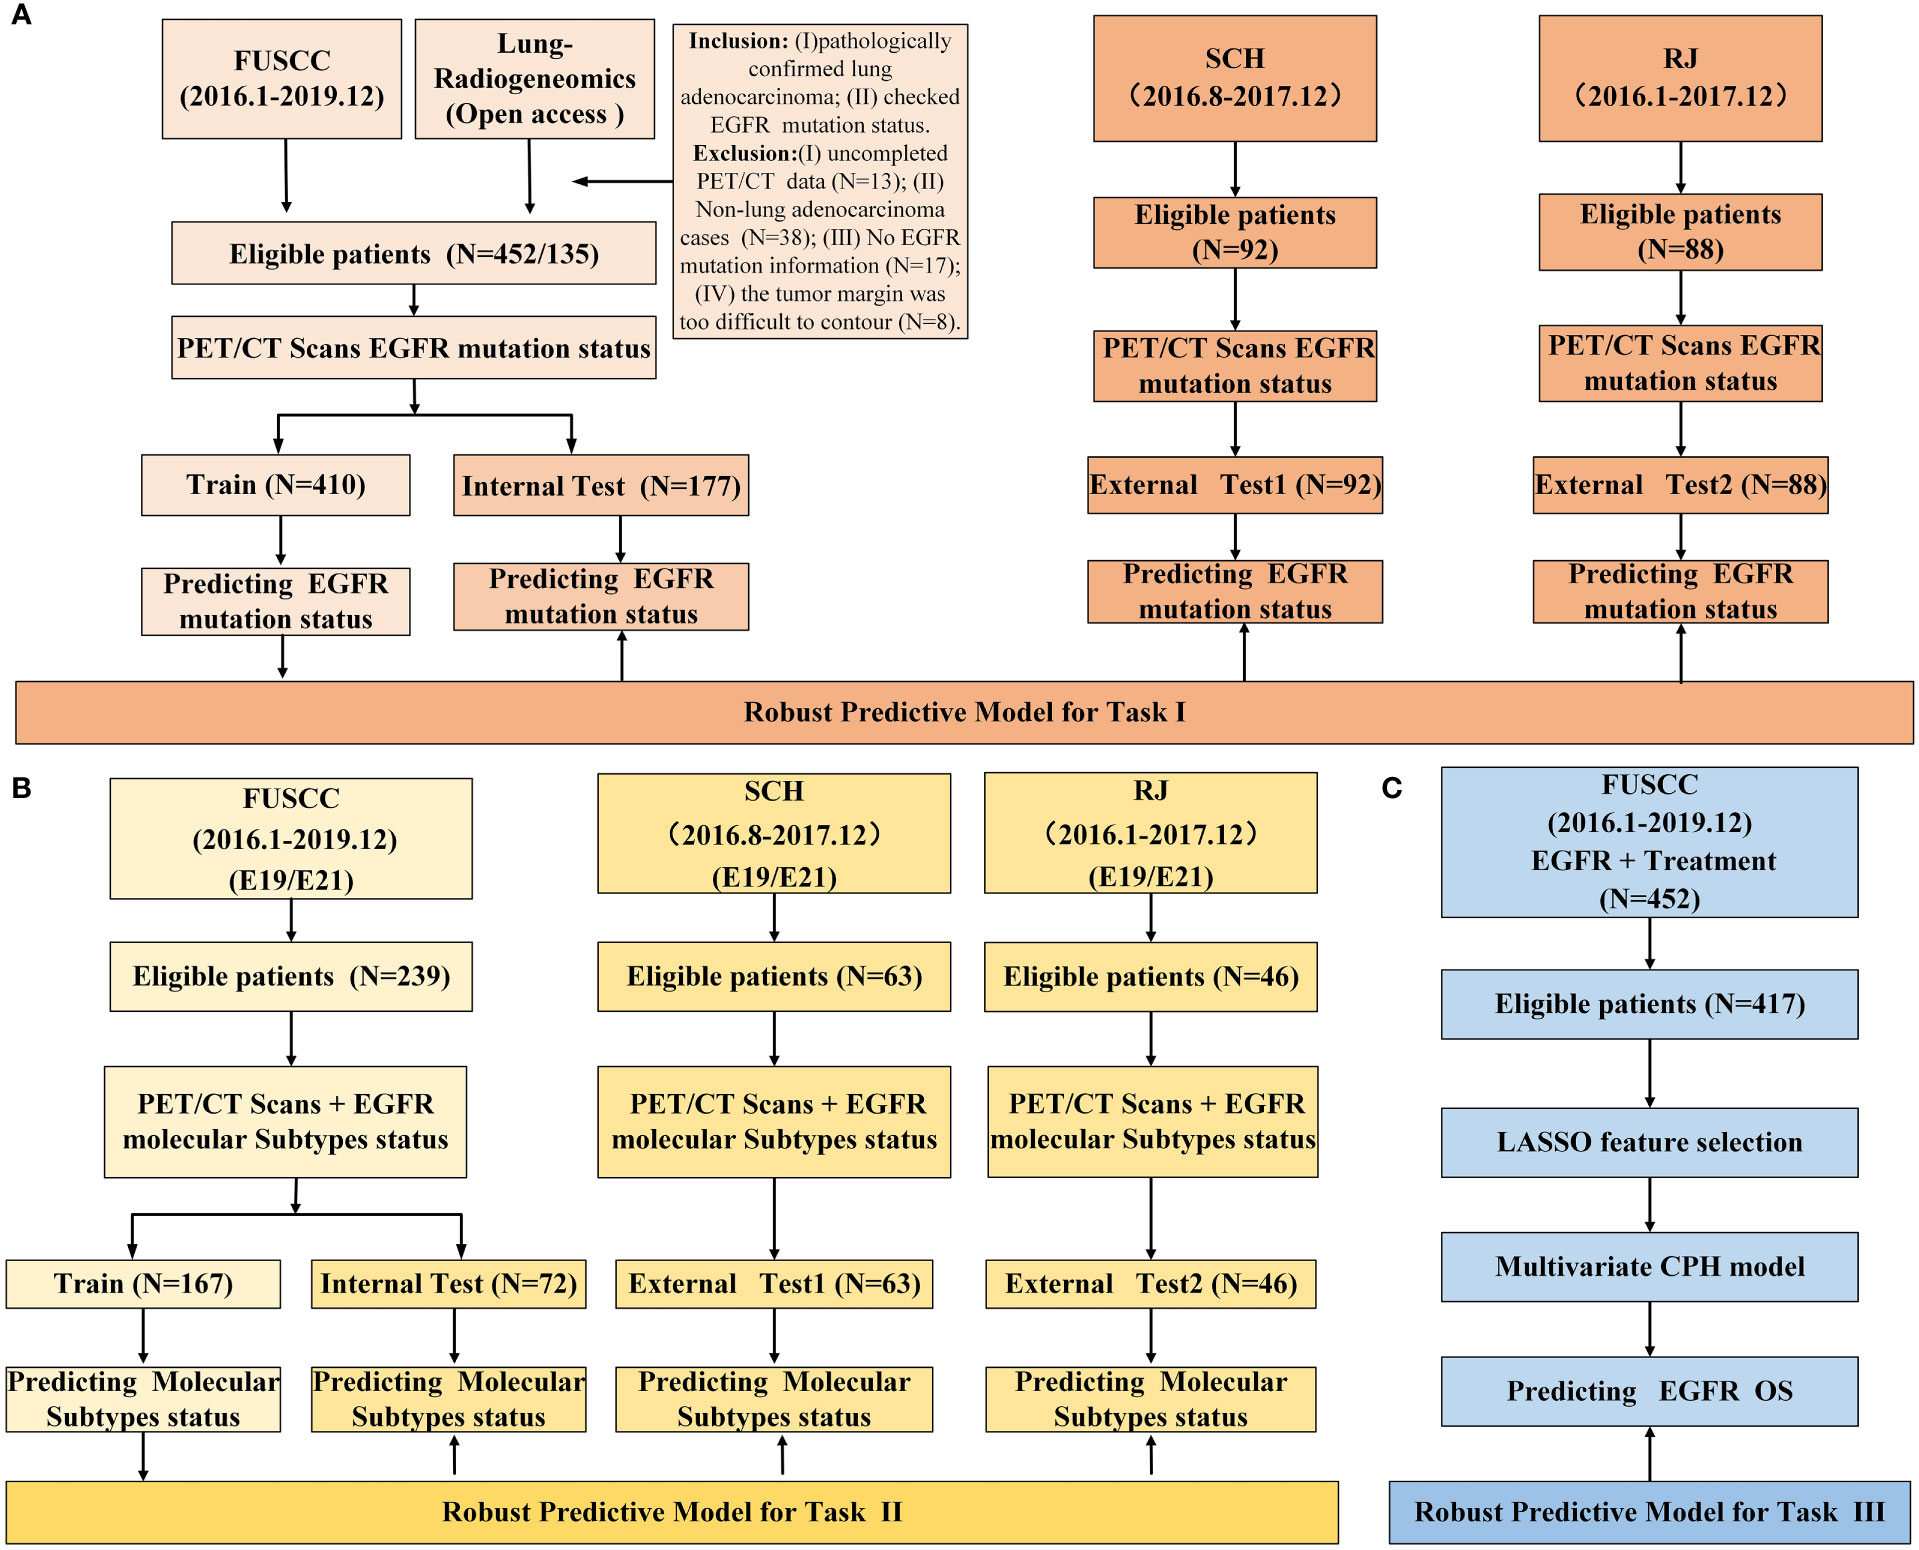
Figure 1 Study design and data information. (A) study design of predicting EGFR mutation status; (B) study design of predicting EGFR mutation subtypes; (C) study design of survival analysis.
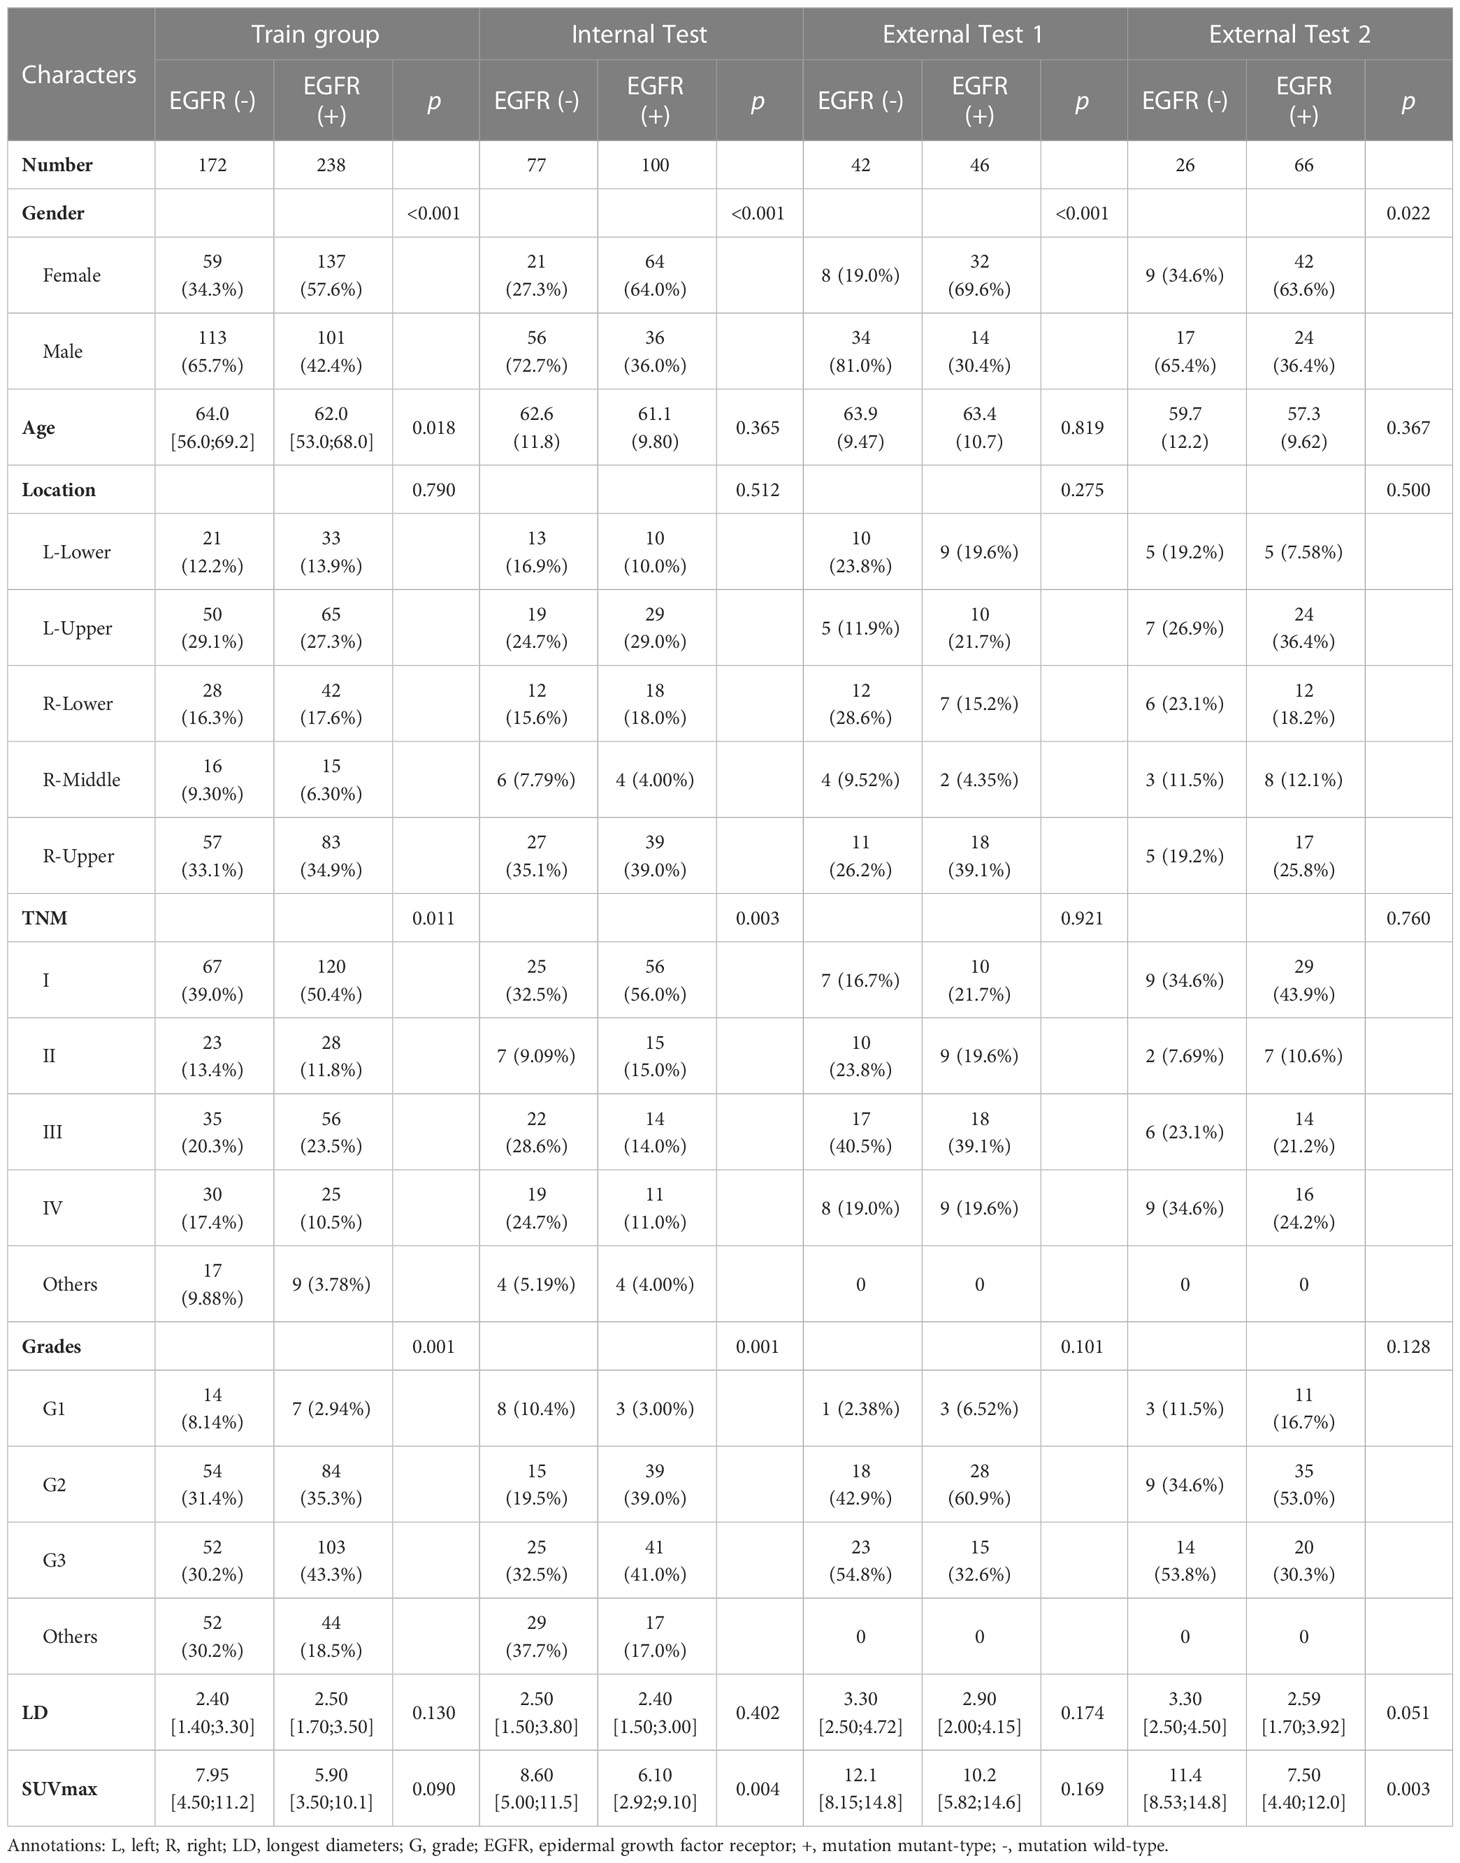
Table 1 Demographics and clinical variables of enrolled patients in task I (N = 767).

Table 2 Demographics and clinical variables of enrolled patients in task II (N = 348).
EGFR mutation status detection
In this study, EGFR mutation status of 3 hospitals obtained by next-generation sequencing test (Illumina high-throughput sequencing, 68-gene panel detection general kit of Burning Rock Medical laboratory, Guangzhou) or an amplification refractory mutation system real-time technology with ARMS (AmoyDx EGFR Mutations Detection Kit). And the EGFR mutation status were retrospectively collected from the medical record system of the hospitals.
Image acquisition and preprocessing
Herein, scanners of three hospitals all belong to Siemens Medical Systems, Erlangen, Germany, that are Biograph mCT, Biogragh 16HR and Biogragh mCT-s. The details of the scanner information and imaging protocols were listed in Supplementary material (Table S1 and Appendix E2). The PET image datasets were reconstructed using CT data for attenuation correction. Then, PET and CT images were preprocessed according to guidelines (28), including resampling all images to a voxel size of 1×1×1mm3 using B-spline interpolation, and both PET and CT images were subjected to intensity discretization.
Tumor segmentation and HRFs extraction
ITK-SNAP version 3.8.0-beta (https://www.itksnap.org/), an open-source image analytic platform, was used to segment the primary tumor regions. Volumes of interest (VOIs) of primary tumors for CT were drawn on the lung window (window width: 1600HU; window level: -600HU). The robustness and repeatability of HRFs were evaluated. Both PET and CT HRFs of the VOIs were automatically calculated using Python 3.7 and the Pyradiomics package. The formulas and matrices for texture feature calculation followed the image biomarker standardization initiative (29). Further, 2,380 HRFs were extracted from the PET and CT images, respectively. The detailed tumor segmentation and HRFs extraction were available in Supplementary Material (Appendix E3, Table S2 and Table S3).
Feature selection
HRFs selection and predictive models’ development were separately performed on train groups of task I (EGFR mutated type vs. EGFR wild type) and task II (EGFR E19 vs. EGFR E21). In our work, to reduce the feature variability caused by different PET/CT scanners and associated protocols, all HRFs were normalized using z scores and harmonized using ComBat (30, 31). The Combat function of non-parametric version from R package (R statistical software version 4.1.2) were used. Both 2 tasks would do a feature cleaning preprocess to remove constant or quasi-constant features, and duplicated features. Firstly, the missing value was filled with conditional mean completer. Then, removed features with a single unique value and low variance, and further removed collinear features as identified by a correlation coefficient greater than 0.75. Finally, mutual information was used to further removed redundant features.
As for task I and task II, 19 feature selection methods, which belong to wrapper and embedded categories, were used for feature selection. Sequential forward selection (SFS), sequential backward selection (SBS) and recursive feature elimination (RFE) wrapped 4 classifiers, respectively, that were light gradient boosting machine (LGBM), extreme gradient boosting (XGB), random forest (RF) and logistic regression (LR), and then 12 wrapper feature selection candidates were obtained. Seven embedded feature selection methods were enrolled, including LGBM, XGB, RF, LR, K-nearest Neighbor (KNN), support vector machine (SVM) and least absolute shrinkage and selection operator (LASSO). In our study, embedded feature selection methods ranked features by calculating the AUC based on the individual feature.
As for task III, LASSO Cox regression model was used to select the most useful prognostic HRFs in the entire dataset. Univariate and multivariate analyses with CPH regression determined the clinical risk factors of overall survival (OS).
Development and evaluation of predictive models
LGBM, XGB, RF and LR were used to develop predictive models. We used a grid search technique with 10-fold cross-validation to determine the optimal parameter values of various kernel function. In task І, the model was trained on a train group (n=410) and tested in an internal test group (n=177). And in task II, E19 and E21 mutation subtypes from EGFR mutated group were considered as negative and positive labels, respectively. The E19/E21 mutation subtypes prediction model was trained on a train group (n=167) and tested in an internal test group (n=72). In both task І and II, data from SCH and RJ were separately used for external test. The study design and workflow were detailed in Figures 1, 2, respectively.
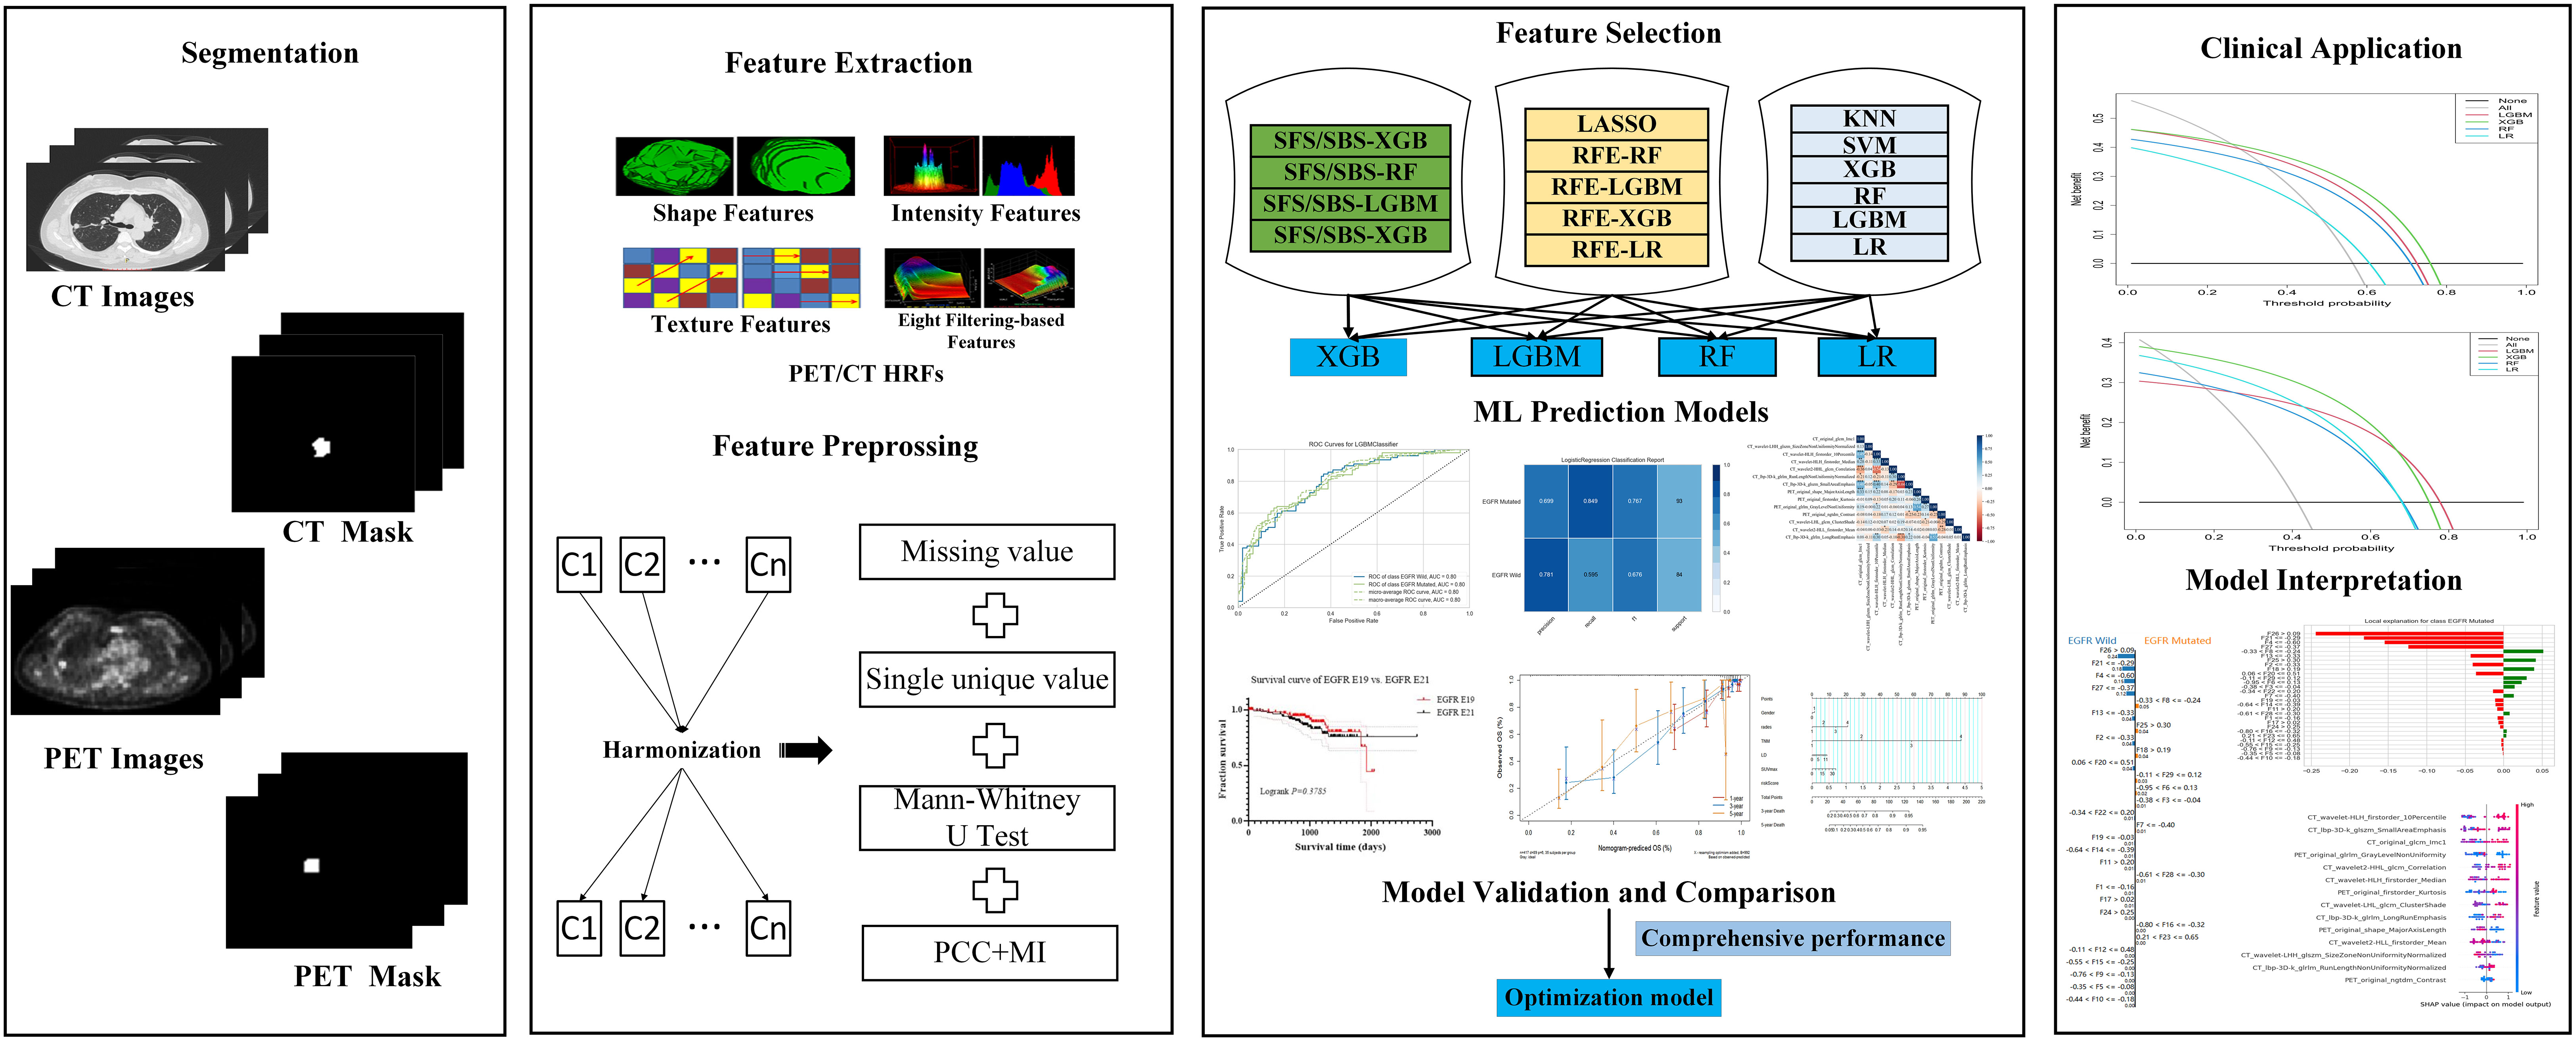
Figure 2 Workflow.
Confusion matrix, classification report, feature importance and ROC curve, which programmed and calculated with the Python Scikit-learn and Yellowbrick package (Python version 3.7, Yellowbrick version 1.5, https://www.scikit-yb.org/, Scikit-learn version 1.0.2, http://scikit-learn.org/), as well as the area under the curve (AUC), precision, recall, F1-score, and accuracy (ACC), were used to evaluate the performance of the model. Decision curve analysis (DCA) was used to evaluate the clinical applicability of the predictive models. Optimal models for task І and task II were determined from 76 predictive models, according to the comprehensive AUC performance of one internal test and two external test groups, respectively.
As for task III, a radiomics score (PET/CT-RadScore) was calculated for each patient through a linear combination of the selected features weighted according to their respective coefficient. The clinical risk factors combined with PET/CT-RadScore were then used to build nomogram model. The Harrell’s concordance index (C-index) was calculated to evaluate the performance of nomogram model. Calibration curve was used to evaluate the goodness-of-fit of the nomogram model. The prognosis of EGFR-TKIs targeted therapy and chemotherapy in lung adenocarcinoma patients with different EGFR mutation status and subtypes was compared.
Radiomics quality score (RQS) and the transparent reporting of a multivariable prediction model for individual prognosis or diagnosis (TRIPOD) systems were used to evaluate the quality of this radiomics research.
Interpretation of optimal predictive models
In order to improve the interpretability of the models, feature importance, and SHAP and LIME were used for optimal models’ global and local interpretation in task І and II. The detailed description of them could be found at Supplementary Material (Appendix E4).
Statistical analysis
Statistical analyses were performed using the GraphPad Prism version 6. The Shapiro-Wilks test was used to determine whether clinical data fit a normal distribution. The difference and statistical analysis in the related clinical information in the training and test cohorts were assessed using descrTable function of compareGroups R package. Discrete variables were expressed as medians and ranges. The Kaplan-Meier method was used and compared by a two-sided log-rank tests. p < 0.05 was considered statistically significant.
Results
Demographic and clinical information
We enrolled 767 patients from 4 cohorts who were pathologically diagnosed with lung adenocarcinoma and EGFR mutation status. In train group of task I, there is a significant difference in gender, age, TNM staging, and grades between EGFR mutant and EGFR wild groups (p < 0.001, 0.018, 0.011, 0.001, respectively), and in train group of task II, there is a significant difference in primary tumor location (p = 0.007) and TNM staging (p = 0.030). Gender, TNM staging, grades, primary tumor’s longest diameter (LD) and SUVmax were treated as clinical risk factors in task III. The clinical information of the enrolled patients was detailed in Table 1 and Table 2.
Feature reduction and selection
The intra –and interclass correlation coefficients values of the HRFs extracted from the different radiologists and the different scanners were all greater than 0.75, reflecting good consistency. After feature preprocessing pipeline, 213 features (111 CT HRFs and 102 PET HRFs) remained in task I. As for task II, 288 features (142 CT HRFs and 146 PET HRFs) remained. In both task I and II, CT features from wavelet, local binary pattern (LBP) 3D and Laplacian of Gaussian (LoG) filters accounted for the largest proportion, and PET features from wavelet, LBP 3D and exponential filters accounted for the largest proportion. The correlation of enrolled PET/CT HRFs of optimal model in task I and task II were shown in Figures S2, S4, respectively. Total number and categories of HRFs of 19 feature selection methods in task I and task II were shown in Figure 3. The detailed AUC thresholds of feature selection methods in task I and task II were shown in Table S4.
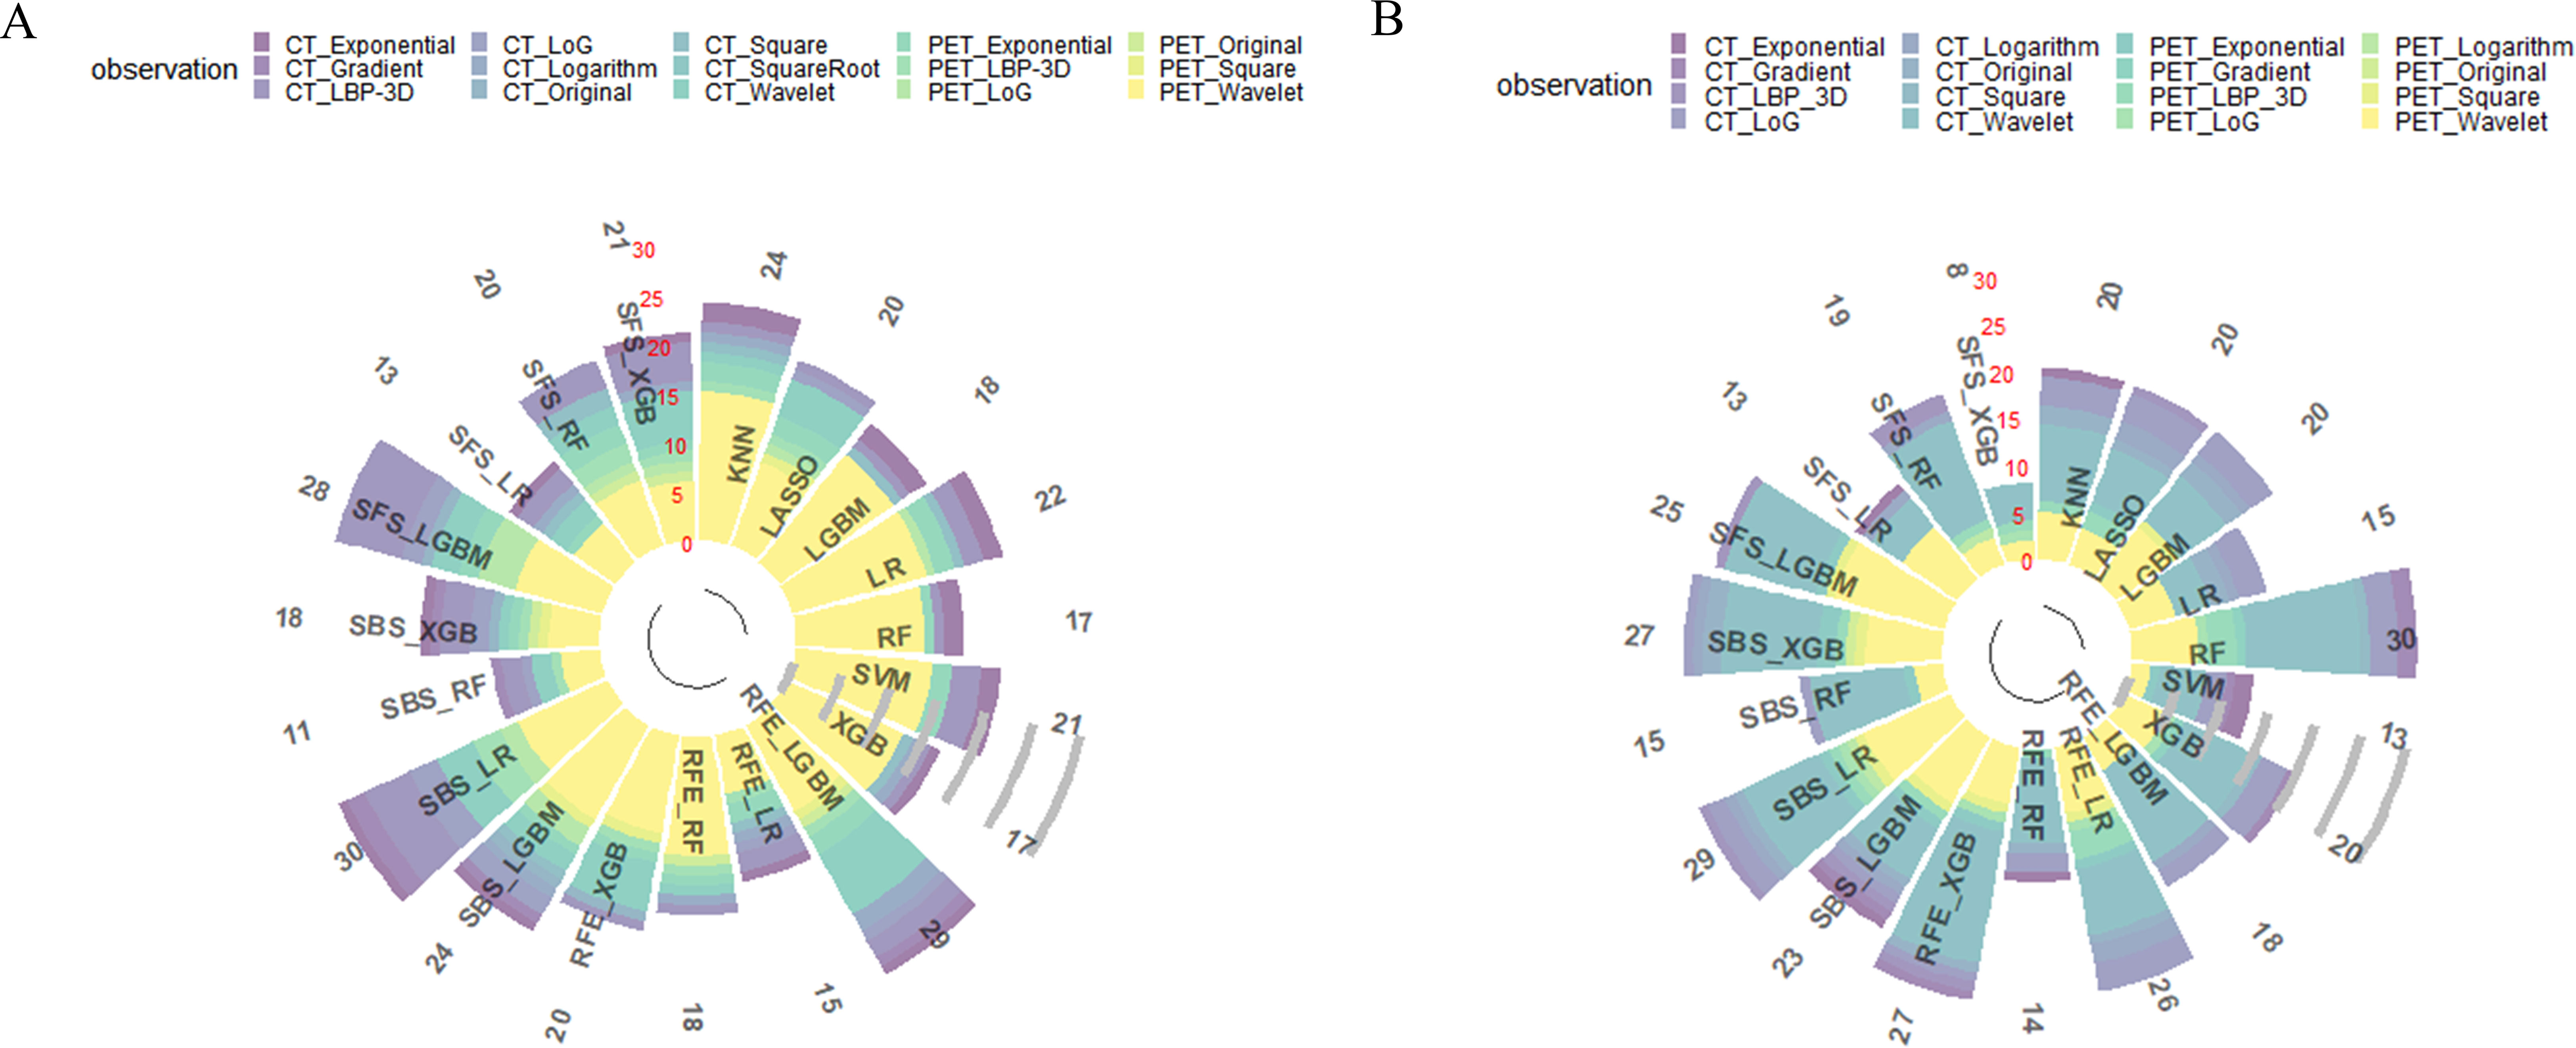
Figure 3 Results of all feature selection methods. (A) feature selection result of predicting EGFR mutation status; (B) feature selection result of predicting EGFR mutation subtypes. LBP, local binary pattern. LoG, Laplacian of Gaussian.
Model development and evaluation
In this study, 76 predictive models were obtained using cross-combination of 19 feature selection methods and 4 classifiers (XGB, LGBM, RF and LR) for prediction. All the models performed binary predictions. The performance of all the predictive models in task I and task II was shown in Figure 4. As for task I, the results indicated that 29 HRFs selected from RFE - LGBM feature selection method and then LGBM classifier used for prediction achieved the best performance (AUC = 0.80, ACC = 0.72, precision = 0.72, recall = 0.71, F1-score = 0.71 in the internal test cohort; AUC = 0.61, ACC = 0.55, precision = 0.59, recall = 0.61, F1-score = 0.55 in the external test cohort 1; AUC = 0.71, ACC = 0.70, precision = 0.70, recall = 0.70, F1-score = 0.70 in the external test cohort 2) among the 76 feature selection-classification radiomics candidates (Figures 4A–C, Figures 5B–D, Figure S1A).The statistical results and correlation heat map of the 29 HRFs for task I could be found at Table S5 and Figure S2.
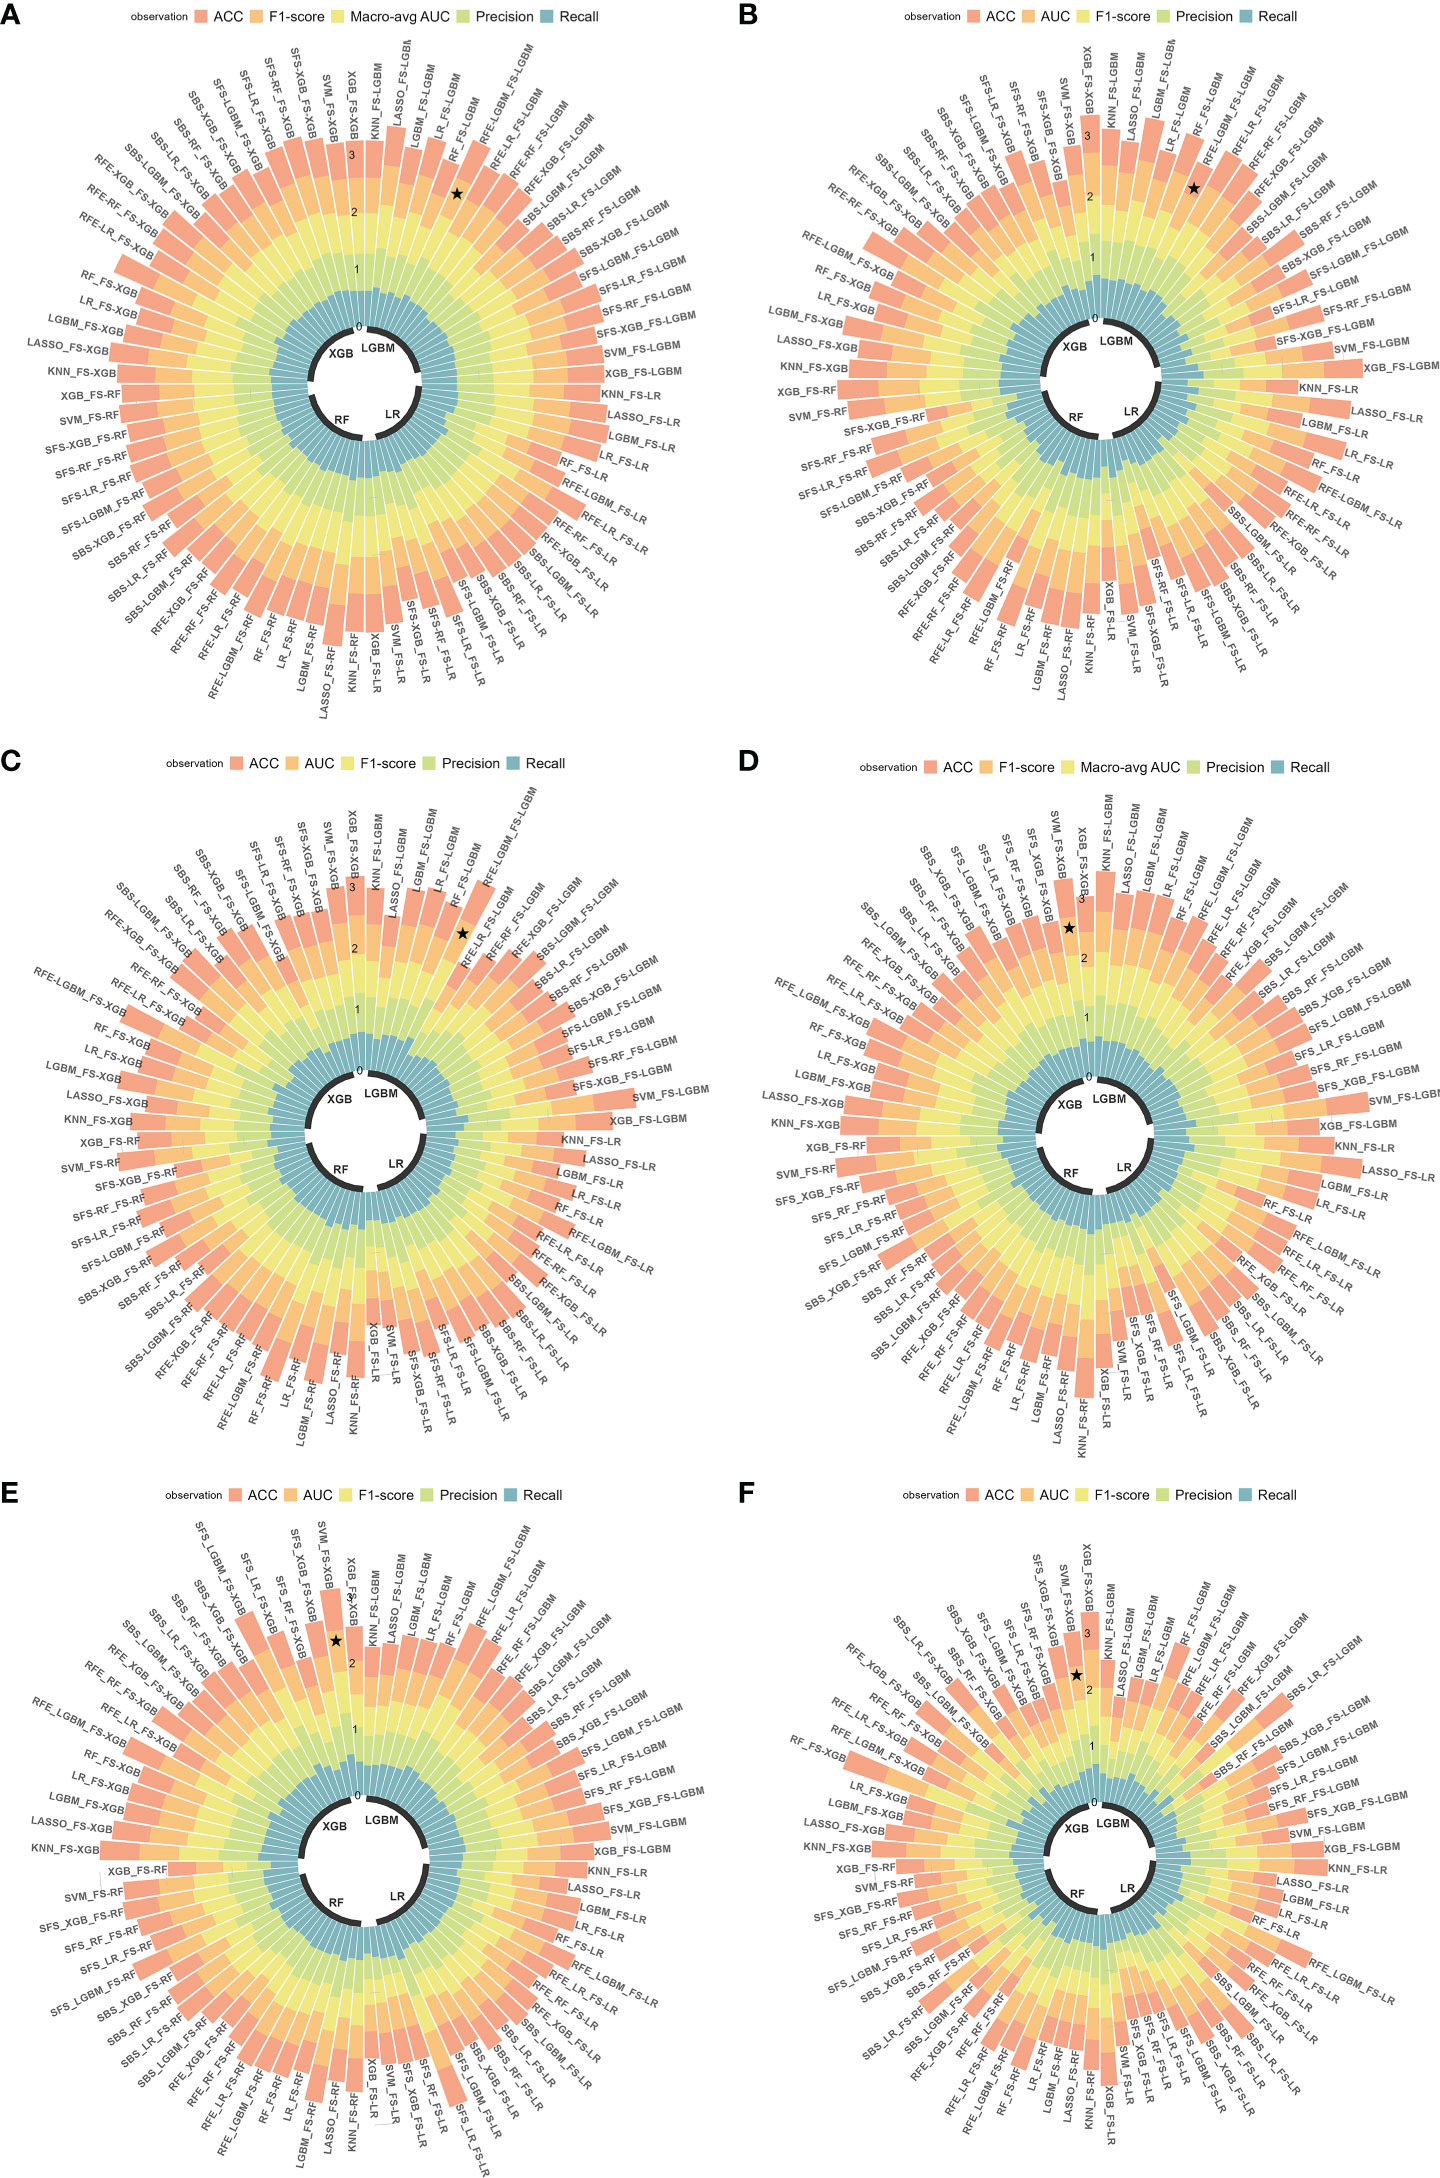
Figure 4 Predictive performance of all radiomics models. (A-C) AUC, ACC, precision, recall and F1-score in the internal test cohort and 2 external test cohorts in predicting EGFR mutation status; (D-F) AUC, ACC, precision, recall and F1-score in the internal test cohort and 2 external test cohorts in predicting EGFR mutation subtypes. ★, the optimal model. Macro-avg, Macro average.
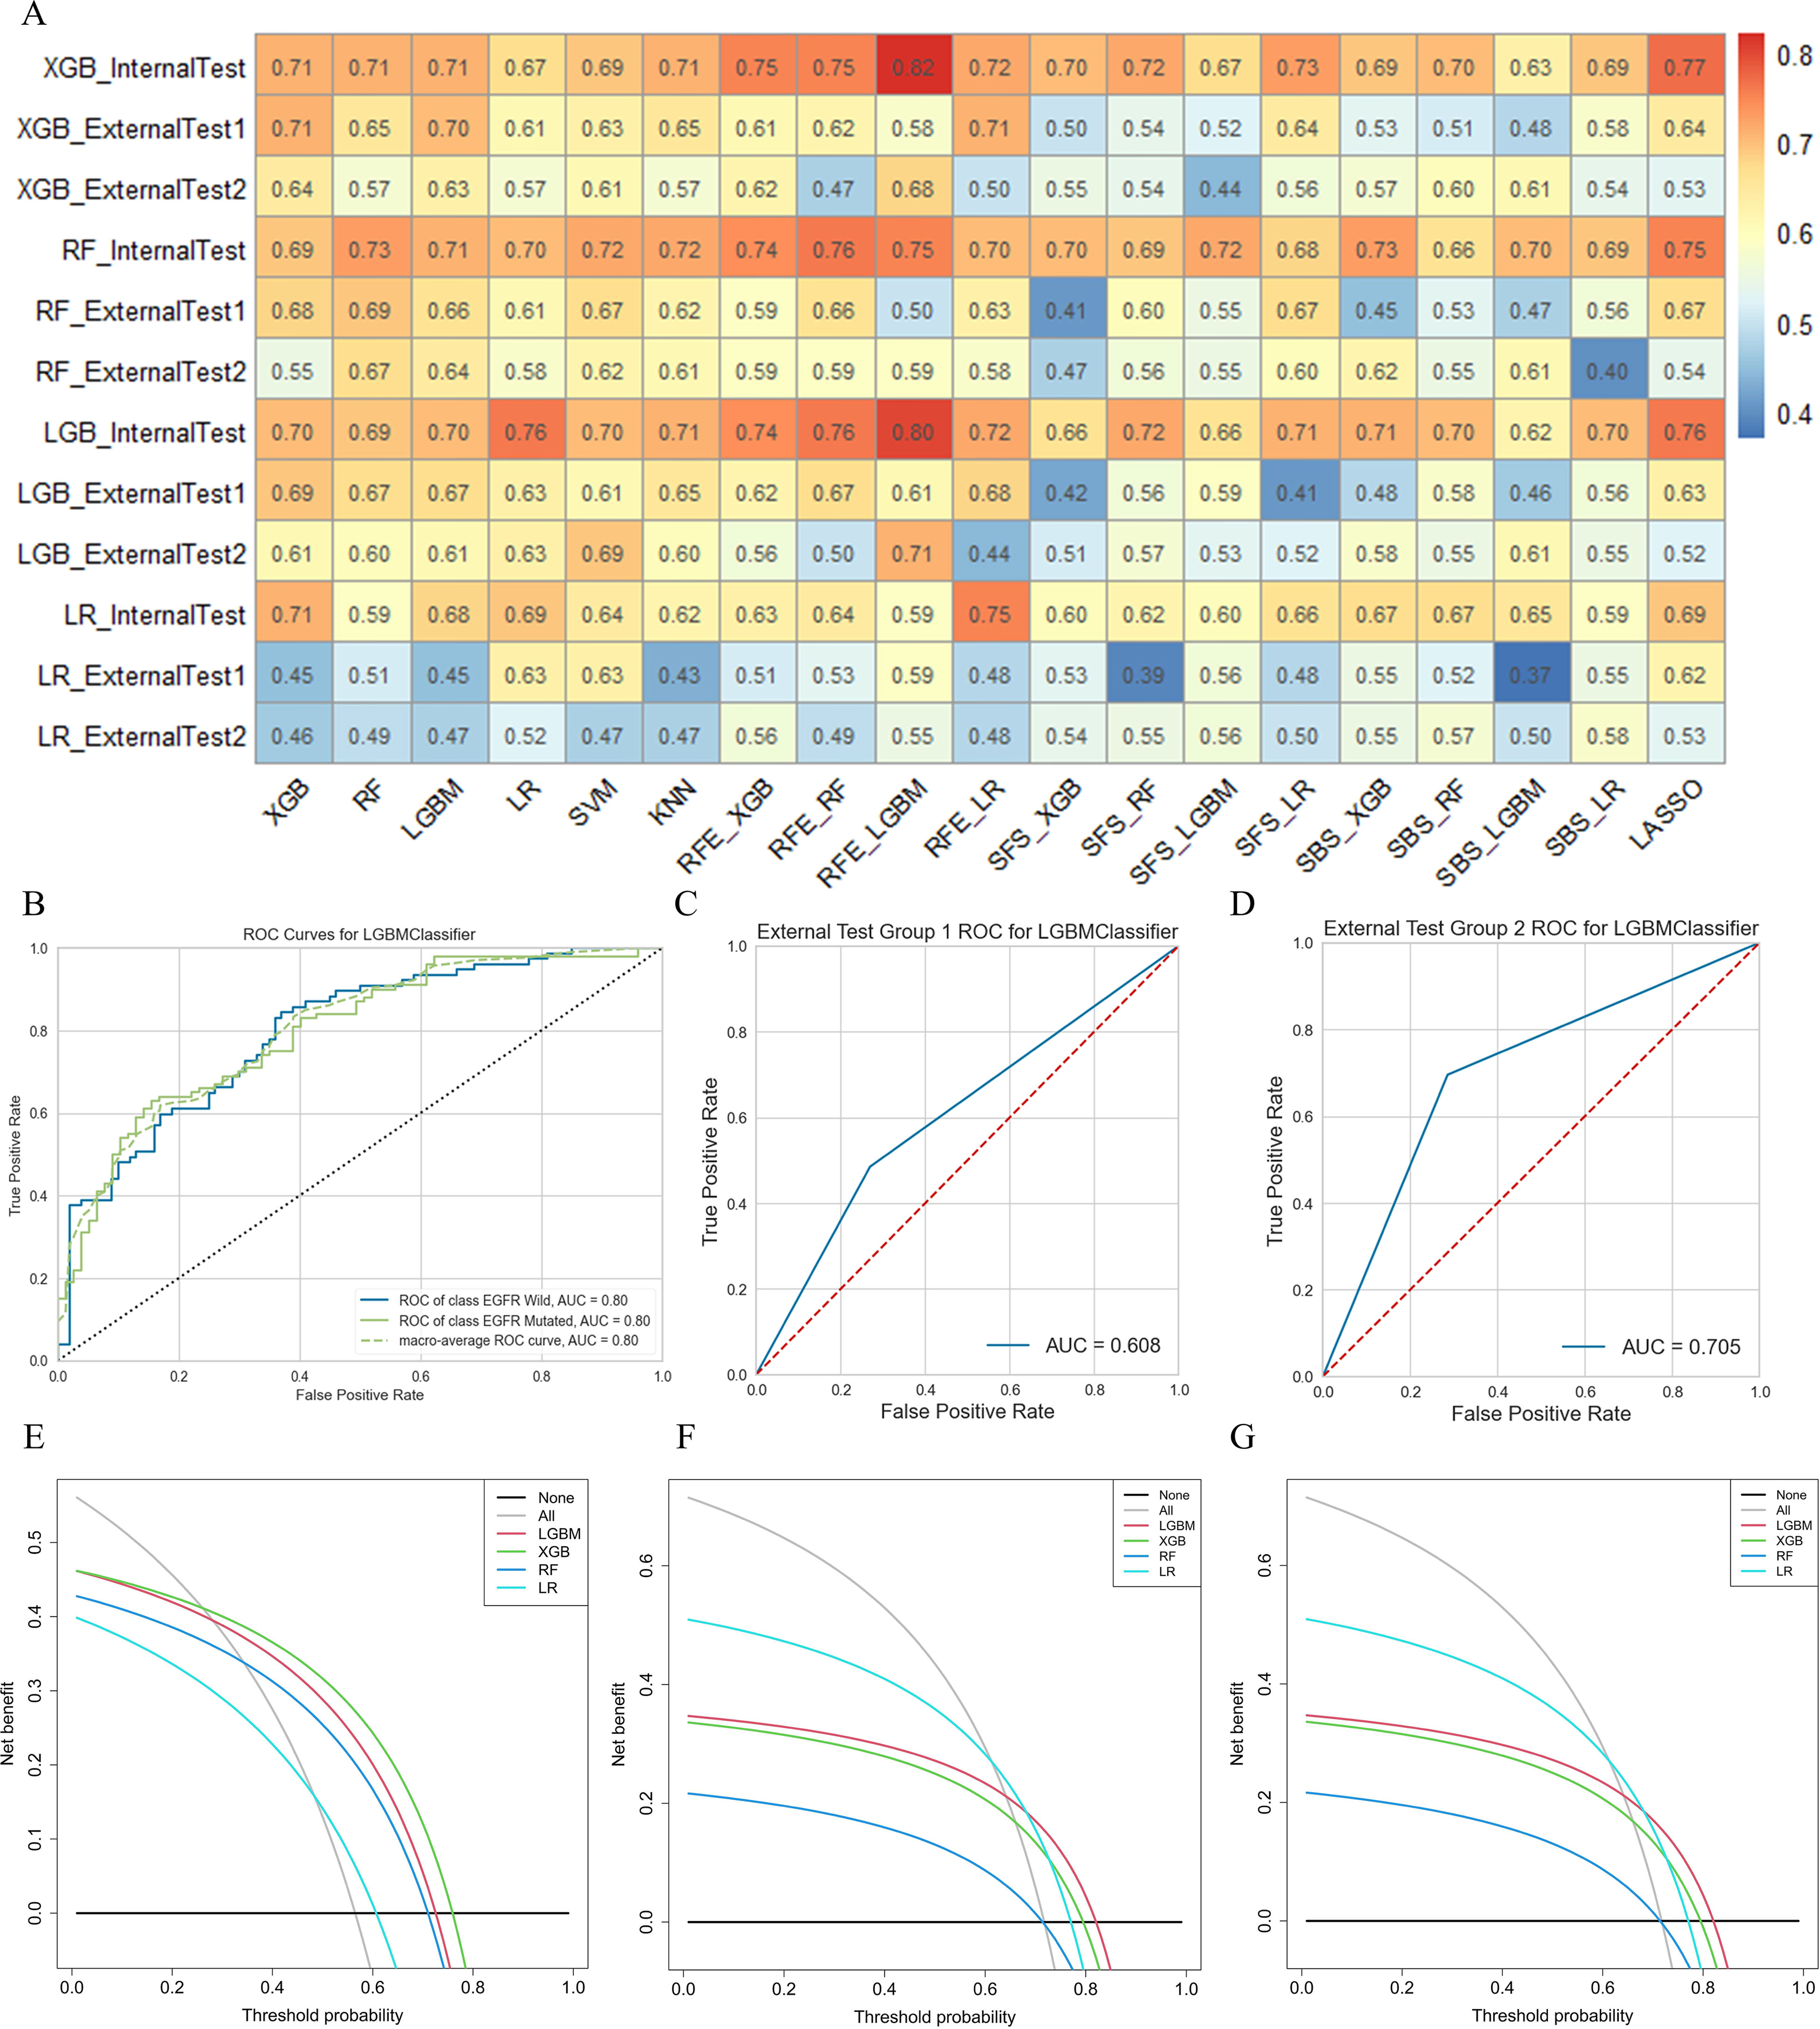
Figure 5 The performance of models in predicting EGFR mutation status. (A) AUC performance of all models based on cross-combination method. (B-D) AUC performance of internal test group, external test group 1 and external test group 2 of optimal predictive model. (E-G) Clinical net benefit of internal test group, external test group 1 and external test group 2 of optimal predictive model.
As for task II, the results indicated that 13 HRFs selected from SVM feature selection method and then XGB classifier used for prediction achieved the best performance (AUC = 0.76, ACC = 0.65, precision = 0.66, recall = 0.65, F1-score = 0.65 in the internal test cohort; AUC = 0.63, ACC = 0.63, precision = 0.64, recall = 0.63, F1-score = 0.63 in the external test cohort 1; AUC = 0.61, ACC = 0.61, precision = 0.61, recall = 0.61, F1-score = 0.61 in the external test cohort 2) among the 76 feature selection-classification radiomics candidates (Figures 4D–F, Figures 6B–D, Figure S3A). Precision, recall, F1-score were in the macro average version. The statistical results and correlation heatmap of the 13 HRFs for task II could be found at Table S6 and Figure S4. Clinical net benefit and confusion matrix of three test groups of optimal predictive model in task I and task II were calculated (Figures 5E–G, Figures S1B-D, Figures 6E–G, Figures S3B-D). DCA curves also showed that two optimal predictive models have a certain clinical benefit. AUC heatmaps of all models based on cross-combination method in task I and task II were shown in Figures 5A and 6A.
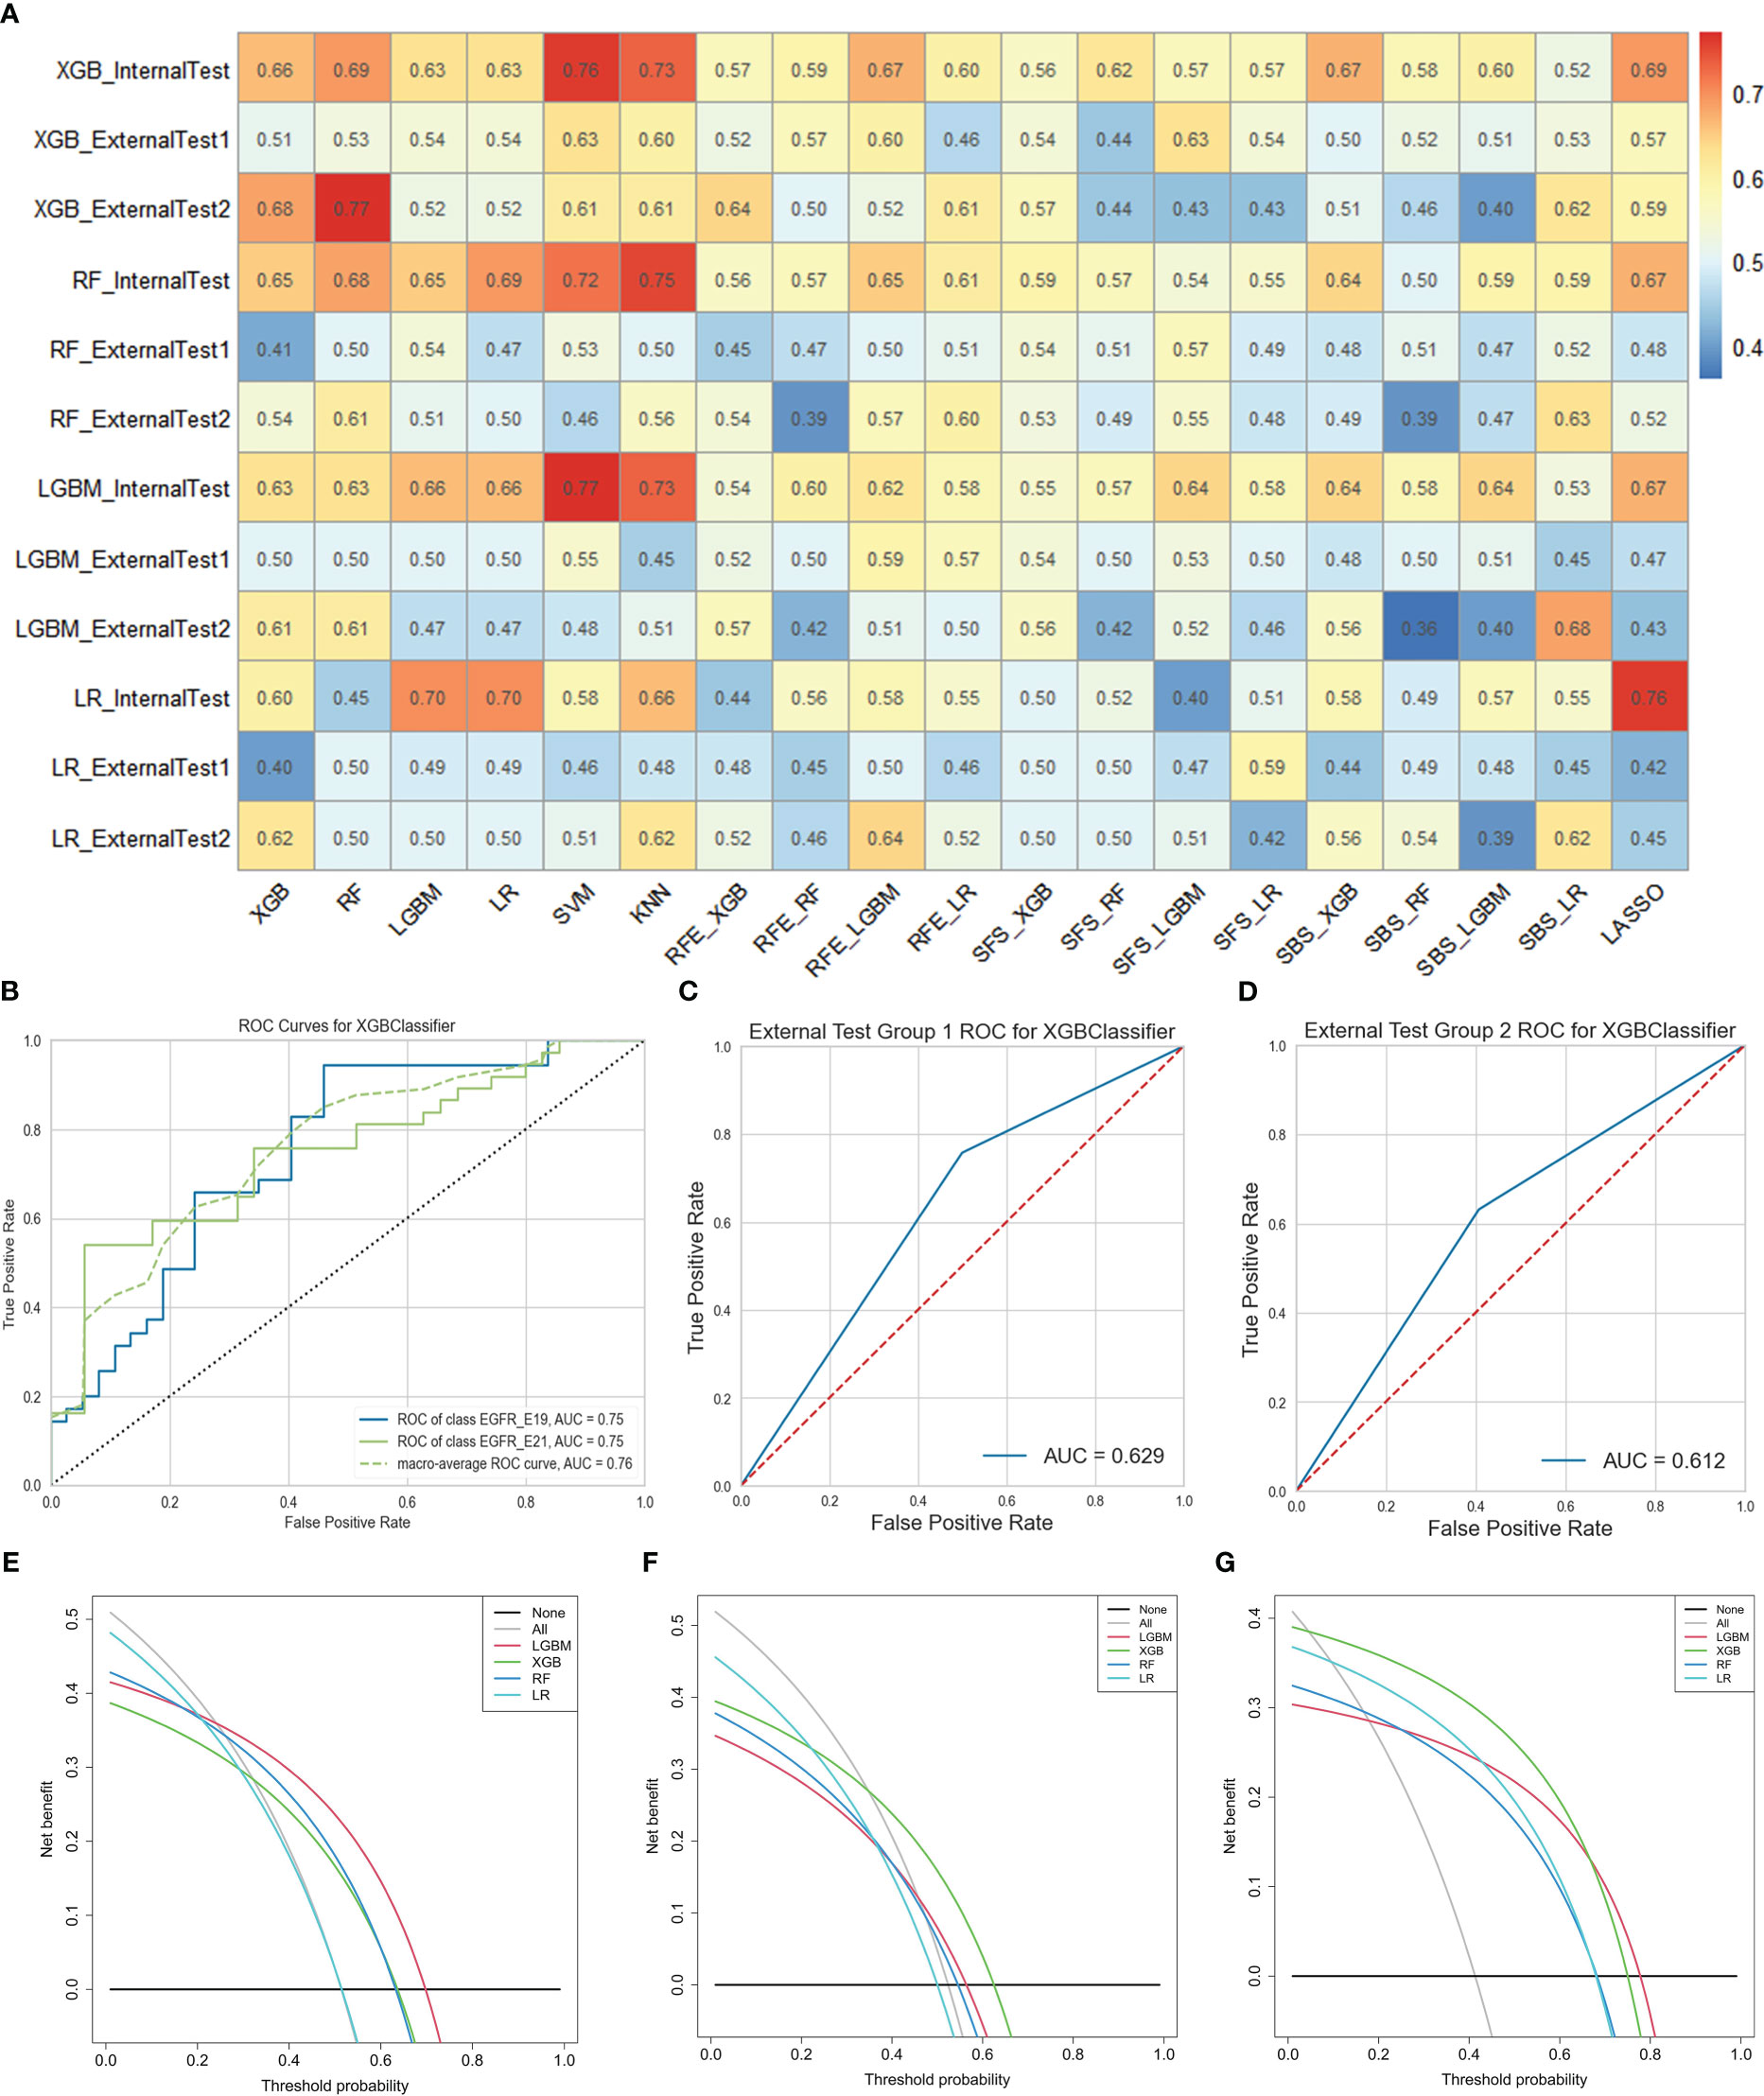
Figure 6 The performance of models in predicting EGFR mutation subtypes. (A) AUC performance of all models based on cross-combination method. (B-D) AUC performance of internal test group, external test group 1 and external test group 2 of optimal predictive model. (E-G) Clinical net benefit of internal test group, external test group 1 and external test group 2 of optimal predictive model. .
Overall, both in task I and II, RFE and embedded feature selection methods always achieved good predictive performance, which outperformed SBS and SFS feature selection methods. Our study strictly adhered to the radiomics process, and the actual RQS could reach 23 (Table S8). It is worth mentioning that the TRIPOD checklist (32) was shown in Table S9.
Interpretation of optimal predictive models
In this study, feature importance and SHAP were used for optimal models’ global interpretation, and optimal models’ local interpretation was analyzed using LIME. The importance of features decreased from top to bottom (Figures 7A, B). Feature importance value was amplified 100 times before visualization. As for task I, the mean of SHAP value bars of 29 HRFs showed the average impact in predicting EGFR mutation status and indicated the feature ranking interpretation of the LGBM model (Figure 7E). As for task II, the spot plots of SHAP value provided the influence of 13 HRFs on XGB model outputs (Figure 7F).
Interpretation of sample prediction results need random drawing of samples to make model predictions and obtained visualizations of how model predictions are performed through the LIME algorithm. In this study, both in task I and task II, the rank of HRFs was generally similar among feature importance, SHAP and LIME (Figures 7C, D). This is sufficient to verify the practicability of the LGBM model and XGB model and could help to increase their clinical trustworthiness in predicting EGFR mutation status and subtypes, and further to assist in providing clinical decision support.
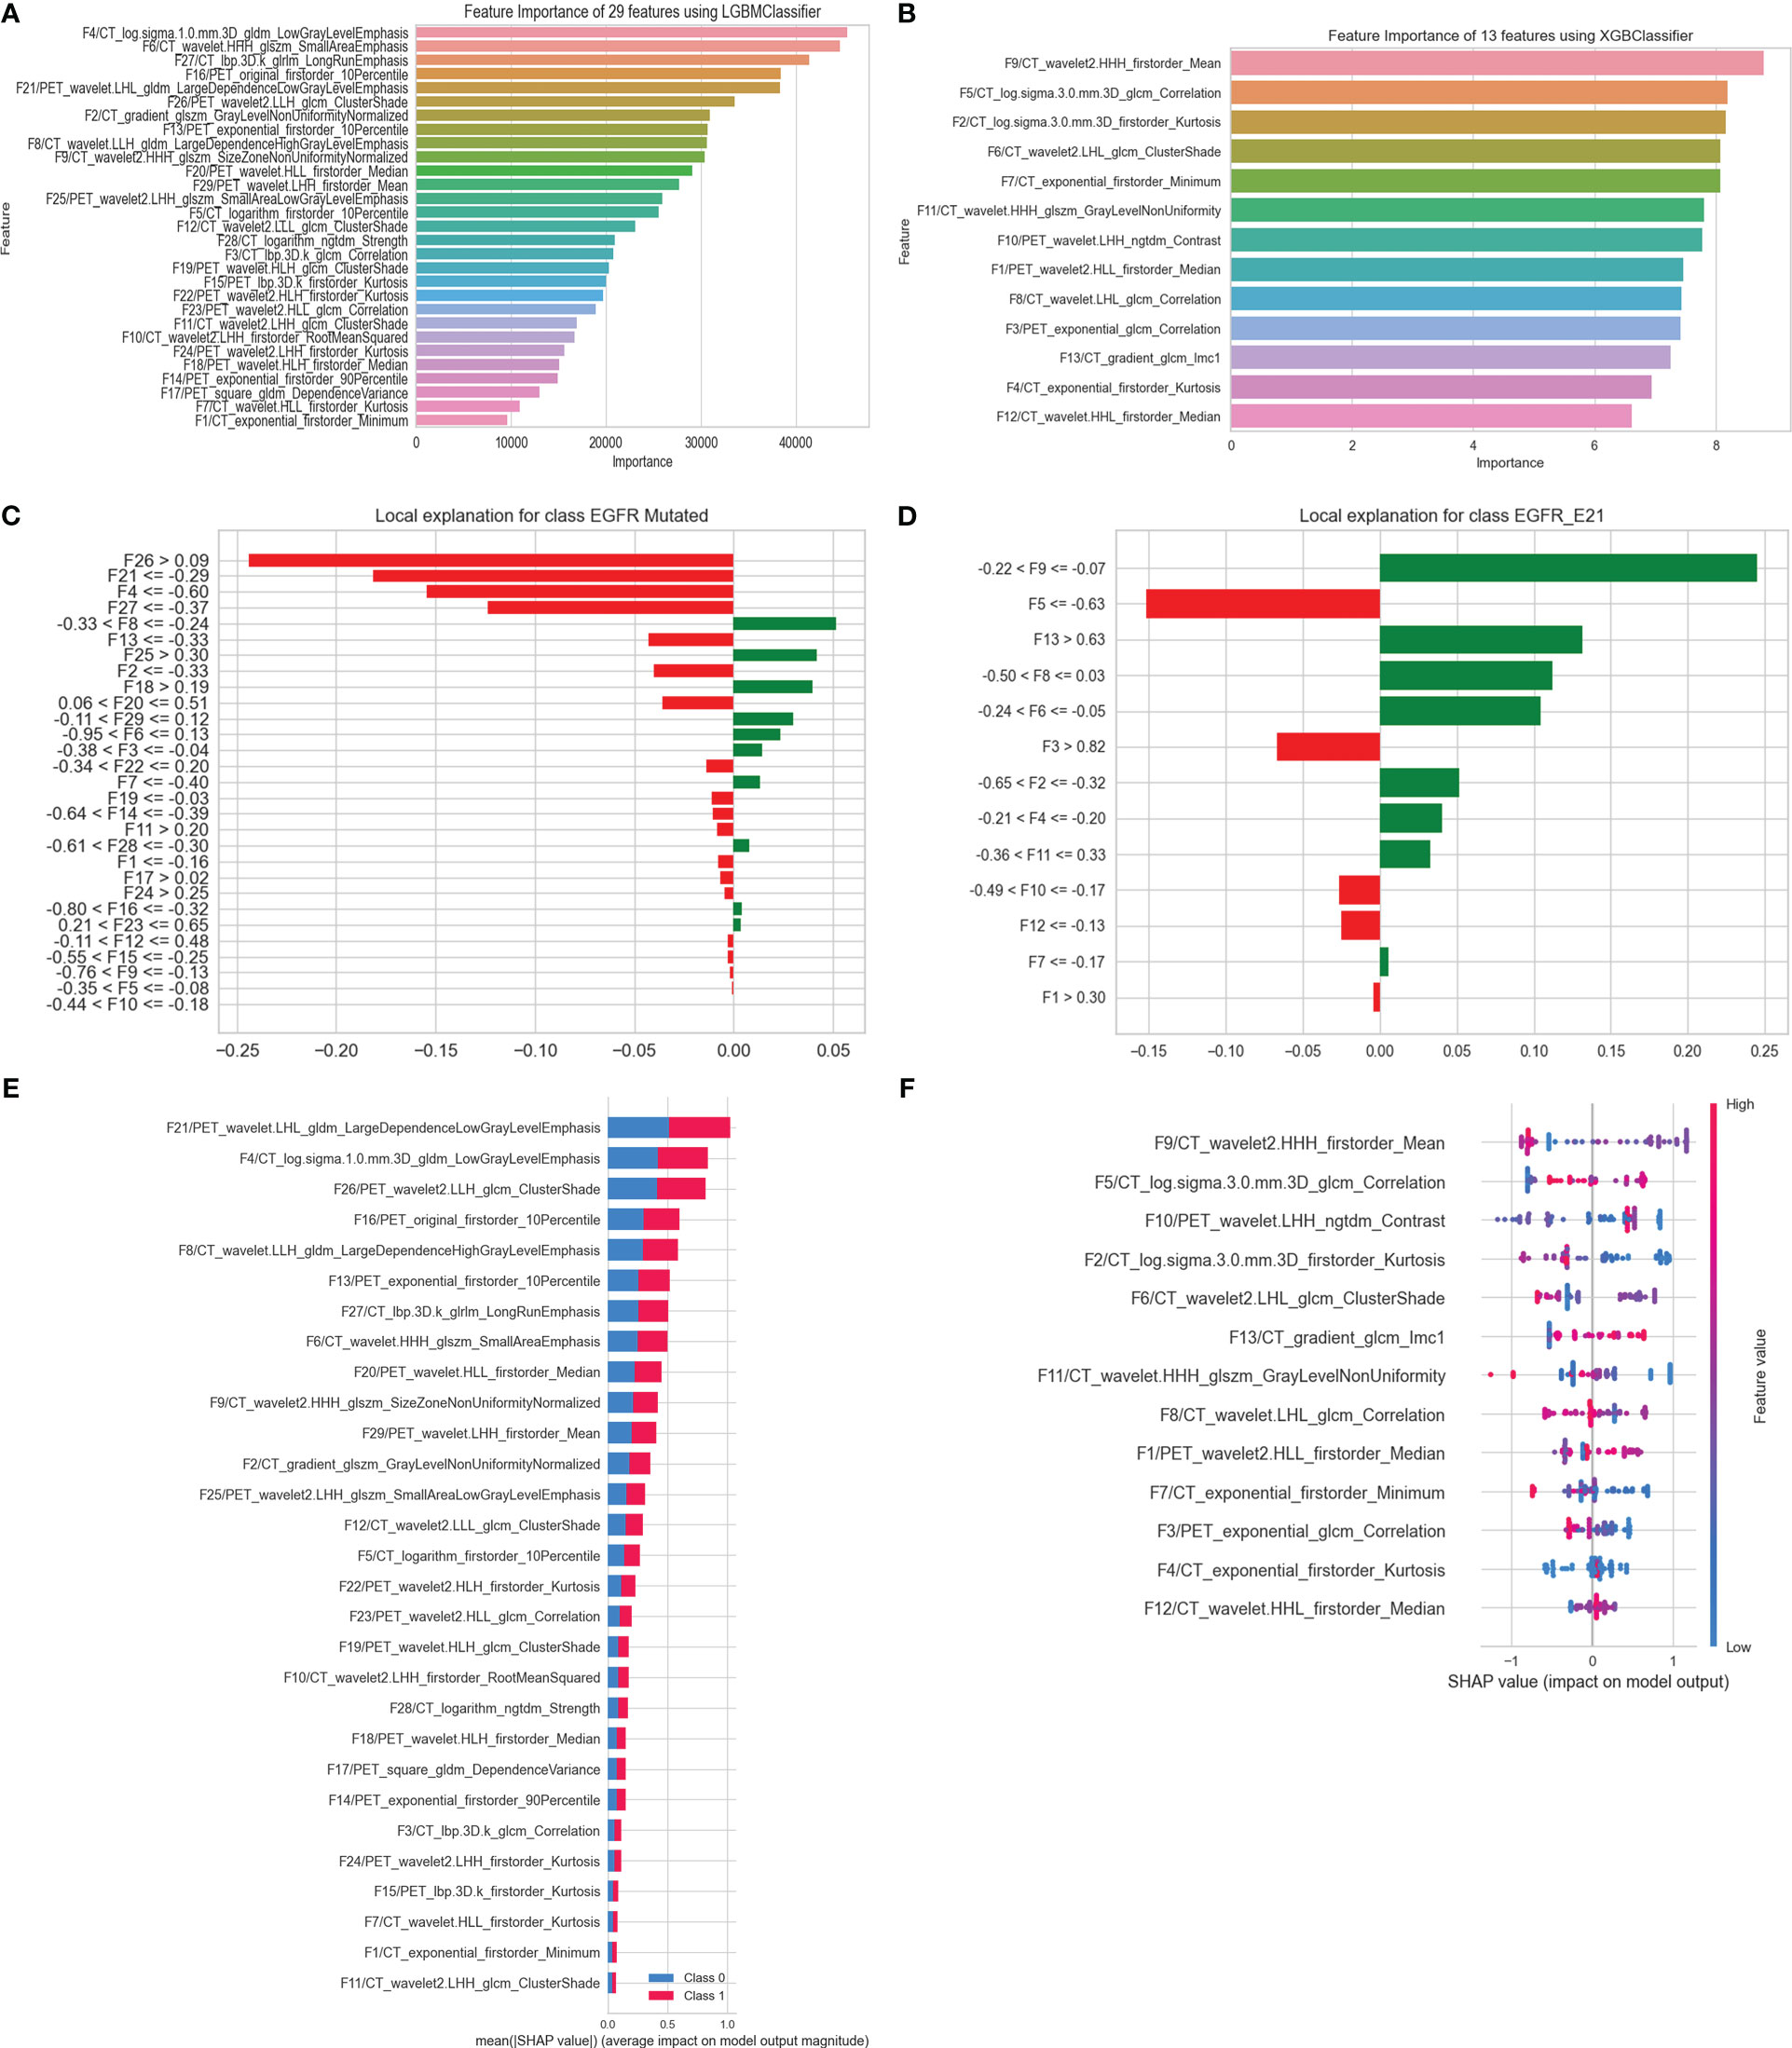
Figure 7 Interpretation of optimal models in predicting EGFR mutation status and subtypes. (A) Feature importance of 29 HRFs; (C) the rank of HRFs and their interactions calculated by LIME (patient index 520, who was pathologically diagnosed with an EGFR mutant-type); (E) Mean SHAP value of 29 HRFs, in predicting EGFR mutation status. (B) Feature importance of 13 HRFs; (D) the rank of handcrafted radiomics features and their interactions calculated by LIME (patient index 9, who was pathologically diagnosed with an E21 subtype); (F) SHAP value of 13 HRFs, in predicting EGFR mutation subtypes.
Survival analysis
Out of a total of 452 cases at FUSCC, 35 patients were lost to follow-up, 89 patients died during follow-up, and 328 patients were alive at the end of follow-up. The 1-, 3- and 5-year OS rates were 83.93%, 33.57% and 3.83%, respectively. The median survival time for the 417 patients was 29.03 months [interquartile range (IQR), 21.34-40.48 months]. Twenty-two PET/CT-based HRFs were selected as prognosis factors using LASSO regression analysis (Figure 8A, Figure S5). Further, Kaplan-Meier survival analysis and Log-rank test verified that the 22 HRFs were useful prognostic predictors (Log-rank p < 0.0001, Figure 8B). The independent clinical factors (gender, TNM staging, grades, LD) and PET (SUVmax) predictor that were significant in the multivariate Cox regression analysis were used to build the combined models for predicting OS (Figure 8C). PET/CT-RadScore was calculated for each patient through a linear combination of the 22 HRFs weighted according to their respective coefficient. PET/CT-RadScore combined with 5 clinical risk factors demonstrated a good predictive survival performance, with a C-index of 0.863. The information of the 22 HRFs for task III could be found at Table S7 and Figure S6. The calibration curve for predicting the probability of OS at 1, 3, or 5 years for each model after 1000 bootstrap replicates was shown in Figure 8D, which showed satisfactory agreement between the estimations and actual observations.
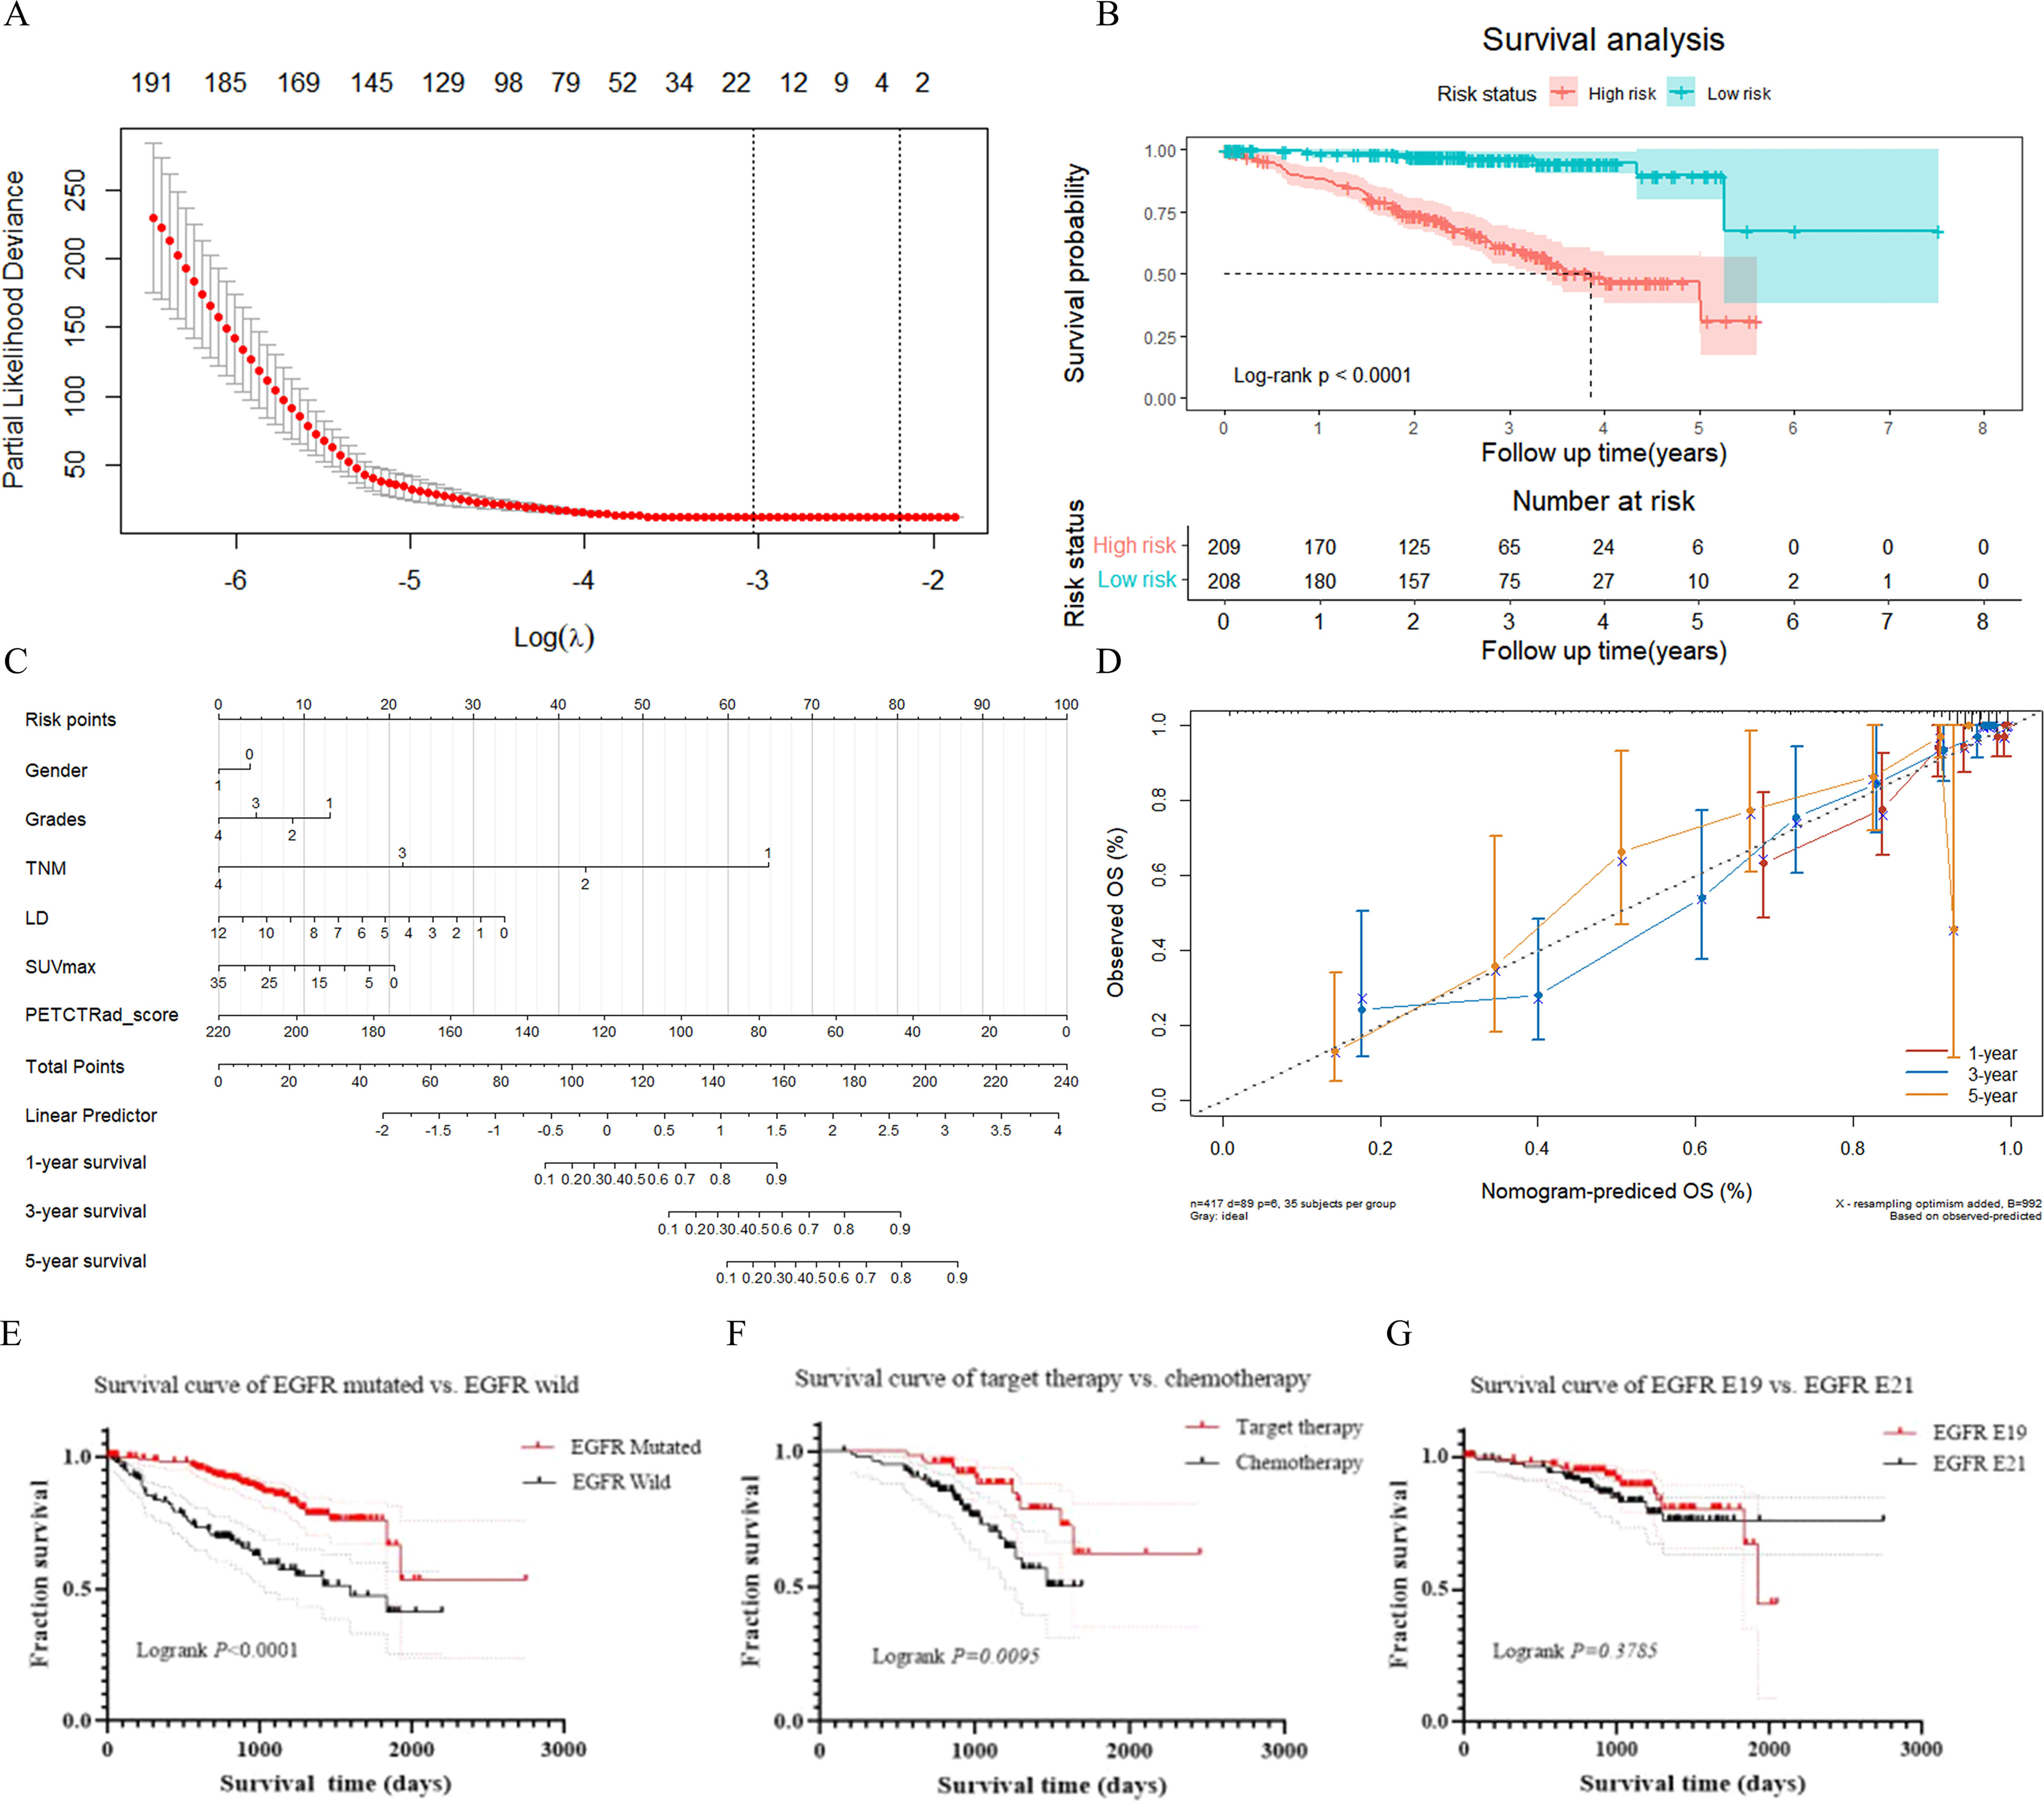
Figure 8 Results of survival analysis. (A) LASSO feature selection. (B) Kaplan-Meier survival analysis. (C) nomogram model. (D) calibration curve at the 1-year, 3-year, and 5-year time points. (E) survival curve of lung adenocarcinoma patients with EGFR mutant-type and EGFR wild-type. (F) survival curve of target therapy and chemotherapy in lung adenocarcinoma patients with EGFR mutant-type. (G) survival curve of lung adenocarcinoma patients with EGFR E19 and EGFR E21 subtypes.
There were 281 patients with EGFR mutant-type and 137 patients with EGFR wild-type. There was a significant difference in survival time between those patients with EGFR mutant-type and EGFR wild-type in total (p < 0.0001). Among those patients with EGFR mutant-type, 85 patients underwent targeted therapy and 137 underwent chemotherapy. The prognosis for targeted therapy was better than that for chemotherapy. There was a significant difference in survival time between targeted therapy and chemotherapy for patients with EGFR mutant-type (p = 0.0095). One hundred and three patients with E19 and 124 with E21 mutations in total. There was no significant difference in survival time between those with E19 and E21 mutations (p = 0.3785). Survival curves for above were presented in Figures 8E–G.
Discussion
In this study, firstly, we successfully constructed separately two cross-combination predictive models for EGFR mutation status and subtypes. Then, optimal models were determined from 76 predictive models according to the comprehensive AUC performance of an internal test group and 2 external test groups. The predictive model using RFE - LGBM and LGBM achieved the best performance in task I, and the predictive model using SVM and XGB achieved the best performance in task II. Furthermore, we performed model visualization and interpretation. Besides, we also built a multivariate CPH model based on clinical risk factors and robust 18F-FDG PET/CT HRFs for OS prediction in lung adenocarcinoma. Together, our results may provide important information in predicting EGFR mutation status, EGFR subtypes and OS, to help lung adenocarcinoma treatment and prognosis.
Identifying EGFR mutation status and main subtypes of patients with lung adenocarcinoma are beneficial in making EGFR-TKIs-related treatment strategies in clinic. Sho et al. (33) used the same public data set as ours to build models predicting histological subtype and EGFR mutation status of non-small cell lung cancer on 18F-FDG PET/CT, and XGB classifier achieved better performance (AUC = 0.659) than gradient tree boosting, Bayesian optimization and RF classifiers. Yang et al. (17) introduced two RF-based predictive models and a multivariate CPH model for predicting EGFR mutation status, EGFR subtypes and OS in total 174 patients with lung adenocarcinoma. And their results showed that the AUC of train and validation group were 0.77 and 0.71 for EGFR mutant/wild-type prediction, and reached 0.82 and 0.73 in EGFR E19/E21 prediction. However, they did not involve cross-combination method and further multi-center data validation. Our study built two separately cross-combination models to identify EGFR mutation status and subtypes. In the internal test group and two external test groups, the optimal model in EGFR mutant/wild-type prediction could reach an AUC of 0.80, 0.61 and 0.71, and reach an AUC of 0.76, 0.63 and 0.61 in EGFR E19/E21 prediction. The performance of optimal EGFR E19/E21 prediction model was not that satisfactory. We thought that data selection bias and limited sample size with relative high complexity and heterogeneity may lead to this result. Interestingly, we found that the models that performed best in the internal test group did not necessarily perform best in the two external test groups. Most of the existing studies were based on small samples or single-center data, which may lead to a locally optimal result. External validation via multi-center data could ensure the generalization performance of the model. Therefore, it also reflected that our optimal models had stable predictive performance.
Increasing evidence has verified that HRFs played a significant important role in predicting prognosis (34), EGFR mutation status and subtypes of NSCLC (13, 15, 17). Compared with Yang’s study (17), we extracted more complete HRFs and obtained better EGFR-related results. In terms of all the feature attributes, both our and Yang’s study found that wavelet features of CT imaging showed better predictive power. Also, some radiomics models were built using CT HRFs to identify E19 and E21 in lung adenocarcinoma (17, 35, 36), but their performance was difficult to compare due to the different medical modes and model evaluation indexes. Liu et al. (12) reported that 10 HRFs, which included seven wavelet features of CT imaging, two texture features of PET imaging, and one texture feature of CT imaging, were significantly associated with EGFR subtypes (E19 vs. E21). However, we partially selected the same feature categories but completely different features for prediction model building. In our research, we found that CT texture features based on wavelet filter had the biggest proportion in task I-II. As shown in previous studies, LBP features were popular descriptors in many images analysis tasks and showed pretty good contribution to model performance (37, 38). Wavelet features were also reported as a predictive marker in predicting treatment response and tumor phenotype of NSCLC (39, 40), which were in accordance with our work. LGBM and XGB classifiers always had better performance than LR models and RF models, which were accordance with previous studies (41).
The ability to interpret and validate automatic decisions-making of clinical predictive models is significant important in practical applications. Our results found that XAI can determine the most important features, further reveal the interactions of features that have an impact on model output, and then enhance clinical trustworthiness in predictive models. Yang et al. (42) established an explainable model to predict EGFR mutation status in lung adenocarcinoma based on seven machine learning algorithms and SHAP, but they only used semantic features, and did not involve LIME. Currently, many researches also have verified that SHAP and LIME were useful and effective approaches (25–27). Consistent with us, the results indicated that these two XAI approaches could pinpoint the most significant and important features of the model, and make the predictive model an effective and explainable tool for supporting clinical diagnosis and treatment.
Combined HRFs and clinical risk factors also have a satisfying predictive performance in prognosis. We also constructed a CPH model using 22 HRFs and 5 clinical risk factors to predict OS. Our model reached higher C-index than Yang’s (17) study (0.863 vs. 0.757). In our study, there is a significant difference in survival time between EGFR mutant and EGFR wild groups. This indicated that different EGFR mutation status and different treatment method may affect patients’ survival time. The survival analysis showed that the prognosis of targeted therapy was better than chemotherapy in patients with EGFR mutant type, which was consistent with previous studies (43, 44). However, there is no significant difference in survival time between patients with E19 and E21, furthermore, the survival rate of patients with E19 was better than that with E21, which was similar to previous study (45).
Several factors may explain the differences among the studies mentioned above. One reason may be the differences in imaging processing, VOIs segmentation in different studies. Most importantly, multi-center data has richer information and different PET/CT scanners and associated protocols, which increases the complexity and heterogeneity of data. On the one hand, it decreased the over fitting risk of model, on the other hand, it had an effect on the overall performance of model. This may be the major reason why the AUC performance of our optimal models was lower than that of some published studies (12–14).
Recent studies have shown that non-invasive approaches based on PET/CT, for example, analysis of 18F-FDG uptake (SUVmax, metabolic volume, tumor lesion glucose) and 18F-FDG PET/CT-derived radiomics (46, 47) could help quantify EGFR mutation status and predict prognosis in lung cancer patients for precision therapy. However, in some previous studies, the results of 18F-FDG uptake were conflicting (9, 10). The value of 18F-FDG uptake in EGFR mutation status prediction need to be evaluated in further high-quality studies. Radiomics extracted from diagnostic PET/CT images is a promising translational research field. Our study verified the feasibility and potential superiority of multi-center 18F-FDG PET/CT-derived radiomics to identify EGFR mutation status and predict prognosis in lung adenocarcinoma, which may help to develop a non-invasive tool as a complementary to PET/CT for clinic.
Our study has several limitations. First, although we collected data from 4 cohorts, it was a retrospective study and selection bias may have occurred. Unfortunately, we developed OS CPH model based on single-center data. In future work, it is necessary to enroll a larger multi-center/scanner data set with standard and complete follow-up information and perform a prospective analysis to evaluate our results, and further ensure better robustness and clinical applicability of the model. Second, the tumor regions were manually segmented slice by slice from radiologists, which could be time-consuming and susceptible to radiologist variability. There is an urgent need for an accurate semi-automatic segmentation method with unsupervised or weak supervision.
Conclusions
In conclusion, we developed and interpreted two optimal predictive models to identify EGFR mutation status and subtypes in patients with lung adenocarcinoma based on cross-combination method and XAI technology, and further constructed a prognostic model to predict their clinical outcome.
Data availability statement
The original contributions presented in the study are included in the article/Supplementary Material. Further inquiries can be directed to the corresponding author.
Ethics statement
The study was performed in accordance with the ethical standards as laid down in the 1964 Declaration of Helsinki and its later amendments or comparable ethical standards. As our study is a retrospective analysis, informed consent is not required.
Author contributions
All authors contributed to the study conception and design. Material preparation, data collection and analysis were performed by YZ and QL. The first draft of the manuscript was written by YZ and QL, and all authors commented on previous versions of the manuscript. All authors contributed to the article and approved the submitted version.
Funding
This work was supported by National Natural Science Foundation of China (Grant numbers: 81971648, 82001866), Innovative research team of high-level local universities in Shanghai and a key laboratory program of the Education Commission of Shanghai Municipality (Grant numbers: ZDSYS14005), Medical-engineering integration program of Fudan university (Grant numbers: YG2021-001).
Acknowledgments
The authors thank all their coworkers involved in the study for their support and assistance.
Conflict of interest
The authors declare that the research was conducted in the absence of any commercial or financial relationships that could be construed as a potential conflict of interest.
Publisher’s note
All claims expressed in this article are solely those of the authors and do not necessarily represent those of their affiliated organizations, or those of the publisher, the editors and the reviewers. Any product that may be evaluated in this article, or claim that may be made by its manufacturer, is not guaranteed or endorsed by the publisher.
Supplementary material
The Supplementary Material for this article can be found online at: https://www.frontiersin.org/articles/10.3389/fonc.2023.1173355/full#supplementary-material
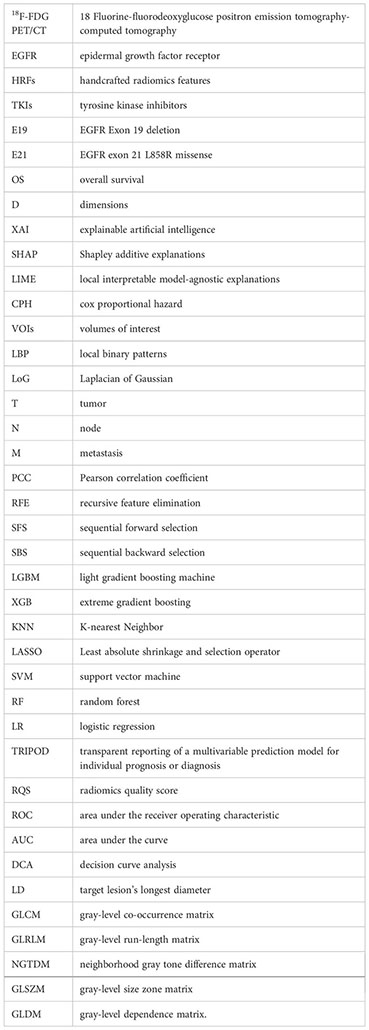
Glossary
References
1. Siegel RL, Miller KD, Fuchs HE, Jemal A. Cancer statistics, 2021. CA Cancer J Clin (2021) 71(1):7–33. doi: 10.3322/caac.21654
2. Miller VA. EGFR mutations and EGFR tyrosine kinase inhibition in non-small cell lung cancer. Semin Oncol Nurs (2008) 24(1):27–33. doi: 10.1016/j.soncn.2007.11.009
3. Zappa C, Mousa SA. Non-small cell lung cancer: current treatment and future advances. Transl Lung Cancer Res (2016) 5(3):288–300. doi: 10.21037/tlcr.2016.06.07
4. Hellyer JA, White MN, Gardner RM, Cunanan K, Padda SK, Das M, et al. Impact of tumor suppressor gene Co-mutations on differential response to EGFR TKI therapy in EGFR L858R and exon 19 deletion lung cancer. Clin Lung Cancer (2022) 23(3):264–72. doi: 10.1016/j.cllc.2021.09.004
5. Winfree KB, Molife C, Peterson PM, Chen Y, Visseren-Grul CM, Leusch MS, et al. Real-world characteristics and outcomes of advanced non-small-cell lung cancer patients with EGFR exon 19 deletions or exon 21 mutations. Future Oncol (2021) 17(22):2867–81. doi: 10.2217/fon-2021-0218
6. Behel V, Chougule A, Noronha V, Patil VM, Menon N, Singh A, et al. Clinical utility of liquid biopsy (Cell-free DNA) based EGFR mutation detection post treatment initiation as a disease monitoring tool in patients with advanced EGFR-mutant NSCLC. Clin Lung Cancer (2022) 23(5):410–8. doi: 10.1016/j.cllc.2022.04.002
7. Cho A, Hur J, Moon YW, Hong SR, Suh YJ, Kim YJ, et al. Correlation between EGFR gene mutation, cytologic tumor markers, 18F-FDG uptake in non-small cell lung cancer. BMC Cancer (2016) 16:224. doi: 10.1186/s12885-016-2251-z
8. Caicedo C, Garcia-Velloso MJ, Lozano MD, Labiano T, Vigil DC, Lopez-Picazo JM, et al. Role of [(1)(8)F] FDG PET in prediction of KRAS and EGFR mutation status in patients with advanced non-small-cell lung cancer. Eur J Nucl Med Mol Imag (2014) 41(11):2058–65. doi: 10.1007/s00259-014-2833-4
9. Lee SM, Bae SK, Jung SJ, Kim CK. FDG uptake in non-small cell lung cancer is not an independent predictor of EGFR or KRAS mutation status: a retrospective analysis of 206 patients. Clin Nucl Med (2015) 40(12):950–8. doi: 10.1097/RLU.0000000000000975
10. Lv Z, Fan J, Xu J, Wu F, Huang Q, Guo M, et al. Value of (18)F-FDG PET/CT for predicting EGFR mutations and positive ALK expression in patients with non-small cell lung cancer: a retrospective analysis of 849 Chinese patients. Eur J Nucl Med Mol Imag (2018) 45(5):735–50. doi: 10.1007/s00259-017-3885-z
11. Gu J, Xu S, Huang L, Li S, Wu J, Xu J, et al. Value of combining serum carcinoembryonic antigen and PET/CT in predicting EGFR mutation in non-small cell lung cancer. J Thorac Dis (2018) 10(2):723–31. doi: 10.21037/jtd.2017.12.143
12. Liu Q, Sun D, Li N, Kim J, Feng D, Huang G, et al. Predicting EGFR mutation subtypes in lung adenocarcinoma using (18)F-FDG PET/CT radiomic features. Transl Lung Cancer Res (2020) 9(3):549–62. doi: 10.21037/tlcr.2020.04.17
13. Chang C, Zhou S, Yu H, Zhao W, Ge Y, Duan S, et al. A clinically practical radiomics-clinical combined model based on PET/CT data and nomogram predicts EGFR mutation in lung adenocarcinoma. Eur Radiol (2021) 31(8):6259–68. doi: 10.1007/s00330-020-07676-x
14. Zhang J, Zhao X, Zhao Y, Zhang J, Zhang Z, Wang J, et al. Value of pre-therapy (18)F-FDG PET/CT radiomics in predicting EGFR mutation status in patients with non-small cell lung cancer. Eur J Nucl Med Mol Imag (2020) 47(5):1137–46. doi: 10.1007/s00259-019-04592-1
15. Li S, Li Y, Zhao M, Wang P, Xin J. Combination of (18)F-fluorodeoxyglucose PET/CT radiomics and clinical features for predicting epidermal growth factor receptor mutations in lung adenocarcinoma. Korean J Radiol (2022) 23(9):921–30. doi: 10.3348/kjr.2022.0295
16. Zhao HY, Su YX, Zhang LH, Fu P. Prediction model based on 18F-FDG PET/CT radiomic features and clinical factors of EGFR mutations in lung adenocarcinoma. Neoplasma (2022) 69(1):233–41. doi: 10.4149/neo_2021_201222N1388
17. Yang B, Ji HS, Zhou CS, Dong H, Ma L, Ge YQ, et al. (18)F-fluorodeoxyglucose positron emission tomography/computed tomography-based radiomic features for prediction of epidermal growth factor receptor mutation status and prognosis in patients with lung adenocarcinoma. Transl Lung Cancer Res (2020) 9(3):563–74. doi: 10.21037/tlcr-19-592
18. Gao J, Niu R, Shi Y, Shao X, Jiang Z, Ge X, et al. The predictive value of [18F] FDG PET/CT radiomics combined with clinical features for EGFR mutation status in different clinical staging of lung adenocarcinoma. EJNMMI Res (2023) 13(1):26. doi: 10.1186/s13550-023-00977-4
19. Gomez OV, Herraiz JL, Udias JM, Haug A, Papp L, Cioni D, et al. Analysis of cross-combinations of feature selection and machine-learning classification methods based on [(18)F] f-FDG PET/CT radiomic features for metabolic response prediction of metastatic breast cancer lesions. Cancers (Basel) (2022) 14(12):2922. doi: 10.3390/cancers14122922
20. Yin P, Mao N, Zhao C, Wu J, Sun C, Chen L, et al. Comparison of radiomics machine-learning classifiers and feature selection for differentiation of sacral chordoma and sacral giant cell tumour based on 3D computed tomography features. Eur Radiol (2019) 29(4):1841–7. doi: 10.1007/s00330-018-5730-6
21. Zhou Y, Ma XL, Zhang T, Wang J, Zhang T, Tian R. Use of radiomics based on (18)F-FDG PET/CT and machine learning methods to aid clinical decision-making in the classification of solitary pulmonary lesions: an innovative approach. Eur J Nucl Med Mol Imaging (2021) 48(9):2904–13. doi: 10.1007/s00259-021-05220-7
22. Jiang C, Li A, Teng Y, Huang X, Ding C, Chen J, et al. Optimal PET-based radiomic signature construction based on the cross-combination method for predicting the survival of patients with diffuse large b-cell lymphoma. Eur J Nucl Med Mol Imaging (2022) 49(8):2902–16. doi: 10.1007/s00259-022-05717-9
23. Gunning D, Stefik M, Choi J, Miller T, Stumpf S, Yang GZ. XAI-explainable artificial intelligence. Sci Robot (2019) 4(37):eaay7120. doi: 10.1126/scirobotics.aay7120
24. Schultebraucks K, Choi KW, Galatzer-Levy IR, Bonanno GA. Discriminating heterogeneous trajectories of resilience and depression after major life stressors using polygenic scores. JAMA Psychiatry (2021) 78(7):744–52. doi: 10.1001/jamapsychiatry.2021.0228
25. Zou Y, Shi Y, Sun F, Liu J, Guo Y, Zhang H, et al. Extreme gradient boosting model to assess risk of central cervical lymph node metastasis in patients with papillary thyroid carcinoma: individual prediction using SHapley additive exPlanations. Comput Methods Programs Biomed (2022) 225:107038. doi: 10.1016/j.cmpb.2022.107038
26. Zhang Y, Xie C, Xue L, Tao Y, Yue G, Jiang BA. Post-hoc interpretable ensemble model to feature effect analysis in warfarin dose prediction for Chinese patients. IEEE J BioMed Health Inform (2022) 26(2):840–51. doi: 10.1109/JBHI.2021.3092170
27. Manikis GC, Ioannidis GS, Siakallis L, Nikiforaki K, Iv M, Vozlic D, et al. Multicenter DSC-MRI-Based radiomics predict IDH mutation in gliomas. Cancers (Basel) (2021) 13(16):3965. doi: 10.3390/cancers13163965
28. Boellaard R, Delgado-Bolton R, Oyen WJ, Giammarile F, Tatsch K, Eschner W, et al. FDG PET/CT: EANM procedure guidelines for tumour imaging: version 2. 0 Eur J Nucl Med Mol Imag (2015) 42(2):328–54. doi: 10.1007/s00259-014-2961-x
29. Zwanenburg A, Vallieres M, Abdalah MA, Aerts H, Andrearczyk V, Apte A, et al. The image biomarker standardization initiative: standardized quantitative radiomics for high-throughput image-based phenotyping. Radiology (2020) 295(2):328–38. doi: 10.1148/radiol.2020191145
30. Da-Ano R, Masson I, Lucia F, Dore M, Robin P, Alfieri J, et al. Performance comparison of modified ComBat for harmonization of radiomic features for multicenter studies. Sci Rep (2020) 10(1):10248. doi: 10.1038/s41598-020-66110-w
31. Cabini RF, Brero F, Lancia A, Stelitano C, Oneta O, Ballante E, et al. Preliminary report on harmonization of features extraction process using the ComBat tool in the multi-center “Blue sky radiomics” study on stage III unresectable NSCLC. Insights Imag (2022) 13(1):38. doi: 10.1186/s13244-022-01171-1
32. Moons KG, Altman DG, Reitsma JB, Ioannidis JP, Macaskill P, Steyerberg EW, et al. Transparent reporting of a multivariable prediction model for individual prognosis or diagnosis (TRIPOD): explanation and elaboration. Ann Intern Med (2015) 162(1):W1–73. doi: 10.7326/M14-0698
33. Koyasu S, Nishio M, Isoda H, Nakamoto Y, Togashi K. Usefulness of gradient tree boosting for predicting histological subtype and EGFR mutation status of non-small cell lung cancer on (18)F FDG-PET/CT. Ann Nucl Med (2020) 34(1):49–57. doi: 10.1007/s12149-019-01414-0
34. Huang B, Sollee J, Luo YH, Reddy A, Zhong Z, Wu J, et al. Prediction of lung malignancy progression and survival with machine learning based on pre-treatment FDG-PET/CT. Ebiomedicine (2022) 82:104127. doi: 10.1016/j.ebiom.2022.104127
35. Liu G, Xu Z, Ge Y, Jiang B, Groen H, Vliegenthart R, et al. 3D radiomics predicts EGFR mutation, exon-19 deletion and exon-21 L858R mutation in lung adenocarcinoma. Transl Lung Cancer Res (2020) 9(4):1212–24. doi: 10.21037/tlcr-20-122
36. Mei D, Luo Y, Wang Y, Gong J. CT texture analysis of lung adenocarcinoma: can radiomic features be surrogate biomarkers for EGFR mutation statuses. Cancer Imag (2018) 18(1):52. doi: 10.1186/s40644-018-0184-2
37. Zamboglou C, Bettermann AS, Gratzke C, Mix M, Ruf J, Kiefer S, et al. Uncovering the invisible-prevalence, characteristics, and radiomics feature-based detection of visually undetectable intraprostatic tumor lesions in (68) GaPSMA-11 PET images of patients with primary prostate cancer. Eur J Nucl Med Mol Imag (2021) 48(6):1987–97. doi: 10.1007/s00259-020-05111-3
38. Peeken JC, Shouman MA, Kroenke M, Rauscher I, Maurer T, Gschwend JE, et al. A CT-based radiomics model to detect prostate cancer lymph node metastases in PSMA radioguided surgery patients. Eur J Nucl Med Mol Imag (2020) 47(13):2968–77. doi: 10.1007/s00259-020-04864-1
39. Chetan MR, Gleeson FV. Radiomics in predicting treatment response in non-small-cell lung cancer: current status, challenges and future perspectives. Eur Radiol (2021) 31(2):1049–58. doi: 10.1007/s00330-020-07141-9
40. Coroller TP, Agrawal V, Narayan V, Hou Y, Grossmann P, Lee SW, et al. Radiomic phenotype features predict pathological response in non-small cell lung cancer. Radiother Oncol (2016) 119(3):480–6. doi: 10.1016/j.radonc.2016.04.004
41. Ince O, Onder H, Gencturk M, Cebeci H, Golzarian J, Young S. Prediction of response of hepatocellular carcinoma to radioembolization: machine learning using preprocedural clinical factors and MR imaging radiomics. J Vasc Interv Radiol (2022) 34(2):235-43.e3. doi: 10.1016/j.jvir.2022.11.004
42. Yang R, Xiong X, Wang H, Li W. Explainable machine learning model to prediction EGFR mutation in lung cancer. Front Oncol (2022) 12:924144. doi: 10.3389/fonc.2022.924144
43. Wu YL, Zhou C, Hu CP, Feng J, Lu S, Huang Y, et al. Afatinib versus cisplatin plus gemcitabine for first-line treatment of Asian patients with advanced non-small-cell lung cancer harbouring EGFR mutations (LUX-lung 6): an open-label, randomised phase 3 trial. Lancet Oncol (2014) 15(2):213–22. doi: 10.1016/S1470-2045(13)70604-1
44. Rosell R, Carcereny E, Gervais R, Vergnenegre A, Massuti B, Felip E, et al. Erlotinib versus standard chemotherapy as first-line treatment for European patients with advanced EGFR mutation-positive non-small-cell lung cancer (EURTAC): a multicentre, open-label, randomised phase 3 trial. Lancet Oncol (2012) 13(3):239–46. doi: 10.1016/S1470-2045(11)70393-X
45. Winfree KB, Molife C, Peterson PM, Chen Y, Visseren-Grul CM, Leusch MS, et al. Real-world characteristics and outcomes of advanced non-small-cell lung cancer patients with EGFR exon 19 deletions or exon 21 mutations. Future Oncol (2021) 17(22):2867–81. doi: 10.2217/fon-2021-0218
46. Hu N, Yan G, Wu Y, Wang L, Wang Y, Xiang Y, et al. Recent and current advances in PET/CT imaging in the field of predicting epidermal growth factor receptor mutations in non-small cell lung cancer. Front Oncol (2022) 12:879341. doi: 10.3389/fonc.2022.879341
Keywords: lung adenocarcinoma, PET/CT, epidermal growth factor receptor, radiomics, machine learning
Citation: Zuo Y, Liu Q, Li N, Li P, Zhang J and Song S (2023) Optimal 18F-FDG PET/CT radiomics model development for predicting EGFR mutation status and prognosis in lung adenocarcinoma: a multicentric study. Front. Oncol. 13:1173355. doi: 10.3389/fonc.2023.1173355
Received: 24 February 2023; Accepted: 24 April 2023;
Published: 08 May 2023.
Edited by:
Giuseppe Luigi Banna, Portsmouth Hospitals University NHS TRust, United KingdomReviewed by:
Fei Kang, Fourth Military Medical University, ChinaXiaowei Ma, Central South University, China
Copyright © 2023 Zuo, Liu, Li, Li, Zhang and Song. This is an open-access article distributed under the terms of the Creative Commons Attribution License (CC BY). The use, distribution or reproduction in other forums is permitted, provided the original author(s) and the copyright owner(s) are credited and that the original publication in this journal is cited, in accordance with accepted academic practice. No use, distribution or reproduction is permitted which does not comply with these terms.
*Correspondence: Shaoli Song, c2hhb2xpLXNvbmdAMTYzLmNvbQ==
†These authors have contributed equally to this work and share first authorship