 Shujie Zeng
 Zihao Zhang1,2
 Changqing Jing
 Leping Li
- 1Department of Gastrointestinal Surgery, Shandong Provincial Hospital, Cheeloo College of Medicine, Shandong University, Jinan, Shandong, China
- 2Department of Gastroenterological Surgery, Shandong Provincial Hospital Affiliated to Shandong First Medical University, Jinan, Shandong, China
- 3Key Laboratory of Engineering of Shandong Province, Shandong Provincial Hospital, Jinan, Shandong, China
- 4Medical Science and Technology Innovation Center, Shandong First Medical University & Shandong Academy of Medical Sciences, Jinan, Shandong, China
Semaphorin 4D (SEMA4D) is considered a new antitumor target closely related to immune cells. However, understanding the role of SEMA4D in the tumor microenvironment (TME) is limited. In this study, we explored the expression and immune cell infiltration patterns of SEMA4D using multiple bioinformatics datasets and analyzed the relationship between SEMA4D expression with immune checkpoints, tumor mutational load (TMB), microsatellite instability (MSI) and immune function. We detected that SEMA4D is overexpressed in many tumors types, widely enriched in immune cells, and closely associated with TILs, MSI, TMB, as well as T-cell exhaustion-associated immune checkpoints, and thus can broadly affect the immune microenvironment. We further verified the overexpression of SEMA4D in tumor and its distribution in TME by immunohistochemistry, RT-qPCR and flow cytometry, and confirmed that decreased expression of SEMA4D can lead to recovery of T cell exhaustion. In conlusion, this study provides a more comprehensive perspective of SEMA4D regulation of tumor immunity, which provide a new option for cancer immunotherapy.
Introduction
Semaphorin 4D (SEMA4D), also called CD100, is a member of the semaphorin superfamily IV subfamily (1). SEMA4D has been confirmed to be expressed at high levels in a variety of tumors, including prostate cancer, colon cancer, breast cancer, oral cancer, lung cancer, pancreatic cancer, head and neck carcinoma, and soft tissue sarcoma (2). SEMA4D regulates the invasion and migration of tumor cells and participates in tumor angiogenesis through various mechanisms. It is a transmembrane semaphorin and has a 120 kDa soluble form (1). In addition, SEMA4D is not a redundant biomolecule in the immune system, and it is expressed at high levels in several autoimmune diseases and infections, including neuroinflammatory demyelination, systemic sclerosis, heart failure, haemorrhagic fever with renal syndrome, hepatitis C virus infection, multiple sclerosis, rheumatoid arthritis and Huntington disease (3).
SEMA4D was the first semaphorin reported to play a key role in the immune response (4). SEMA4D regulates immune cell function mainly through its receptors plexin and CD72. Most of its immunomodulatory effects are mediated by the CD72 receptor, which is expressed in B cells, dendritic cells (DCs) and monocytes, and it regulates humorall and cellular immunity by activating B cells and DCs (5). In addition, SEMA4D regulates immune cell migration through multiple mechanisms. Plexin receptors inhibit lymphocyte migration, while chemokines and membrane SEMA4D on lymphocytes stimulate lymphocyte migration (6, 7). SEMA4D also functions as a receptor, transmitting activation signals into lymphocytes and increasing T cell proliferation (8). SEMA4D widely mediates the suppressive tumor immune microenvironment.
Tumor cells and immune cells have complex interactions in the immune microenvironment, and SEMA4D expressed on tumor cells participates in editing the inhibitory immune microenvironment. Tumor cells secrete SEMA4D, which stimulates myeloid-derived suppressor cell (MDSC) differentiation, enhances the immunosuppressive function of MDSCs, and inhibits T cell proliferation and IFN-γ production. Blocking SEMA4D improves inhibitory immune microenvironments and produces a durable antitumor response (3). Therefore, SEMA4D plays a complicated role in the tumor microenvironment (TME) because it affects a wide range of immune cell populations and participates in stimulatory and inhibitory immune responses. Understanding the biological characteristics of the TME of different tumors will greatly facilitate predictions of the prognosis and guide treatment.
Here, we analyzed the expression patterns of SEMA4D in the TME and its relationship with immune cell infiltration, microsatellite instability (MSI), the tumor mutational burden (TMB) and immune checkpoints using bioinformatics methods combined with next-generation sequencing (NGS) data and single-cell sequencing across multiple cancers. Real time fluorescent quantitative polymerase chain reaction (RT–qPCR), immunohistochemical (IHC) and flow cytometry (FCM) were used to further confirm the expression pattern of SEMA4D in TME and to explore the effect of SEMA4D in tumor-infiltrating lymphocytes.
Real time fluorescent quantitative polymerase chain reaction (RT–qPCR), immunohistochemical (IHC) and flow cytometry (FCM) were used to further confirm the expression pattern of SEMA4D in TME and to explore the effect of SEMA4D in tumor-infiltrating lymphocytes.
Materials and methods
Data processing and differential expression analysis
Images of IHC staining for SEMA4D protein expression in 13 pairs of normal and tumor tissues, including normal liver and liver cancer, normal endometrium and endometrial cancer, normal colon and colon cancer, normal breast and breast cancer, normal skin and skin melanoma, normal lung and lung cancer, normal kidney and renal cancer, normal testicle and testicular cancer, normal ovary and ovarian cancer, normal lymph node and lymphoma, normal head-neck salivary gland and head-neck cancer, normal pancreas and pancreatic cancer, and caudate and glioma, were downloaded from the Human Protein Atlas (HPA) (http://www.proteinatlas.org/) and analysed. The antibody used for IHC of all sections was Anti-SEMA4D Antibody (Sigma-Aldirich, HPA015662). The protein expression score is based on IHC data manually scored for staining intensity (negative, weak, moderate or strong) and the fraction of stained cells (<25%, 25-75% or >75%) (9). The images on the atlas are the raw data that show the IHC. The expression score describes a knowledge-based best estimate of true protein expression, meaning that an expert has manually analyzed all images and assessed whether or not the staining is likely to represent true protein expression. To provide an overview of protein expression patterns, all images of tissues are manually annotated by one expert and then verified by a second expert. The annotation of each different normal and cancer tissue is performed according to fixed guidelines for classification of IHC results.
SEMA4D and checkpoint expression data as well as clinical information from cancer patients were collected from The Cancer Genome Atlas (TCGA) database.
Relationship between SEMA4D expression and immunity
The correlation between immune and stromal scores was measured with the ESTIMATE algorithm using R software, The immune score and stromal score are calculated by an algorithm called ESTIMATE (Estimation of STromal and Immune cells in MAlignant Tumor tissues using Expression data) which is first proposed by Kosuke Yoshihara et al. in 2013 (10). We used CIBERSORT to analyze the relationship between SEMA4D expression and immune cell infiltration with TIMER2.0 (http://timer.cistrome.org/), and the data were visualized by constructing a heatmap and performing cluster analyses using Python.
The expression levels of SEMA4D in specific immune cells were investigated using the Tumor Immune Single-Cell Hub (TISCH) (http://tisch.comp-genomics.org/), a large-scale curated database that integrates single-cell transcriptomic profiles of nearly 2 million cells from 76 high-quality tumor datasets across 27 cancer types. Tumor datasets were mainly collected from Gene Expression Omnibus and ArrayExpress. All the data were uniformly processed with a standardized workflow (11). Uniform Manifold Approximation and Projection (UMAP) and heatmap were used to show SEMA4D expression in different immune cell types among tumors, and the data were visualized by constructing a heatmap and performing cluster analyses using Python.
Correlation of SEMA4D expression with TMB and MSI
TMB was defined as the total number of coding errors in somatic genes, base substitutions, insertions or deletions detected per million bases (12). If the TMB is higher, the cancer cell contains more mutations, and immune cells more easily recognize and kill it. The TMB appears to be an important independent biomarker within MSI-H tumors that has been used to stratify patients based on the likelihood of a response to immune checkpoint inhibitors. MSI is also a biomarker of the response to immune checkpoint inhibitors (13). MSI scores were determined for all samples based on somatic mutation data downloaded from TCGA (https://tcga.xenahubs.net), and the relationships between SEMA4D expression and TMB and MSI were analyzed by calculating Spearman’s rank correlation coefficients.
Clinical data and tissue sample
Clinical data and samples from 28 patients who had undergone radical (R0) resection with a histological diagnosis of colon adenocarcinoma (COAD) at the Shandong Provincial Hospital from July 2020 to September 2020 were retrospectively collected. The use of patient information and tissues was sanctioned by the Medical Ethics Committee of Shandong Provincial Hospital. The samples were used for IHC staining and RT–qPCR.
Cell lines culture and lentivirus transfection
B16 is a C57BL/6 mouse melanoma cell line, and MC38 is a C57BL/6 mouse colon cancer cell line. These cell lines were provided by the laboratory of Shandong Provincial Hospital Center. B16 and MC38 cells were cultured at 37°C in an incubator with 5% CO2 in DMEM-H supplemented with 10% foetal bovine serum, 100 units/mL penicillin and 100 µg/mL streptomycin. The cells were routinely tested to confirm the absence of mycoplasma contamination and were cultured for a limited number of generations.
Knockdown lentivirus (sh-SEMA4D) and the negative control (sh-NC) were purchased from Genomeditech Inc. (Shanghai, China), Before infection, B16 cells were seeded in 6-well plates overnight, and then 1 ml fresh medium containing lentivirus (MOI:50-100) was added to each well. After 72 h, the successfully transfected cells were then screened with 2 μg/mL puromycin. Western blot and qRT-PCR were adopted to evaluate the transfection efficiency. All target site sequence, primers sequence and antibody were listed in Supplementary Table 1. The verification results were shown in Supplementary Figure 2.
Mice and in vivo experiment
Six- to eight-week-old female C57BL/6 mice were supplied by Charles River (Beijing China) and raised in the Animal Center of Shandong Provincial Hospital. All animal experiments were approved by the Committee for Ethics of Animal Experiments of Shandong Provincial Hospital and complied with China’s current regulations and standards for the use of laboratory animals.
MC38 and B16 cells (1 × 10⁶) were collected within limited passages and then injected into the right back of mice in 100 µL of PBS(n=6~9). Tumor growth was observed after 5 days. Mice were euthanized after 14 days, and the tumors were collected for subsequent experiments.
B16 cells transfected with SEMA4D knockdown or control lentivirus subcutaneously injected into the right back of C57 mice (n=5). Tumor volumes were measured every other day starting after 5 days and the mice were euthanized after 14 days.
RT–qPCR
Total RNA was isolated with Total RNA Extraction Reagent (Vazyme, China). Total RNA was reverse transcribed into cDNAs with a reverse transcription kit (Vazyme, China) and ChamQ Universal SYBR qPCR Master Mix for qPCR (Vazyme, China). The RT–qPCR primer sequences were as follows: β-actin, forward primer: 5’-CATGTACGTTGCTATCCAGGC-3’; reverse primer: 5’-CTCCTTAATGTCACGCACGAT-3’; and SEMA4D forward primer: 5’- GGAGCTCTGCACAAAGCCATC-3’, reverse primer: 5’-GCCCGAGTTAGAGCCAGCATAG-3’.
Flow cytometry
Samples were obtained from blood, spleen, or tumors, as indicated. Tumor samples were weighed after harvest and digested/dissociated, and total cells were counted. Excess surface marker antibodies were mixed with cells and incubated at 4°C for 30 min. After treatment with the Cyto-Fast™ Fix/Perm Buffer Set (Biolegend 426803) or Foxp3/Transcription Factor Staining Buffer Set (Invitrogen 00-5523-00), intracellular markers or Nucleoprotein were stained with the corresponding antibodies. The panel included the following reagents: Zombie NIR™ Fixable Viability Kit, anti-CD45 (Biolegend 103128), anti-CD3 (Biolegend 100203) anti-CD4 (Biolegend 100539), anti-CD8a (Biolegend 100711), anti-CD100 (BD 745346), IgG2a,κ Isotype Control (BD 563236), anti-CD11B (Biolegend 101255), anti-F4/80 (Biolegend 123135), anti-CD11C (Biolegend 117317), anti-CD86 (Biolegend 105037), and anti-CD206 (Biolegend 141706), anti-PD-1 (Biolegend 135227), anti-LAG-3 (Biolegend 125209), anti-TIM-3 (Biolegend 119717), anti-TIGIT (Biolegend 142111).
IHC
IHC assays were performed using paraffin-embedded COAD and matched normal tissues. An IHC kit (Zsgb Bio, Beijing, China) was used for IHC staining. Briefly, sections were stained with 3,3-diaminobenzidine tetrahydrochloride (DAB) and haematoxylin reagent after sequential incubations with primary (Abcam, ab134128, China) and secondary antibodies. The amount and intensity of staining in three fields of view were evaluated using a microscope (Olympus, Tokyo, Japan) at 200× magnification to score the IHC staining. Each field of view was scored for staining intensity and percentage of positive cells, and the overall score was the product of the staining intensity score and cell positivity score (staining intensity score: 0 for no staining, 1 for pale yellow staining, 2 for pale brown staining, and 3 for brown staining; cell positivity score: 0 to 5% was assigned 0 points, 6% to 25% was assigned 1 point, 26% to 50% was assigned 2 points, 51% to 75% was assigned 3 points, and >75% was assigned 4 points).
Statistical analysis
The log2 transformation was used to normalize all gene expression data. Two sets of t tests were employed to compare normal and malignant tissues. Differences between multiple groups were assessed using one-way analysis of variance (ANOVA) (normal data) or the Kruskal–Wallis test (nonnormal distribution). Spearman’s or Pearson’s test was used to examine the correlation between two variables. Statistical significance was defined as p < 0.05. All statistical analyses were performed using R software (version 3.6.3) and GraphPad Prism 9.0.0 software.
Spearman’s correlation analysis was used to assess the correlation between SEMA4D expression and immune checkpoint genes. R > 0.20 was considered positively correlated, and p < 0.05 was considered statistically significant (*: p value < 0.05, **: p value <0.01, and ***: p value <0.001).
Results
Tissue expression of SEMA4D across cancers
Lu et al. analyzed the expression of SEMA4D mRNA in normal and tumor tissues (2). To further verify the results, we assessed the expression of SEMA4D at the protein level in normal and cancerous tissues using the HPA database. Normal and tumor tissues were stained with the same antibody for IHC, and differential expression of SEMA4D was analyzed to ensure accurate results. As shown in Figure 1, our IHC results demonstrated that SEMA4D was expressed at significantly higher levels in multiple cancer types, including liver cancer, endometrial cancer, colon cancer, breast cancer, skin melanoma, lung cancer, renal cancer, testicular cancer, ovarian cancer, lymphoma, head-neck squamous cell carcinoma, pancreatic cancer, and glioma, compared to the respective normal tissues (n=3).
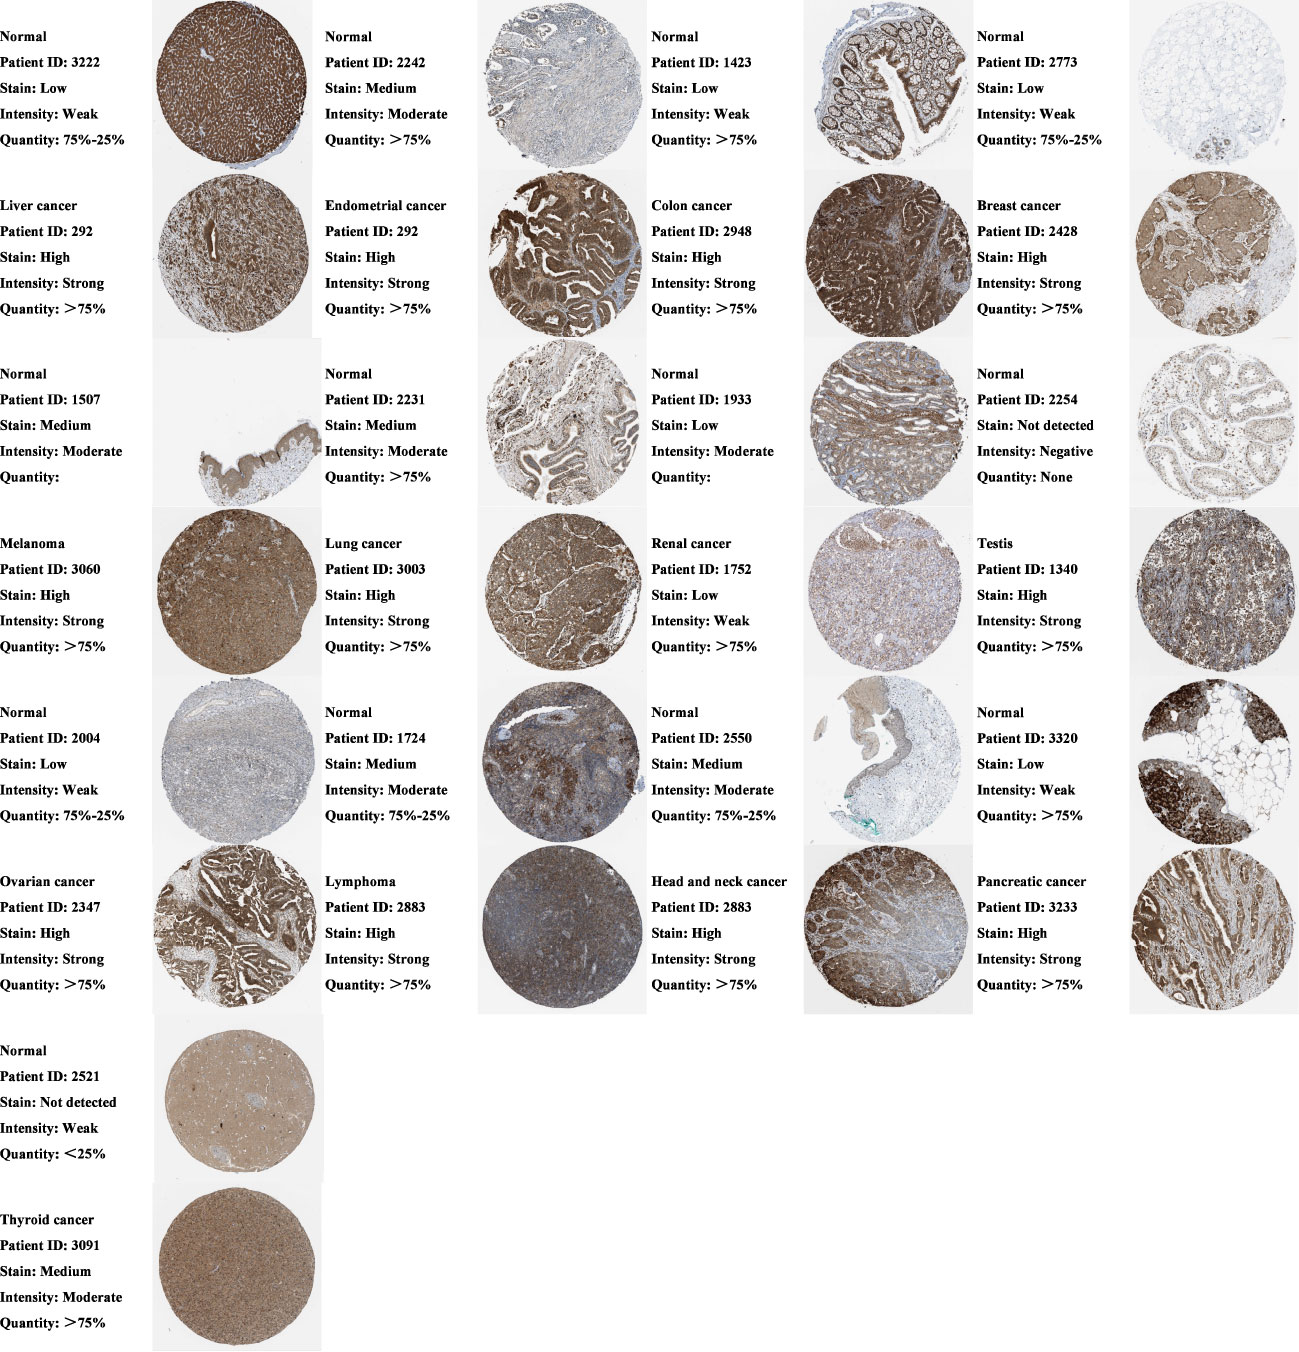
Figure 1 Protein expression of SEMA4D is increased in cancer tissues. Comparison of SEMA4D protein expression between normal and tumor tissues across cancers using IHC in Human Protein Atlas (HPA). The image on the right shows the raw IHC staining data, and on the left is the result of the expert scoring the image based on what was mentioned in the part of methods. Representative patterns are shown above, and the remaining replicates are shown in the Supplementary Materials (n=3).
We further analyzed the expression levels of SEMA4D in early and advanced stages of various tumors to investigate its potential role in tumor progression. Analysis of TCGA data revealed that SEMA4D was not expressed at higher levels in late stages compared to early stages in all tumor types examined. However, SEMA4D expression was significantly higher in early-stage lung adenocarcinoma (LUAD), skin cutaneous melanoma (SKCM) and testicular germ cell tumors (TGCT) tissues than in late stages, as shown in Figure S1.
Primary source of SEMA4D in the TME
To identify the primary source of SEMA4D in the tumor microenvironment (TME), we conducted a single-cell RNA sequencing (scRNA-seq) transcriptome analysis of 15 independent datasets of 9 tumors with high SEMA4D expression. We excluded non-compliant databases (immunotherapy or chemoradiotherapy, other species and inconsistent sequencing methods) and used TISCH to mine the scRNA-seq data. We then reduced the dimension of single cell and cell type data and used a two-dimensional UMAP map to show the expression of SEMA4D in different cell types in the TME. Figure 2A shows representative data sets for different tumor types. Different cell types were marked with different colors on the left side of the image, and the expression of SEMA4D corresponding to different cell types was shown on the right side. The heatmap in Figure 2B shows the expression of SEMA4D in different cell types across multiple datasets.
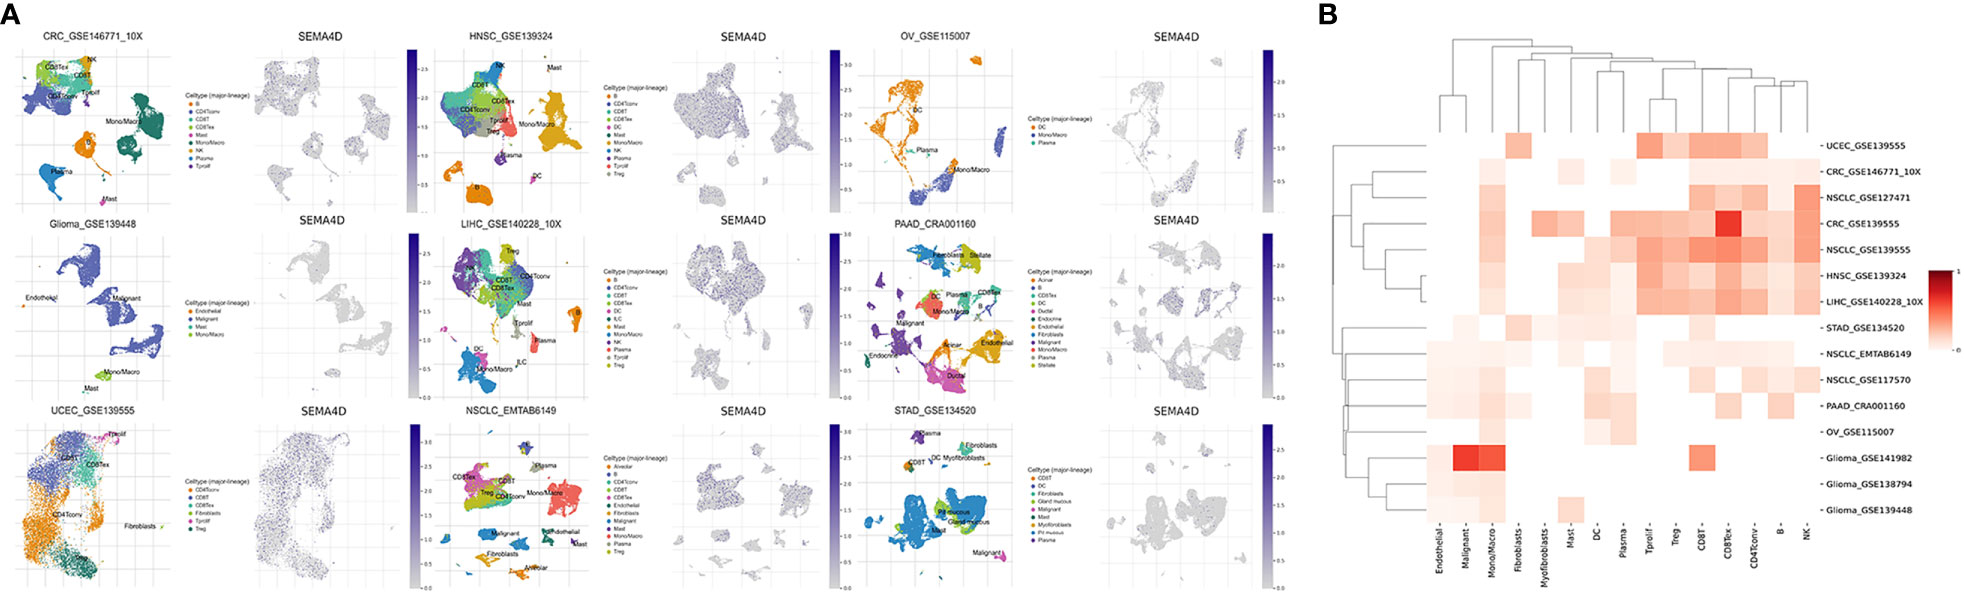
Figure 2 SEMA4D in tumors is mainly derived from TME. The distribution in the TME of tumors with high expression of SEMA4D was shown as above. (A) Two UMAP map with cells colored by cell type (left side) and SEMA4D expression level (right side) are displayed for representative datasets. (B) The heatmap shows SEMA4D expression in different cell types across all eligible datasets. Darker red indicates higher expression of SEMA4D in these immune cells in this dataset. The selected datasets were CRC_GSE139555, CRC_GSE146771_10X, Glioma_GSE138794, Glioma_GSE139448, Glioma_GSE141982, HNSC_GSE139324, LIHC_GSE140228_10X, NSCLC_EMTAB6149, NSCLC_GSE117570, NSCLC_GSE127471, NSCLC_GSE139555, OV_GSE115007_SEMA4D, PAAD_CRA001160, STAD_GSE134520 and UCEC_GSE139555).
Our analysis revealed that SEMA4D was commonly expressed in immune cells. Specifically, it was most widely expressed in macrophages in multiple cancer types, such as colorectal cancer (CRC), non-small cell lung cancer (NSCLC), head and neck squamous cell carcinoma (HNSC), liver hepatocellular carcinoma (LIHC), pancreatic adenocarcinoma (PAAD), ovarian cancer (OV), and glioma. Moreover, SEMA4D was significantly enriched in T cells of various tumors, including CD8+ T cells, CD4+ conventional T cells (conv), and proliferating T cells (Tprolif). SEMA4D was also highly expressed in regulatory T cells (Tregs) and exhausted CD8+ T cells (CD8+ Tex) in NSCLC, CRC, HNSC, and LIHC, indicating that SEMA4D may suppress the immune effect of T cells.
Relationship between SEMA4D expression and immune cell infiltration in diverse tumors
The results of our study suggest a potential role of SEMA4D in immune function during tumor development. To explore this further, we analyzed the correlation between SEMA4D expression and the immune score and interstitial score in different tumors. As depicted in Figure 3A, SEMA4D expression was positively correlated with the immune score in 20 tumors. Notably, SEMA4D expression was strongly positively correlated with immune cell infiltration in SKCM and moderately positively correlated with immune cell infiltration in HNSC, acute myeloid leukaemia (LAML), LUAD, PAAD, sarcoma (SARC), stomach adenocarcinoma (STAD), uveal melanoma (UVM), breast invasive carcinoma (BRCA), cholangio carcinoma (CHOL), lymphoid neoplasm diffuse large B-cell lymphoma (DLBC), LIHC, TGCT, and thymoma (THYM). Additionally, cervical squamous cell carcinoma and endocervical adenocarcinoma (CESC), COAD, Kidney renal clear cell carcinoma (KIRC), Lung squamous cell carcinoma (LUSC), prostate adenocarcinoma (PRAD), and thyroid carcinoma (THCA) showed a weak positive correlation. These findings indicate that tumors with high SEMA4D expression are associated with a higher number of immune cells. Moreover, SEMA4D expression was positively correlated with stromal score in 6 tumor types, including LIHC, LUAD, LUSC, SKCM, THYM, and UVM, as shown in Figure 3B.
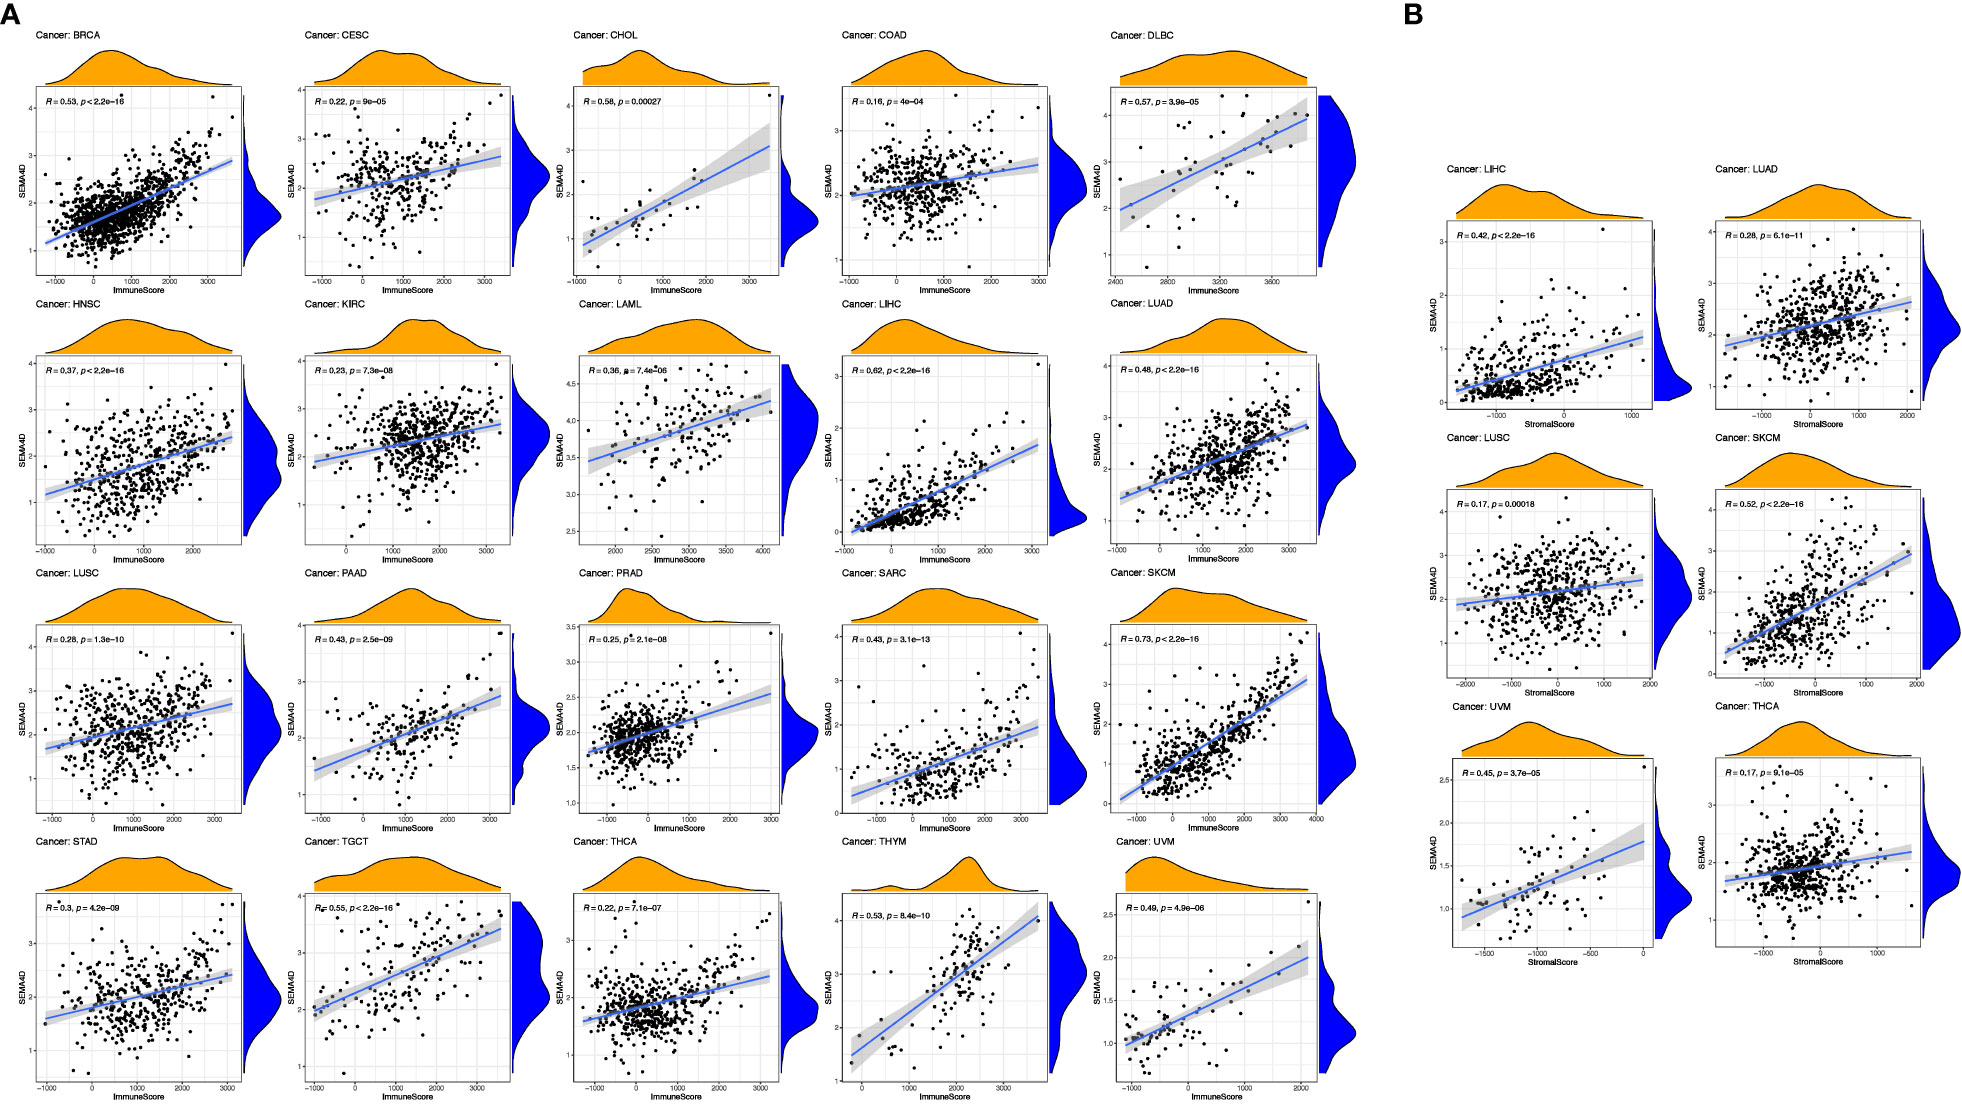
Figure 3 The high expression of SEMA4D was positively correlated with immune score and stromal scores. Correlation of SEMA4D expression with immune (A) and stromal scores (B) was displayed as above. SEMA4D expression showed positive correlation with immune cell infiltration in SKCM, HNSC, LAML, LUAD, PAAD, SARC, STAD, UVM, BRCA, CHOL, DLBC, LIHC, TGCT, THYM, CESC, COAD, KIRC, LUSC, PRAD and THCA. Meanwhile, in 6 tumor types, LIHC, LUAD, LUSC, SKCM, THYM and UVM, SEMA4D expression was positively correlated with stromal score.
Next, we investigated the relationship between SEMA4D expression and infiltrating immune cells in the immune microenvironment using CIBERSORT, as shown in Figure 4. We found that SEMA4D was closely related to immune cell infiltration, and cluster analysis revealed three distinct clusters of immune cells, which were combined into two categories for practicality. Our analysis showed that a large fraction of immune cell types were highly enriched in cancer, including follicular helper T cells (26/34), CD8+ T cells (25/34), M1 macrophages (23/34), M2 macrophages (28/34), CD4+ memory resting T cells (24/34), activated NK cells (21/34), and regulatory T cells (24/34). Notably, one cluster of tumors showed a negative correlation between immune cell infiltration and SEMA4D expression, and these tumors were mostly found in the central nervous system or had low expression of SEMA4D itself. In summary, our findings indicate that SEMA4D expression is closely associated with the infiltration of multiple immune cell components in the tumor microenvironment.
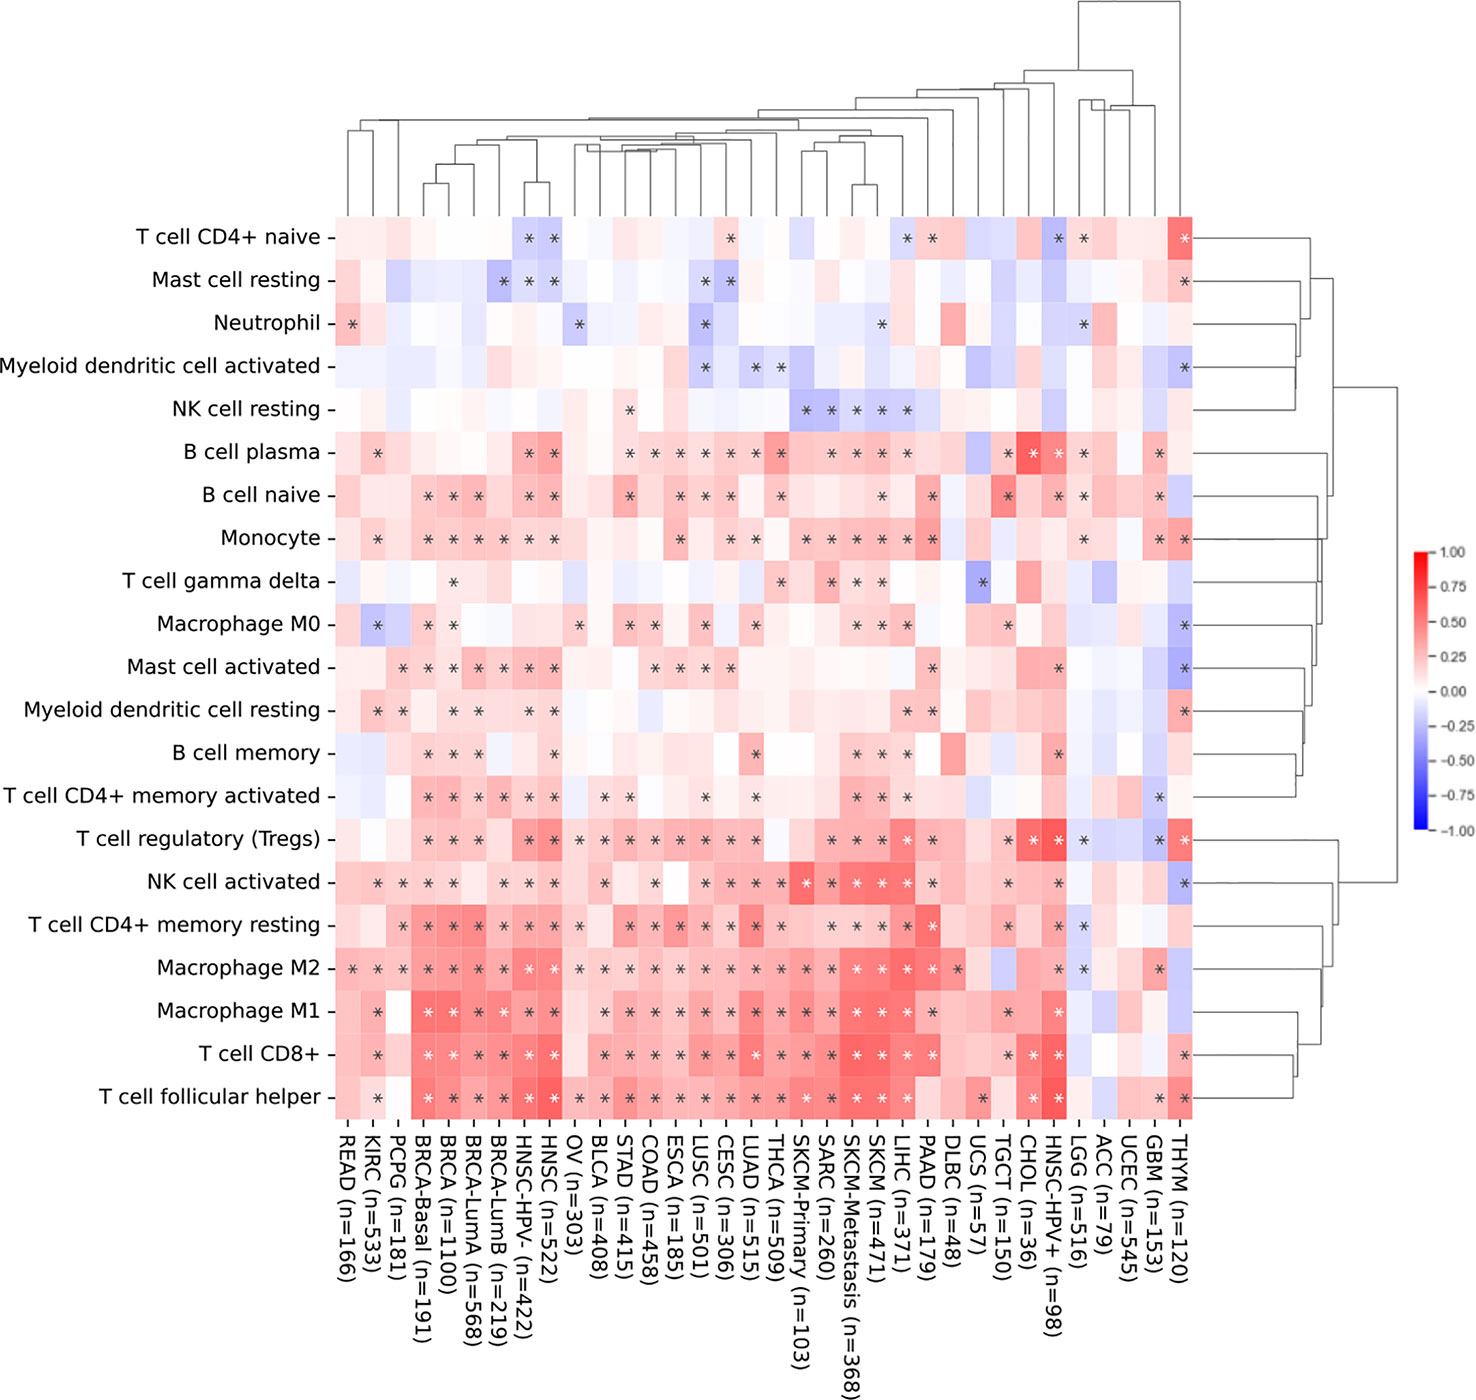
Figure 4 The infiltration of immune cell in the TME and SEMA4D expression are positively correlated in most cancers. Correlation analysis of SEMA4D expression and the infiltration of 21 immune cell types across different types of cancer from TCGA using CIBERSORT. The pattern shows the correlation between the number of immune cells and the expression of SEMA4D in TME. Red color means positive correlation between the number of immune cells and SEME4D, blue color means negative correlation between immune cells and SEMA4D expression, and the darker the color the stronger the correlation. The * in the diagram represents p value <0.05.
Correlation of SEMA4D expression with immune checkpoints, TMB and MSI
To investigate the relationship between SEMA4D expression and immune checkpoints, we analyzed the expression of 47 commonly used immune checkpoints in 20 different types of tumors (Figure 5). SEMA4D expression was broadly correlated with immune checkpoints, with more than 40 immune checkpoints showing a significant correlation with SEMA4D expression in the 13 tumors with the highest correlation. SEMA4D expression was significantly correlated with PDCD1 (PD1) and CD274 (PDL1) expression in most tumors. Additionally, SEMA4D expression exhibited a broad correlation with the expression of other immune checkpoints, including CD28, BTLA, CD160, HAVCR2, LAG3, CTLA4, LAIR1, VSIR, CD200R, TIGIT, CD244, TNFRSF9, ADORA2A, ICOS, TNFSF14, and CD27. The results suggest that blocking SEMA4D may enhance the efficacy of anti-PD1 and other immune checkpoint inhibitors. As SEMA4D was found to be associated with T cell exhaustion in the single-cell analysis shown in Figure 2, we further investigated the correlation between SEMA4D expression and CD8+ T cell exhaustion checkpoints (e.g., TIGIT, LAG3, TIM3, and PD1) in the 13 highly expressed SEMA4D tumor types (Figure 6). The results showed that except for brain lower grade glioma (LGG), SEMA4D expression was significantly positively correlated with CD8+ T cell exhaustion checkpoints.
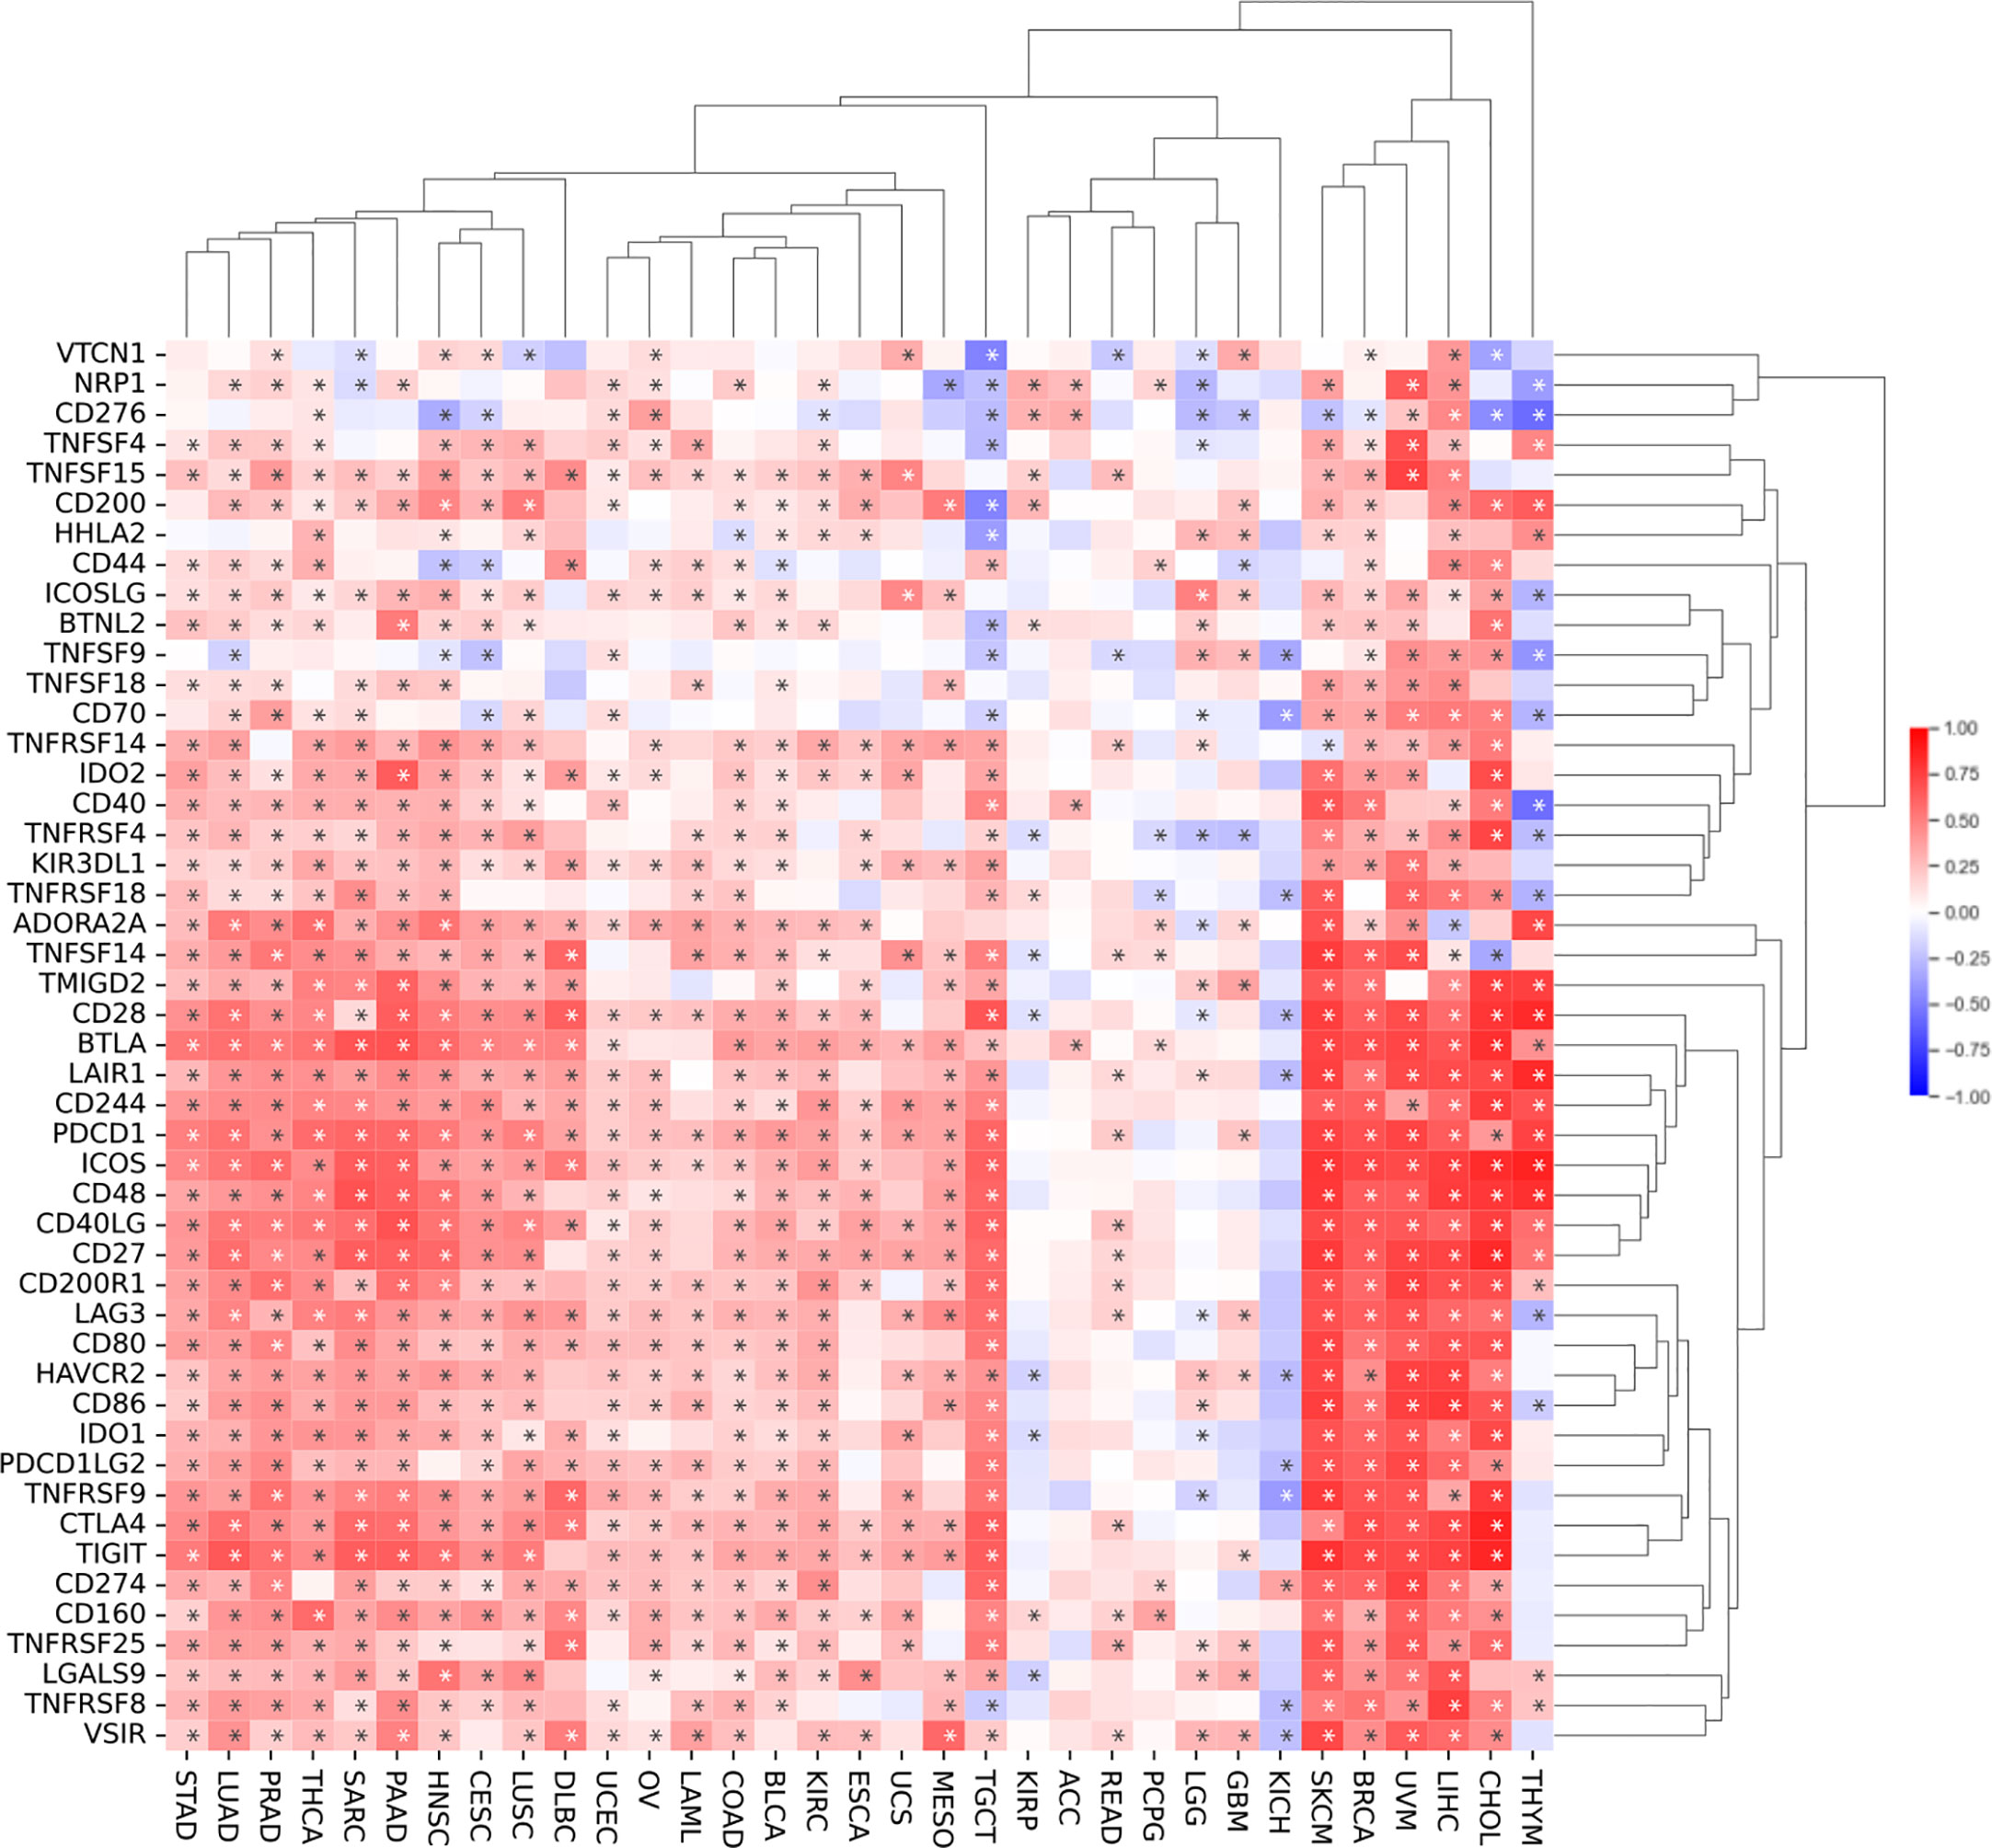
Figure 5 SEMA4D expression is broadly correlated with immune checkpoints. The pattern shows correlation analysis of SEMA4D expression and 47 immune checkpoint genes across cancers. SEMA4D was associated with more than 40 immune checkpoints in 13 tumors. Red color means positive correlation between checkpoints and SEME4D, blue color means negative correlation between checkpoints and SEMA4D expression, and the darker the color the stronger the correlation. The * in the diagram represents p value <0.05.
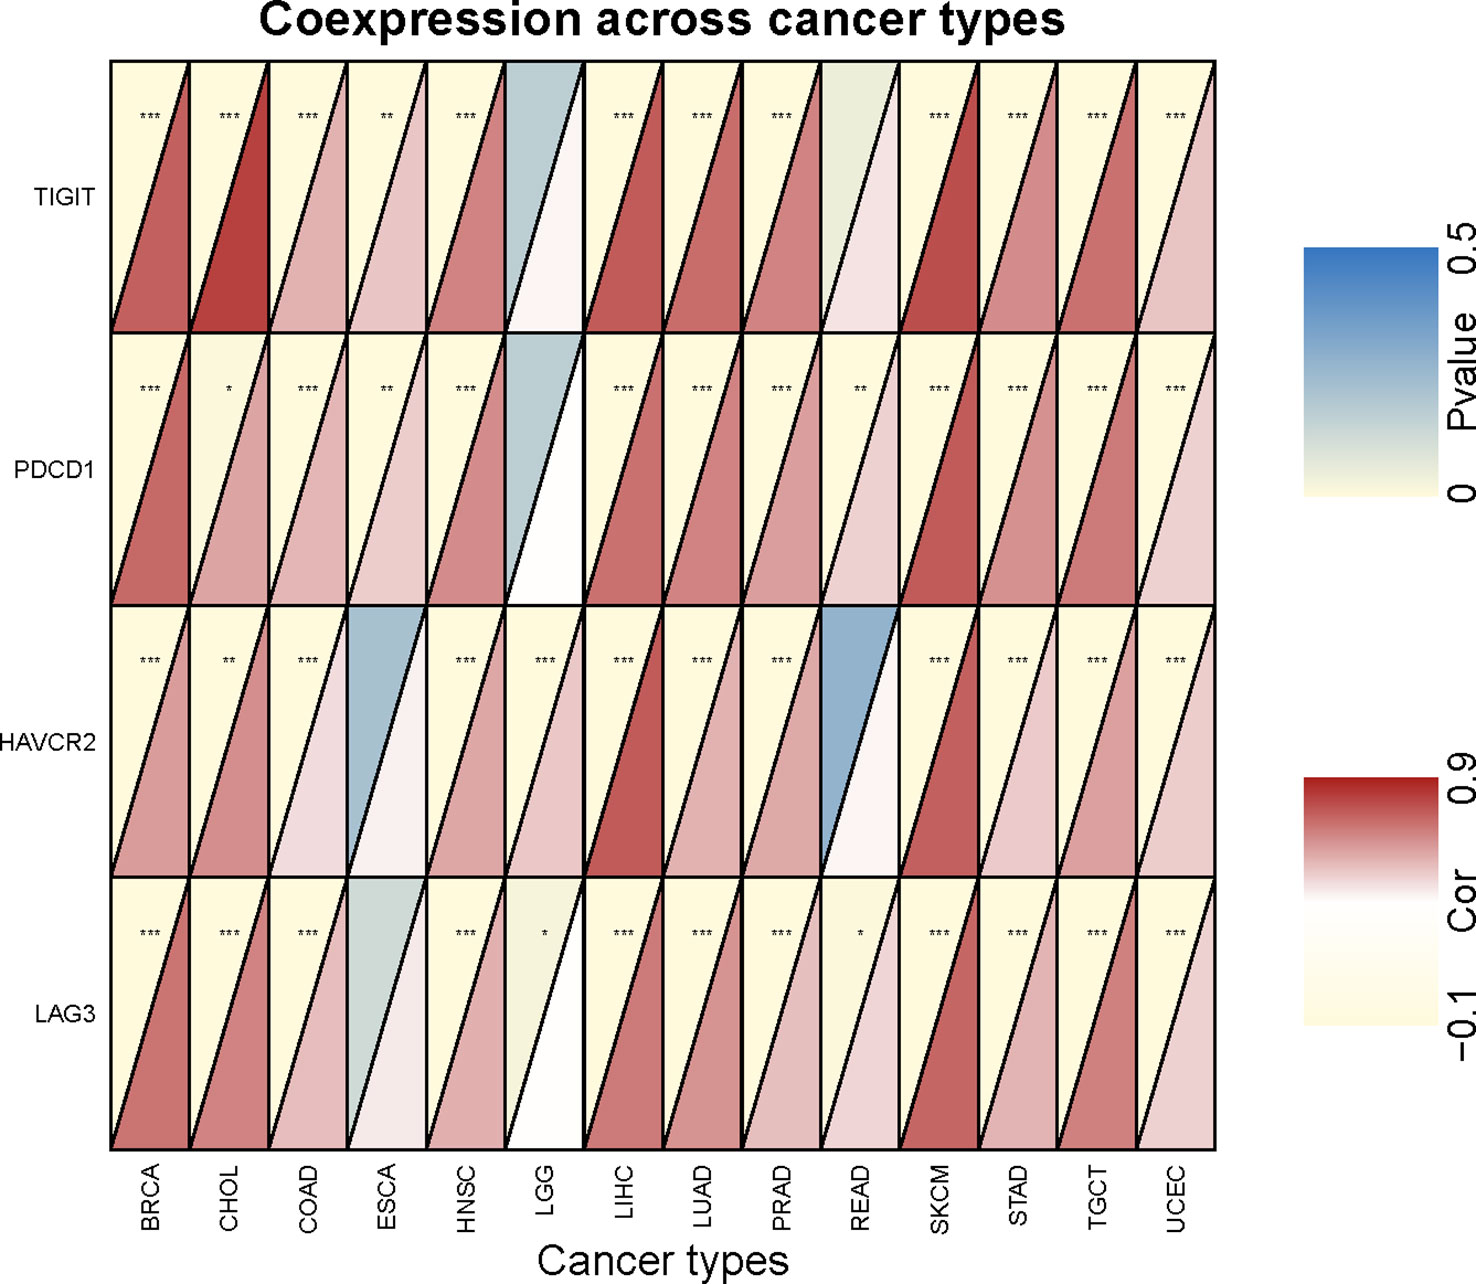
Figure 6 Correlation analysis of SEMA4D expression and CD8+ Tex signature checkpoint genes. The red depth in the lower right triangle of an individual rectangle represents the correlation between SEMA4D and the corresponding checkpoint in this type of tumor. *p < 0.05, **p < 0.01, and ***p < 0.001.
Next, we analyzed the correlation of SEMA4D expression with TMB and MSI. The results showed that SEMA4D expression was negatively correlated with TMB in most tumors, including DLBC, KIRC, LGG, LIHC, LUSC, THCA, and THYM, but was positively correlated with TMB in bladder urothelial carcinoma (BLCA), BRCA, and uterine corpus endometrial carcinoma (UCEC) (Figure 7A). SEMA4D expression was negatively correlated with MSI in most tumors, including LIHC, mesothelioma (MESO), PAAD, rectum adenocarcinoma (READ), SKCM, TGCT, and UCS, but was positively correlated with MSI in BRCA, CESC, LUAD, and UCEC (Figure 7B). These results suggest that the low TMB and MSI associated with low tumor neoantigen levels may be part of the immunosuppressive function exerted by SEMA4D.
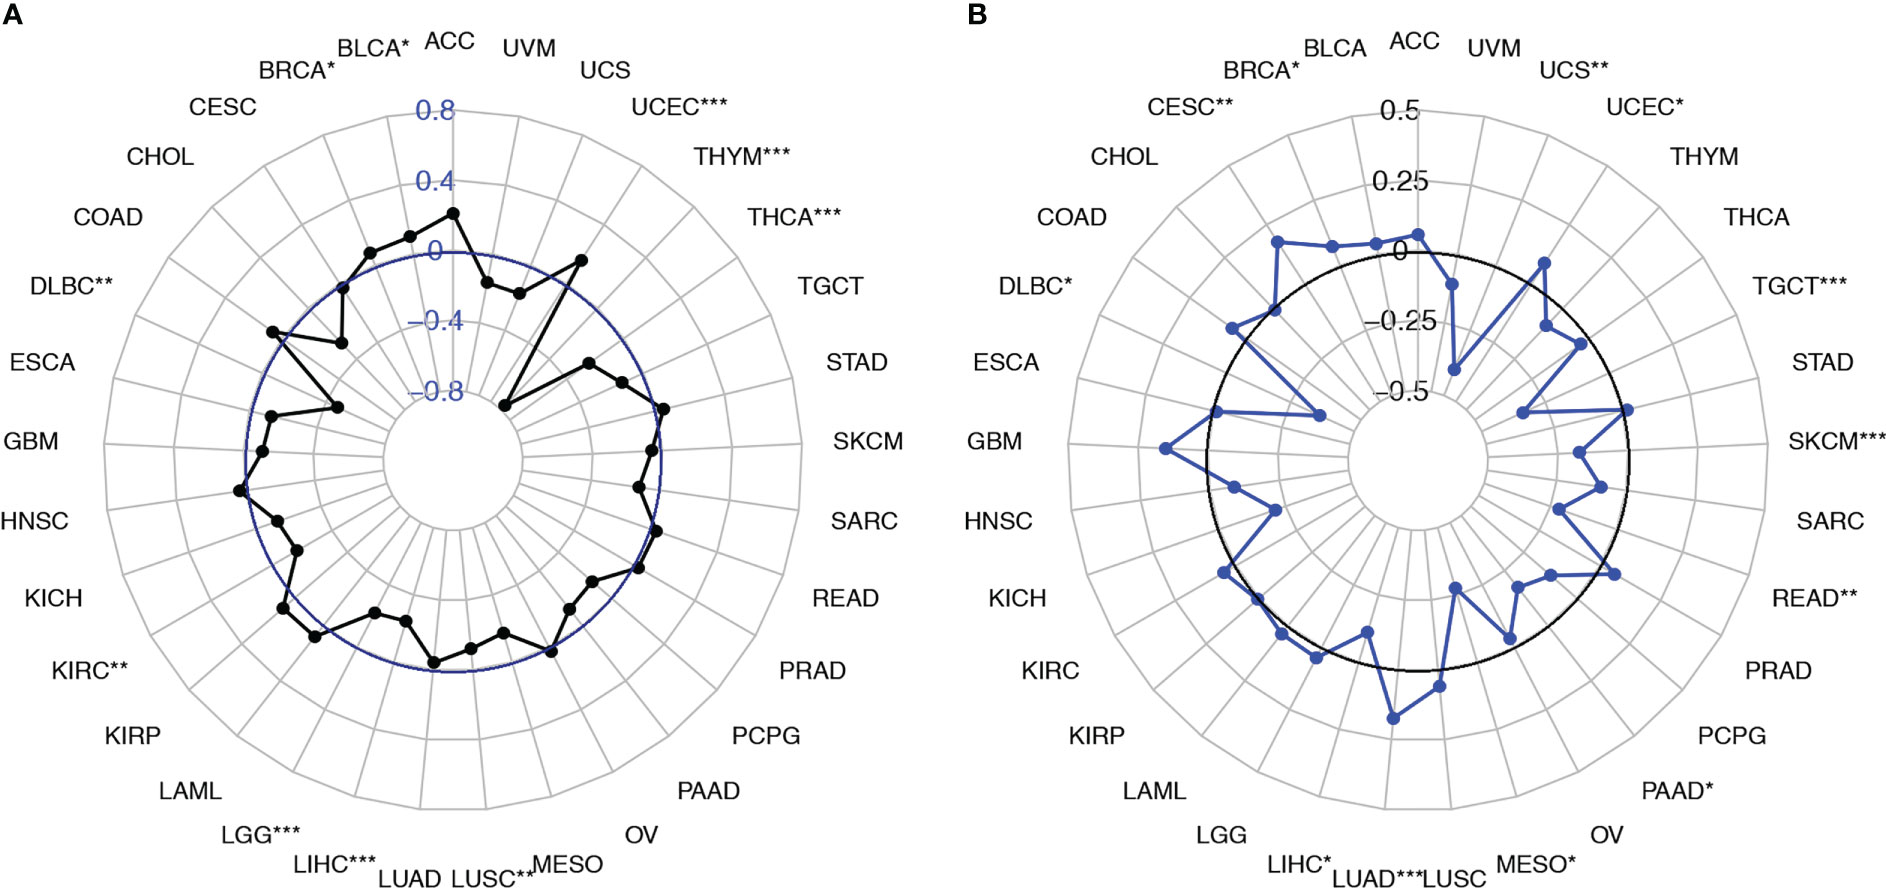
Figure 7 SEMA4D expression was correlated with the TMB and MSI. (A) Radar plots were constructed to show the correlation between SEMA4D expression and the TMB. The blue value represents the range, and the black curve represents the correlation coefficient. (B) Radar plots were constructed to show the correlation between SEMA4D expression and MSI. The black value represents the range, and the blue curve represents the correlation coefficient. *p < 0.05, **p < 0.01, and ***p < 0.001.
Validation of differential SEMA4D expression and distribution across cancers in TME
We verified the expression of SEMA4D in tumors. We randomly selected 28 patients who were first diagnosed with colon cancer based on pathology in the Gastrointestinal Surgery Department of Shandong Provincial Hospital in September 2020 (excluding patients with chronic diseases or other malignant tumors and those who had received neoadjuvant chemoradiation). The cancer tissues and para carcinoma tissues from each patient were collected for IHC staining and RT–qPCR to explore the expression of the SEMA4D protein and mRNA. The results of RT–qPCR showed that the level of SEMA4D mRNA in tumor tissues was significantly higher than that in adjacent tissues (p=0.0269) (Figure 8A), and IHC staining proved that SEMA4D protein was also highly expressed in tumors (p<0.0001) (Figures 8B, C).
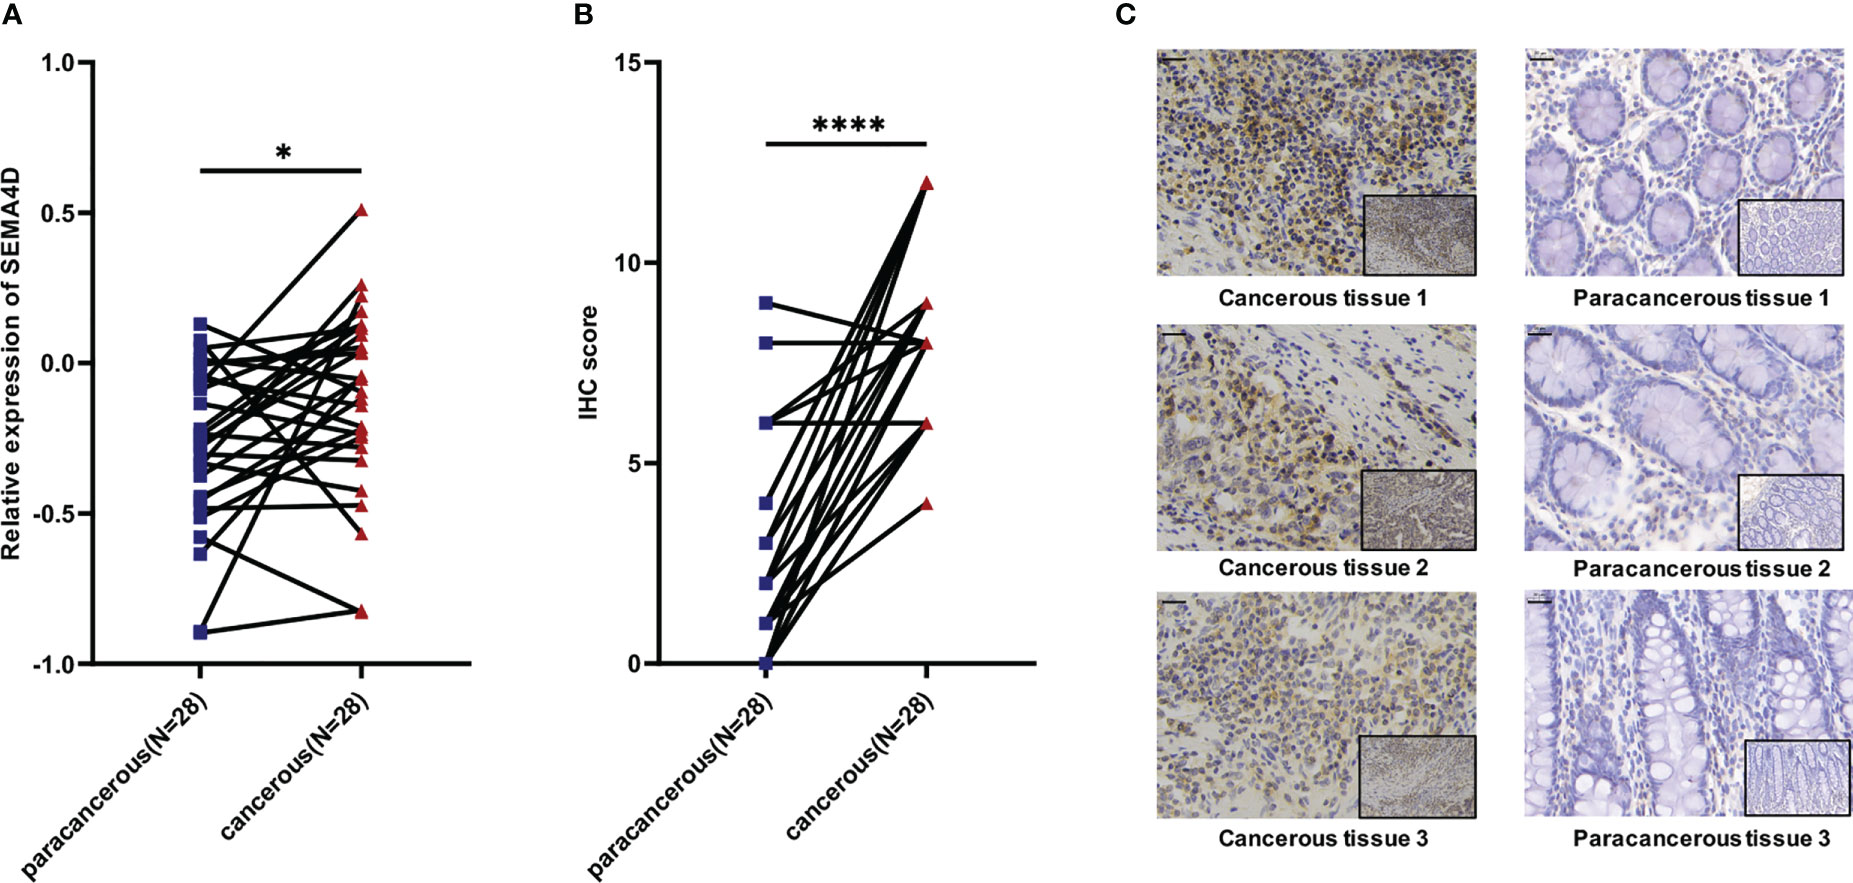
Figure 8 Expression of SEMA4D was higher in colorectal cancer than in normal colorectal tissue in clinical samples. (A) Relative expression of SEMA4D in 28 paired COAD cancerous tissues and paracancerous tissues determined using RT–qPCR. (B) IHC scores for SEMA4D in COAD tissues and paired normal tissues. (C) Representative images of IHC staining for SEMA4D in negative and positive samples were captured at 200x magnification on the bottom and 400x magnification on the top. Scale bar, 20 μm (top left corner). Data are shown as the means ± SD and were analyzed using Student’s t test and paired-samples t test. *p < 0.05, ****p < 0.0001.
To explore the distribution of SEMA4D on immune cells, B16 and MC38 cells were implanted into female C57BL/6 mice (n=7-9) to specifically identify the cells expressing SEMA4D within the TME. Tumors were isolated for FCM analysis of SEMA4D+ cells after 14 days (Figure 9A). Consistent with the results from scRNA-seq datasets, SEMA4D expression was mainly observed in immunocytes. 89.62% ± 6.95% and 52.09% ± 12.91% immune cells showed SEMA4D staining in MC38 tumors and B16 tumors, respectively (Figure 9B).
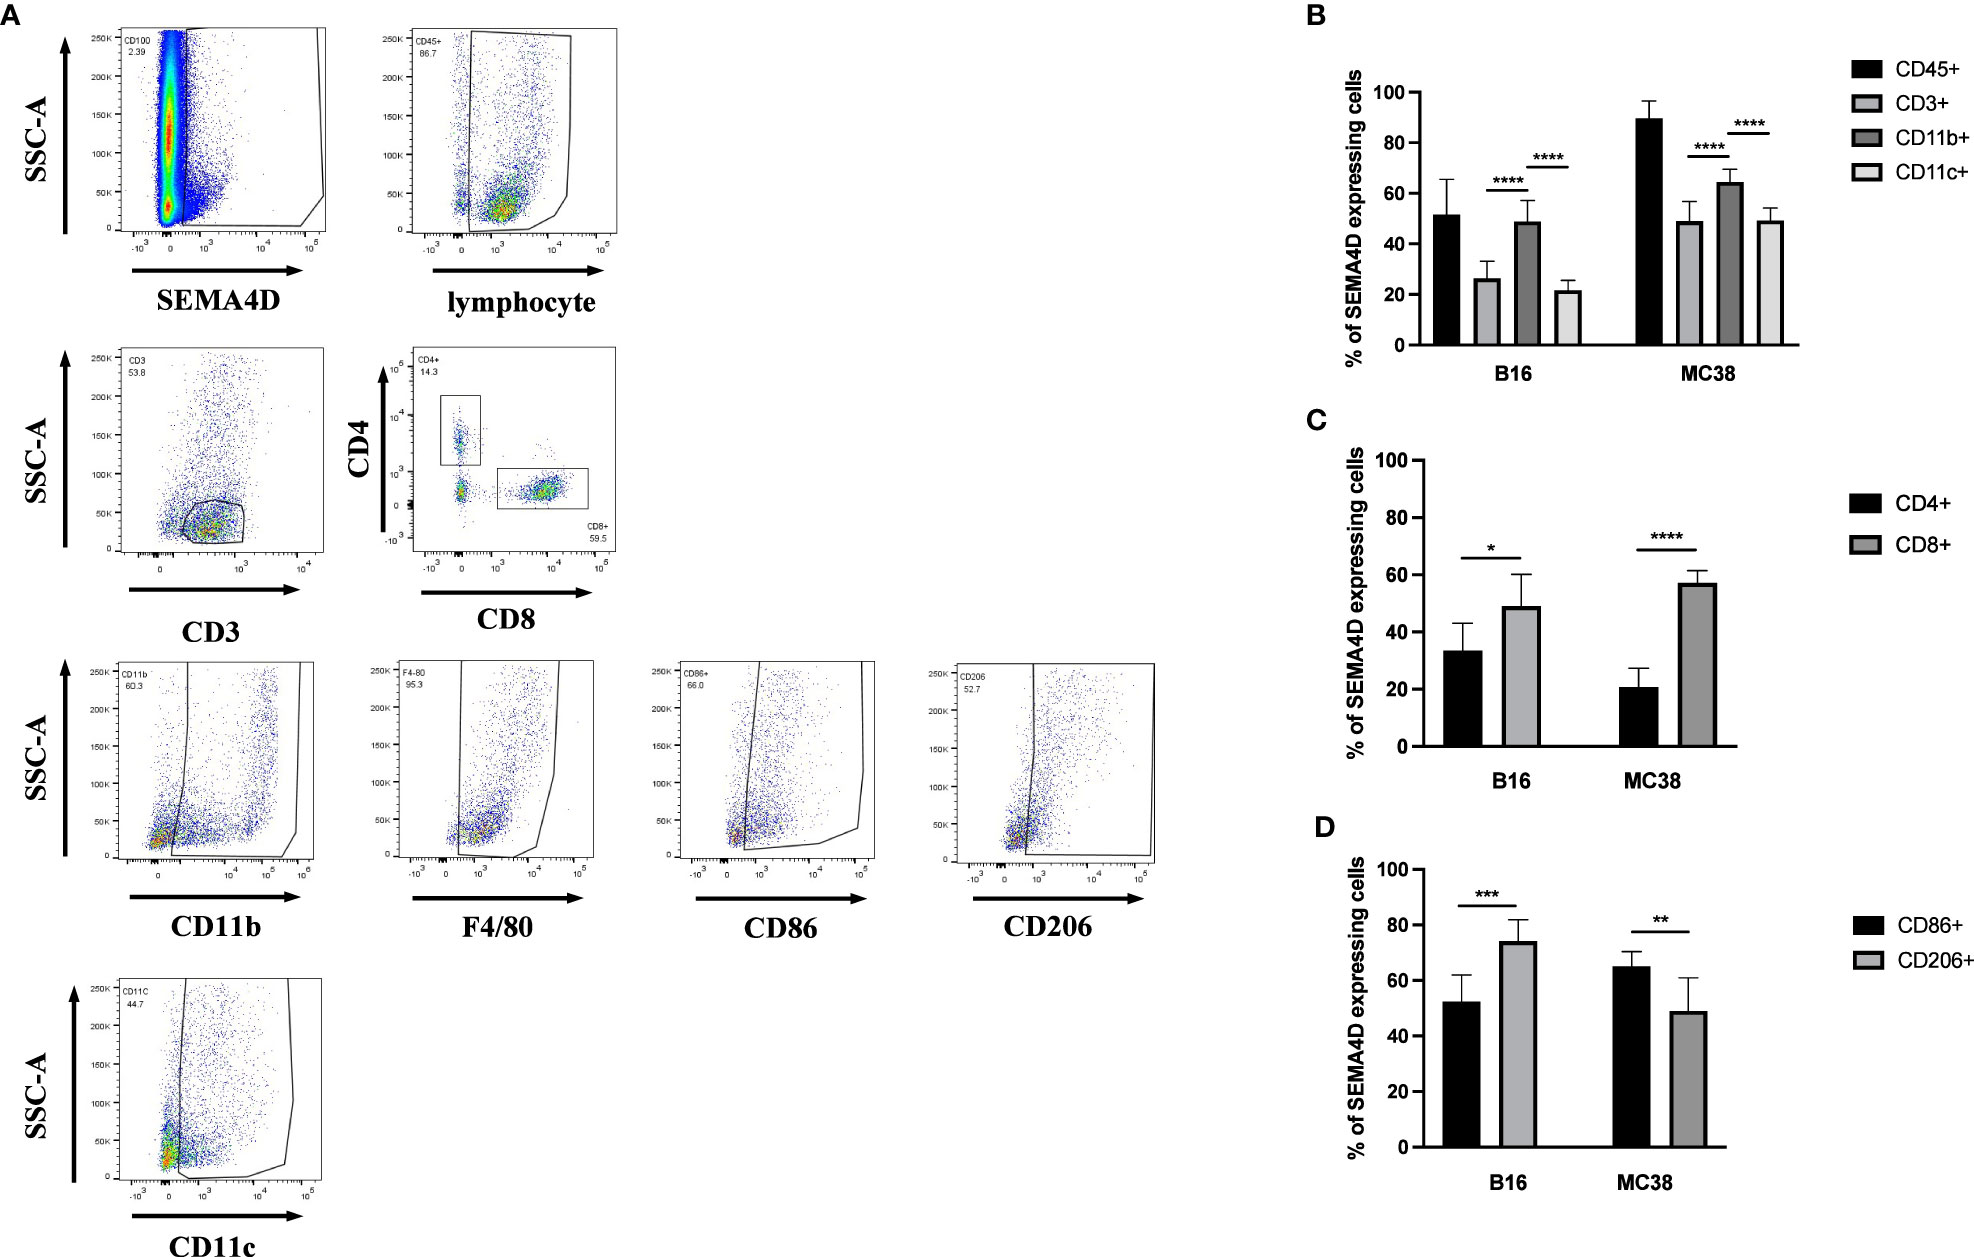
Figure 9 In MC38 and B16 subcutaneous transplantation tumor models in C57 mice, the primary source of SEMA4D was CD45+ cells. FCM analysis of SEMA4D expressing cells in MC38 tumors and B16 tumors isolated from C57BL/6 mice at 14 d postimplantation. (A) shows and describes the gating strategy for specimens and (B–D) is the result after quantifying. Bars show the means ± SD from n = 7–9 mice per group. *p < 0.05, **p < 0.01, ***p < 0.001, and ****p < 0.0001.
We further analyzed the proportion of SEMA4D-positive cells in MC38 and B16 tumors, and the composition of SEMA4D+ cells in MC38 tumors was similar to that observed in B16 tumors. Among immune cells, myeloid cells (CD11B+) accounted for large proportions, including 49.47% ± 7.69% in B16 tumors (n=7) and 64.46% ± 5.10% in MC38 tumors (n=9) (Figure 9B). We also identified the cells expressing SEMA4D within several different categories of immune cells. The source of SEMA4D in CD3+ cells was predominantly CD8+ T cells in both B16 (47.47% ± 10.92%) and MC38 (57.19% ± 4.27%) tumors (Figure 9C). Among TAM (CD11B+ F4/80+), the distribution of SEMA4D was distinguished, with a greater proportion of M2 macrophages (CD206+) observed in B16 tumors (M1 = 52.37% ± 8.69%, M2 = 75.1% ± 7.36%), while a greater proportion of M1 macrophages (CD86+) was observed in MC38 tumors (M1 = 65.08% ± 5.31%, M2 = 49.02% ± 11.93%), and both differences were statistically significant (P<0.01) (Figure 9D).
Inhibition of SEMA4D rescues T cell exhaustion
To investigate the functions of SEMA4D in the TME, we designed an in vivo experiment to test whether SEMA4D knockdown could rescue T cell exhaustion. We used lentiviral transfection to knock down SEMA4D in the B16 cell line and injected the cells subcutaneously into the back of C57 mice (n=5). Compared with the control group, we observed that tumor growth was significantly slower in the SEMA4D knockdown group (Figure 10A).
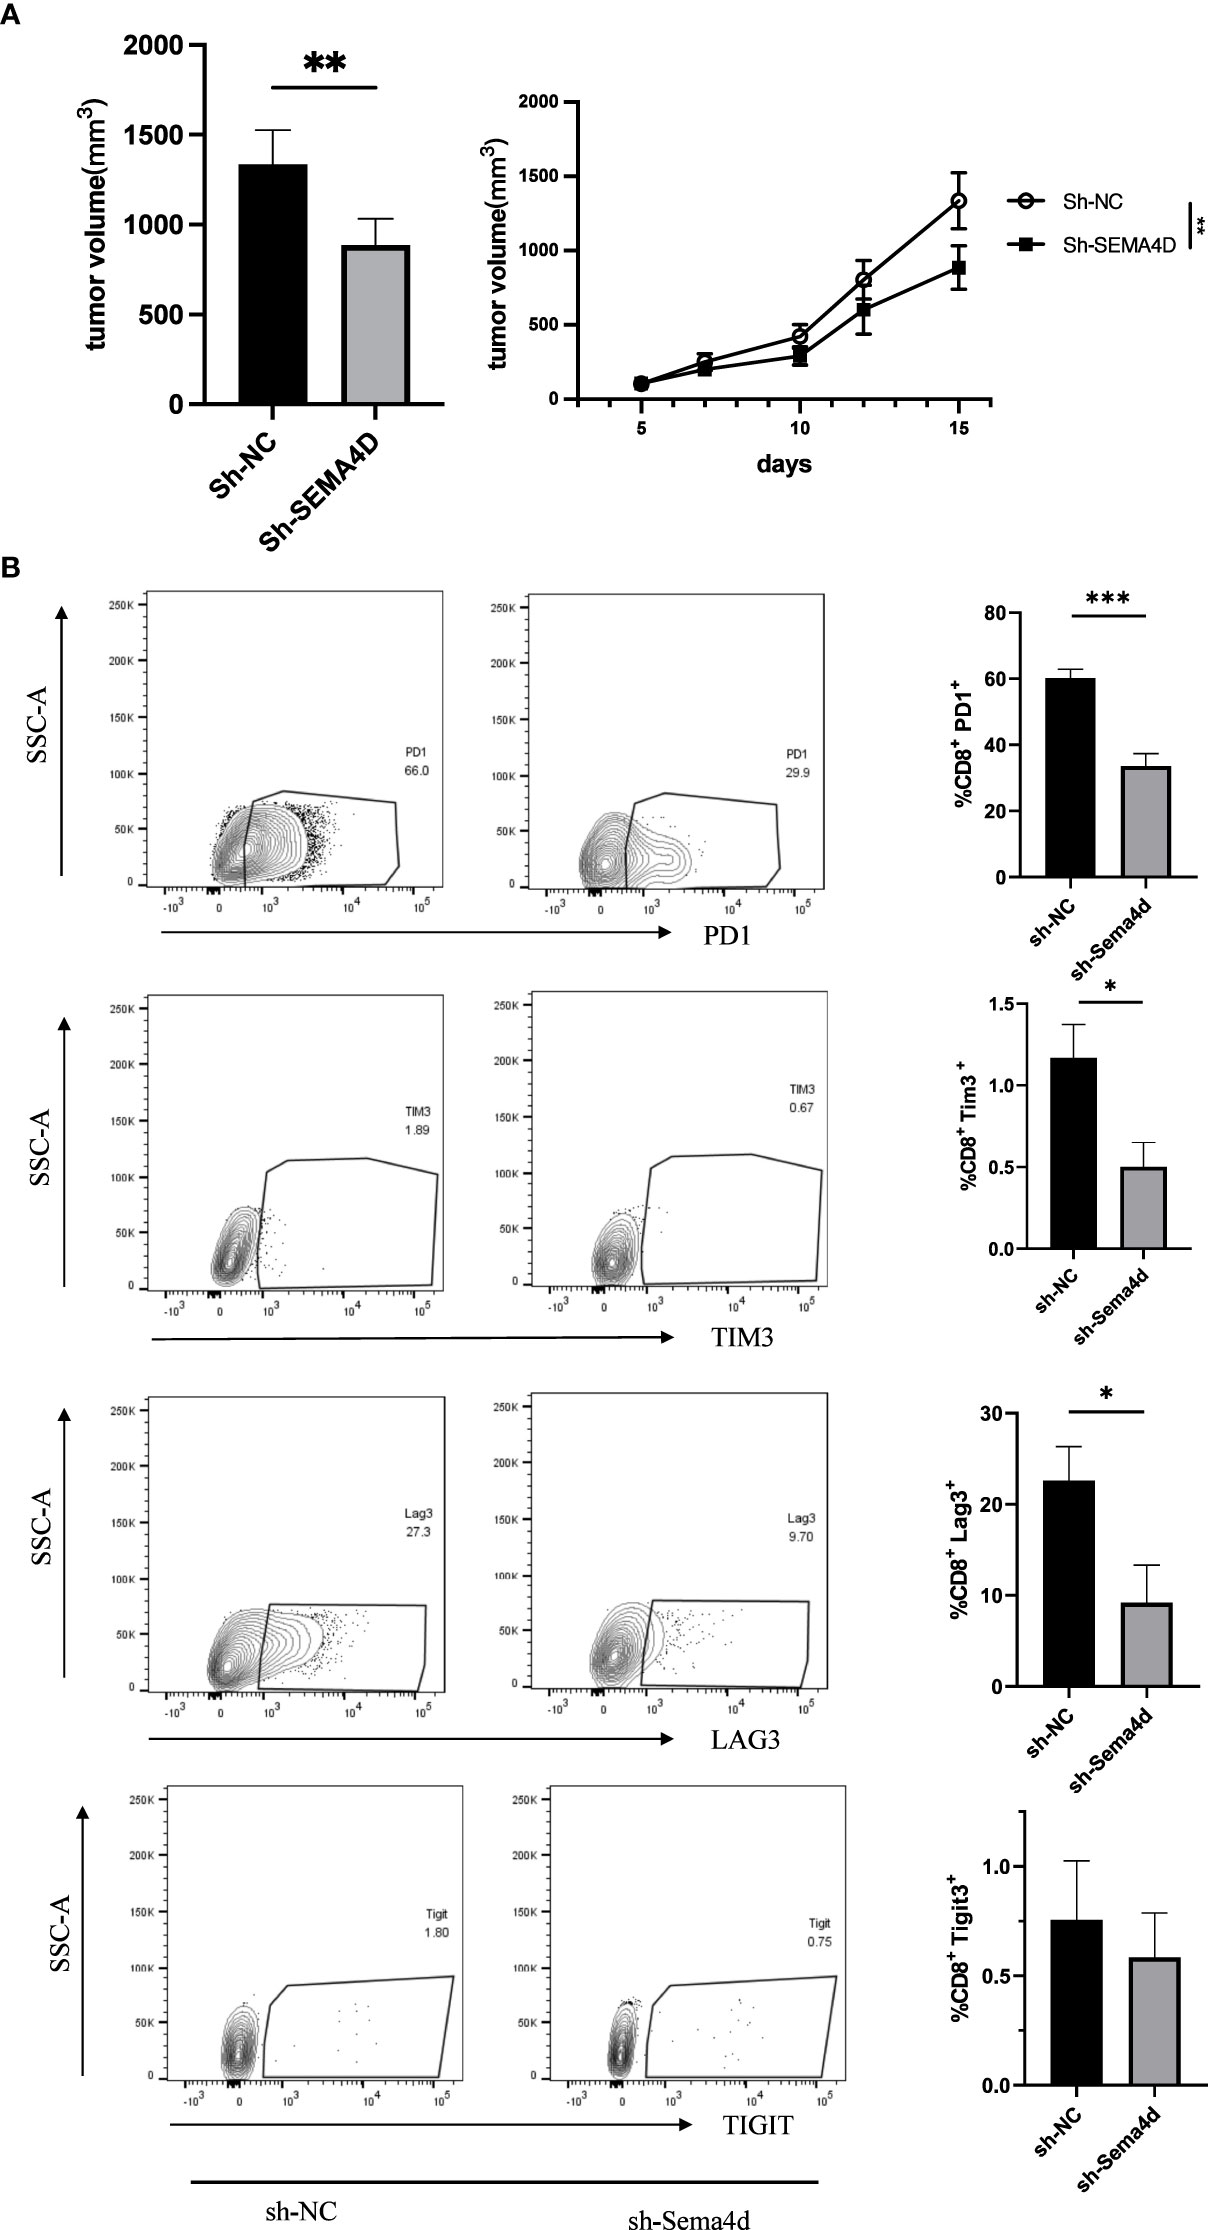
Figure 10 Reducing SEMA4D expression in tumors rescued CD8+ T cell exhaustion. (A) The growth rate and volume of in the B16sh-SEMA4D tumors were significantly reduced. (B) Expression of CD8+ Tex cell checkpoints was measured by FCM. PD1+, TIM3+ and LAG3+ T cells in B16sh-SEMA4D tumors were significantly decreased. Representative flow plots (left) and quantification (right) of the percentage of PD1+, TIM3+ and LAG3+ T cells in CD8+ T cells in the tumor. Data are presented as mean ± s.e.m (n = 5). *P<0.05; **P<0.01; ***P<0.001.
To further analyze the effects of SEMA4D knockdown on T cell exhaustion, we performed flow cytometry analysis of B16 tumors. We found that in SEMA4D knocked down tumors, PD1 expression in the TME decreased from 60.20 ± 2.61% to 33.60 ± 3.73% (P<0.05), LAG3 expression decreased from 22.58 ± 3.75% to 9.18 ± 4.14% (P<0.05), TIM3 expression decreased from 1.17 ± 0.20% to 0.50 ± 0.15% (P<0.05), and TIGIT expression decreased from 0.76 ± 0.27% to 0.58 ± 0.20% (P=0.62) (Figure 10B). These results indicate that reducing SEMA4D expression inhibits tumor growth by decreasing T cell exhaustion.
Discussion
SEMA4D is an oncogene that functions in a variety of tumors, including colorectal carcinoma (14), cervical cancer (15), ovarian cancer (16), soft tissue carcinomas (17), oral cancer (18), esophageal squamous cell carcinoma (19), non-small cell lung cancer (2), osteosarcoma (20) and cutaneous squamous cell carcinoma (21), by binding to Plexin-B1, Plexin-B2 and CD72 receptors (22) and is associated with tumor growth and a poor prognosis. Our study verified these results, and the role of SEMA4D in TME was further investigated.
SEMA4D was not expressed at higher levels in all tumor types at advanced stages than in early-stage tumors. And SEMA4D was highly expressed in the early stage of LUAD, TGCT, KIRP, and THCA. This result seems to contradict the involvement of SEMA4D in tumor progression (15). These findings suggest that SEMA4D expression may not be directly correlated with tumor progression in all types of cancer. Further studies are needed to elucidate the precise role of SEMA4D in tumor progression in these specific cancer types. However, tumor tissue has a complex immune microenvironment. The TME, comprising interactions between proliferating neoplastic cells and stromal components, is critical for tumor growth according to the seed and soil theory proposed by Stephen Paget (23). Our findings suggest that SEMA4D is associated with the infiltration of immune cells, SEMA4D expression was positively correlated with the immune score in 20 tumors, and positively correlated with the stromal score in 6 types of tumors. Then, SEMA4D is mainly produced by immune cells in the TME. We believed that the downregulation of SEMA4D expression as the tumor progresses might result from decreased immune cell infiltration.
SEMA4D has been shown to be widely expressed on immune cells (22), but its specific distribution in the immune microenvironment has not been systematically analyzed. The spatial distribution of immune cells in the tumor also directly affects the antitumor immune response. Our previous study described the presence of gradient changes in SEMA4D expression in infiltrating immune cells at the tumor edge in human colorectal cancer (24). The expression of SEMA4D at the edge of invasive tumors creates a barrier for immune cell infiltration and alters the balance between regulatory and effector immune cells and signals (3).
We used single-cell RNA-seq transcriptome data to show that SEMA4D is widely expressed in multiple immune cell components, especially macrophages. We subsequently found similar results in two implanted tumor cells with a significant proportion of CD11B+ myeloid cells and CD11C+ DCs among SEMA4D+ CD45+ cells. However, significant differences were observed in the TAM between the two tumors. SEMA4D expression levels were predominant on M2 macrophages in B16 tumors, whereas M1 SEMA4D+ cells were more abundant in MC38 tumors.
In addition, we noted that SEMA4D was widely expressed in CD8+ exhausted T cells in single-cell sequencing data. And SEMA4D showed substantial correlation with multiple immune checkpoints in a dozen tumors, including PDCD1 (PD1), CD274 (PDL1), CD28, BTLA, HAVCR2 (TIM3), LAG3, CTLA4, TIGIT, ICOS, CD27 and other common immune checkpoints. Among them, PDCD1 (PD1), CD274 (PDL1), HAVCR2 (TIM3), LAG3, and TIGIT are associated with T-cell exhaustion (25). Usually, exhaustion of tumor-specific CD8+ T cells leads to impairment of cytokine secretion and proliferation capacity, accompanied by PD1, TIM3, LAG3 and TIGIT overexpression (26). And the severity of T-cell exhaustion is influenced by the number of inhibitory receptors co-expressed by exhausted T cells (27). Furthermore, considering that since SEMA4D is expressed in LGG myelin and oligodendrocytes (25), it still shows some correlation with TIM3 expression. Our results showed that SEMA4D knockdown delays tumor growth and resulted in a significant decrease in PD1, LAG3, and TIM3 expression in TME, and a trend of decreased TIGIT expression. Thus, the relationship between SEMA4D and T cell exhaustion in TME was confirmed. We suggest that the reduction of SEMA4D expression in tumors can rescue CD8+T cells exhaustion in the TME. Rafael et al. previously reported that SEMA4D was associated with T-cell exhaustion during HIV-1 infection (28), which coincides with our results. In the process of tumor development, SEMA4D causes T cell exhaustion, leading to a suppressive immune microenvironment with reduced immune cell infiltration, thereby promoting tumor growth. Our results also suggest that decreased SEMA4D expression after tumor progression to advanced stages may be associated with decreased immune cell infiltration.
SEMA4D expressed on tumor cells very likely affects immune cells. Younis reported that SEMA4D secreted by human HNSC cells substantially inhibits T cell proliferation and function (29). SEMA4D is expressed at high levels on MOC1 oral cancer cells. Blocking MOC1 oral cancer cells SEMA4D does not directly affect tumor cell proliferation but reduces the production of chemokines by tumor cells, resulting in reduced MDSC and enhanced T lymphocyte response (18). In our experiments, SEMA4D expressed on tumor cells plays an important role in inducing an inhibitory immune effects. Thus, the immune reprogramming process induced by SEMA4D signaling between tumor cells and immune cells plays an important role in tumor immunity.
The TMB and MSI are important biomarkers for predicting the response of tumors to immunotherapy. Our results indicated that SEMA4D mostly negatively correlated with TMB and MSI in tumors was. Thus, instead of interfering with the immune response by affecting tumor neoantigenesis, SEMA4D may lead to immunosuppression mainly by interfering with immune checkpoints in the microenvironment, affecting the effector function of T cells against tumor cells.
Therefore, blocking SEMA4D may be able to improve the efficacy of immune antitumor therapy. Pepinemab (an anti-SEMA4D antibody) has achieved considerable antitumor therapeutic effects on resectable pancreatic and colon cancer (30). Anti-SEMA4D antibody combined with immunomodulators such as CTLA4 or PD1/PDL1 monoclonal antibodies enhanced the trafficking of killer macrophages and activated CD8+ T cells to the TME, enhanced the efficacy of immune checkpoint blockers (3, 31). The effectiveness of immune checkpoint inhibitor (ICI) therapy is critically dependent on the expansion of T cells and the subsequent increase in infiltration of precursor-exhausted CD8+ T cells within the tumor (32), and there is potential to further reduce T cell exhaustion by targeting SEMA4D and thereby synergistically promote the effectiveness of ICI therapy. In addition, the evidence of SEMA4D expression in various immune cell subsets from single-cell datasets is still insufficient. It is necessary to further clarify the expression of SEMA4D and its inhibitory function in immune cell subsets within the tumor microenvironment using single-cell sequencing technology in order to identify the targets and mechanisms of anti-SEMA4D immunotherapy, and ultimately achieve the goal of promoting the therapeutic effect of combination immunotherapy with ICI.
In conclusion, we explored SEMA4D expression patterns with bioinformatics methods and determined its relationship with immune cell infiltration and with CD8+Tex cells, providing a new perspective for exploring the role of SEMA4D in tumor immunity. However, detection in large tumor tissues limits our analysis of the temporal and spatial distribution of SEMA4D on immune cells and tumor cells. In the future, single-cell sequencing and spatial transcriptome sequencing technologies are needed for further analysis (33).
Data availability statement
The original contributions presented in the study are included in the article/Supplementary Materials, further inquiries can be directed to the corresponding authors.
Ethics statement
The studies involving human participants were reviewed and approved by Medical Ethics Committee of Shandong Provincial Hospital. The patients/participants provided their written informed consent to participate in this study. The animal study was reviewed and approved by Committee for Ethics of Animal Experiments of Shandong Provincial Hospital.
Author contributions
SZ designed the study and wrote the manuscript. ZZ and CY collected clinical data. JW revised the manuscript and had final approval of the submitted and published versions. CJ and LL were guarantors of this work and, as such, had full access to all the data in the study and take responsibility for the integrity of the data and the accuracy of the data analysis. All authors covntributed to the article and approved the submitted version.
Funding
Financial support for this study was provided by the Key Research and Development Program of Shandong Province (Nos. 2019JZZY010104; 2019GSF108146) and Special Foundation for Taishan Scholars Program of Shandong Province (No. ts20190978). Academic promotion programme of Shandong First Medical University (No. 2019QL021).
Acknowledgments
The authors thank all participants and staff in the study.
Conflict of interest
The authors declare that the research was conducted in the absence of any commercial or financial relationships that could be construed as a potential conflict of interest.
Publisher’s note
All claims expressed in this article are solely those of the authors and do not necessarily represent those of their affiliated organizations, or those of the publisher, the editors and the reviewers. Any product that may be evaluated in this article, or claim that may be made by its manufacturer, is not guaranteed or endorsed by the publisher.
Supplementary material
The Supplementary Material for this article can be found online at: https://www.frontiersin.org/articles/10.3389/fonc.2023.1171926/full#supplementary-material
References
1. Delaire S, Elhabazi A, Bensussan A, Boumsell L. CD100 is a leukocyte semaphorin. Cell Mol Life Sci. CMLS (1998) 54:1265–76. doi: 10.1007/s000180050252
2. Lu Q, Cai P, Yu Y, Liu Z, Chen G, Zeng Z. Sema4D correlates with tumour immune infiltration and is a prognostic biomarker in bladder cancer, renal clear cell carcinoma, melanoma and thymoma. Autoimmunity (2021) 54:294–302. doi: 10.1080/08916934.2021.1925885
3. Evans EE, Jonason AS Jr., Bussler H, Torno S, Veeraraghavan J, Reilly C, et al. Antibody blockade of semaphorin 4D promotes immune infiltration into tumor and enhances response to other immunomodulatory therapies. Cancer Immunol Res (2015) 3:689–701. doi: 10.1158/2326-6066.cir-14-0171
4. Tamagnone L, Franzolin G. Targeting semaphorin 4D in cancer: a look from different perspectives. Cancer Res (2019) 79:5146–8. doi: 10.1158/0008-5472.can-19-2387
5. Kuklina E. Semaphorin 4D as a guidance molecule in the immune system. Int Rev Immunol (2021) 40:268–73. doi: 10.1080/08830185.2021.1905807
6. Smith ES, Jonason A, Reilly C, Veeraraghavan J, Fisher T, Doherty M, et al. SEMA4D compromises blood-brain barrier, activates microglia, and inhibits remyelination in neurodegenerative disease. Neurobiol Dis (2015) 73:254–68. doi: 10.1016/j.nbd.2014.10.008
7. Ke Y, Dang E, Shen S, Zhang T, Qiao H, Chang Y, et al. Semaphorin4D drives CD8(+) T-cell lesional trafficking in oral lichen planus via CXCL9/CXCL10 upregulations in oral keratinocytes. J Invest Dermatol (2017) 137:2396–406. doi: 10.1016/j.jid.2017.07.818
8. Wu M, Li J, Gao Q, Ye F. The role of Sema4D/CD100 as a therapeutic target for tumor microenvironments and for autoimmune, neuroimmune and bone diseases. Expert Opin Ther Targets (2016) 20:885–901. doi: 10.1517/14728222.2016.1139083
9. Uhlen M, Zhang C, Lee S, Sjöstedt E, Fagerberg L, Bidkhori G, et al. A pathology atlas of the human cancer transcriptome. Sci (New York NY) (2017) 357(6352):eaan2507. doi: 10.1126/science.aan2507
10. Yoshihara K, Shahmoradgoli M, Martínez E, Vegesna R, Kim H, Torres-Garcia W, et al. Inferring tumour purity and stromal and immune cell admixture from expression data. Nat Commun (2013) 4:2612. doi: 10.1038/ncomms3612
11. Sun D, Wang J, Han Y, Dong X, Ge J, Zheng R, et al. TISCH: a comprehensive web resource enabling interactive single-cell transcriptome visualization of tumor microenvironment. Nucleic Acids Res (2021) 49:D1420–d30. doi: 10.1093/nar/gkaa1020
12. Goodman AM, Kato S, Bazhenova L, Patel SP, Frampton GM, Miller V, et al. Tumor mutational burden as an independent predictor of response to immunotherapy in diverse cancers. Mol Cancer Ther (2017) 16:2598–608. doi: 10.1158/1535-7163.mct-17-0386
13. Schrock AB, Ouyang C, Sandhu J, Sokol E, Jin D, Ross JS, et al. Tumor mutational burden is predictive of response to immune checkpoint inhibitors in MSI-high metastatic colorectal cancer. Ann Oncol (2019) 30:1096–103. doi: 10.1093/annonc/mdz134
14. Wang JS, Jing CQ, Shan KS, Chen YZ, Guo XB, Cao ZX, et al. Semaphorin 4D and hypoxia-inducible factor-1α overexpression is related to prognosis in colorectal carcinoma. World J Gastroenterol (2015) 21:2191–8. doi: 10.3748/wjg.v21.i7.2191
15. Liu H, Yang Y, Xiao J, Yang S, Liu Y, Kang W, et al. Semaphorin 4D expression is associated with a poor clinical outcome in cervical cancer patients. Microvascular Res (2014) 93:1–8. doi: 10.1016/j.mvr.2014.02.007
16. Chen Y, Zhang L, Lv R, Zhang WQ. Overexpression of Semaphorin4D indicates poor prognosis and prompts monocyte differentiation toward M2 macrophages in epithelial ovarian cancer. Asian Pacific J Cancer Prevention: APJCP (2013) 14:5883–90. doi: 10.7314/apjcp.2013.14.10.5883
17. Ch’ng E, Tomita Y, Zhang B, He J, Hoshida Y, Qiu Y, et al. Prognostic significance of CD100 expression in soft tissue sarcoma. Cancer (2007) 110:164–72. doi: 10.1002/cncr.22764
18. Clavijo PE, Friedman J, Robbins Y, Moore EC, Smith E, Zauderer M, et al. Semaphorin4D inhibition improves response to immune-checkpoint blockade via attenuation of MDSC recruitment and function. Cancer Immunol Res (2019) 7:282–91. doi: 10.1158/2326-6066.cir-18-0156
19. Wang Y, Zhao H, Zhi W. SEMA4D under the posttranscriptional regulation of HuR and miR-4319 boosts cancer progression in esophageal squamous cell carcinoma. Cancer Biol Ther (2020) 21:122–9. doi: 10.1080/15384047.2019.1669996
20. Li C, Wan L, Wang P, Guan X, Li C, Wang X. Sema4D/Plexin-B1 promotes the progression of osteosarcoma cells by activating Pyk2-PI3K-AKT pathway. J Musculoskeletal Neuronal Interact (2021) 21:577–83.
21. Cao J, Zhang C, Chen T, Tian R, Sun S, Yu X, et al. Plexin-B1 and semaphorin 4D cooperate to promote cutaneous squamous cell carcinoma cell proliferation, migration and invasion. J Dermatol Sci (2015) 79:127–36. doi: 10.1016/j.jdermsci.2015.05.002
22. Wang L, Li X, Song Y, Song D, Huang D. The emerging roles of semaphorin4D/CD100 in immunological diseases. Biochem Soc Trans (2020) 48:2875–90. doi: 10.1042/bst20200821
23. Akhtar M, Haider A, Rashid S, Al-Nabet A. Paget’s “Seed and soil” theory of cancer metastasis: an idea whose time has come. Adv Anatomic Pathol (2019) 26:69–74. doi: 10.1097/pap.0000000000000219
24. Li H, Wang JS, Mu LJ, Shan KS, Li LP, Zhou YB. Promotion of Sema4D expression by tumor-associated macrophages: significance in gastric carcinoma. World J Gastroenterol (2018) 24:593–601. doi: 10.3748/wjg.v24.i5.593
25. McLane LM, Abdel-Hakeem MS, Wherry EJ. CD8 T cell exhaustion during chronic viral infection and cancer. Annu Rev Immunol (2019) 37:457–95. doi: 10.1146/annurev-immunol-041015-055318
26. Kim HD, Song GW, Park S, Jung MK, Kim MH, Kang HJ, et al. Association between expression level of PD1 by tumor-infiltrating CD8(+) T cells and features of hepatocellular carcinoma. Gastroenterology (2018) 155:1936–50.e17. doi: 10.1053/j.gastro.2018.08.030
27. Kurachi M. CD8(+) T cell exhaustion. Semin Immunopathol (2019) 41:327–37. doi: 10.1007/s00281-019-00744-5
28. Correa-Rocha R, Lopez-Abente J, Gutierrez C, Pérez-Fernández VA, Prieto-Sánchez A, Moreno-Guillen S, et al. CD72/CD100 and PD-1/PD-L1 markers are increased on T and b cells in HIV-1+ viremic individuals, and CD72/CD100 axis is correlated with T-cell exhaustion. PloS One (2018) 13:e0203419. doi: 10.1371/journal.pone.0203419
29. Younis RH, Han KL, Webb TJ. Human head and neck squamous cell carcinoma-associated semaphorin 4D induces expansion of myeloid-derived suppressor cells. J Immunol (Baltimore Md: 1950) (2016) 196:1419–29. doi: 10.4049/jimmunol.1501293
30. Rossi AJ, Khan TM, Hong H, Lesinski GB, Wu C, Hernandez JM. Pepinemab (Anti-SEMA4D) in combination with ipilimumab or nivolumab for patients with resectable pancreatic and colorectal cancer. Ann Surg Oncol (2021) 28:4098–9. doi: 10.1245/s10434-021-10111-0
31. Patnaik A, Weiss GJ, Leonard JE, Rasco DW, Sachdev JC, Fisher TL, et al. Safety, pharmacokinetics, and pharmacodynamics of a humanized anti-semaphorin 4D antibody, in a first-In-Human study of patients with advanced solid tumors. Clin Cancer Res (2016) 22:827–36. doi: 10.1158/1078-0432.ccr-15-0431
32. Chow A, Perica K, Klebanoff CA, Wolchok JD. Clinical implications of T cell exhaustion for cancer immunotherapy. Nat Rev Clin Oncol (2022) 19:775–90. doi: 10.1038/s41571-022-00689-z
Keywords: SEMA4D, pancancer, tumor microenvironment, immune infiltration, exhaustion of CD8+ T cell
Citation: Zeng S, Zhang Z, Ye C, Wang J, Jing C and Li L (2023) Mediating immunosuppressive functions: a new perspective on the complex immunological properties of SEMA4D in the tumor microenvironment. Front. Oncol. 13:1171926. doi: 10.3389/fonc.2023.1171926
Received: 13 March 2023; Accepted: 27 April 2023;
Published: 23 May 2023.
Edited by:
QingLei Gao, Huazhong University of Science and Technology, ChinaReviewed by:
Luo Yuhao, Southwest Medical University, ChinaMisagh Rajabinejad, Mazandaran University of Medical Sciences, Iran
Copyright © 2023 Zeng, Zhang, Ye, Wang, Jing and Li. This is an open-access article distributed under the terms of the Creative Commons Attribution License (CC BY). The use, distribution or reproduction in other forums is permitted, provided the original author(s) and the copyright owner(s) are credited and that the original publication in this journal is cited, in accordance with accepted academic practice. No use, distribution or reproduction is permitted which does not comply with these terms.
*Correspondence: Leping Li, bGlsZXBpbmdAc2R1LmVkdS5jbg==; Changqing Jing, amluZ2NoYW5ncWluZ0BzZGZtdS5lZHUuY24=