
95% of researchers rate our articles as excellent or good
Learn more about the work of our research integrity team to safeguard the quality of each article we publish.
Find out more
ORIGINAL RESEARCH article
Front. Oncol. , 05 June 2023
Sec. Cancer Molecular Targets and Therapeutics
Volume 13 - 2023 | https://doi.org/10.3389/fonc.2023.1169430
 Deliang Gong1,2†
 Qingzhong Zhao1,2†
 Jun Liu1,2
 Shibing Zhao1,2
 Chengfeng Yi1,2Jianwei Lv1,2
 Hang Yu1,2
 Erbao Bian1,2*
 Dasheng Tian1,2*
Osteosarcoma is a primary malignant tumor found mainly in teenagers and young adults. Patients have very little long-term survival. MYC controls tumor initiation and progression by regulating the expression of its target genes; thus, constructing a risk signature of osteosarcoma MYC target gene set will benefit the evaluation of both treatment and prognosis. In this paper, we used GEO data to download the ChIP-seq data of MYC to obtain the MYC target gene. Then, a risk signature consisting of 10 MYC target genes was developed using Cox regression analysis. The signature indicates that patients in the high-risk group performed poorly. After that, we verified it in the GSE21257 dataset. In addition, the difference in tumor immune function among the low- and high-risk populations was compared by single sample gene enrichment analysis. Immunotherapy and prediction of response to the anticancer drug have shown that the risk signature of the MYC target gene set was positively correlated with immune checkpoint response and drug sensitivity. Functional analysis has demonstrated that these genes are enriched in malignant tumors. Finally, STX10 was selected for functional experimentation. STX10 silence has limited osteosarcoma cell migration, invasion, and proliferation. Therefore, these findings indicated that the MYC target gene set risk signature could be used as a potential therapeutic target and prognostic indicator in patients with osteosarcoma.
Osteosarcoma is one of the most common non-hematological bone tumors that occurs primarily in teenagers and young adults (1). Interactions between genetic factors and other factors cause osteosarcoma. Numerous papers have demonstrated that a sea of factors can contribute to the occurrence of osteosarcoma, including physical, chemical, biological agents, age, gender, ethnicity, and tumor immune microenvironment (TIME) (2–4). Osteosarcoma affects teenagers and children more than adults, and is histologically characterized by producing osteoid in malignant cells (5). Osteosarcoma is malignant, developing throughout the body and metastasizing in the lungs (6, 7). Metastasis and recurrence are the main pathological problems of the malignant development of osteosarcoma, and the long-term survival rate is approximately 20%, which seriously affects the effectiveness of the clinical treatment of osteosarcoma and brings adverse prognosis to patients with osteosarcoma (8). Advancements in surgery, chemotherapy, and immunotherapy are significant because they can reduce the onset of pulmonary metastases and increase long-term survival rates in patients with osteosarcoma (4). However, the progress has diminished in spite of modern therapy over the past three decades; the prognosis continues to be poor for most patients with osteosarcoma (9–12). Poor prognosis is caused by early detection difficulties, a high incidence of metastases, and relapse. In the final analysis, the poor prognosis of osteosarcoma is mainly due to the vast tumor heterogeneity caused by extensive genomic instability (13, 14). Therefore, it is necessary to have an accurate prognosis model and target for treating patients with osteosarcoma.
The MYC proto-oncogene is a cellular homolog of the retroviral V-myc gene discovered more than 30 years ago, which is sufficient to cause various tumors (15, 16). MYC is the most commonly magnified oncogene. Its gene product, the MYC transcription factor, regulates the transcription of thousands of genes, controlling multiple biological processes, including cell growth and differentiation, as well as tumor-initiating and advancing the tumor (17–21). There are many studies on MYC and osteosarcoma, and MYC has been identified as a prognostic marker of osteosarcoma (22, 23). MYC preferentially links the canonical pattern “E-box” motif (CACGTG or its variants CANNTG) in the proximal regions of the promoter or amplifier of target genes to regulate the expression of the target gene (19). Numerous studies have identified MYC target genes in a variety of tumor cells. Mina53 is a novel MYC target gene, and the elevated expression of Mina53 is a characteristic feature of colon cancer (24). HSPC111 is a MYC target gene overexpressed in breast cancer and is linked to a negative outcome for the patient (25). However, the entire MYC target gene set signature in osteosarcoma prognosis has not been reported. Considering the heterogeneity and complexity of osteosarcoma, the prognosis model constructed by a single gene may be challenging to predict the prognosis accurately. Our signature may have higher predictive accuracy.
In this research, we first downloaded the data of ChIP-seq of MYC with GEO data. Then, MYC target genes were exploited, which are highly relevant to the survival time of osteosarcoma patients. By matching clinical information and the MYC target gene expression profile in osteosarcoma patient samples, next, a risk signature incorporating 10 MYC target genes in the TARGET cohort turned out to be an independent prognostic factor in patients suffering from osteosarcoma. Following this, we then analyzed the immune infiltrating cells and predicted chemotherapy sensitivity and immune checkpoints. In parallel, biological processes and the pathways regulated by MYC target genes were assessed. Lastly, STX10 was silenced in osteosarcoma cells, which impacted the malignant biological phenotype of osteosarcoma cells. These findings will be beneficial for targeted therapy and the prognosis of osteosarcoma.
Clinical data from 88 osteosarcoma patients and Sequencing RNA data were downloaded from the TARGET database. Samples that did not meet the standards were deleted. Finally, 85 samples of the TARGET database were determined as a training cohort. To improve the clinical application, future studies need more samples. Fifty-three osteosarcoma specimens were downloaded from the Gene Expression Omnibus (GEO) database (GSE21257), and then they were used as a testing cohort. Specific information is shown in Table 1. The GSE36002 dataset was used to compare the difference between normal and tumor samples. The RNA expression information of healthy tissues was obtained from the Genotype-Tissue Expression (GTEx) database. In addition, we obtained the profile of 212 MYC target genes from the MYC Chip-seq data with the GEO data (GSE77356).
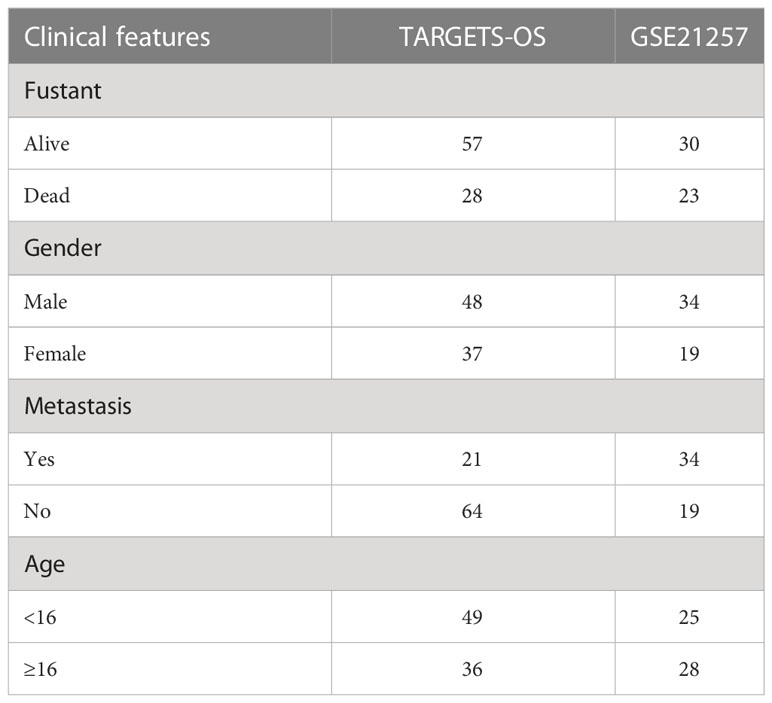
Table 1 Specific sample information.
Differentially expressed MYC target genes between normal bone tissue and osteosarcoma samples were identified using R software and the limma package. A total of 87 MYC target genes have been placed in the light of the cutoff of log2(fold change) > 0 and p< 0.05.
The univariate Cox regression analysis of 87 MYC target genes was conducted. Then, LASSO regression analysis was performed to reduce prognostic genes with the “glmnet” R package. The minimum lambda has been determined as the optimum value. Then, we obtained 10 MYC target genes, and Pearson correlation analysis was carried out to identify the relationship between each MYC target gene and MYC. After that, 10 genes were used to build the risk signature. The risk score for every patient in the course was counted based on the following formula:
Coef(i) represents the regression coefficient of each MYC target gene computed by LASSO Cox regression analysis, and exp(i) represents the relative expression level of each MYC target gene.
Next, in light of the median value, osteosarcoma patients were divided into low (n = 43) and high-risk groups (n = 42). Kaplan–Meier survival curves compared the overall survival of patients in the low- and high-risk group, and receiver operating characteristics (ROC) curves were utilized to evaluate the model’s predictive accuracy. Furthermore, multivariate and univariate Cox regression analysis was utilized to determine whether the risk score was unrelated to other clinical features like sex, age, metastasis, and primary tumor location in our signature. Finally, according to the clinical features of patients and individual genes in the MYC target set prognostic models, subgroup Kaplan–Meier survival curve analyses were performed.
The estimation algorithm is utilized to count the percentage of immune cells in every sample in TIME among the training cohort and the verification cohort; four scores, immune score, tumor purity, stromal score, and ESTIMATE score, were utilized for quantification. The ssGSEA algorithm was applied to estimate the 24 immune cells’ abundance in the raining cohort. The immune checkpoint molecules were evaluated with the GGPUBR R package and visualized with Boxplot in R language.
The immune dysfunction and exclusion (TIDE) algorithm (26) and subclass mapping (27) were used to evaluate clinical responses to immune checkpoints for PD-1 and CTLA4 among both risk groups in the training cohort. Predicting the therapeutic response of the training cohort to four chemotherapy drugs using the prophetic R software package for calculating the semi-maximum inhibitory concentration (IC50).
To further investigate the processes of biological and signaling pathways associated with the risk score-related genes, GO and KEGG pathway enrichment had been used to enrich and analyze the risk score-related genes of the low- and high-risk group by R language. p-value< 0.05 was considered to be a significant enrichment.
The human osteosarcoma cell lines MG-63, HOS, 143B, SAOS-2, U2OS, and R-1059D, and the normal osteoblast cell line hFOB1.19 were derived from the Chinese Academy of Sciences (Shanghai, China) and grown in MEM or DMEM Culture medium (Gibco, USA) having FBS (10%, Gibco, USA). Osteosarcoma was cultured at 37°C in an incubator with 5% CO2. We utilized siRNA, developed by General Biol (Anhui, China), to target knockdown MYC and STX10. The MYC siRNA consisted of one sequence (siMYC-1-forward GCUUGUACCUGCAGGAUCUTT-3, siMYC-1-forward AGAUCCUGCAGGUACAAGCTT). The STX10 siRNA consisted of three sequences (siSTX10-1-forward GGAAGAGACCAUCGGUAUATT, siSTX10-1-forward UAUACCGAUGGUCUCUUCCTT; siSTX10-2-forward GUGCAGAAGGCGGUGAACATT, siSTX10-2-forward UGUUCACCGCCUUCUGCACTT; siSTX10-3-forward UGGAAGCCAACCCAGGCAATT, siSTX10-3-forward UUGCCUGGGUUGGCUUCCATT). When the cells in the six-well plate developed to 60%–70%, the original culture medium was removed, and a 2-ml MEM culture medium containing FBS (10%) was introduced for transfection. Then, the cells were transfected with JetPrime (Poly Plus-transformation ®).
Total cellular RNA was extracted via the TRIzol reagent (Invitrogen, Thermo Fisher Scientific) according to the manufacturer’s protocol. Secondly, the concentration, together with the quality of the RNA, was detected by the nanodrop spectrophotometer (IMPLEN GmbH) with an absorbance of 260/280 nm. Subsequently, real-time qPCR was performed using the SYBR Green mix (TaKaRa Biotechnology, China) with primers in the ABI 7500 Real-Time PCR System (Applied Biosystems) after the reverse transcript of RNA to cDNA. Lastly, the relative expression level of every gene was carried out by the 2−ΔΔCt method. The PCR primers were as follows: GAPDH forward: 5’-CGCTCTCTGCTCCTCCTGT-3’, reverse: 5’-ATCCGTTGACTCCGACCTA-3’; STX10 forward: 5’-CTTCGCCCAAGAGATGGACC-3’, reverse: 5’-GGGGACTCACCACTCGTCAT-3’; MYC forward: 5’-ATTTGTGTCCCAAGCACTCC-3’, reverse: 5’-GGGCATGTGGATGAGTCTTT-3’.
The total protein of 143B and MG-63 was derived via RIPA lysis buffer (Beyotime, China). The protein content was tested with the BCA Protein Assay Kit (Beyotime, China) and subsequently segregated by SDS-PAGE. The protein was moved to the PVDF membrane (MilliporeCorp, USA), locked into a blocking solution (TBST with 5% skim milk) for 3 h, and then incubated overnight with the primary antibody. After that, the membranes were washed thrice by TBST, and the second antibody was added to TBST diluted by 1:10,000 and incubated for 1 h. Later, immune complexes were visualized by the ECL reagent. Antibodies used include anti-β-actin (Abcam, ab8226) and anti-STX10 (Proteintech, China).
Cell Count Kit-8 (CCK8) was used to detect the proliferation of osteosarcoma cells. We inoculated the cells into a 96-well plate (2 × 10³/well). We seeded cells into 96-well plates (2 × 10³/well) and added 10 μl of CCK8 reactant to each well at a set time every day. After 4 h of incubation, absorbance from each pore at 450 nm was measured using a microplate reader.
Migration and invasion tests had been carried out in the 24-well chamber (3422; Corning). In the migration assays, 2 × 10⁴ transfected cells were re-introduced to serum-free media and stored in the upper chamber. Culture medium (600 μl) with 30% FBS has been added to the lower chamber. In invasion assays, 1 × 10⁵ transfected cells had been added to every chamber that has been pre-painted with Matrix (356234; BD Biocoat). Later, after 24 h (migration test) or 48 h (invasion test), cultivation was performed at 37°C, 5% CO2, and cells fixed with 4% paraformaldehyde were stained with 0.5% crystal violet. After this time, the cells on the chamber’s upper surface were wiped clean with a cotton swab. Finally, the cells were counted and photographed under an inverted microscope.
R Studio and GraphPad Prism8.0.1 software were used for data analysis and visualization. The transwell cell number was calculated by ImageJ software. The chi-square test and the Student’s t-test were used in the statistical analysis. The p-value<0.05 was found to be statistically meaningful. Every cellular experimentation had been done three times. *p< 0.05, **p< 0.01, ***p< 0.001.
Our study flowchart is shown in Figure 1A. A total of 212 MYC target genes were obtained by downloading the data of ChIP-seq of MYC with GEO data. Subsequently, 87 differentially expressed MYC target genes were identified in osteosarcoma and normal tissues (Figure 1B).
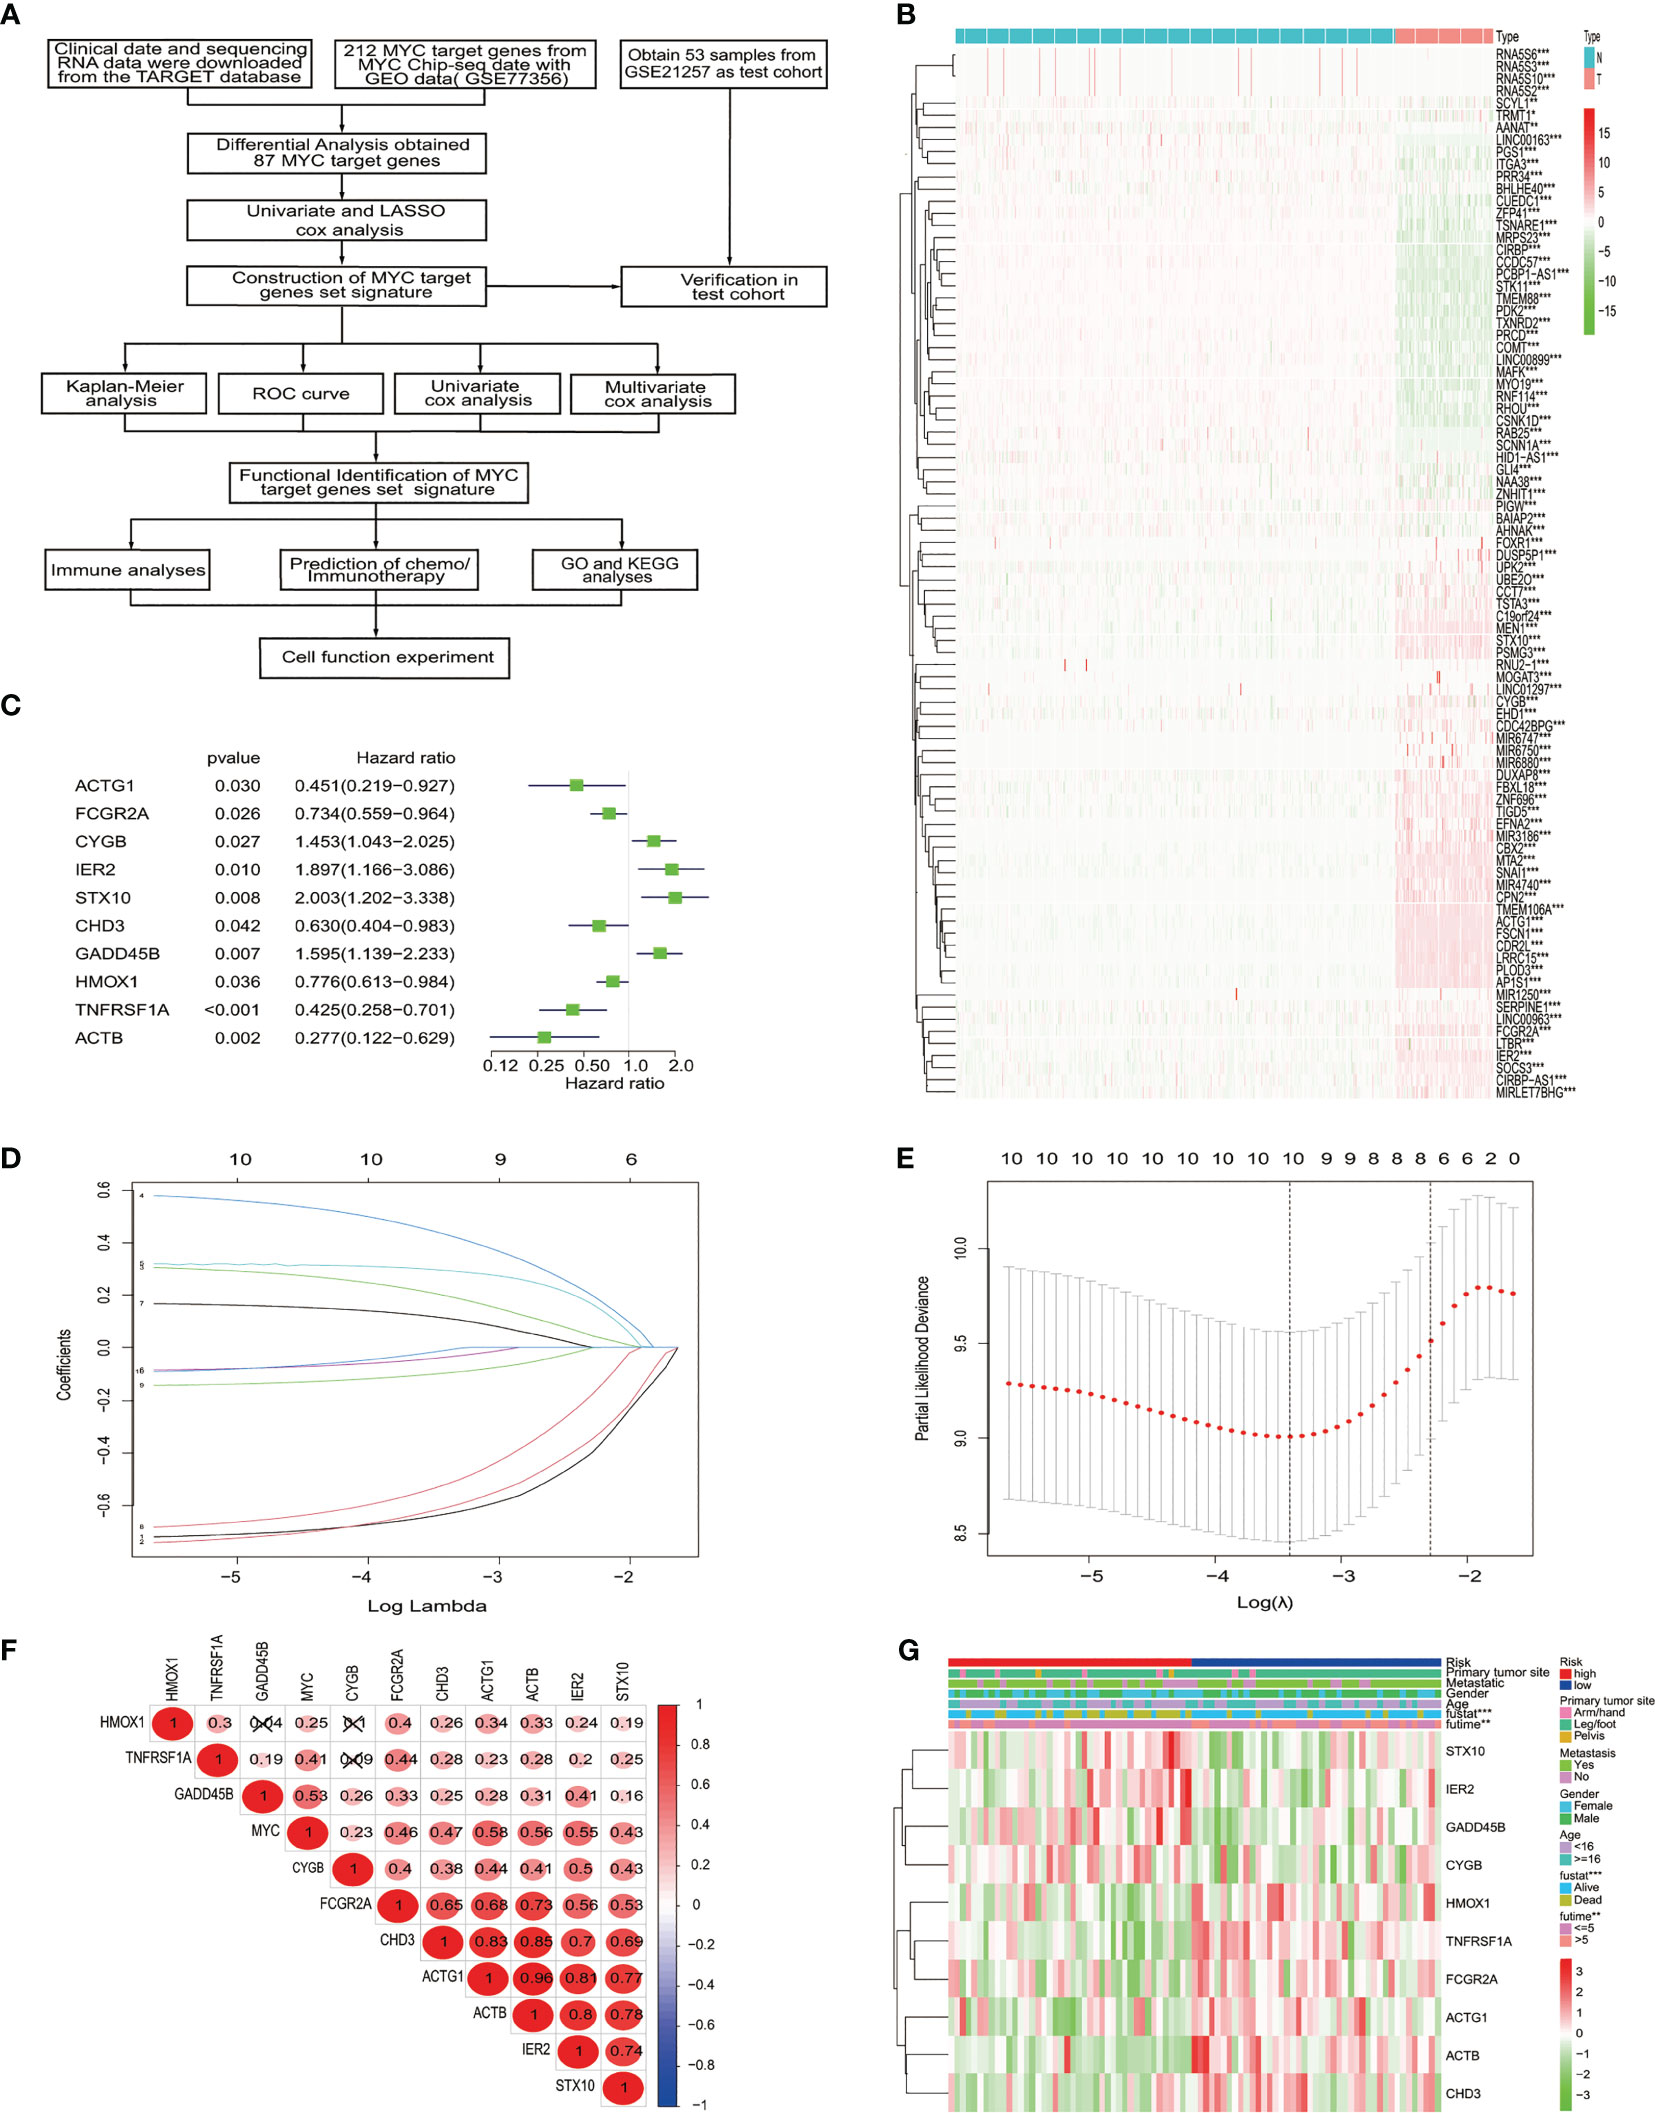
Figure 1 The identification and selection of the MYC target gene. (A) The overall design of our study. (B) The heatmap shows that 87 MYC target genes were significantly different from normal and osteosarcoma. An increasing trend from low levels to high levels are shown according to the color from green to red and the size of the value represents correlation. (C) Univariate Cox regression analysis showed 10 MYC target genes, with a p value<0.05. (D) LASSO coefficient spectrum of the 10 genes. (E) Selection of Optimum Lambda Value. (F) The correlation between these 10 genes and MYC. (G) The heatmap shows the 10 MYC target genes’ expression pattern and clinic pathological characteristics in the low-risk and high-risk groups.
To construct the MYC target gene set signature, the univariate Cox regression analysis of 87 MYC target genes was conducted, out of which 10 genes (TNFRSF1A, ACTB, GADD45B, STX10, IER2, FCGR2A, CYGB, ACTG1, HMOX1, and CHD3) about prognosis were selected (Figure 1C). Moreover, we utilized the LASSO Cox regression analysis to build an MTG signature of prognosis. Ten genes with optimal lambda values were screened out (Figures 1D, E). These genes are as follows: TNFRSF1A, ACTB, GADD45B, STX10, IER2, FCGR2A, CYGB, ACTG1, HMOX1, and CHD3. In addition, we further examined the correlation between these 10 genes and between MYC and 10 genes. All 10 genes were correlated and associated with MYC (Figure 1F). Then, to obtain the predicted consequences of an MYC target gene set signature in osteosarcoma patients. According the median risk score in the training cohort, osteosarcoma samples were divided into low-risk (n = 43) and high-risk groups (n = 42). The association between the clinical–pathological characteristics and risk score of each osteosarcoma sample was examined. We found substantial differences in survival state and survival time between the high-risk and low-risk group (Figure 1G). Then, based on the MTG signature, we obtained the distribution of risk score, the status of survival, and the heatmap of 10 MYC target genes (Figure 2A). Analysis of the Kaplan–Meier survival curve showed that the overall survival rate of osteosarcoma patients in the high-risk group was much lower than that in the low-risk group (Figure 2B). The area below the receiver operating characteristic (ROC) curve was used to estimate the accuracy of the MYC target gene set prognostic signature. The results indicated that the AUC values of 1 year, 3 years, and 5 years were 0.806, 0.833, and 0.899, respectively (Figure 2C), implying that the risk prediction model we built was particular and sensitive. Then, we found that the prognostic risk score and metastasis were significantly correlated with the overall survival rate by univariate and multivariate Cox analyses (Figures 2D, E) (p< 0.001). Analysis of the Kaplan–Meier survival curve showed that patients in the high-risk group had a lower overall survival rate than those in the low-risk group for age, gender, and metastasis. (Figure 2F).
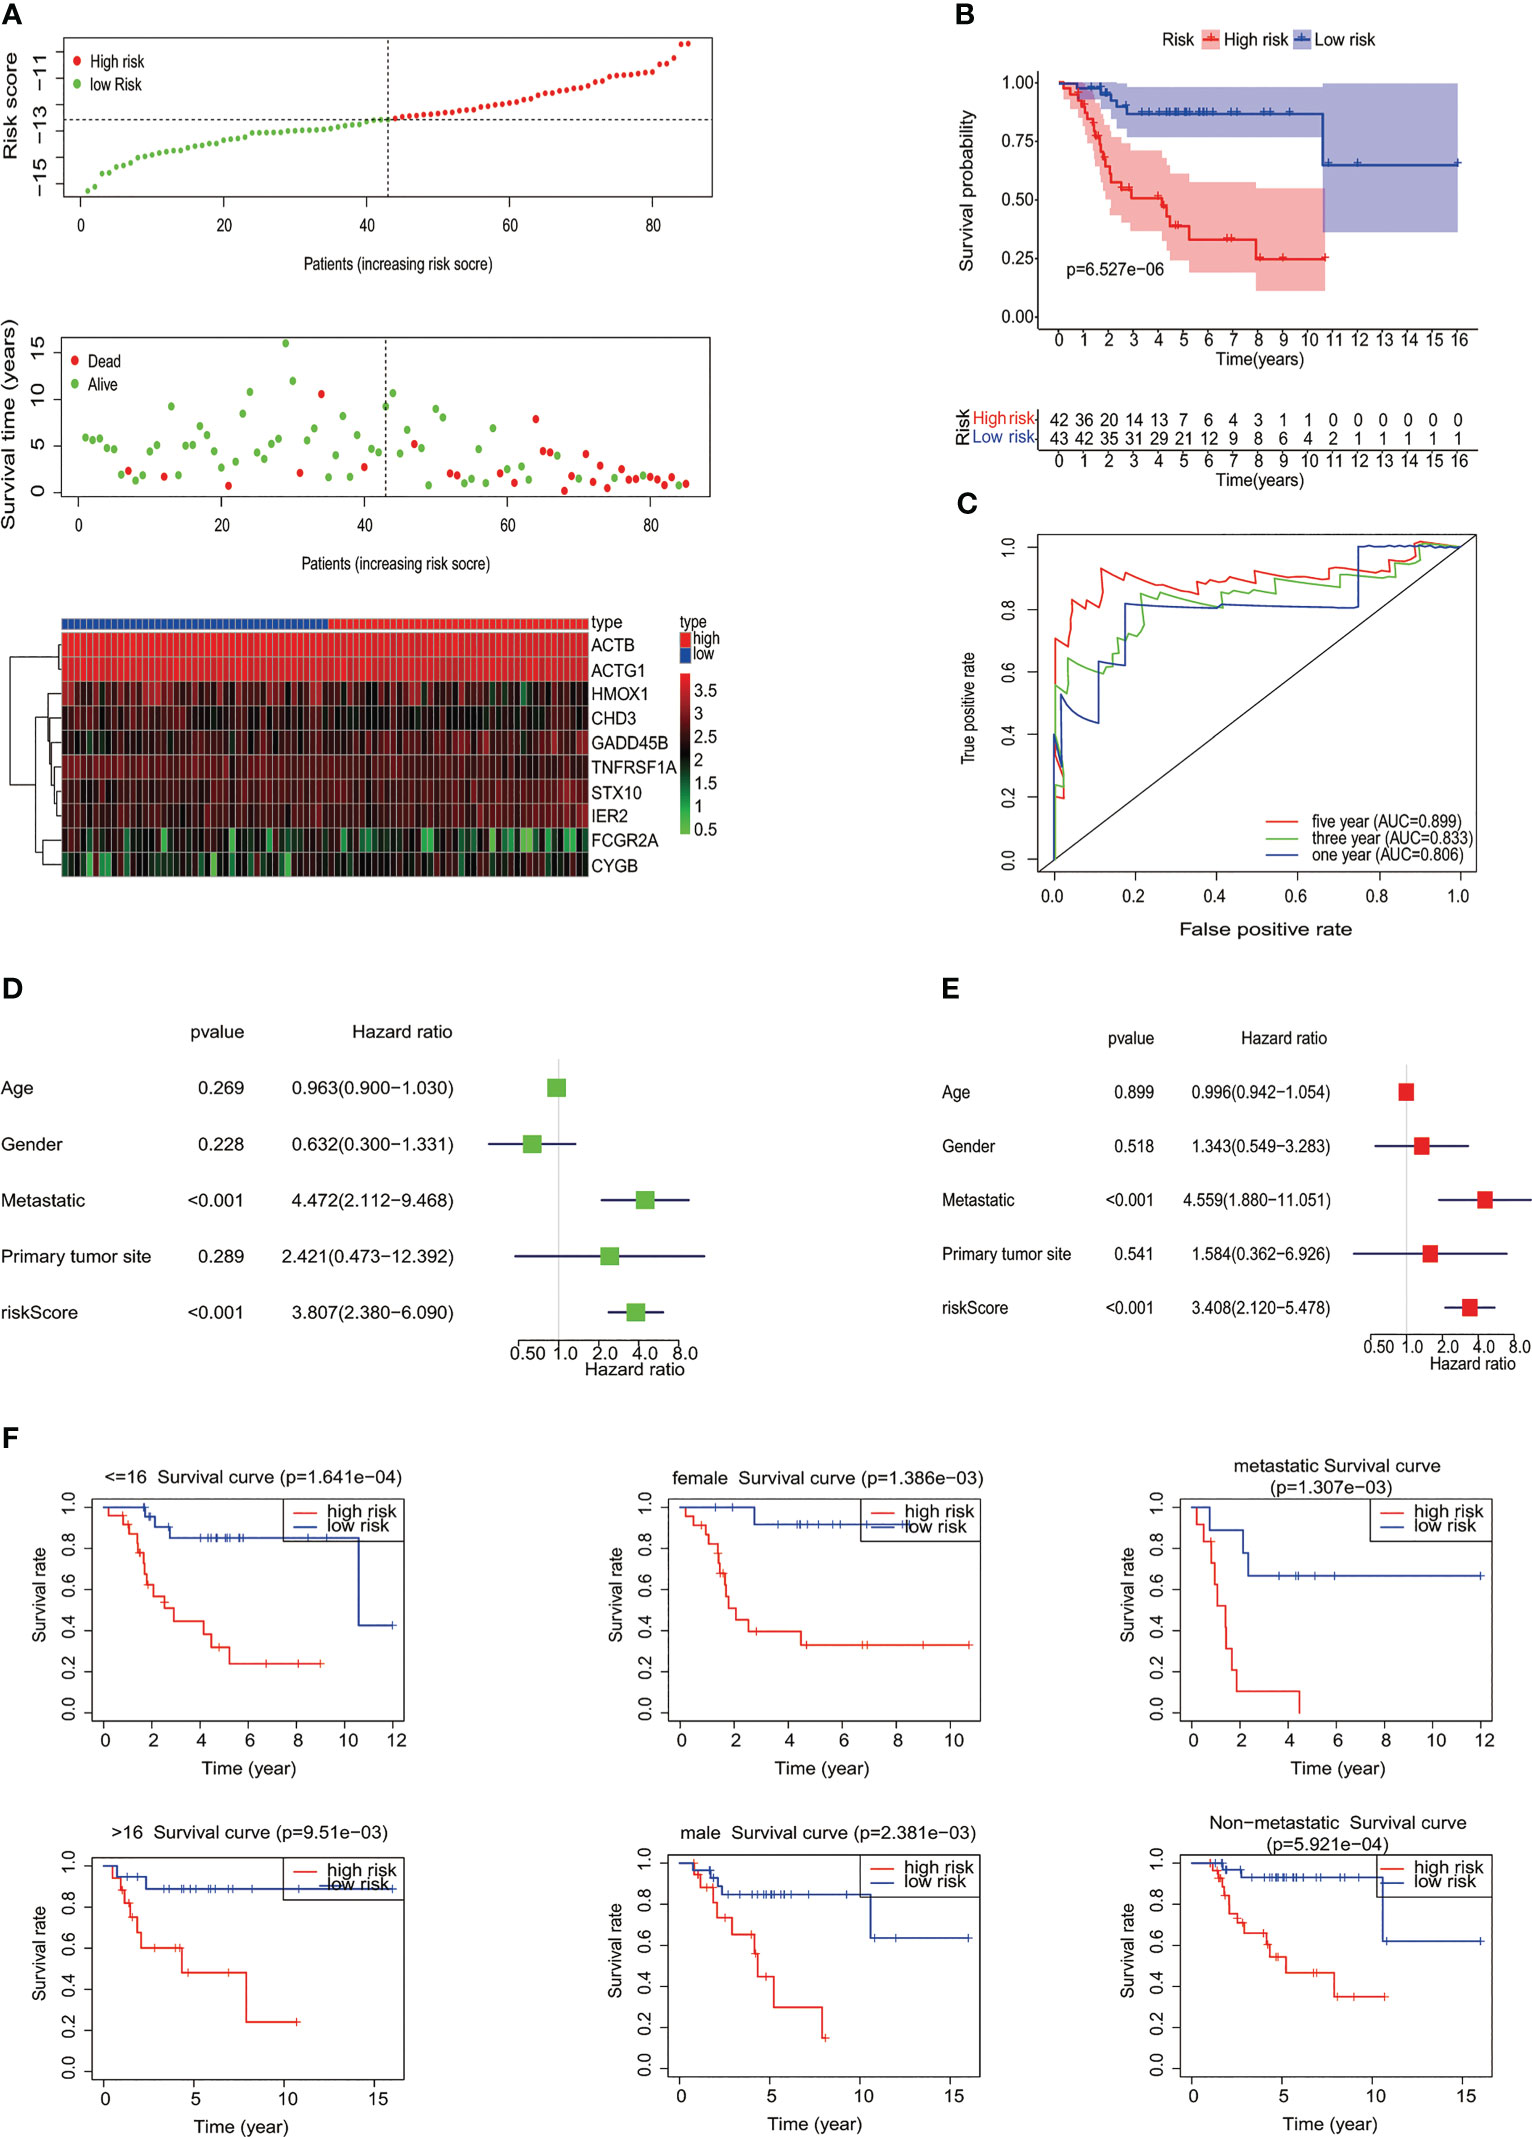
Figure 2 Evaluation of MYC target genes’ set signature. (A) The distribution of risk score, the status of survival, and a heatmap of the 10 MYC target genes’ expression pattern among osteosarcoma patients in the light of the signature. (B) The Kaplan–Meier curves of the low- and high-risk groups were analyzed according to the signature of the MYC target gene set. (C) The ROC curves of the high- and low-risk groups were verified by the signature of the MYC target gene set. Analysis of univariate (D) and multivariate (E) Cox regression shows that the risk score and metastatic potential are independent prognostic indicators of survival in osteosarcoma patients. (F) Relationship between different clinical features and prognosis (age, gender, and metastatic potential).
The test queue risk is assessed in line with the risk model constructed in the training set. Osteosarcoma samples of the test cohort were split into two risk subgroups via optimal truncation (Figure 3A). The K-M curve pinpointed that the survival rate of patients in the high-risk group was lower than that in the low-risk group (Figure 3B). ROC analysis was utilized to evaluate the ability of this signature to predict the overall survival rate, and the area below the 1-year curve is 0.755 (Figure 3C). Figures 3D–F show the risk score distribution, survival status, and gene expression profiles between the two risk groups, respectively (Figures 3D–F).
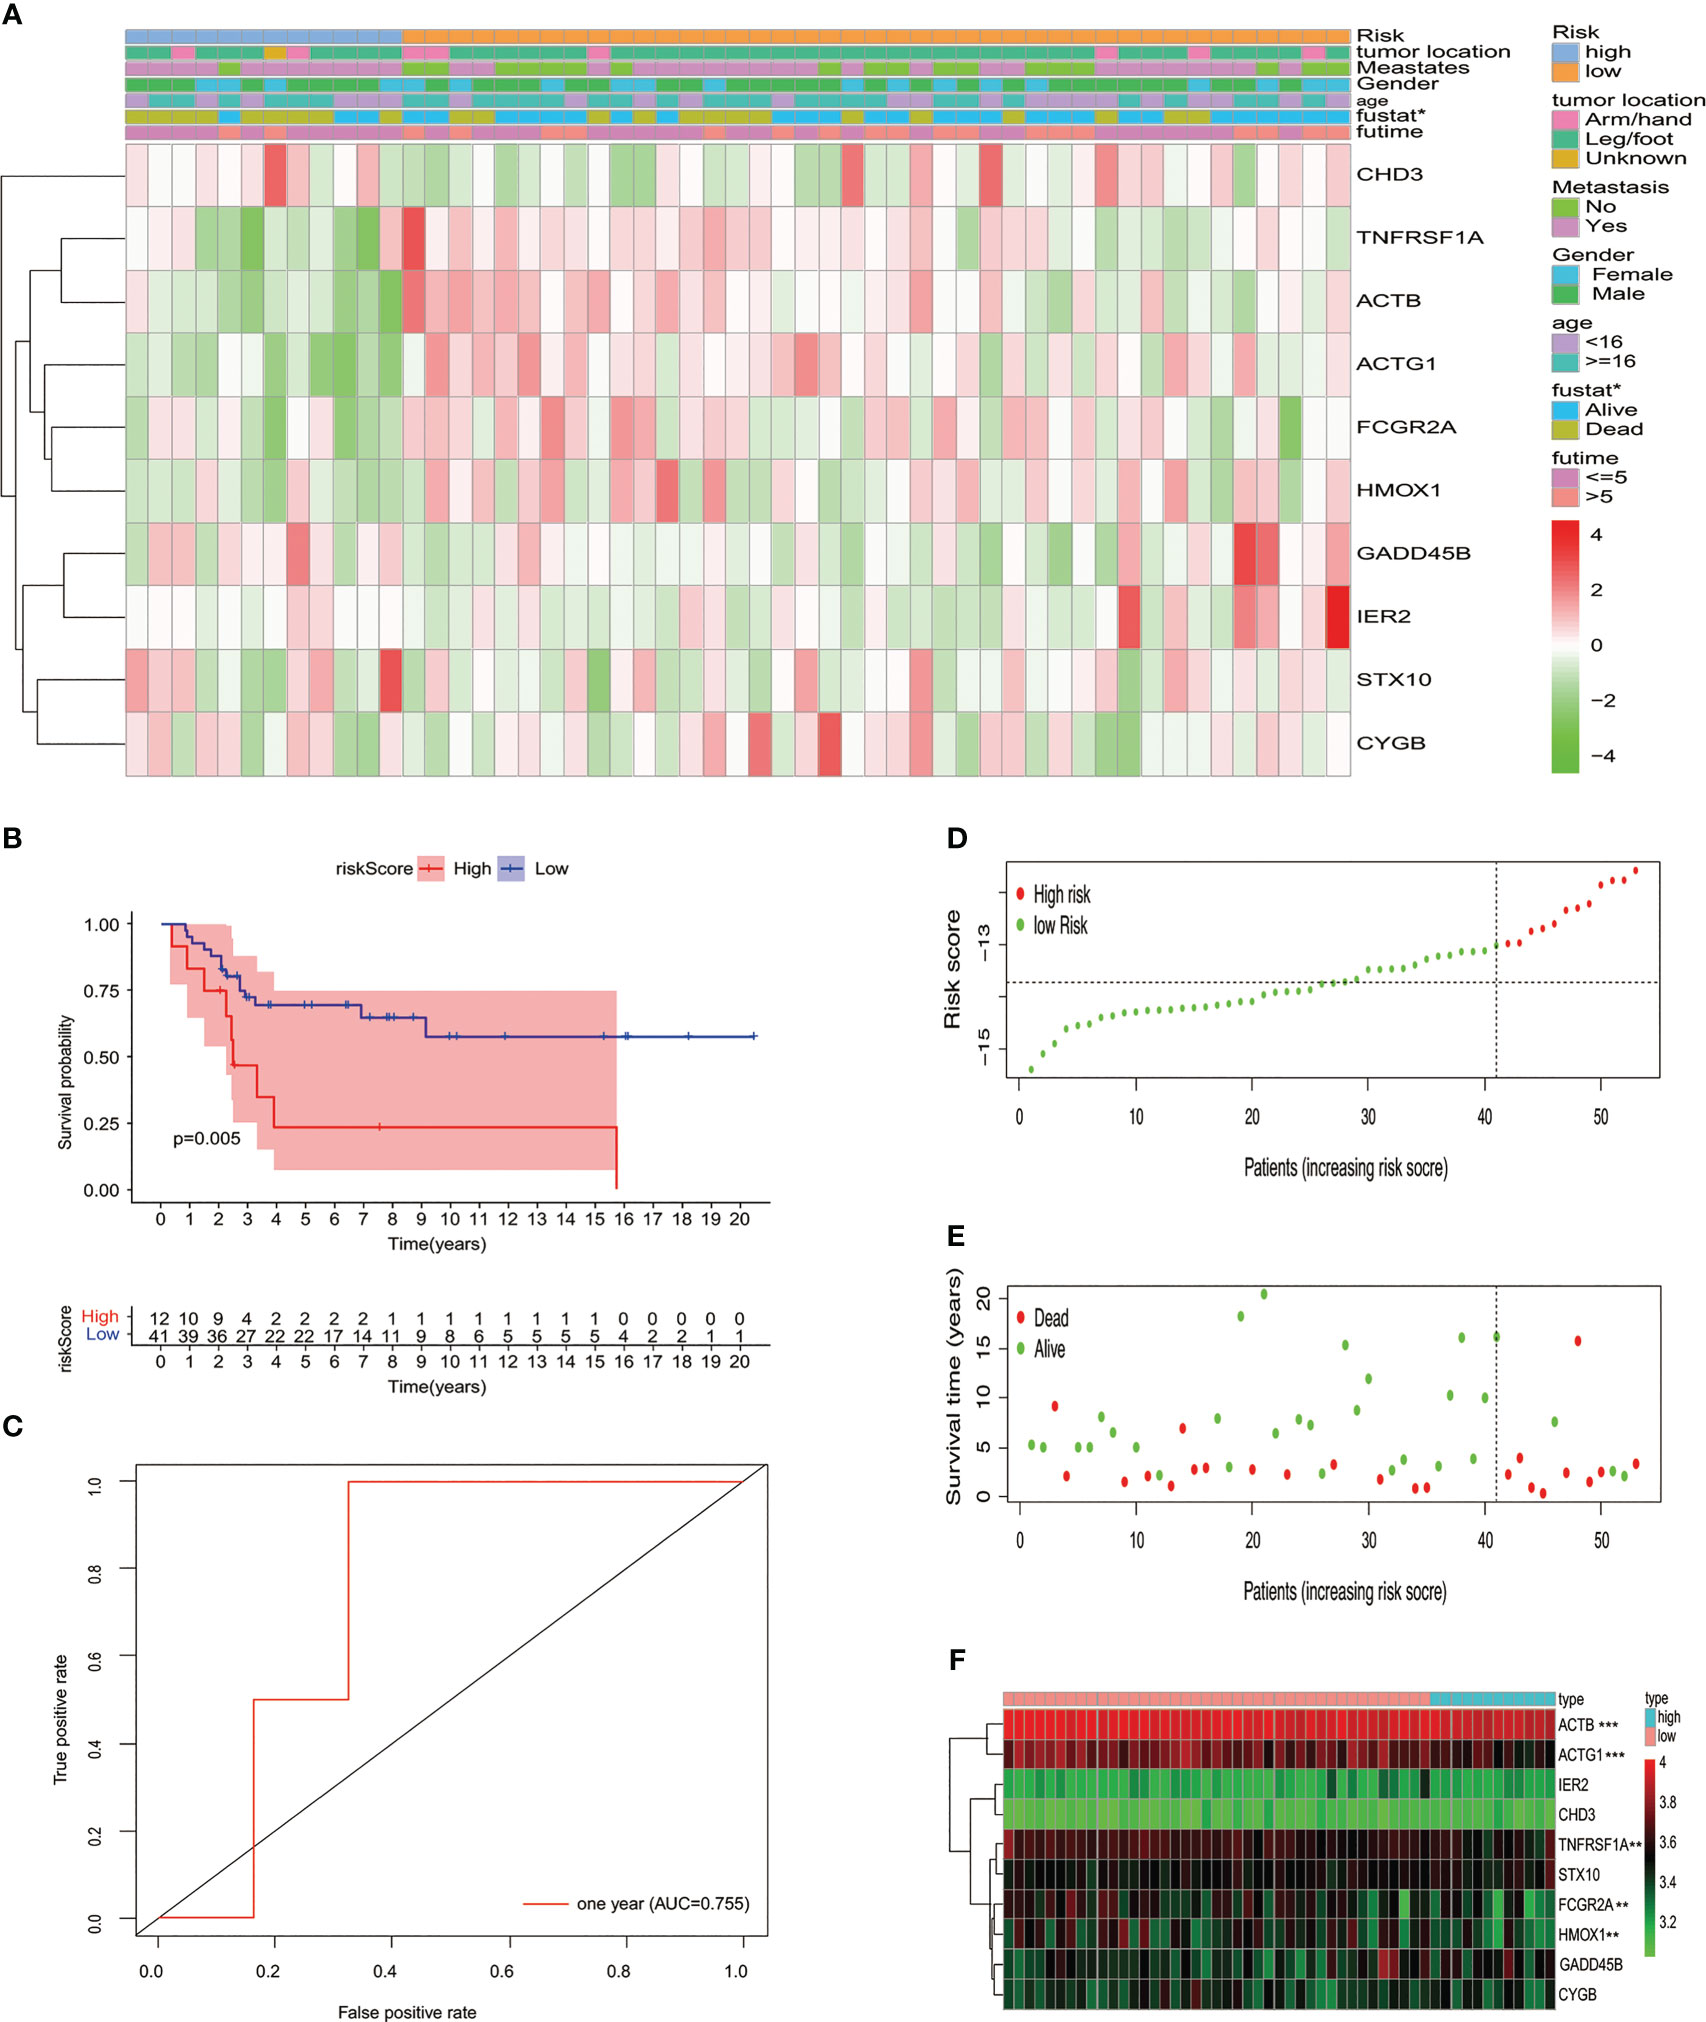
Figure 3 Verifying the signature of the prognostic model in the GSE cohort. (A) Heatmap displayed the expression of 10 MYC target genes and clinicopathological characteristic distribution in different risk groups. (B) K-M survival analysis of the test set. (C) Using the ROC curve to evaluate the prediction effectiveness of the risk prognostic model. (D) Risk score distribution, (E) status of survival, and (F) expression levels with 10 MYC target genes in risk subgroups of patients with osteosarcoma.
Subsequently, immune analyses were conducted to explore the difference in immune cells among low- and high-risk groups in the training cohort. The ESTIMATE algorithm showed that patients with osteosarcoma in the high-risk group had much higher tumor purity and a lower stromal score, immune score, and ESTIMATE score compared to the low-risk group (Figures 4A–D). The immune infiltrated cells that were divided into two groups were analyzed using the ssGSEA algorithm. The block diagram showed significant differences in the proportions of 7 out of 24 immune cells. Our results indicated that macrophages, neutrophils, immature dendritic cells (iDCs), and NK CD56dim cells were enriched in the low-risk group (Figure 4E). The heatmap of 24 immune-related cell enrichment levels indicates that the level of immune cell infiltration in the low-risk group was markedly higher than that in the high-risk group (Figure 4F). In addition, we evaluated the association between immune checkpoint molecules and risk characteristics. The results revealed a strong expression of HAVCR2, TNFRSF9, TNFSF4, SIGLEC15, LAG3, PTPRC, PDCD1LG2, CD8A, and CD274 in the low-risk group (Figure 4G). Then, we also performed an immune analysis using the ESTIMATE algorithm in the testing cohort, confirming that the immune status was consistent with the training cohort (Figures 4H–K). We have seen that the risk prognostic signature is used to predict the characteristics of cellular immunity in osteosarcoma.
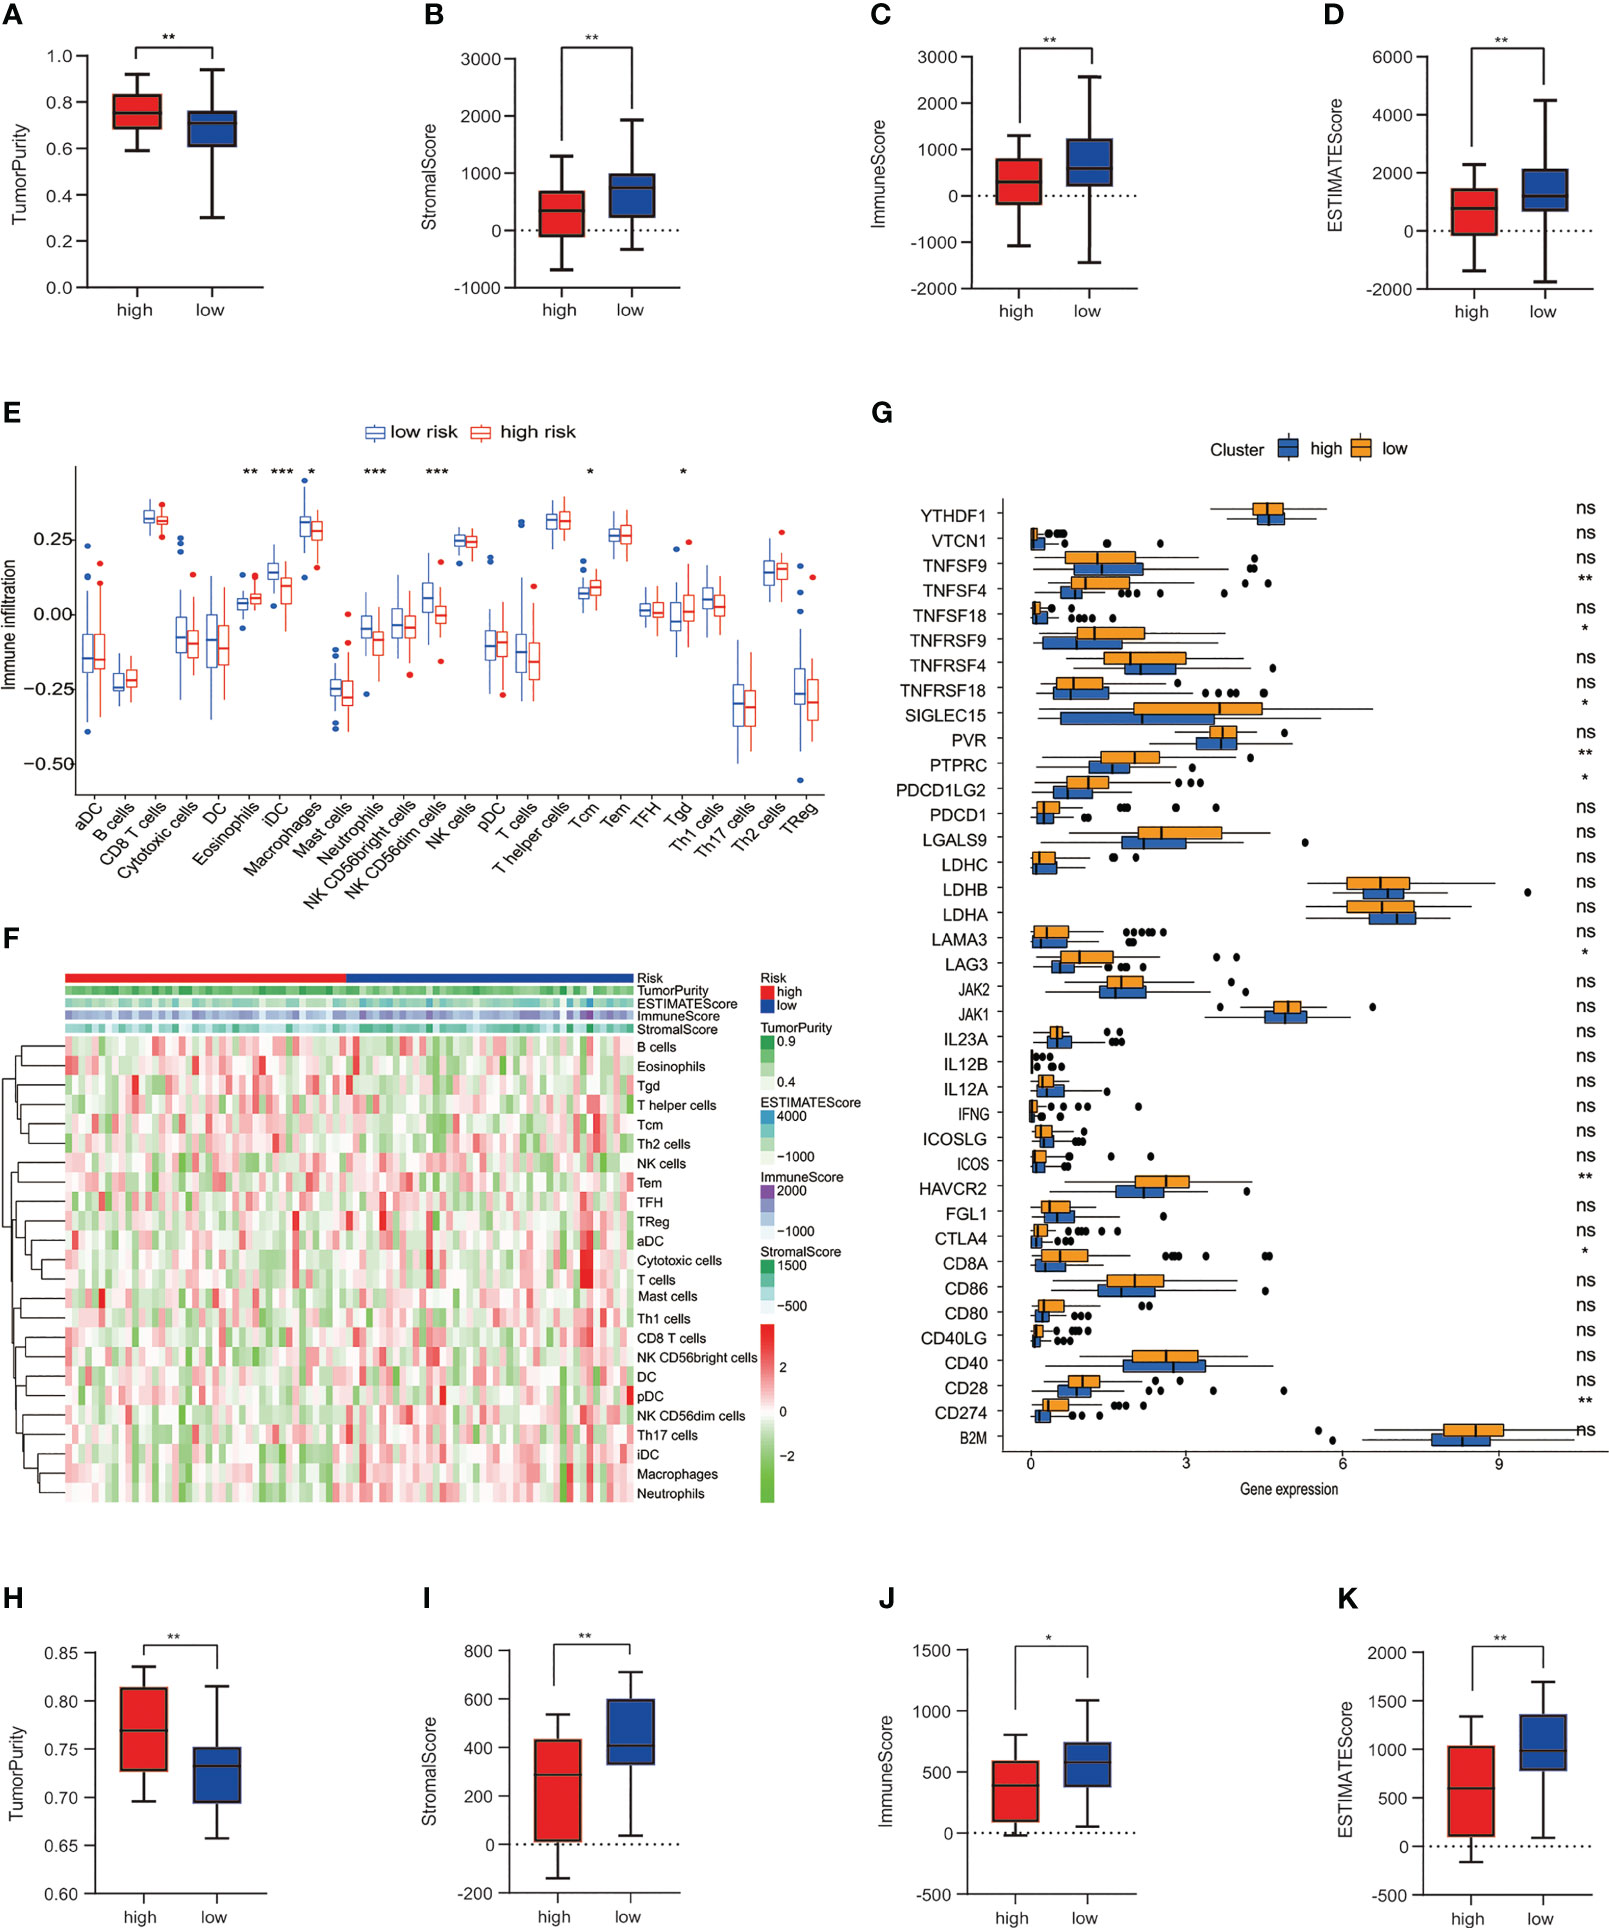
Figure 4 Connection among the risk prognosis model and immune checkpoints and immune infiltration. (A) Tumor purity, (B) stromal score, (C) immune score, and (D) ESTIMATE score calculated by the ESTIMATE algorithm in TARGET datasets. (E) Differences in immune cell infiltration between low-risk and high-risk osteosarcoma patients in the training set. (F) Expression levels of 24 immune-related cells in high- and low-risk groups. (G)The block diagram indicates the expression of 38 immune checkpoint among low- and high-risk groups. (H) Tumor purity, (I) stromal score, (J) immune score, and (K) ESTIMATE score in GSE datasets. ***p< 0.001, **p< 0.01, *p< 0.05, ns reflects p > 0.05.
Next, subclass mapping for the TIDE algorithm was utilized further to explore the relationship between MTG signature and immunotherapy effectiveness. We studied the ability of our risk signature to differentiate patients with different responses to immune checkpoint blockade treatment (Figure 5A). The findings demonstrated that the expression pattern of high-risk group patients relates to that of patients in the PD-1 group (Figure 5B). The results indicate that high-risk patients were likely to get better curative effects from PD-1 treatment. Moreover, chemotherapy is one of the effective remedies against osteosarcoma. We evaluated how two risk groups reacted. In the training cohort, every sample’s IC50 was explored by the predictive signature of chemotherapy medicines. We discovered that the high-risk group is more susceptible to several chemotherapy drugs (Elesclomol, Thapsigargin, GDC0941, and AKT inhibitor VIII) (Figure 5C).
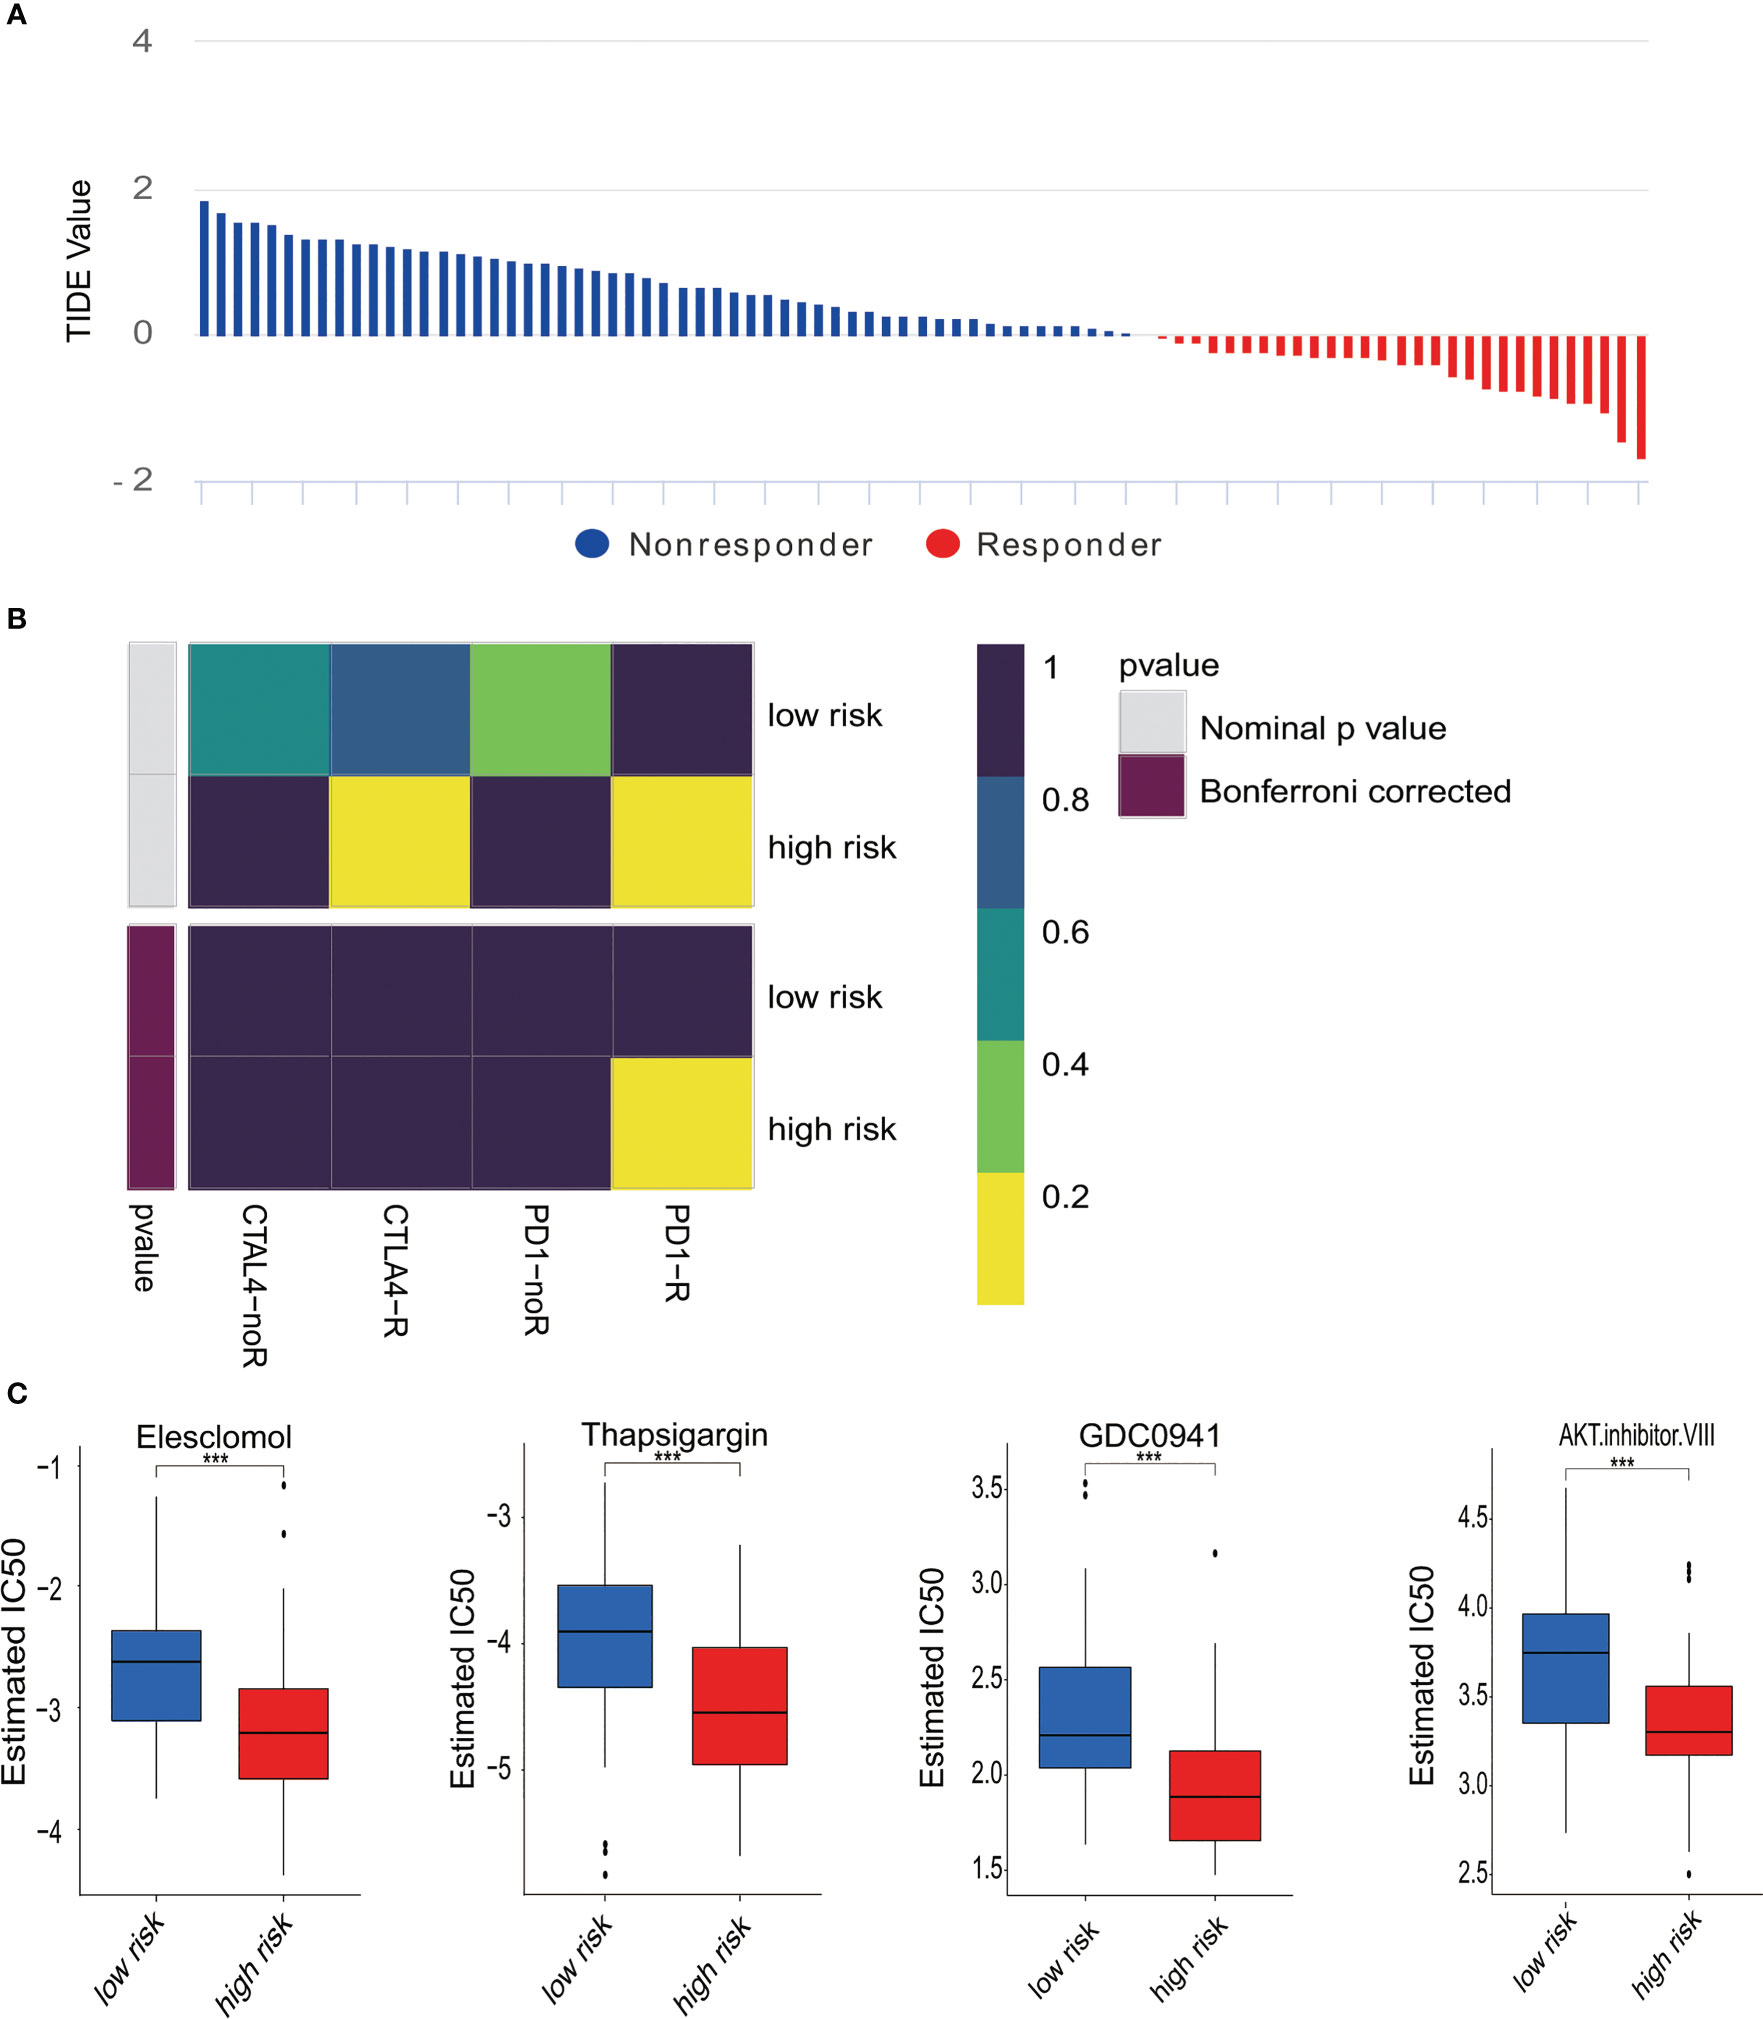
Figure 5 Differences in responses to immunotherapy and chemotherapy. (A) The response to immunotherapy and TIDE value in osteosarcoma patients. (B) Analysis of Submap represented that the high-risk group probably gain greater benefits from anti-PD-1 treatment. (C) Estimated IC50 revealed the effectiveness with Elesclomol, Thapsigargin, GDC0941, and AKT. Inhibitor VIII for chemotherapy in two risk groups. ***p < 0.001.
In order to further explore the potential biological processes related to osteosarcoma, we carried out a functional enrichment analysis of risk score-related genes in two risk groups of training and test cohorts. GO enrichment analysis in training and test cohorts revealed that most genes related to risk score are enriched in the cell–substrate junction and focal adhesion (Figures 6A, B). The results of the KEGG analysis in the training and test cohorts revealed that those genes were primarily associated with the NF-kappa B signaling pathway and lysosome (Figures 6C, D).
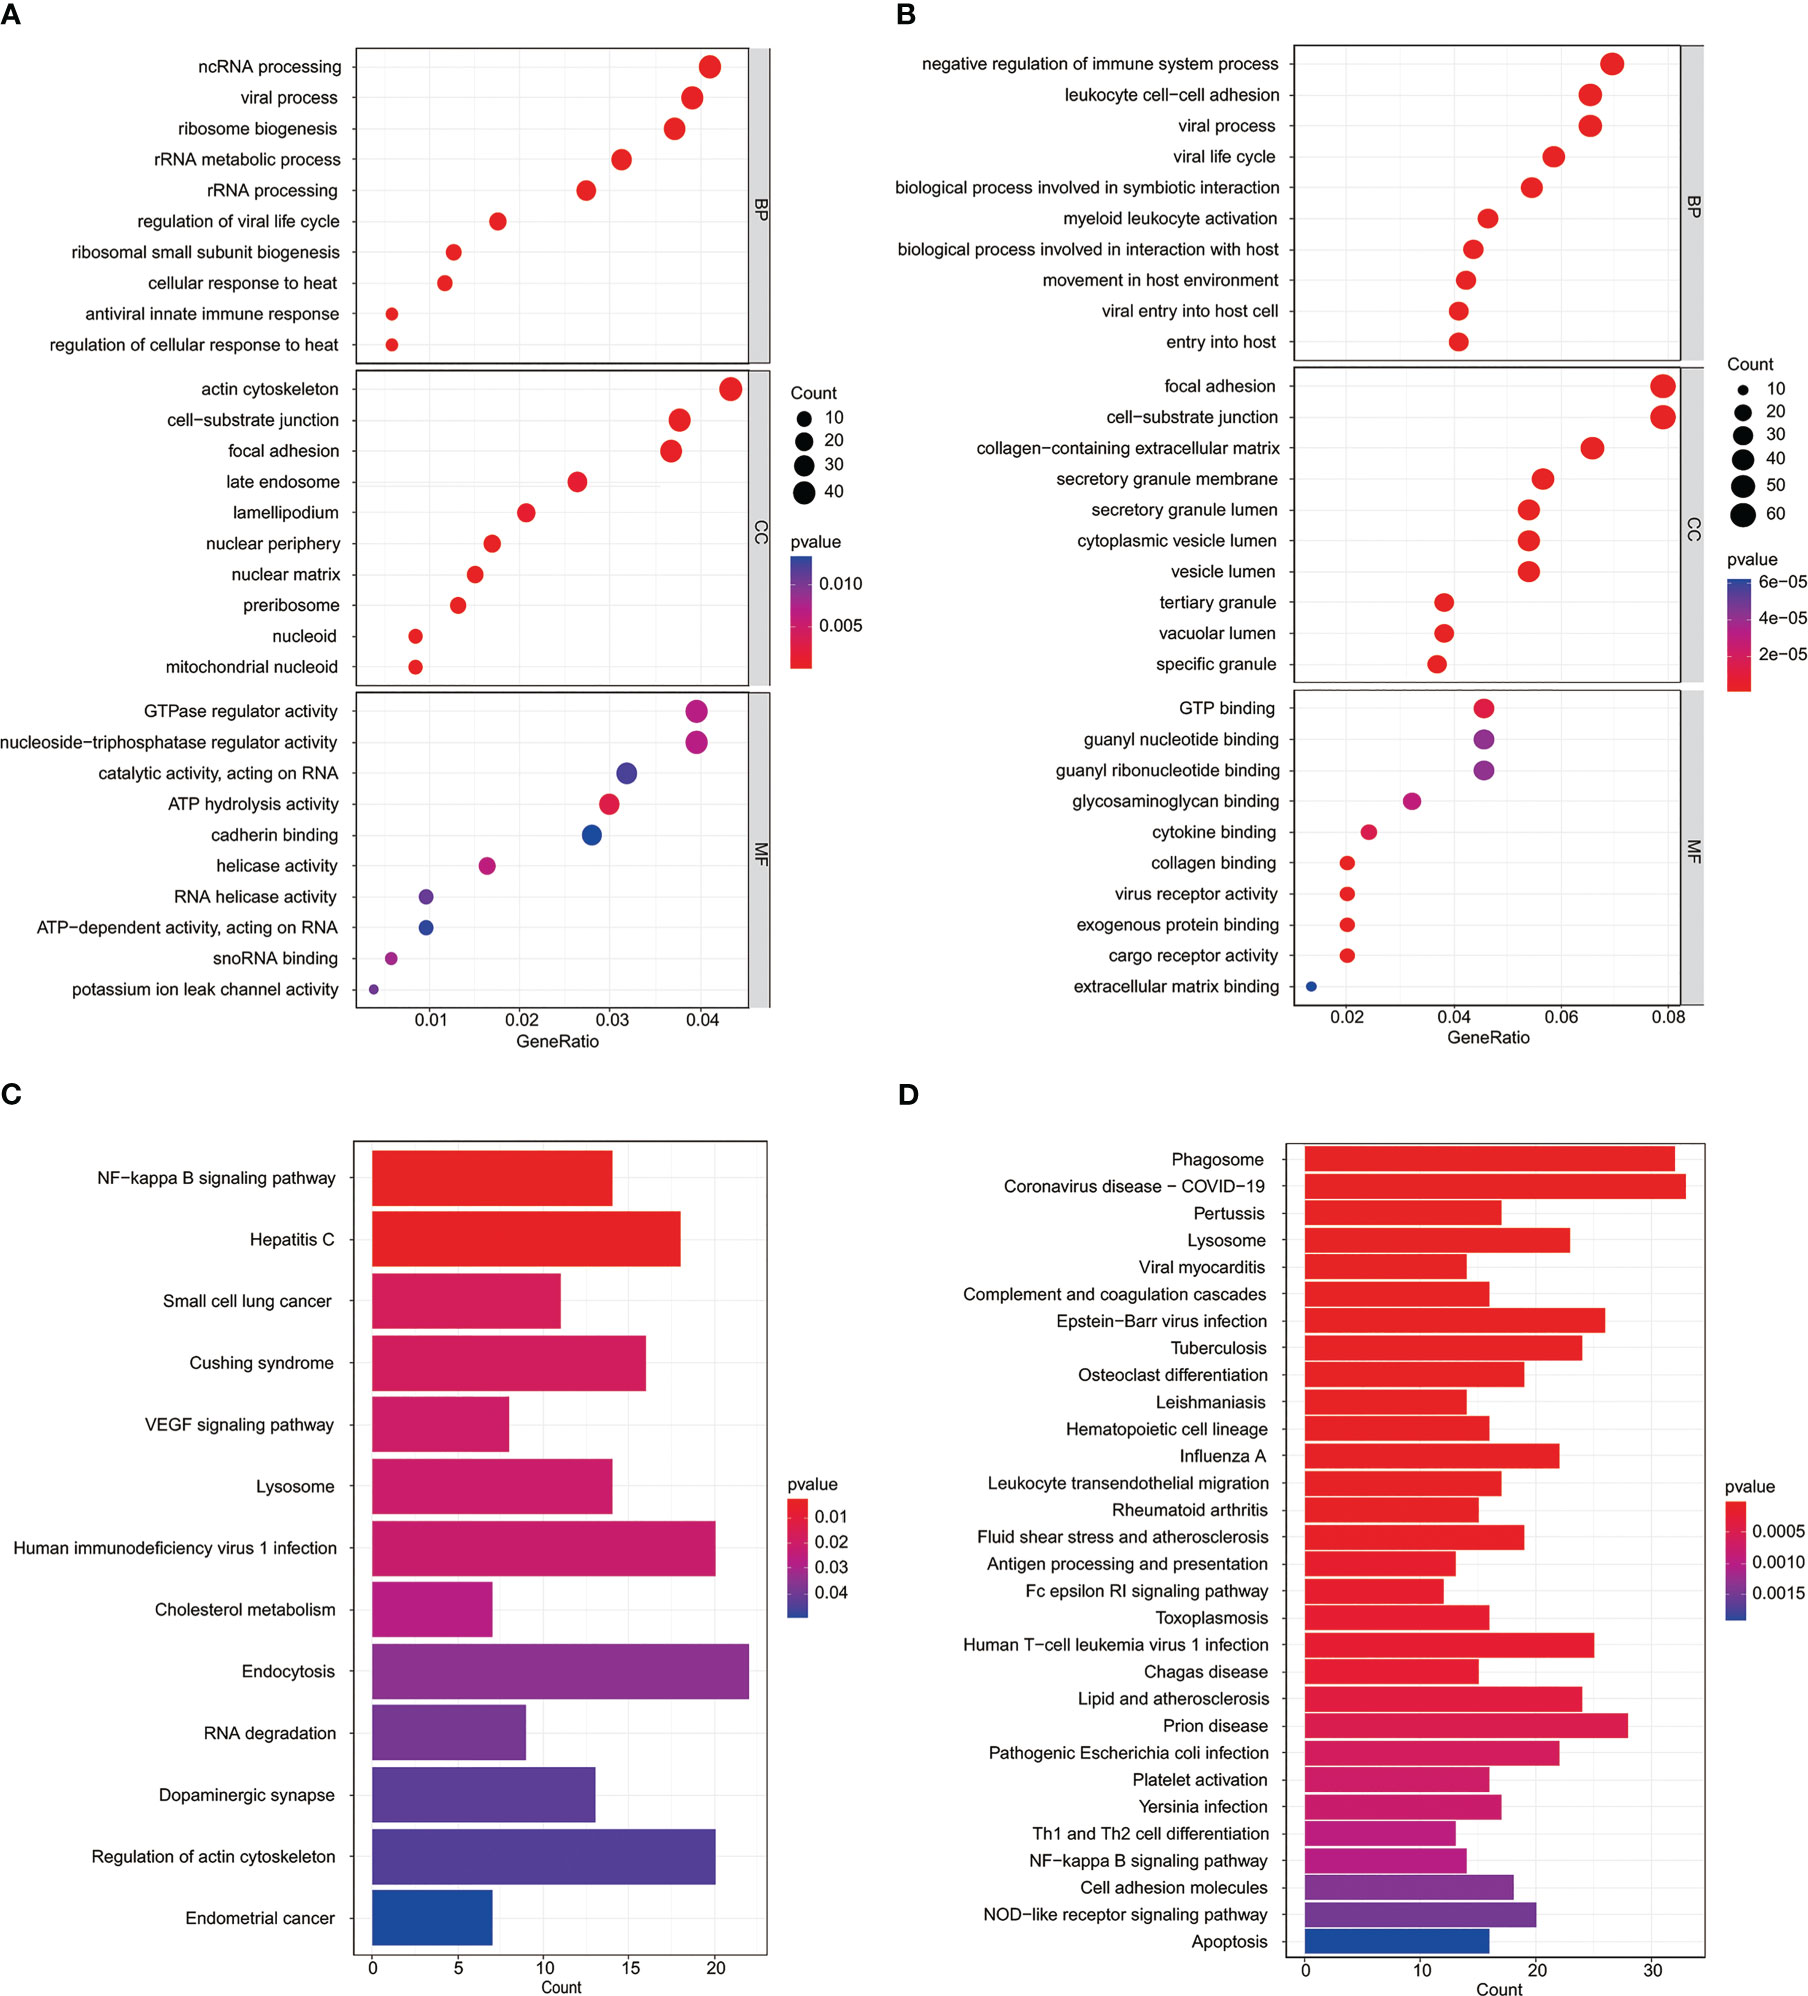
Figure 6 Functional analysis of the MYC target genes set signature. GO analysis of risk score-related genes in the TARGET datasets (A) and GSE datasets (B). KEGG enrichment analysis of risk score-related genes in the TARGET datasets (C) and GSE datasets (D).
Investigating more fully the role of these MYC target genes in osteosarcoma, we analyzed these genes. STX10 has been poorly studied in osteosarcoma, and functional tests have yet to be performed. A comprehensive analysis of GSE36002 databases revealed that STX10 was highly expressed in osteosarcoma tissues compared to normal tissues (Figure 7A). The qPCR was utilized to analyze the STX10 expression levels in several osteosarcoma cell lines. Results demonstrated that the mRNA levels of STX10 expression were relatively elevated in MG-63 and 143B osteosarcoma cells (Figure 7B). Later, we knocked down MYC in MG-63 and 143B and detected the expression of MYC and STX10 with qPCR. We found that the expression of STX10 also followed the knockdown of MYC (Figures 7C, D). This indicates that MYC targets STX10. Then, the expression of STX10 in 143B and MG-63 cells was knocked down by siRNA, and qPCR and Western blotting detected the knockdown efficiency. The results indicated that the sequence si-STX10 (1) can effectively downregulate STX10 mRNA and protein expression in 143B and MG-63 cell lines (Figures 7E–G). Next, we analyzed cellular viability by evaluating the CCK-8 test and found that the survivability of 143B and MG-63 cells declined after silencing STX10 compared to the negative control cells (Figures 7H, I). Finally, the cell migration assays and invasion tests have shown that knockdown of the STX10 has hindered the migration and invasion ability of MG-63 and 143B osteosarcoma cells (Figures 7J–M). The findings suggest that STX10 has the potential to be a new target for osteosarcoma.
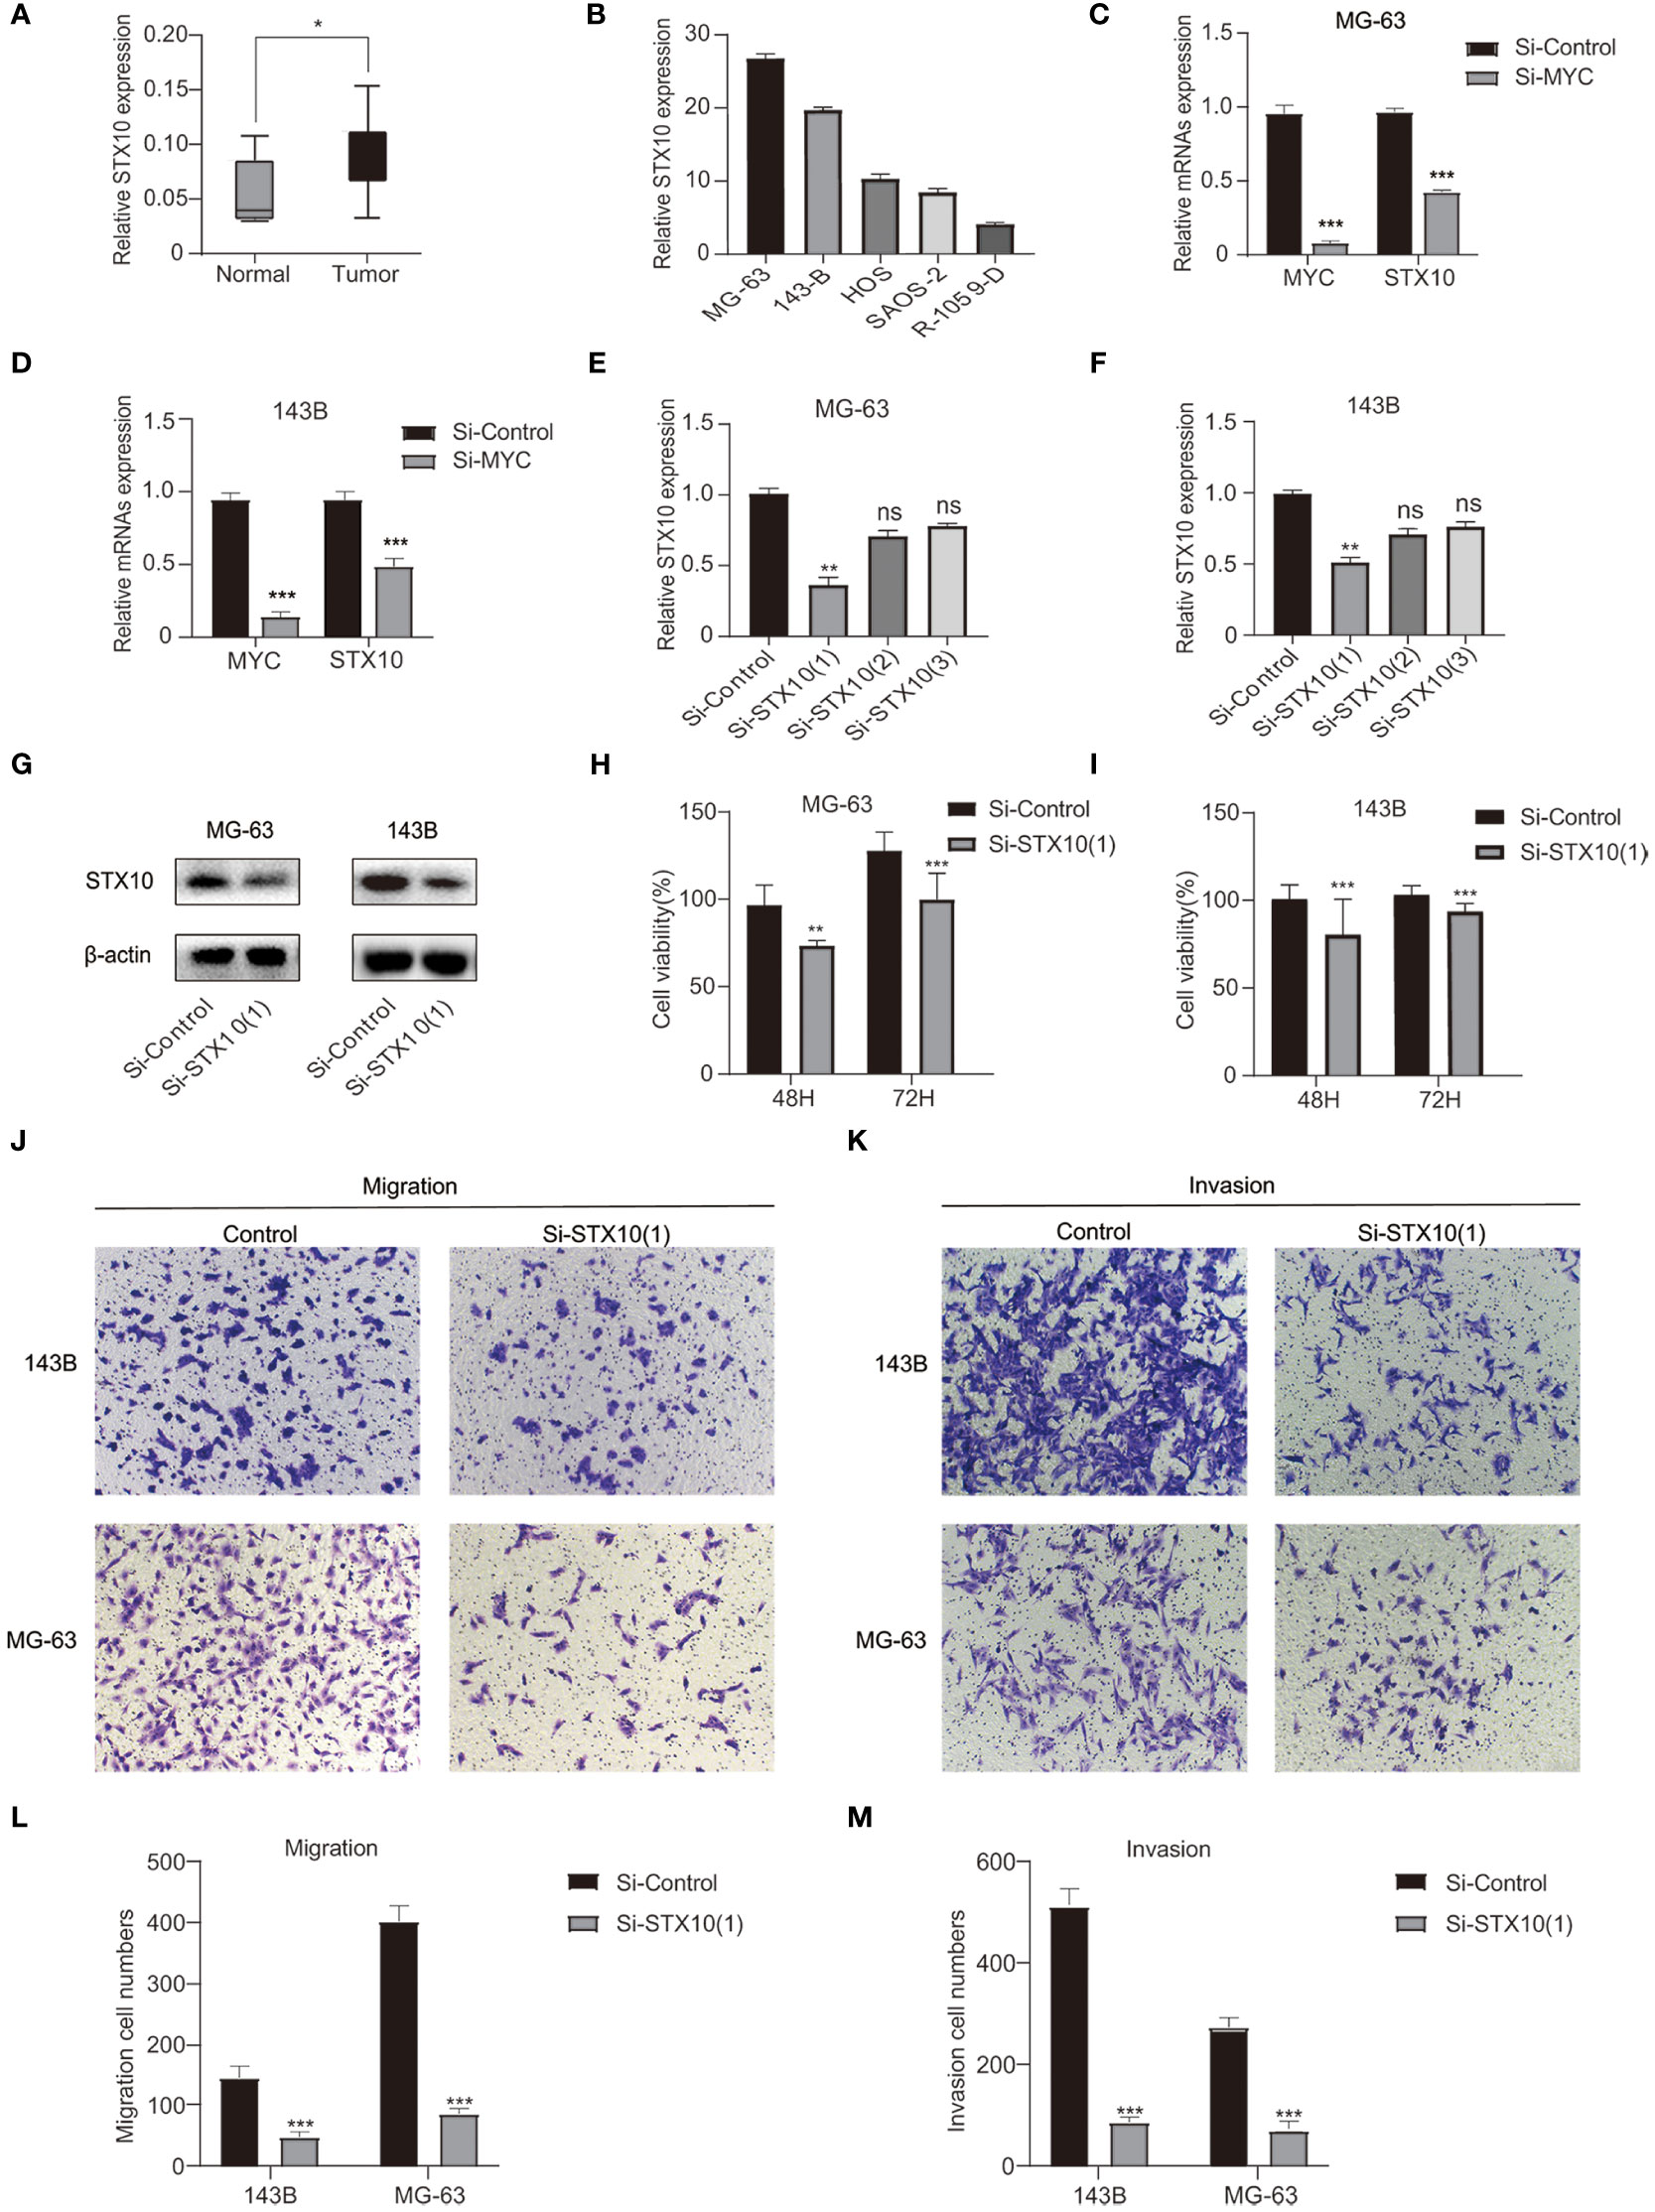
Figure 7 Confirmation of the knockdown efficiency. (A) Differential expression of STX10 in normal and tumor tissue in the GSE36002 database. (B) STX10 relative expression levels in five osteosarcoma cell lines. (C, D) The expression levels of MYC and STX10 in MG-63 and 143B were detected by qPCR after knocking down MYC. (E–G) STX10 knockdown levels in MG-63 and 143-B cells were detected via qPCR and Western blot. (H) Cell viability (%) of CCK8 experiment in MG-63 cells and (I) 143B cells. (J) Representative migration test imaging or counting (L) after STX10 knockdown in MG-63 and 143-B cells. (K) Representative invasion test imaging or counting (M) after STX10 knockdown in MG-63 and 143-B cells. ***p< 0.001, **p< 0.01, *p< 0.05, ns reflects p > 0.05.
Osteosarcoma is a bone tumor commonly found in children and young adults (28, 29). It has become a severe health burden worldwide (30). Patients suffering from osteosarcoma must be aggressively treated and frequently followed up. Although robust biomarkers are necessary, most candidate biomarkers need more prediction and prognostic performance. In osteosarcoma, however, these factors are restricted in their accuracy, sensitivity, and specificity (31). Recent studies proved that the aberrant expression of individual MYC target genes is involved with osteosarcoma initiation, progression, and metastasis and thus serves as a predictive and prognostic biomarker for osteosarcoma (32–35). However, the relationship between the MYC target gene set and the tumor is unknown. Thus, we focus on the heterogeneity of osteosarcoma and the association between the MYC target gene set and tumor cells, which were crucial for studying the mechanism of tumor initiation and progression and discovering new approaches to therapy.
Over the past several years, specific prognostic models have been developed to help clinicians treat osteosarcoma. Zhan et al. built a prognosis model based on five SE genes using SE-related genes from osteosarcoma (36). Qi et al. built a risk score model based on 14 genes associated with autophagy that could predict the prognosis in patients with osteosarcoma. However, the treatment and prognosis of patients suffering from osteosarcoma are still inadequate. In this study, using the MYC target gene set and osteosarcoma clinical data obtained from the TARGET database, the 10 genes’ prognostic signature was identified to predict the prognosis of patients with osteosarcoma via LASSO regression analysis. Compared with the optimal subset and ridge regression, LASSO eliminates the factors that have little influence on the dependent variables, ensuring the model’s simplicity. On the other hand, it also ensures the stability and reliability of the model and realizes the combination and optimization of the characteristics of the optimal subset and ridge regression (37). LASSO can be used in variable screening, whether it is a continuous variable, dichotomous variable, or multiple categorical variables. LASSO improved the prediction accuracy and robustness of the prediction model because of its stability and simplicity in variable screening, effectiveness in dealing with high-dimensional small sample data, and reliability in solving multicollinearity problems. At present, LASSO has been combined with Cox regression to study the survival prediction of tumors (38, 39), which is the kind of research we used. Moreover, it is the first time to construct a prognosis model using the MYC target gene set. Considering the heterogeneity and complexity of osteosarcoma, the prognosis model constructed by a single gene may be challenging to predict the prognosis accurately. Our prognostic signature constructed by the whole MYC target gene may have higher accuracy and sensitivity. This may provide a new direction for evaluating the prognosis of osteosarcoma patients.
In our prognostic signature, we have identified 10 MYC target genes with prognostic value in osteosarcoma. Furthermore, the findings have shown that high STX10 expression was correlated with increased risk, and the survival rate of patients in the high-risk group was significantly lower than that in the low-risk group. Furthermore, the signature of the MYC target gene set can properly split osteosarcoma samples into high- and low-risk groups in terms of gender, age, and metastasis, and the survival rate is significantly different. Moreover, we tested our signature in the validation cohort and determined that our model was accurate. From this point of view, this signature was reliable and yielded promising results in predicting the prognosis of osteosarcoma patients.
Moreover, TIME plays an essential role in a patient’s prognosis. Since the progression of the tumor relates to the alteration in the surrounding stroma, immune cells are a significant part of the tumor stroma (40). Tumor purity is closely related to the prognosis of tumor patients (41, 42). In our study, the low-risk group has lower tumor purity levels and higher immune score levels. Prior to this, Zhang et al. (43) and Hong et al. (44) confirmed that low tumor purity and high immune score were associated with improved prognosis in osteosarcoma. Our findings follow earlier reports. Moreover, it has been widely acknowledged that the infiltration of immune cells in the TIME regulates several tumor characteristics, including metastatic potential and malignancy (45–47). In addition, immune checkpoints are frequently elevated in the TIME of many malignancies (48). Here, we compared the abundance of immune cells and the expression of various immune checkpoint molecules among the two risk groups. After that, the TIME of osteosarcoma consists primarily of macrophages, neutrophils, and other subpopulations (29). In this research, we showed that the levels of macrophages and neutrophils in low-risk patients were higher than those in high-risk groups. Tuo et al. detected that osteosarcoma patients with high levels of macrophage infiltration in the TIME had a worse prognosis (49). Research shows that there are two types of macrophages: M1 and M2 (50). It has been acknowledged that M1 macrophages can inhibit the progression of osteosarcoma, and M2 macrophages promote the metastasis of osteosarcoma and are related to poor prognosis (51–53). Furthermore, studies have shown that HAVCR2, an immune checkpoint molecule, expresses on innate immune cells such as macrophages and plays various regulatory roles in it (54). The role of HAVCR2 in macrophages is complex (55); increasing lines of evidence show that HAVCR2 in macrophages can balance the activation between M1 and M2 macrophages (56, 57). It is suggested that the polarization level of M1 macrophages may be related to improving prognosis in patients with osteosarcoma. Moreover, neutrophils also play a role in inhibiting cancer. Neutrophils in mice with MMTV-myc breast cancer may inhibit cancer growth by producing H2O2 (58). Neutrophils slow cancer growth through cancer-related inflammation (59) and indirectly kill cancer cells by producing chemokines to recruit T cells and other leukocytes (60). Furthermore, Yang et al. found that high levels of neutrophils may inhibit the metastasis of osteosarcoma (61). The above findings are consistent with our results. Therefore, our signature may be related to the osteosarcoma immune environment and influence the prognosis of osteosarcoma.
Today, immunotherapy has attracted a great deal of attention because of its efficacy in treating various tumors, and a large number of pre-clinical and clinical trials have been performed in osteosarcoma. Nevertheless, more progress has to be made in immune therapy for osteosarcoma (62–64). It is believed that TIDE shows a significant effect in predicting inhibitors’ effectiveness of immune checkpoint. Taking advantage of CTLA-4 and PD-1 immunosuppressors to treat malignant tumors has also been successful in many tumors. However, the efficacy of these treatments differs between cancer types (65, 66). Our findings showed that high-risk patients could react better and benefit from PD1 immunotherapy. Li et al. constructed a metabolic-related gene pair (MRGP) signature in osteosarcoma. They used a similar method to find that the low-risk group of MRGP may be appropriate for anti-PD-1 therapy (67). Currently, anti-PD-1/PD-L1 is a new type of immune checkpoint inhibitor that can inhibit tumors by regulating the interaction between immune cells and tumor cells. PD-1/PD-L1 inhibitors have been approved for treating specific types of tumors and achieved good clinical efficacy (68). In the same way, PD-1 may bring new hope for treating osteosarcoma patients. After that, we identified the sensitivity of low- and high-risk osteosarcoma patients to four chemotherapy medications. Aruna Marchetto et al. proved that Elesclomol treatment strongly reduced the growth of EwS cells and induced apoptosis in their in vivo models (69). Since the clinical development of Elesclomol has been discontinued, looking for other compounds as substitutes deserves further study. Standard processing of newly synthesized proteins in the ER is dependent mainly on Ca2+ homeostasis, the disruption of which can induce ER stress responses (70). Thapsigargin, an endoplasmic reticulum Ca2+-ATPase inhibitor (71), may induce ER stress associated with elevated Ca2+. Long-term exposure to this drug induces tumor cell apoptosis in patients with osteosarcoma (72). This may point out the direction for the treatment of osteosarcoma. GDC0941 can exert an anti-tumor effect on ovarian and colorectal cancer (73, 74). AKT inhibitor VIII rendered gastric cancer cells susceptible to hyperthermia-induced apoptosis (75). However, these two drugs have not been used in osteosarcoma, which may bring new hope for treating osteosarcoma patients. In short, our results determined that patients in the high-risk group responded more effectively to chemotherapy (Elesclomol and Thapsigargin), which would provide researchers a new insight into developing more effective chemotherapeutic drugs.
GO functional enrichment was analyzed to find out more about the biological connections between these genes. We noticed that these were enriched in terms of functions linked to cell components, such as cell–substrate junction and focal adhesion. It has been well-demonstrated that the cell–substrate connection is involved in the EMT process, thereby affecting tumor cell migration (76, 77). Focal adhesions, an integrin-containing protein complex, are regulated by an interaction network among hundreds of proteins (78). Multiple pro-survival signaling molecules make up the focal adhesion signaling hub, including growth factor receptors and integrins, which tightly regulate cellular activity and affect tumor cell survival (79). In the past, the cell–substrate junction (80) and focal adhesions (81) were relevant to the development and metastasis of osteosarcoma.
Moreover, enriched KEGG pathways include the NF-kappa B signaling pathway and lysosome. NF-kappa B governs a sea of genes involved in immuno-inflammatory responses and inhibition of cell adhesion, thereby promoting carcinogenesis and tumor progression (82). Dysregulation of the NF-kappa B transcription machinery is considered a joint event in advancing malignant tumors (83). Jin et al. indicated that the activation of NF-kappa B signaling might be associated with end-stage cancer and promotes tumor metastasis by affecting angiogenesis and tumor cell migration (84). In addition, Sun et al. showed that INSR and IGF1R were directly targeted by MYC and promoted tumorigenesis and metastasis of tongue squamous cell carcinoma through the NF-kappa B pathway (85). After that, lysosomes can regulate tumor cell growth and proliferation by providing nutrients and manipulating growth factor signals. In most cases, upregulated cathepsin in lysosomes is related to migration, invasion, and metastasis, implying tumor progression and poor prognosis (86). Yun et al. reported that MYC directly inhibits transcription factor EB (TFEB). TFEB is the primary regulator of the autophagy–lysosomal pathway and plays a role in suppressing cancer in acute myeloid leukemia and induces differentiation and death of acute myeloid leukemia cells (87). STX10 gene belongs to the synthetic toxin family, which is highly expressed in bone marrow, lung, and other tissues. It is a protein-coding gene encoding SNARE located in the trans-Golgi network (TGN) (88). Studies have found the potential role of the STX10 gene in some diseases (89). However, its role in osteosarcoma is unknown. Functional tests showed that STX10 knockdown could inhibit the proliferation, migration, and invasion of osteosarcoma cells. These may become therapeutic targets for osteosarcoma patients.
To conclude, the MYC target gene set signature is described as an independent prognostic factor of osteosarcoma that can be most beneficial by merging with more independent datasets and even enhanced by optimizing LASSO outcomes in the future. In the meantime, the different immunity characteristics of patients with osteosarcoma in both risk groups were presented. The functional experiment has shown that STX10 may affect osteosarcoma cells’ migration, invasion, and proliferation. These findings of our study provide a way to predict the survival and prognosis of osteosarcoma patients and can offer promising therapeutic targets.
The datasets presented in this study can be found in online repositories. The names of the repository/repositories and accession number(s) can be found in the article material. Further inquiries can be directed to the corresponding authors.
EB and DT designed this article. DG and QZ were responsible for data analysis and implementing the experiments. These authors contributed equally to this work and share first authorship. JLi and SZ collected the data. CY screened and checked the data. JL and HY drafted the manuscript. EB and DT revised the manuscript and were responsible for the whole study. All authors made substantial contributions to the study and provided the approval of the submitted version.
This research was funded by the Clinical Research and Cultivation Program of the Second Hospital of Anhui Medical University (2020LCZD05), the Translational Medicine Research Foundation of the Second Hospital of Anhui Medical University (2022ZHYJ13), the Key Projects of Natural Science Research in Colleges and Universities in Anhui Province (2022AH040102), and the Research Foundation of Anhui Institute of Translational Medicine (No. 2022zhyx-C49).
The authors thank the TARGET network and the GEO network for their contributions.
The authors declare that the research was conducted in the absence of any commercial or financial relationships that could be construed as a potential conflict of interest.
All claims expressed in this article are solely those of the authors and do not necessarily represent those of their affiliated organizations, or those of the publisher, the editors and the reviewers. Any product that may be evaluated in this article, or claim that may be made by its manufacturer, is not guaranteed or endorsed by the publisher.
The Supplementary Material for this article can be found online at: https://www.frontiersin.org/articles/10.3389/fonc.2023.1169430/full#supplementary-material
1. Sugalski AJ, Jiwani A, Ketchum NS, Cornell J, Williams R, Heim-Hall J, et al. Characterization of localized osteosarcoma of the extremity in children, adolescents, and young adults from a single institution in south Texas. J Pediatr hematology/oncology (2014) 36(6):e353–8. doi: 10.1097/mph.0000000000000104
2. Binnewies M, Roberts EW, Kersten K, Chan V, Fearon DF, Merad M, et al. Understanding the tumor immune microenvironment (Time) for effective therapy. Nat Med (2018) 24(5):541–50. doi: 10.1038/s41591-018-0014-x
3. Martin JW, Squire JA, Zielenska M. The genetics of osteosarcoma. Sarcoma (2012) 2012:627254. doi: 10.1155/2012/627254
4. Nandra R, Parry M, Forsberg J, Grimer R. Can a Bayesian belief network be used to estimate 1-year survival in patients with bone sarcomas? Clin orthopaedics related Res (2017) 475(6):1681–9. doi: 10.1007/s11999-017-5346-1
5. Anderson ME. Update on survival in osteosarcoma. Orthopedic Clinics North America (2016) 47(1):283–92. doi: 10.1016/j.ocl.2015.08.022
6. Setty BA, Jin Y, Houghton PJ, Yeager ND, Gross TG, Nelin LD. Hypoxic proliferation of osteosarcoma cells depends on arginase ii. Cell Physiol Biochem (2016) 39(2):802–13. doi: 10.1159/000447790
7. Zhang D, Cui G, Sun C, Lei L, Lei L, Williamson RA, et al. Hypoxia promotes osteosarcoma cell proliferation and migration through enhancing platelet-derived growth factor-Bb/Platelet-Derived growth factor receptor-B axis. Biochem Biophys Res Commun (2019) 512(2):360–6. doi: 10.1016/j.bbrc.2019.03.040
8. Sheen H, Kim W, Byun BH, Kong CB, Song WS, Cho WH, et al. Metastasis risk prediction model in osteosarcoma using metabolic imaging phenotypes: a multivariable radiomics model. PloS One (2019) 14(11):e0225242. doi: 10.1371/journal.pone.0225242
9. Zhang X, Guan Z. Pet/Ct in the diagnosis and prognosis of osteosarcoma. Front bioscience (Landmark edition) (2018) 23(11):2157–65. doi: 10.2741/4696
10. Ben-Dayan MM, Ow TJ, Belbin TJ, Wetzler J, Smith RV, Childs G, et al. Nonpromoter methylation of the Cdkn2a gene with active transcription is associated with improved locoregional control in laryngeal squamous cell carcinoma. Cancer Med (2017) 6(2):397–407. doi: 10.1002/cam4.961
11. Wong N, Khwaja SS, Baker CM, Gay HA, Thorstad WL, Daly MD, et al. Prognostic microrna signatures derived from the cancer genome atlas for head and neck squamous cell carcinomas. Cancer Med (2016) 5(7):1619–28. doi: 10.1002/cam4.718
12. Zhang G, Fan E, Zhong Q, Feng G, Shuai Y, Wu M, et al. Identification and potential mechanisms of a 4-lncrna signature that predicts prognosis in patients with laryngeal cancer. Hum Genomics (2019) 13(1):36. doi: 10.1186/s40246-019-0230-6
13. Whelan JS, Davis LE. Osteosarcoma, chondrosarcoma, and chordoma. J Clin Oncol (2018) 36(2):188–93. doi: 10.1200/jco.2017.75.1743
14. Wang D, Niu X, Wang Z, Song CL, Huang Z, Chen KN, et al. Multiregion sequencing reveals the genetic heterogeneity and evolutionary history of osteosarcoma and matched pulmonary metastases. Cancer Res (2019) 79(1):7–20. doi: 10.1158/0008-5472.Can-18-1086
15. Sheiness D, Bishop JM. DNA And rna from uninfected vertebrate cells contain nucleotide sequences related to the putative transforming gene of avian myelocytomatosis virus. J Virol (1979) 31(2):514–21. doi: 10.1128/jvi.31.2.514-521.1979
16. Meyer N, Penn LZ. Reflecting on 25 years with myc. Nat Rev Cancer (2008) 8(12):976–90. doi: 10.1038/nrc2231
17. Li H, Liu J, Cao W, Xiao X, Liang L, Liu-Smith F, et al. C-Myc/Mir-150/Epg5 axis mediated dysfunction of autophagy promotes development of non-small cell lung cancer. Theranostics (2019) 9(18):5134–48. doi: 10.7150/thno.34887
18. Qu Y, Yang Q, Liu J, Shi B, Ji M, Li G, et al. C-myc is required for Braf(V600e)-induced epigenetic silencing by H3k27me3 in tumorigenesis. Theranostics (2017) 7(7):2092–107. doi: 10.7150/thno.19884
19. Hann SR. Myc cofactors: molecular switches controlling diverse biological outcomes. Cold Spring Harbor Perspect Med (2014) 4(9):a014399. doi: 10.1101/cshperspect.a014399
20. Cole MD. Myc association with cancer risk and a new model of myc-mediated repression. Cold Spring Harbor Perspect Med (2014) 4(7):a014316. doi: 10.1101/cshperspect.a014316
22. Feng W, Dean DC, Hornicek FJ, Spentzos D, Hoffman RM, Shi H, et al. Myc is a prognostic biomarker and potential therapeutic target in osteosarcoma. Ther Adv Med Oncol (2020) 12. doi: 10.1177/1758835920922055
23. Han G, Wang Y, Bi W. C-myc overexpression promotes osteosarcoma cell invasion Via activation of mek-erk pathway. Oncol Res (2012) 20(4):149–56. doi: 10.3727/096504012x13522227232237
24. Teye K, Tsuneoka M, Arima N, Koda Y, Nakamura Y, Ueta Y, et al. Increased expression of a myc target gene Mina53 in human colon cancer. Am J Pathol (2004) 164(1):205–16. doi: 10.1016/s0002-9440(10)63111-2
25. Butt AJ, Sergio CM, Inman CK, Anderson LR, McNeil CM, Russell AJ, et al. The estrogen and c-myc target gene Hspc111 is over-expressed in breast cancer and associated with poor patient outcome. Breast Cancer Res (2008) 10(2):R28. doi: 10.1186/bcr1985
26. Jiang P, Gu S, Pan D, Fu J, Sahu A, Hu X, et al. Signatures of T cell dysfunction and exclusion predict cancer immunotherapy response. Nat Med (2018) 24(10):1550–8. doi: 10.1038/s41591-018-0136-1
27. Hoshida Y, Brunet JP, Tamayo P, Golub TR, Mesirov JP. Subclass mapping: identifying common subtypes in independent disease data sets. PloS One (2007) 2(11):e1195. doi: 10.1371/journal.pone.0001195
28. Wedekind MF, Wagner LM, Cripe TP. Immunotherapy for osteosarcoma: where do we go from here? Pediatr Blood Cancer (2018) 65(9):e27227. doi: 10.1002/pbc.27227
29. Heymann MF, Lézot F, Heymann D. The contribution of immune infiltrates and the local microenvironment in the pathogenesis of osteosarcoma. Cell Immunol (2019) 343:103711. doi: 10.1016/j.cellimm.2017.10.011
30. Li Z, Dou P, Liu T, He S. Application of long noncoding rnas in osteosarcoma: biomarkers and therapeutic targets. Cell Physiol Biochem (2017) 42(4):1407–19. doi: 10.1159/000479205
31. Zhang GZ, Wu ZL, Li CY, Ren EH, Yuan WH, Deng YJ, et al. Development of a machine learning-based autophagy-related lncrna signature to improve prognosis prediction in osteosarcoma patients. Front Mol Biosci (2021) 8:615084. doi: 10.3389/fmolb.2021.615084
32. Czarnecka AM, Synoradzki K, Firlej W, Bartnik E, Sobczuk P, Fiedorowicz M, et al. Molecular Biology of Osteosarcoma. Cancers (2020) 12(8):2130. doi: 10.3390/cancers12082130
33. Gao J, Ma S, Yang F, Chen X, Wang W, Zhang J, et al. Mir−193b exhibits mutual interaction with myc, and suppresses growth and metastasis of osteosarcoma. Oncol Rep (2020) 44(1):139–55. doi: 10.3892/or.2020.7601
34. Chen D, Zhao Z, Huang Z, Chen DC, Zhu XX, Wang YZ, et al. Super enhancer inhibitors suppress myc driven transcriptional amplification and tumor progression in osteosarcoma. Bone Res (2018) 6:11. doi: 10.1038/s41413-018-0009-8
35. Yu W, Tang L, Lin F, Yao Y, Shen Z. Dgkz acts as a potential oncogene in osteosarcoma proliferation through its possible interaction with Erk1/2 and myc pathway. Front Oncol (2018) 8:655. doi: 10.3389/fonc.2018.00655
36. Ouyang Z, Li G, Zhu H, Wang J, Qi T, Qu Q, et al. Construction of a five-Super-Enhancer-Associated-Genes prognostic model for osteosarcoma patients. Front Cell Dev Biol (2020) 8:598660. doi: 10.3389/fcell.2020.598660
37. Xi LJ, Guo ZY, Yang XK, Ping ZG. [Application of lasso and its extended method in variable selection of regression analysis]. Chin J Prev Med (2023) 57(1):107–11. doi: 10.3760/cma.j.cn112150-20220117-00063
38. Xie G, Dong C, Kong Y, Zhong JF, Li M, Wang K. Group lasso regularized deep learning for cancer prognosis from multi-omics and clinical features. Genes (2019) 10(3):240. doi: 10.3390/genes10030240
39. Jiang Y, Zhang Q, Hu Y, Li T, Yu J, Zhao L, et al. Immunoscore signature: a prognostic and predictive tool in gastric cancer. Ann Surg (2018) 267(3):504–13. doi: 10.1097/sla.0000000000002116
40. Hinshaw DC, Shevde LA. The tumor microenvironment innately modulates cancer progression. Cancer Res (2019) 79(18):4557–66. doi: 10.1158/0008-5472.Can-18-3962
41. Aran D, Sirota M, Butte AJ. Systematic pan-cancer analysis of tumour purity. Nat Commun (2015) 6:8971. doi: 10.1038/ncomms9971
42. Li T, Fan J, Wang B, Traugh N, Chen Q, Liu JS, et al. Timer: a web server for comprehensive analysis of tumor-infiltrating immune cells. Cancer Res (2017) 77(21):e108–e10. doi: 10.1158/0008-5472.Can-17-0307
43. Zhang C, Zheng JH, Lin ZH, Lv HY, Ye ZM, Chen YP, et al. Profiles of immune cell infiltration and immune-related genes in the tumor microenvironment of osteosarcoma. Aging (2020) 12(4):3486–501. doi: 10.18632/aging.102824
44. Hong W, Yuan H, Gu Y, Liu M, Ji Y, Huang Z, et al. Immune-related prognosis biomarkers associated with osteosarcoma microenvironment. Cancer Cell Int (2020) 20:83. doi: 10.1186/s12935-020-1165-7
45. Manandhar S, Lee YM. Emerging role of Runx3 in the regulation of tumor microenvironment. BMB Rep (2018) 51(4):174–81. doi: 10.5483/bmbrep.2018.51.4.033
46. Steven A, Seliger B. The role of immune escape and immune cell infiltration in breast cancer. Breast Care (Basel Switzerland) (2018) 13(1):16–21. doi: 10.1159/000486585
47. Lee YS, Cho YB. Ccl7 signaling in the tumor microenvironment. Adv Exp Med Biol (2020) 1231:33–43. doi: 10.1007/978-3-030-36667-4_4
48. Toor SM, Sasidharan Nair V, Decock J, Elkord E. Immune checkpoints in the tumor microenvironment. Semin Cancer Biol (2020) 65:1–12. doi: 10.1016/j.semcancer.2019.06.021
49. Liang T, Chen J, Xu G, Zhang Z, Xue J, Zeng H, et al. Tyrobp, Tlr4 and itgam regulated macrophages polarization and immune checkpoints expression in osteosarcoma. Sci Rep (2021) 11(1):19315. doi: 10.1038/s41598-021-98637-x
50. Buddingh EP, Kuijjer ML, Duim RA, Bürger H, Agelopoulos K, Myklebost O, et al. Tumor-infiltrating macrophages are associated with metastasis suppression in high-grade osteosarcoma: a rationale for treatment with macrophage activating agents. Clin Cancer Res (2011) 17(8):2110–9. doi: 10.1158/1078-0432.Ccr-10-2047
51. Zhao Y, Zhang B, Zhang Q, Ma X, Feng H. Tumor-associated macrophages in osteosarcoma. J Zhejiang Univ Sci B (2021) 22(11):885–92. doi: 10.1631/jzus.B2100029
52. Liu Y, Cao X. Characteristics and significance of the pre-metastatic niche. Cancer Cell (2016) 30(5):668–81. doi: 10.1016/j.ccell.2016.09.011
53. Cersosimo F, Lonardi S, Bernardini G, Telfer B, Mandelli GE, Santucci A, et al. Tumor-associated macrophages in osteosarcoma: from mechanisms to therapy. Int J Mol Sci (2020) 21(15):5207. doi: 10.3390/ijms21155207
54. Han G, Chen G, Shen B, Li Y. Tim-3: an activation marker and activation limiter of innate immune cells. Front Immunol (2013) 4:449. doi: 10.3389/fimmu.2013.00449
55. Ocaña-Guzman R, Torre-Bouscoulet L, Sada-Ovalle I. Tim-3 regulates distinct functions in macrophages. Front Immunol (2016) 7:229. doi: 10.3389/fimmu.2016.00229
56. Yu A, Zhang X, Li M, Ye P, Duan H, Zhang T, et al. Tim-3 enhances brain inflammation by promoting M1 macrophage polarization following intracerebral hemorrhage in mice. Int Immunopharmacol (2017) 53:143–8. doi: 10.1016/j.intimp.2017.10.023
57. Sun J, Huang Q, Li S, Meng F, Li X, Gong X. Mir-330-5p/Tim-3 axis regulates macrophage M2 polarization and insulin resistance in diabetes mice. Mol Immunol (2018) 95:107–13. doi: 10.1016/j.molimm.2018.02.006
58. Xiong S, Dong L, Cheng L. Neutrophils in cancer carcinogenesis and metastasis. J Hematol Oncol (2021) 14(1):173. doi: 10.1186/s13045-021-01187-y
59. Triner D, Devenport SN, Ramakrishnan SK, Ma X, Frieler RA, Greenson JK, et al. Neutrophils restrict tumor-associated microbiota to reduce growth and invasion of colon tumors in mice. Gastroenterology (2019) 156(5):1467–82. doi: 10.1053/j.gastro.2018.12.003
60. Oberg HH, Wesch D, Kalyan S, Kabelitz D. Regulatory interactions between neutrophils, tumor cells and T cells. Front Immunol (2019) 10:1690. doi: 10.3389/fimmu.2019.01690
61. Yang B, Su Z, Chen G, Zeng Z, Tan J, Wu G, et al. Identification of prognostic biomarkers associated with metastasis and immune infiltration in osteosarcoma. Oncol Lett (2021) 21(3):180. doi: 10.3892/ol.2021.12441
62. Boye K, Longhi A, Guren T, Lorenz S, Næss S, Pierini M, et al. Pembrolizumab in advanced osteosarcoma: results of a single-arm, open-label, phase 2 trial. Cancer immunology immunotherapy (2021) 70(9):2617–24. doi: 10.1007/s00262-021-02876-w
63. Chen C, Xie L, Ren T, Huang Y, Xu J, Guo W. Immunotherapy for osteosarcoma: fundamental mechanism, rationale, and recent breakthroughs. Cancer Lett (2021) 500:1–10. doi: 10.1016/j.canlet.2020.12.024
64. Davis KL, Fox E, Merchant MS, Reid JM, Kudgus RA, Liu X, et al. Nivolumab in children and young adults with relapsed or refractory solid tumours or lymphoma (Advl1412): a multicentre, open-label, single-arm, phase 1-2 trial. Lancet Oncol (2020) 21(4):541–50. doi: 10.1016/s1470-2045(20)30023-1
65. Wen Y, Tang F, Tu C, Hornicek F, Duan Z, Min L. Immune checkpoints in osteosarcoma: recent advances and therapeutic potential. Cancer Lett (2022) 547:215887. doi: 10.1016/j.canlet.2022.215887
66. Yoshida K, Okamoto M, Sasaki J, Kuroda C, Ishida H, Ueda K, et al. Clinical outcome of osteosarcoma and its correlation with programmed death-ligand 1 and T cell activation markers. OncoTargets Ther (2019) 12:2513–8. doi: 10.2147/ott.S198421
67. Li LQ, Zhang LH, Yuan YB, Lu XC, Zhang Y, Liu YK, et al. Signature based on metabolic-related gene pairs can predict overall survival of osteosarcoma patients. Cancer Med (2021) 10(13):4493–509. doi: 10.1002/cam4.3984
68. Jiang K, Li J, Zhang J, Wang L, Zhang Q, Ge J, et al. Sdf-1/Cxcr4 axis facilitates myeloid-derived suppressor cells accumulation in osteosarcoma microenvironment and blunts the response to anti-Pd-1 therapy. Int Immunopharmacol (2019) 75:105818. doi: 10.1016/j.intimp.2019.105818
69. Marchetto A, Ohmura S, Orth MF, Knott MML, Colombo MV, Arrigoni C, et al. Oncogenic hijacking of a developmental transcription factor evokes vulnerability toward oxidative stress in Ewing sarcoma. Nat Commun (2020) 11(1):2423. doi: 10.1038/s41467-020-16244-2
70. Carreras-Sureda A, Pihán P, Hetz C. Calcium signaling at the endoplasmic reticulum: fine-tuning stress responses. Cell calcium (2018) 70:24–31. doi: 10.1016/j.ceca.2017.08.004
71. Jan CR, Chao YY. Novel effect of y-24180, a presumed specific platelet-activating factor receptor antagonist, on Ca2+ levels and growth of human osteosarcoma cells. Pharmacol Res (2005) 51(3):189–95. doi: 10.1016/j.phrs.2004.08.001
72. Saeed H, Sinha S, Mella C, Kuerbitz JS, Cales ML, Steele MA, et al. Aberrant epigenetic silencing of neuronatin is a frequent event in human osteosarcoma. Oncotarget (2020) 11(20):1876–93. doi: 10.18632/oncotarget.27583
73. Beale G, Haagensen EJ, Thomas HD, Wang LZ, Revill CH, Payne SL, et al. Combined Pi3k and Cdk2 inhibition induces cell death and enhances in vivo antitumour activity in colorectal cancer. Br J Cancer (2016) 115(6):682–90. doi: 10.1038/bjc.2016.238
74. Kim MJ, Lee SJ, Ryu JH, Kim SH, Kwon IC, Roberts TM. Combination of kras gene silencing and Pi3k inhibition for ovarian cancer treatment. J Controlled release (2020) 318:98–108. doi: 10.1016/j.jconrel.2019.12.019
75. Tao Y, Guo Y, Liu W, Zhang J, Li X, Shen L, et al. Akt inhibitor suppresses hyperthermia-induced Ndrg2 phosphorylation in gastric cancer cells. Braz J Med Biol Res (2013) 46(4):394–404. doi: 10.1590/1414-431x20122211
76. Baronsky T, Ruhlandt D, Brückner BR, Schäfer J, Karedla N, Isbaner S, et al. Cell-substrate dynamics of the epithelial-to-Mesenchymal transition. Nano Lett (2017) 17(5):3320–6. doi: 10.1021/acs.nanolett.7b01558
77. Paddillaya N, Mishra A, Kondaiah P, Pullarkat P, Menon GI, Gundiah N. Biophysics of cell-substrate interactions under shear. Front Cell Dev Biol (2019) 7:251. doi: 10.3389/fcell.2019.00251
78. Zhu L, Plow EF, Qin J. Initiation of focal adhesion assembly by talin and kindlin: a dynamic view. Protein Sci (2021) 30(3):531–42. doi: 10.1002/pro.4014
79. Eke I, Cordes N. Focal adhesion signaling and therapy resistance in cancer. Semin Cancer Biol (2015) 31:65–75. doi: 10.1016/j.semcancer.2014.07.009
80. Zhang H, Xu P, Song Y. Machine-Learning-Based M5c score for the prognosis diagnosis of osteosarcoma. J Oncol (2021) 2021:1629318. doi: 10.1155/2021/1629318
81. Gu HJ, Zhou B. Focal adhesion kinase promotes progression and predicts poor clinical outcomes in patients with osteosarcoma. Oncol Lett (2018) 15(5):6225–32. doi: 10.3892/ol.2018.8152
82. Okamoto T, Sanda T, Asamitsu K. Nf-kappa b signaling and carcinogenesis. Curr Pharm design (2007) 13(5):447–62. doi: 10.2174/138161207780162944
83. Baldwin AS Jr. The nf-kappa b and I kappa b proteins: new discoveries and insights. Annu Rev Immunol (1996) 14:649–83. doi: 10.1146/annurev.immunol.14.1.649
84. Jin R, Sterling JA, Edwards JR, DeGraff DJ, Lee C, Park SI, et al. Activation of nf-kappa b signaling promotes growth of prostate cancer cells in bone. PloS One (2013) 8(4):e60983. doi: 10.1371/journal.pone.0060983
85. Sun J, Lu Z, Deng Y, Wang W, He Q, Yan W, et al. Up-regulation of Insr/Igf1r by c-myc promotes tscc tumorigenesis and metastasis through the nf-Kb pathway. Biochim Biophys Acta Mol basis Dis (2018) 1864(5 Pt A):1873–82. doi: 10.1016/j.bbadis.2018.03.004
86. Zhang Z, Yue P, Lu T, Wang Y, Wei Y, Wei X. Role of lysosomes in physiological activities, diseases, and therapy. J Hematol Oncol (2021) 14(1):79. doi: 10.1186/s13045-021-01087-1
87. Yun S, Vincelette ND, Yu X, Watson GW, Fernandez MR, Yang C, et al. Tfeb links myc signaling to epigenetic control of myeloid differentiation and acute myeloid leukemia. Blood Cancer Discovery (2021) 2(2):162–85. doi: 10.1158/2643-3230.Bcd-20-0029
88. Wang Y, Tai G, Lu L, Johannes L, Hong W, Tang BL. Trans-golgi network syntaxin 10 functions distinctly from syntaxins 6 and 16. Mol membrane Biol (2005) 22(4):313–25. doi: 10.1080/09687860500143829
Keywords: MYC target gene set, osteosarcoma (OS), risk signature, prognosis, STX10
Citation: Gong D, Zhao Q, Liu J, Zhao S, Yi C, Lv J, Yu H, Bian E and Tian D (2023) Identification of a novel MYC target gene set signature for predicting the prognosis of osteosarcoma patients. Front. Oncol. 13:1169430. doi: 10.3389/fonc.2023.1169430
Received: 19 February 2023; Accepted: 04 May 2023;
Published: 05 June 2023.
Edited by:
Zhiqiang Liu, Tianjin Medical University, ChinaReviewed by:
Peng-Chan Lin, National Cheng Kung University, TaiwanCopyright © 2023 Gong, Zhao, Liu, Zhao, Yi, Lv, Yu, Bian and Tian. This is an open-access article distributed under the terms of the Creative Commons Attribution License (CC BY). The use, distribution or reproduction in other forums is permitted, provided the original author(s) and the copyright owner(s) are credited and that the original publication in this journal is cited, in accordance with accepted academic practice. No use, distribution or reproduction is permitted which does not comply with these terms.
*Correspondence: Erbao Bian, YmlhbmVyYmFvQGFobXUuZWR1LmNu; Dasheng Tian, dGlhbmRhc2hlbmdAYWhtdS5lZHUuY24=
†These authors have contributed equally to this work and share first authorship
Disclaimer: All claims expressed in this article are solely those of the authors and do not necessarily represent those of their affiliated organizations, or those of the publisher, the editors and the reviewers. Any product that may be evaluated in this article or claim that may be made by its manufacturer is not guaranteed or endorsed by the publisher.
Research integrity at Frontiers
Learn more about the work of our research integrity team to safeguard the quality of each article we publish.