 Dongbo Lyu1
 Pan Liang1*
 Chencui Huang2
 Xingzhi Chen2
 Ming Cheng3Bingbing Zhu1Mengru Liu1Songwei Yue1
 Jianbo Gao1
- 1The Departments of Radiology, the First Affiliated Hospital of Zhengzhou University, Zhengzhou, China
- 2The Department of Research Collaboration, R&D Center, Beijing Deepwise & League of PHD Technology Co., Ltd, Beijing, China
- 3The Departments of Information Department, the First Affiliated Hospital of Zhengzhou University, Zhengzhou, China
Background: The differentiation status of gastric cancer is related to clinical stage, treatment and prognosis. It is expected to establish a radiomic model based on the combination of gastric cancer and spleen to predict the differentiation degree of gastric cancer. Thus, we aim to determine whether radiomic spleen features can be used to distinguish advanced gastric cancer with varying states of differentiation.
Materials and methods: January 2019 to January 2021, we retrospectively analyzed 147 patients with advanced gastric cancer confirmed by pathology. The clinical data were reviewed and analyzed. Three radiomics predictive models were built from radiomics features based on gastric cancer (GC), spleen (SP) and combination of two organ position (GC+SP) images. Then, three Radscores (GC, SP and GC+SP) were obtained. A nomogram was developed to predict differentiation statue by incorporating GC+SP Radscore and clinical risk factors. The area under the curve (AUC) of operating characteristics (ROC) and calibration curves were assessed to evaluate the differential performance of radiomic models based on gastric cancer and spleen for advanced gastric cancer with different states of differentiation (poorly differentiated group and non- poorly differentiated group).
Results: There were 147 patients evaluated (mean age, 60 years ± 11SD, 111 men). Univariate and multivariate logistic analysis identified three clinical features (age, cTNM stage and CT attenuation of spleen arterial phase) were independent risk factors for the degree of differentiation of GC (p =0.004,0.000,0.020, respectively). The clinical radiomics (namely, GC+SP+Clin) model showed powerful prognostic ability in the training and test cohorts with AUCs of 0.97 and 0.91, respectively. The established model has the best clinical benefit in diagnosing GC differentiation.
Conclusion: By combining radiomic features (GC and spleen) with clinical risk factors, we develop a radiomic nomogram to predict differentiation status in patients with AGC, which can be used to guide treatment decisions.
Introduction
Gastric cancer (GC) occupies the fifth place among malignant tumors and the fourth place among cancer mortality rates, according to the latest global cancer burden data (Globocan 2020) (1). Furthermore, according to data from the report of Feng et al. (2), there are significant associations between differentiation status and tumor depth, lymph node metastasis, and tumor stage in GC. Other studies have confirmed that the five-year survival rates of advanced GC with different differentiation states are different, which is an independent risk factor affecting prognosis (3, 4). Thus, GC differentiation plays a crucial role in determining the surgical approach and prognosis of patients.
As a noninvasive examination method, computed tomography (CT) is commonly used to diagnose, evaluate, and treat patients with GC (5, 6). However, during the CT examination, small tumors or poor gastric dilatation may affect the diagnostic accuracy, On the other hand, unlike parenchymal organs, stomach is a hollow organ, and it is difficult to obtain accurate data for tumor delineation (7). With the development in recent years, dual-energy CT can be used as a supplement to conventional CT to improve the diagnostic efficiency, but its sensitivity (53%-85%) and specificity (85%-93%) in determining the differentiation status of GC are still insufficient, and Dual-energy CT requires a high degree of expertise of imaging technicians, which makes it difficult to popularize this scanning technology in primary hospitals (8–10). It is therefore necessary to develop an effective predictor model based on imaging data of non-tumor tissues. Among peripheral lymphoid organs, the spleen is the largest and most important immune organ outside the Tumor microenvironment (11). And spleens contain large numbers of B and T lymphocytes, which play a vital role in defending against tumors (12). Based on previous researches, GC patients who take a herb formula for rejuvenating the spleen have a better prognosis and a longer overall survival rate (13–15). Besides, some scholars found that diffuse reduction of spleen density is an independent predictor of post-operative outcomes after curative gastrectomy in patients with GC (16). Zhang’s study shows that patients with low splenic density have more advanced tumors and a poor prognosis, but they benefit more from chemotherapy (17).
Radiomics is a new method of diagnosing and predicting health conditions, which can easily identify heterogeneity within tissues and uses an automatic high-throughput feature data extraction algorithm to convert image data into data with high-resolution readability (18–20). The use of radiomics for the diagnosis and classification of GC, as well as for predicting prognosis and evaluating treatment efficacy, has been widely adopted (21–25). It has been proved that the differentiation degree of gastric cancer can be predicted based on the CT texture features of gastric cancer, and the AUC is 0.77 (26). Up to now, literature reports have been published relating to predicting the prognosis of GC patients with spleen radiomics, but these studies were only based on the spleen and not combined with the tumor lesions (7, 16). The purpose of this study was to explore the use of imaging data to explore the correlation between spleen-related characteristics and the prognosis of GC by establishing a more accurate and adaptable prognostic model. This study aimed to establish a radiomic model of GC and spleen so that the degree of differentiation of GC can be predicted more accurately, and to help clinical treatment decision.
Materials and methods
Patients
This study was approved by the institutional review board (No. 2021-KY-1070-002), and the requirement for written informed consent was waived in this retrospective study. 198 Patients with advanced GC confirmed by pathology in the first affiliated hospital of Zhengzhou university from January 2019 and January 2021 were collected retrospectively. All patients were subjected to a preoperative CT scan in 30 days. The inclusion criteria were as follows: (A) diagnosis of advanced GC based on postoperative pathology, (B) patients undergoing surgical dissection, and (C) complete clinical data. We excluded the following patients: (A) absence of spleen, (B) whose imaging data was unavailable or uncomplete, (C) with other spleen diseases, and (D) with severe infectious disease. Ultimately, 147 patients were included in this study and divided them into two groups in a 7:3 ratio: the training cohort (102 patients) and the test cohort (45 patients). The study flowchart and patient selection flowchart were shown in Figure 1.
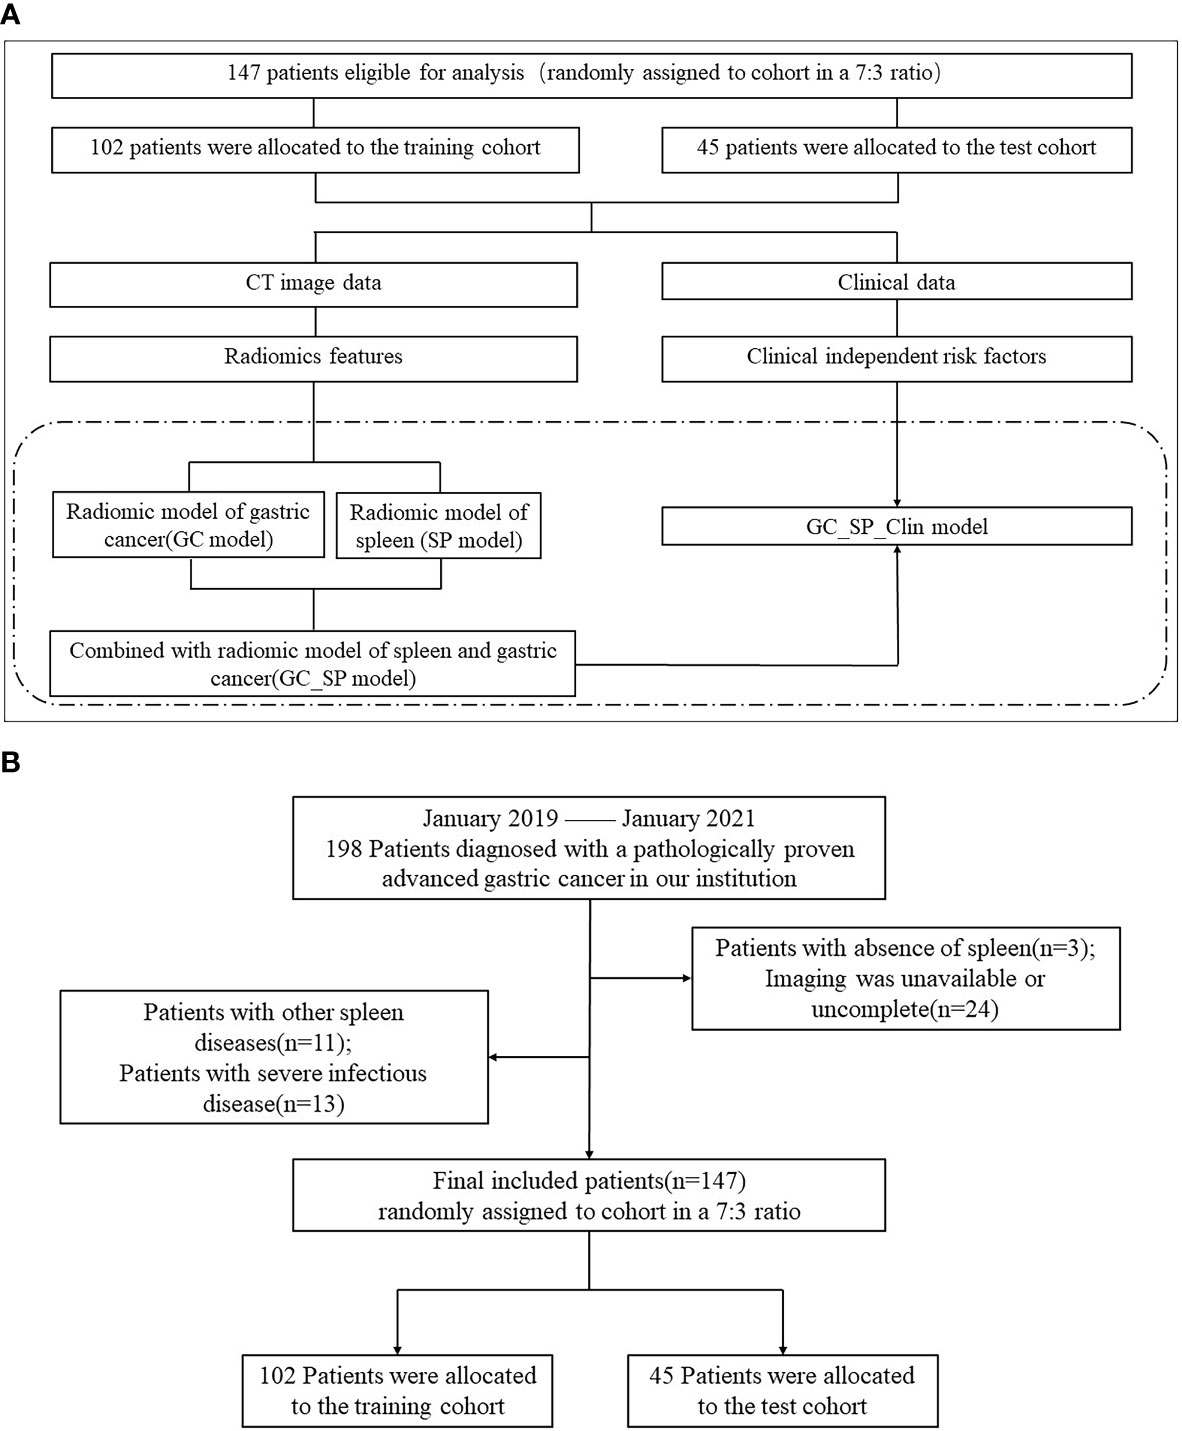
Figure 1 Flowchart of study and patient selection. (A) The study flowchart (The study mainly compared the four models in the dotted box). (B) The patient selection flowchart.
Data collection
The following data were collected in our hospital (1): clinicopathological features, including age, sex, and other chronic Diseases (eg: diabetes, hypertension, etc) (2); tumor features, including size, location, CT attenuation, Borrmann type, cT (clinical Tumor) stage, cN (clinical Node) status and cTNM (clinical Tumor node metastasis) stage (3); Biochemical indicators, including TAP(Tumor abnormal protein), CEA(a Carcinoma Embryonic Antigen), AFP(Alpha-fetoprotein) and CA19-9 (4); immune-related serological indicators, including WBC(White Blood Cell Count), PLT (Platelet Count), PLR (Platelet Lymphocyte Ratio) and NLR(Neutrophil Lymphocyte Ratio); and (5) spleen features, including thickness, and CT attenuation. Details are explained in Appendix E1.
In addition, two radiologists (with five and ten years experiences in gastroenterology imaging, respectively), who were blinded to the clinicopathological information, interpreted CT images independently and determined the state of differentiation according to the way the lesions were enhanced on CT images (26). In the event of a discrepancy in results, the decision is made by consultation between the two radiologists.
Image acquisition and segmentation
All patients underwent an abdominal enhancement CT scan within 30 days of preoperation, covering the entire spleen. The CT examinations were conducted using a 64 multidetector CT scanner (Discovery CT750HD, GE Healthcare, Wisconsin, USA). A conventional axial scan (120 kV, 350 mA, a field of view = 500 mm, matrix 512×512, and section thickness 5 mm) was performed. Details are explained in Appendix E1.
CT image segmentation was carried out with section thickness 5 mm. A radiologist with 5 years of experience in gastrointestinal radiology interpreted CT enhanced venous phase images and used ITK-SNAP version 3.6.0 software to delineate regions of interest (ROIs) and implement manual tumor segmentation. Details are explained in Appendix E1 and Figure E1, E2.
After one month, 15 patients were selected randomly and re-segmented by the radiologist to achieve high intra-rater agreement for radiomics analysis.
Extraction of radiomics features
Resanmpling was performed to avoid data heterogeneity bias. And Laplacian of Gaussian (LoG), Local Binary Pattern (LBP) 2D, LBP3D, wavelet, square, squareroot, logarithm, exponential and gradient filtering were conducted for imaging transformation. Radiomics features were calculated from ROIs of original images and transformed images respectively via the Deepwise Multimodal Research Platform (https://keyan.deepwise.com, v2.0), including first-order features, shape features and texture features including gray-level size zone matrix (GLSZM), gray-level run length matrix (GLRLM), gray level co-occurrence matrix (GLCM), gray-level diference matrix (GLDM) and neighboring gray tone difference matrix (NGTDM).
Feature reduction and radiomics signature construction
All features were scaled using Z-standardisation (X−X/SD). Intraclass correlation coefficient analysis (ICC) was conducted to slash unstable radiomics features owing to artificial segmentation. A total of 15 cases were randomly selected for SP groups and GC groups respectively to delineate ROIs again by the same radiologist. Features with high stability(ICC≥0.75) were selected for further feature selecting. Then, one of the features will be removed to alleviate the redundancy via feature correlation analysis. Finally, F test was conducted to screen features further. The remaining features was used for radiomics signature construction of GC model and SP model. In order to verify the stability of the established final combined radiomics nomogram model, in addition to the conventional test cohort, we carried on five-fold cross validation strategy based on all the data of 147. All data was divided into a training set and a test set by splitting the dataset randomly into five groups, and one group was used as a test cohort while the remaining four groups were used as a training cohort. This procedure was repeated 5 times.
CT–Based nomogram construction and evaluation
The weighted sum of radiomics features with non-zero coeffificients in SP group and GC group yielded the SP model and GC model respectively. And GC+SP model was yielded based on the selected features from features extracted from SP and GC groups.
Univariable and multivariable logistic regression was performed to select predictive clinical features. GC+SP+Clin model were developed incorporating the GC+SP model score and selected clinical features, which termed CT–Based nomogram model.
For comparison of performance of CT–Based nomogram model with the GC model, SP model and GC+SP model, AUC (95%CI), sensitivity, specificity, accuracy, F1-score and precision were calculated. ROC curve was also drawn to evaluate the classification ability of models. Decision curve was applied to analyze the clinical efficacy of different machine learning models. We also performed Delong test to calculate statistical differences of models.
Statistical analyses
Statistical analysis was conducted using SPSS software (version 21.0, IBM), with p< 0.05 indicating a statistically significant difference. In univariate analyses, the continuous variables were analyzed for normality of the distribution by use of the Kolmogorov-Smirnov test. The Mann-Whitney U test or independent t test was used to compare differences in the continuous variables. The disordered classification variables were compared by Chi-square test or Fisher exact test. The ordered classification variables were tested by Kruskal Wallis test. Multiple analyses were performed using forward stepwise regression. The intra-class correlation coefficient was used to evaluate the consistency of radiomic parameters extracted by the same tester. ICC ≥ 0.75 was defined as consistent superiority. Features selection and modeling were conducted on the Deepwise Multimodal Research Platform v2.0(Beijing Deepwise & League of PHD Technology Co., Ltd, Beijing, China, https://keyan.deepwise.com), and Delong test was conducted via medcalc (version 11.4.2.0, https://www.medcalc.org).
Results
Clinical characteristics and CT parameters
In this study, 147 patients were eventually included, including 78 patients with poorly differentiation and 69 patients with non- poorly differentiation), 102 patients in the training cohort (54 patients with poorly differentiation and 48 patients with non- poorly differentiation), and 45 patients in the test cohort (24 patients with poorly differentiation and 21 patients with non- poorly differentiation). The clinical characteristics and CT parameters of patients in the training cohort and test cohort are summarized in Table 1. In the training cohort, there were significant differences in age, cT stage, cN, cTNM stage, CT attenuation of tumor arterial phase, CT attenuation of spleen arterial phase and Splenomegaly between the poorly differentiated group and the non-poorly differentiated group (all p < 0.05). And there was no statistically significant difference between the two groups in the remaining parameters. As for the test cohort, except for age, sex and tumor thickness, there were no statistically significant differences in other clinical and CT parameters. As shown in Table 1, parameters (p < 0.20) were screened in univariate analysis and multivariate logsitic analysis was performed. The results showed that age, cTNM stage and CT attenuation of spleen arterial phase were independent risk factors for the degree of differentiation of GC after adjustment for cofactors (p =0.004,0.000,0.020, respectively, as shown in Table E1).
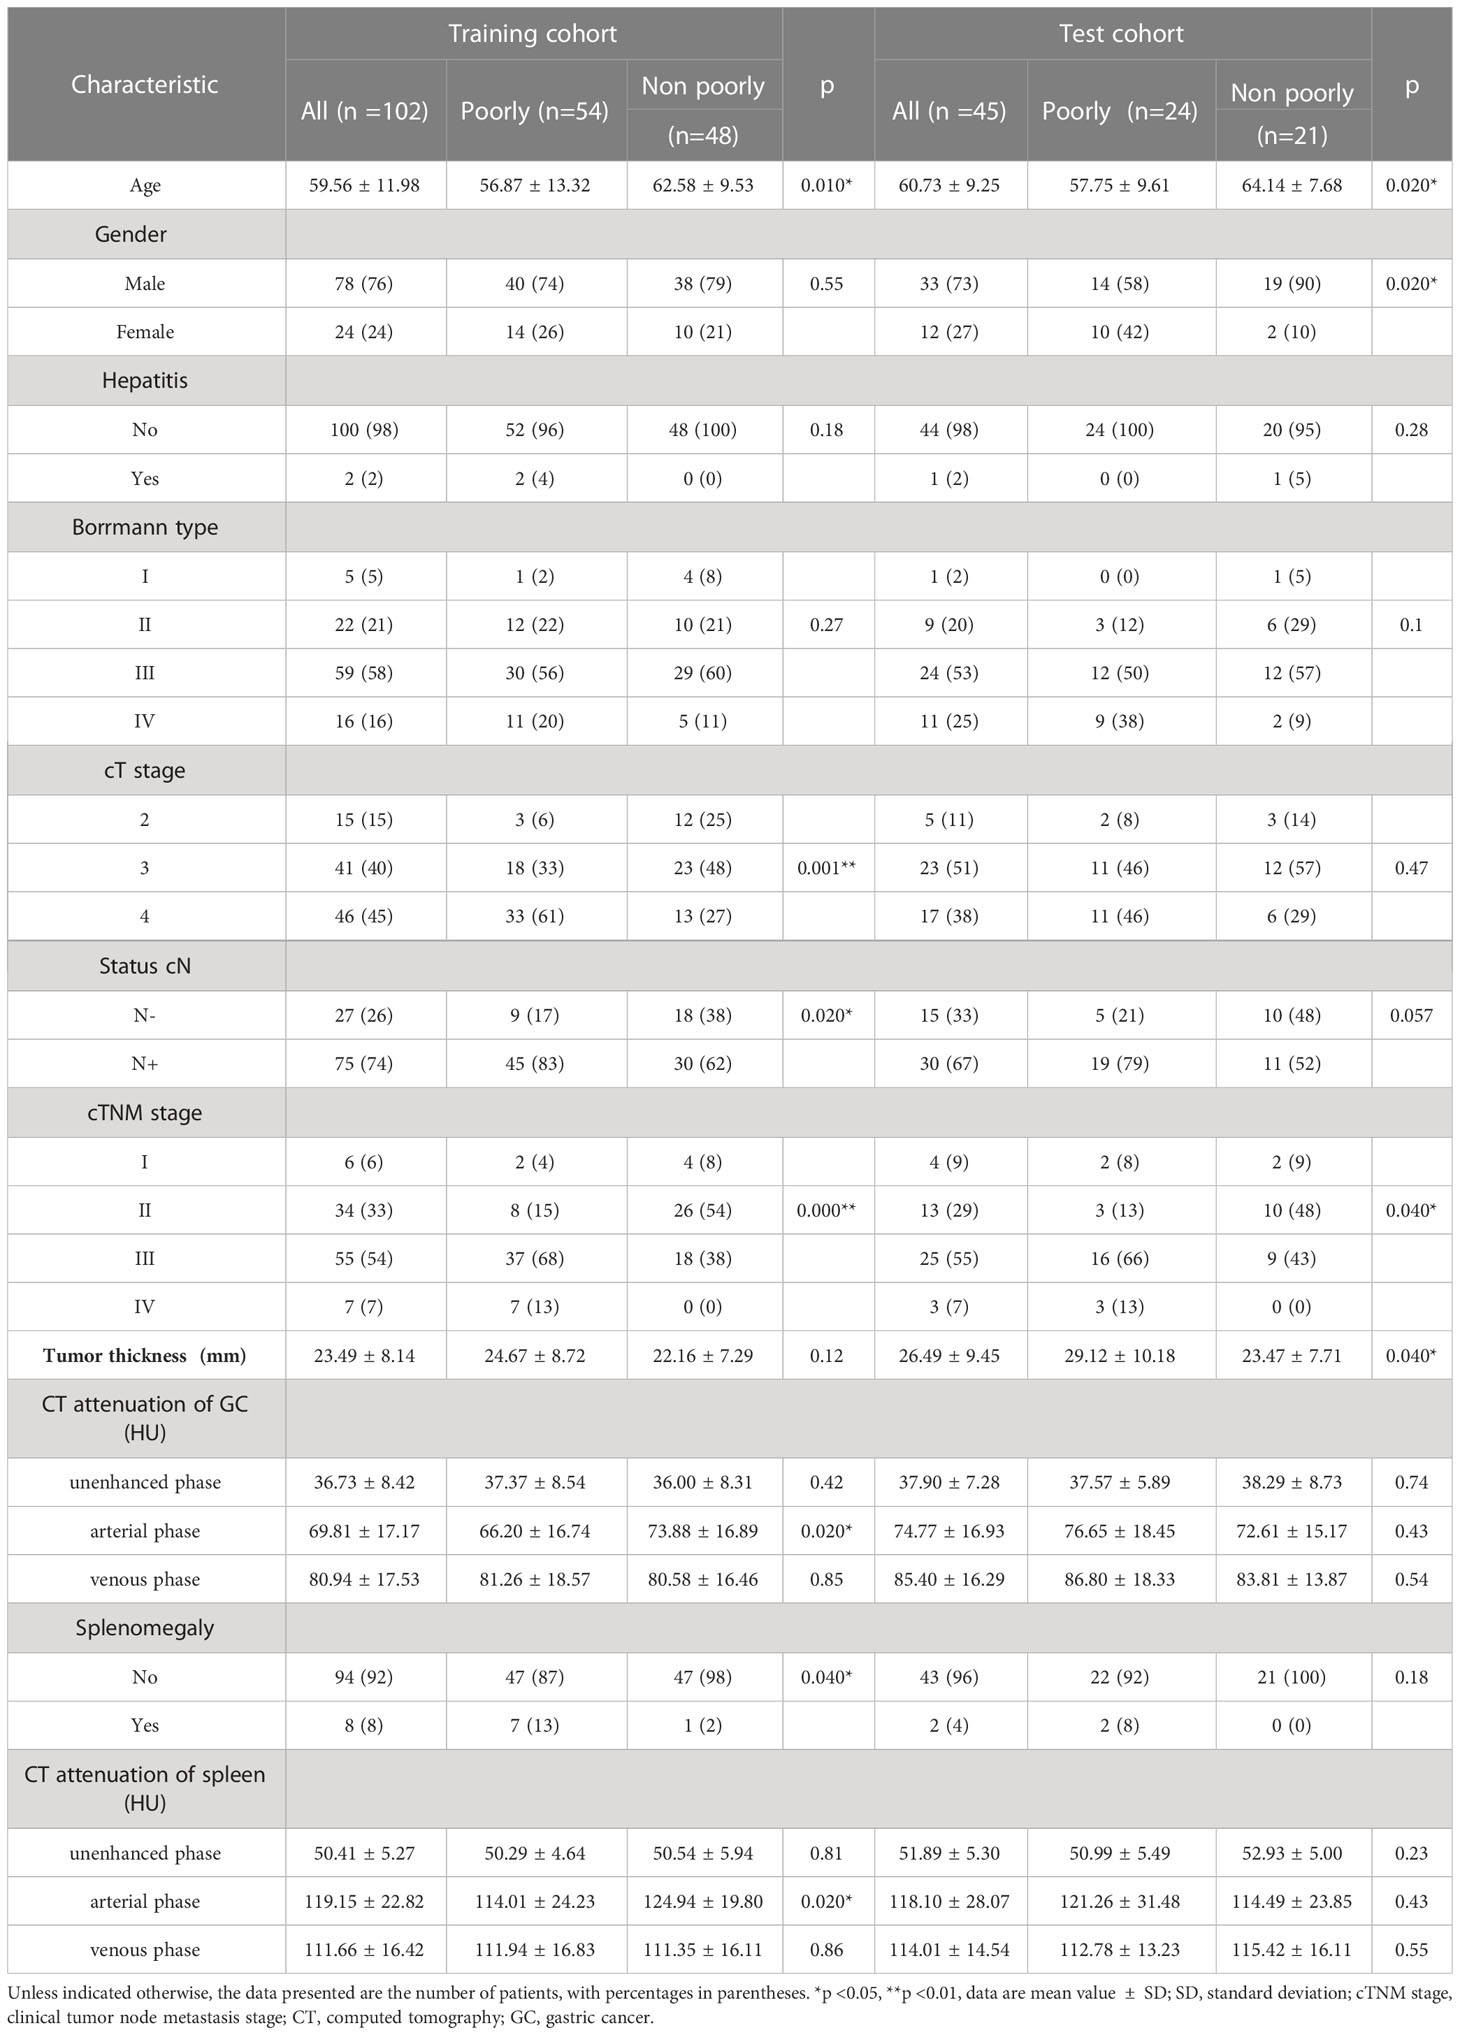
Table 1 Clinical Characteristics and CT Parameters of Patients in Training and Test Cohorts.
Feature reduction and radiomics signature construction
1743 features were extracted from ROIs of SP and GC groups respectively, 543 and 90 features were removed after ICC ananlysis (ICC ≥ 0.75) respctively. After feature correlation analysis and F test algorithm, 25 features were remained for SP group to establish SP model, including 5 first-order features, 2 shape features and 18 texture features(2 GLSZM, 5 GLRLM, 4 GLCM, 6 GLDM and 1 NGTDM)and 25 features were remained for GC group to establish GC model, including 4 first-order features, 2 shape features and texture features including 10 GLSZM, 2 GLRLM, 3 GLCM, 1 GLDM and 3 NGTDM. Ten of the most weighted features and their weights were showed in Figure 2.
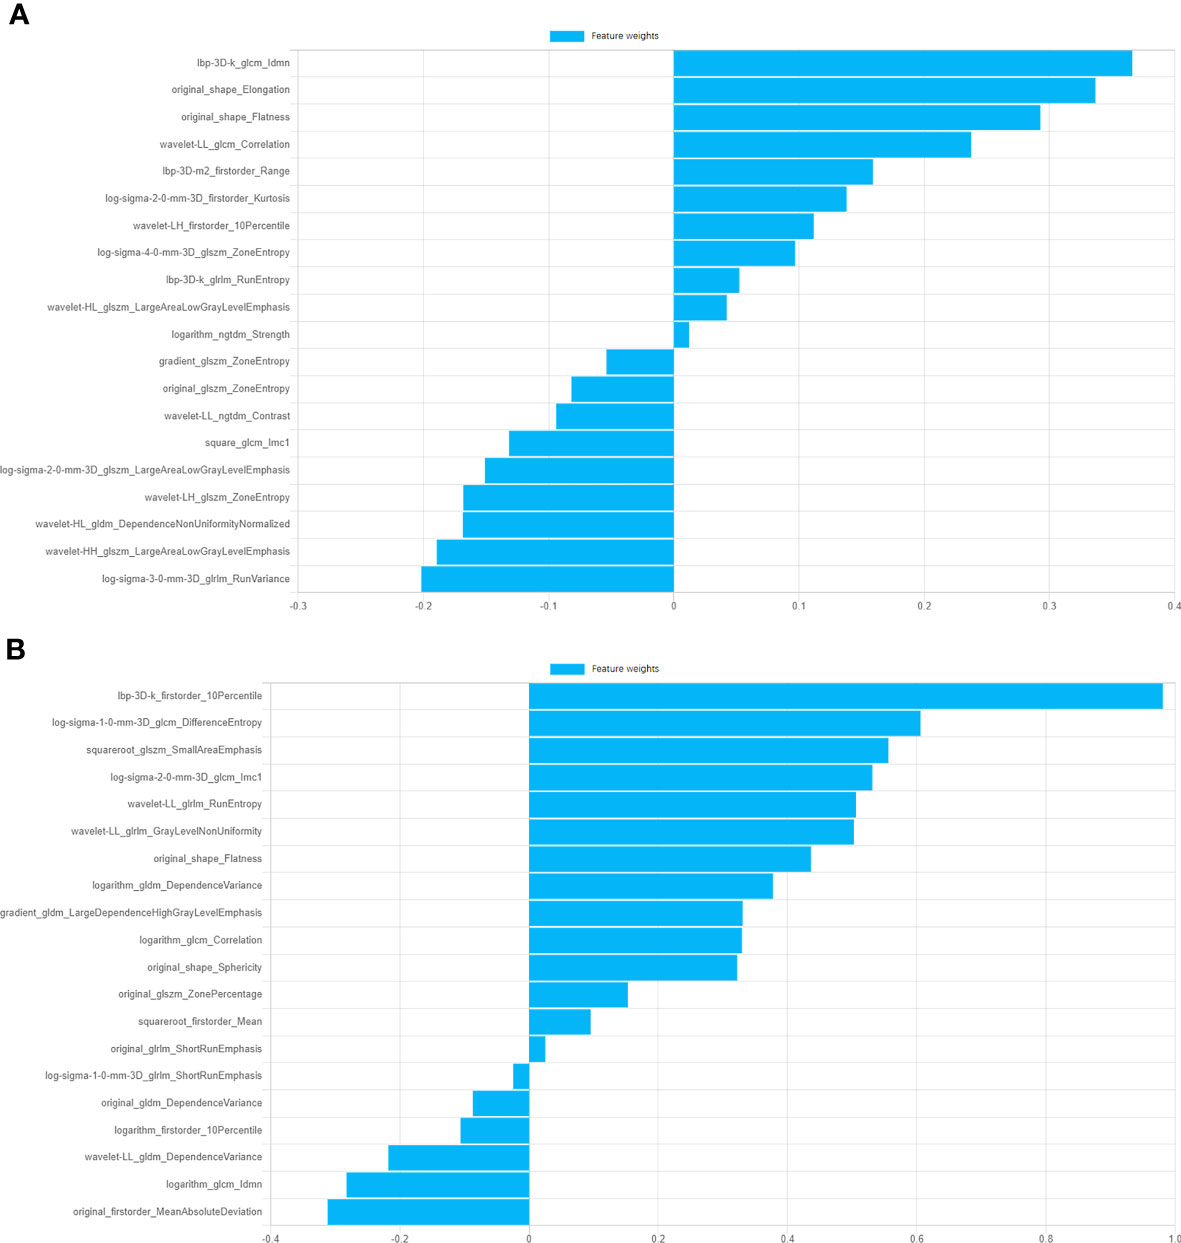
Figure 2 Information of top ten features of GC model and SP model and corresponding feature weights. (A) Features weights of GC model. (B) Features weights of SP model.
Nomogram construction and evaluation
The prediction model based on GC images, spleen images and the combination of two-stage images was developed and quantitatively integrated into three Radscores: GC Radscore, SP Radscore and GC+SP Radscore. As shown above, three clinical variables were remained as independent predictors after Univariate and multivariate logistic regressions. Furthermore, Logistic regression algorithm was used to yield CT–Based nomogram model (GC+SP+Clin model, Table 2; Figure 3). As shown in Figure 4, the developed nomogram exerted a powerful predictive ability in both training and test cohorts with AUCs of 0.97 [95% CI: 0.95, 0.99] and 0.91 [95% CI: 0.83, 0.99], respectively, which were higher than GC model (the radiomic signatures model of GC, Figure 4), SP model (the radiomic signatures model of spleen, Figure 4) and GC+SP model (incorporating GC and spleen radiomic signatures model in venous phase, Figure 4). To assess the possibility of overfitting, the Delong test was employed on the ROC curves of radiomics nomogram (GC+SP+Clin). The results indicated that the AUCs in test cohorts were not significantly different (p> 0.05). Furthermore, the Delong test was used for subgroup analysis of training set and test cohorts AUCs between different models (Table 3). The calibration curve indicated that the model demonstrated good agreement between the predicted probability and the expected probability (Figure 5).
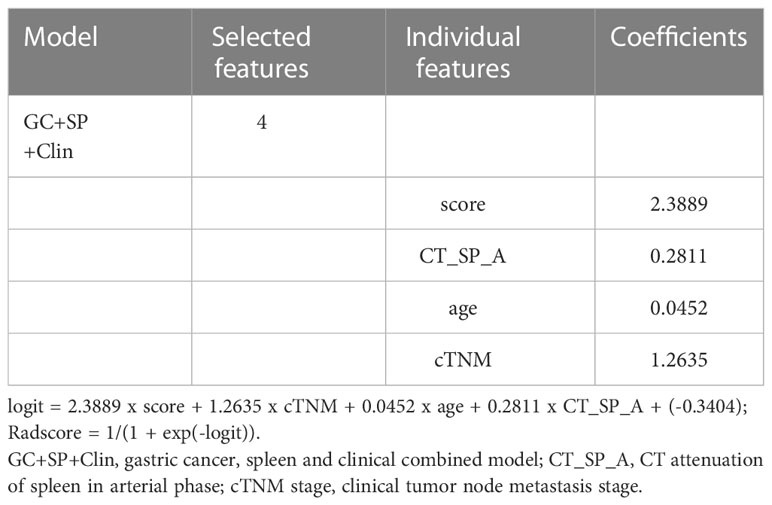
Table 2 Selected radiomics features in GC+SP+C model.
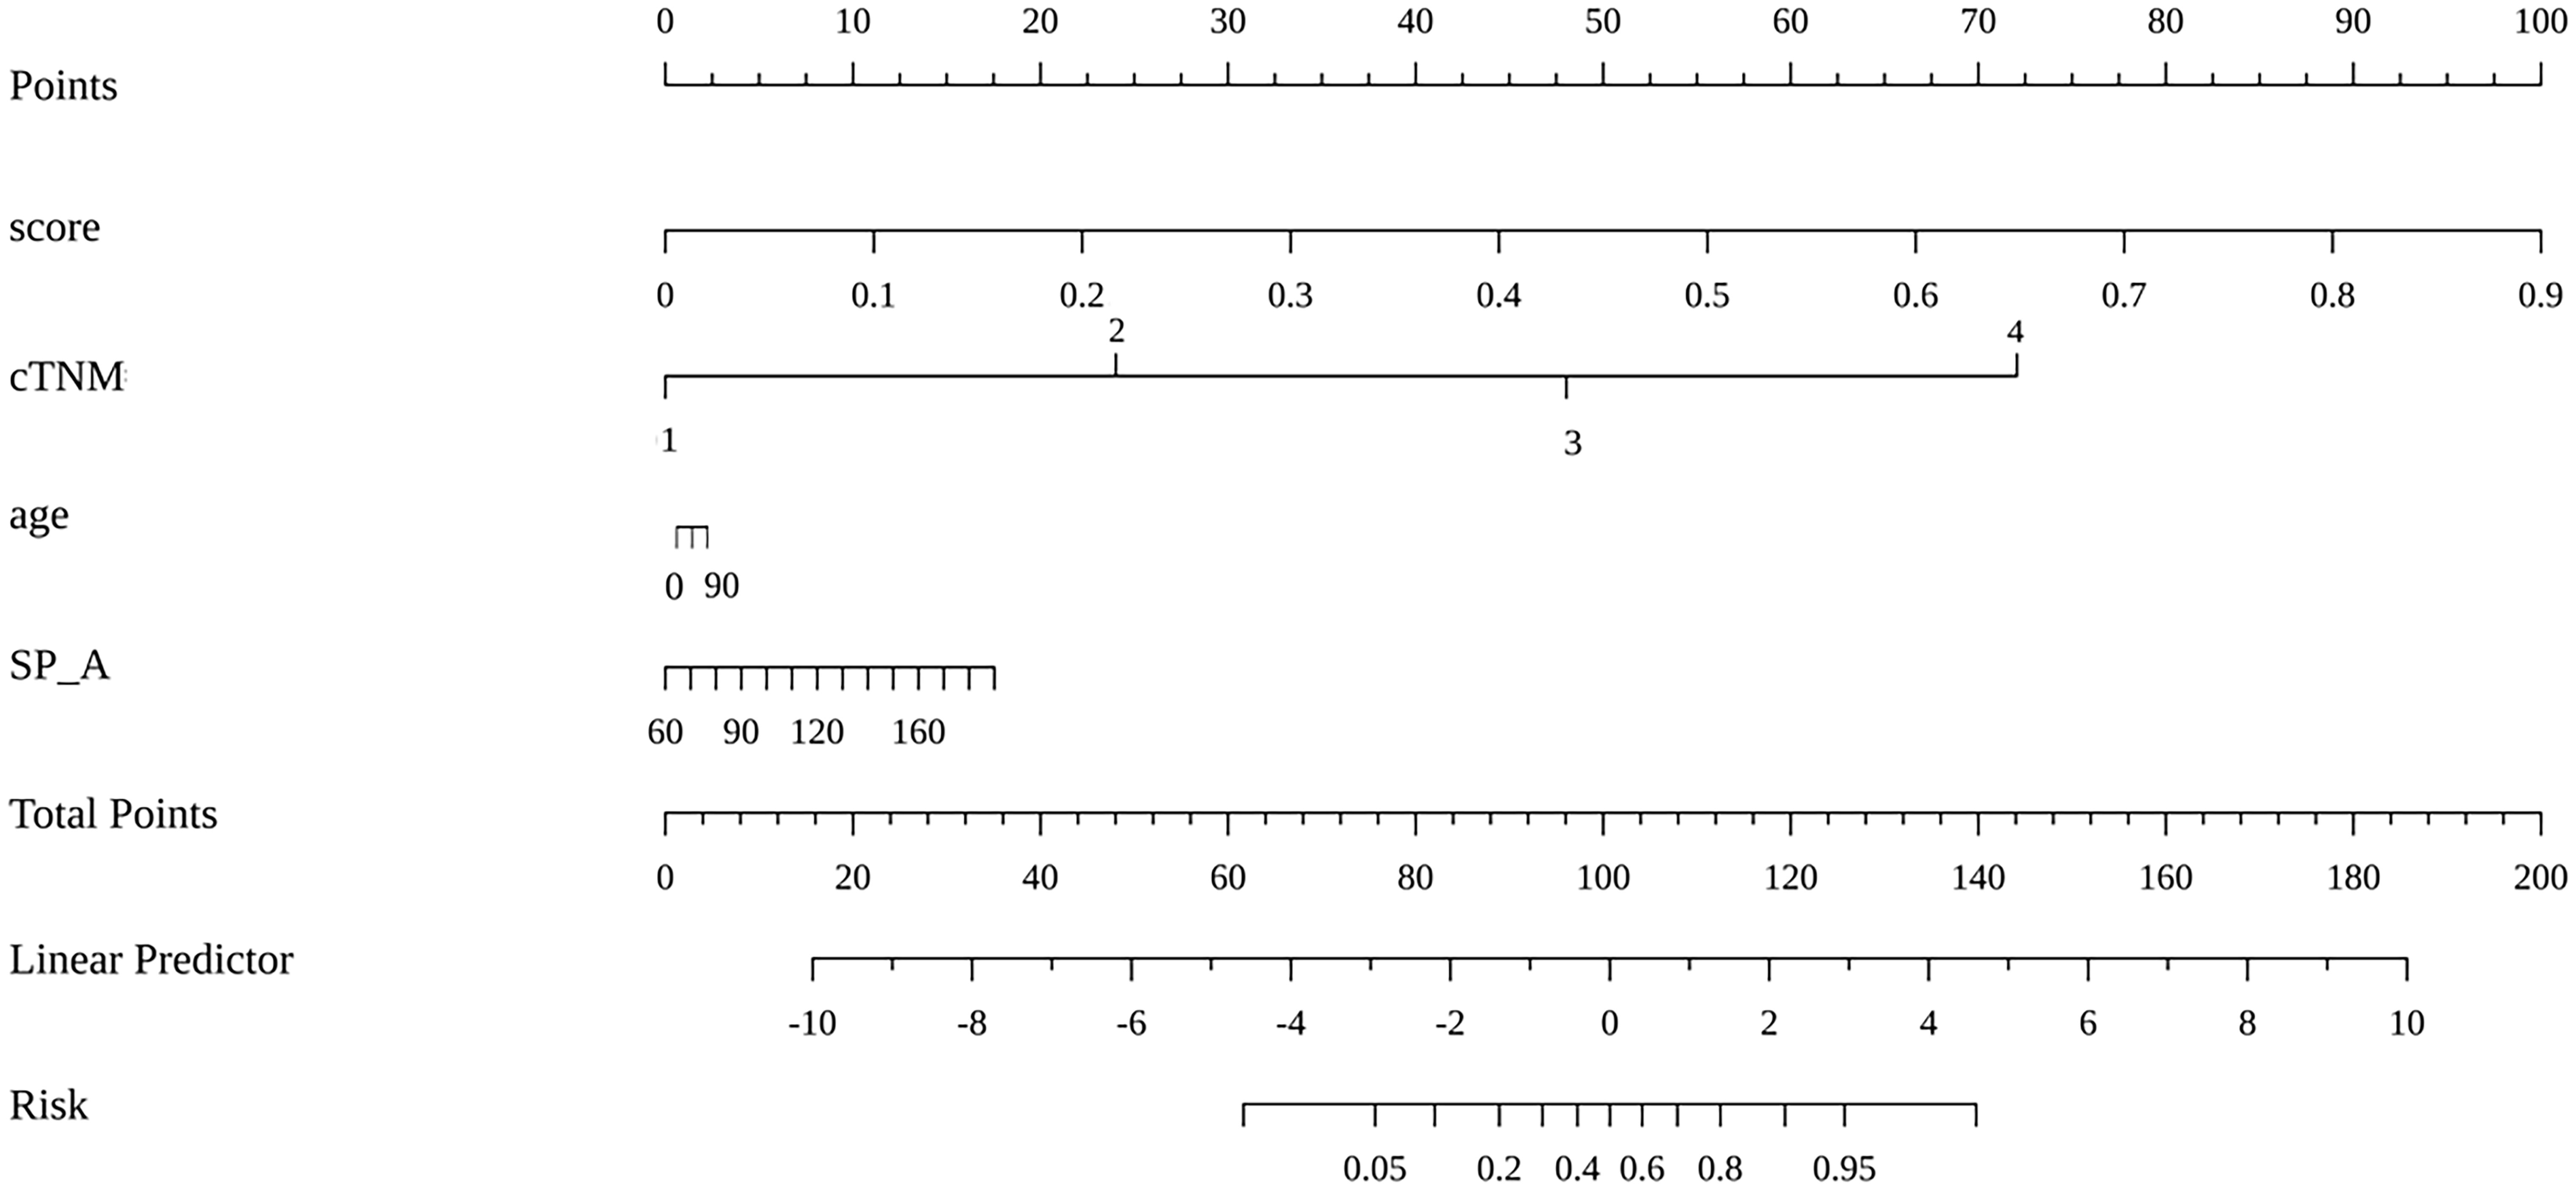
Figure 3 Radiomic nomogram based on radiomic signature and clinical factors.
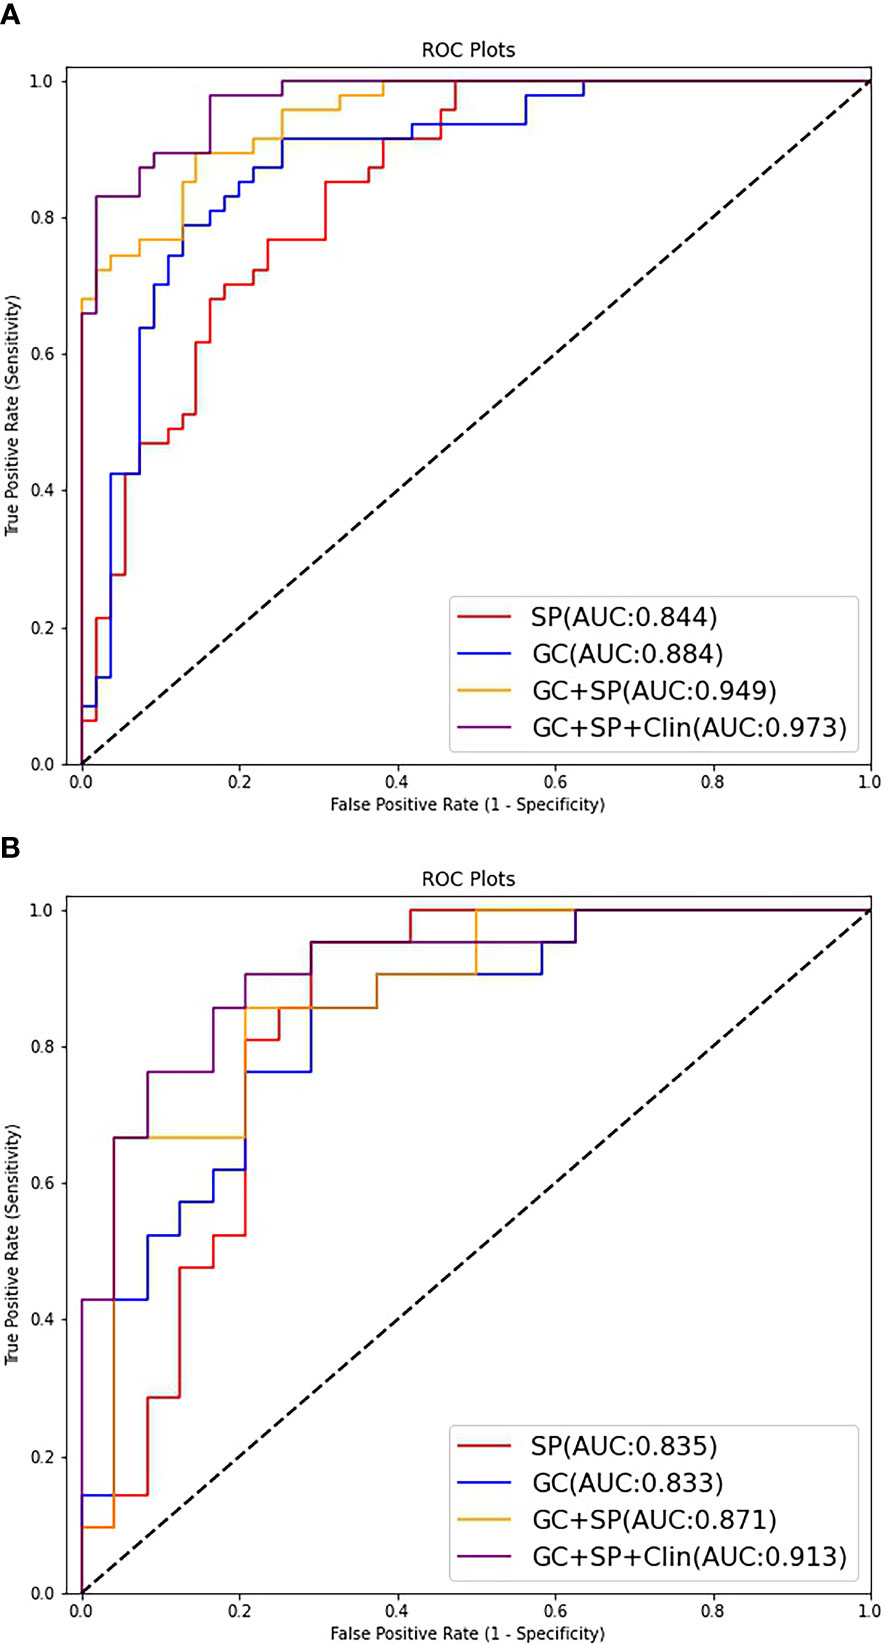
Figure 4 ROC curves of the different models for predicting differentiation state in the train cohort (A) and test cohort (B).
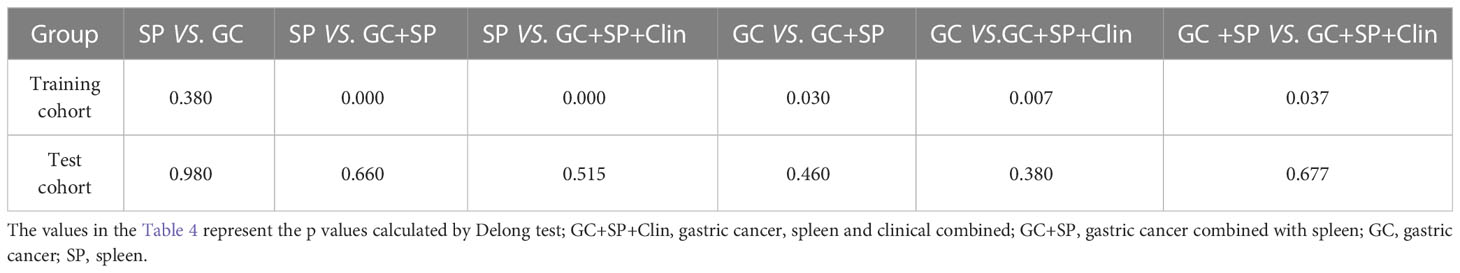
Table 3 Delong test results between models.
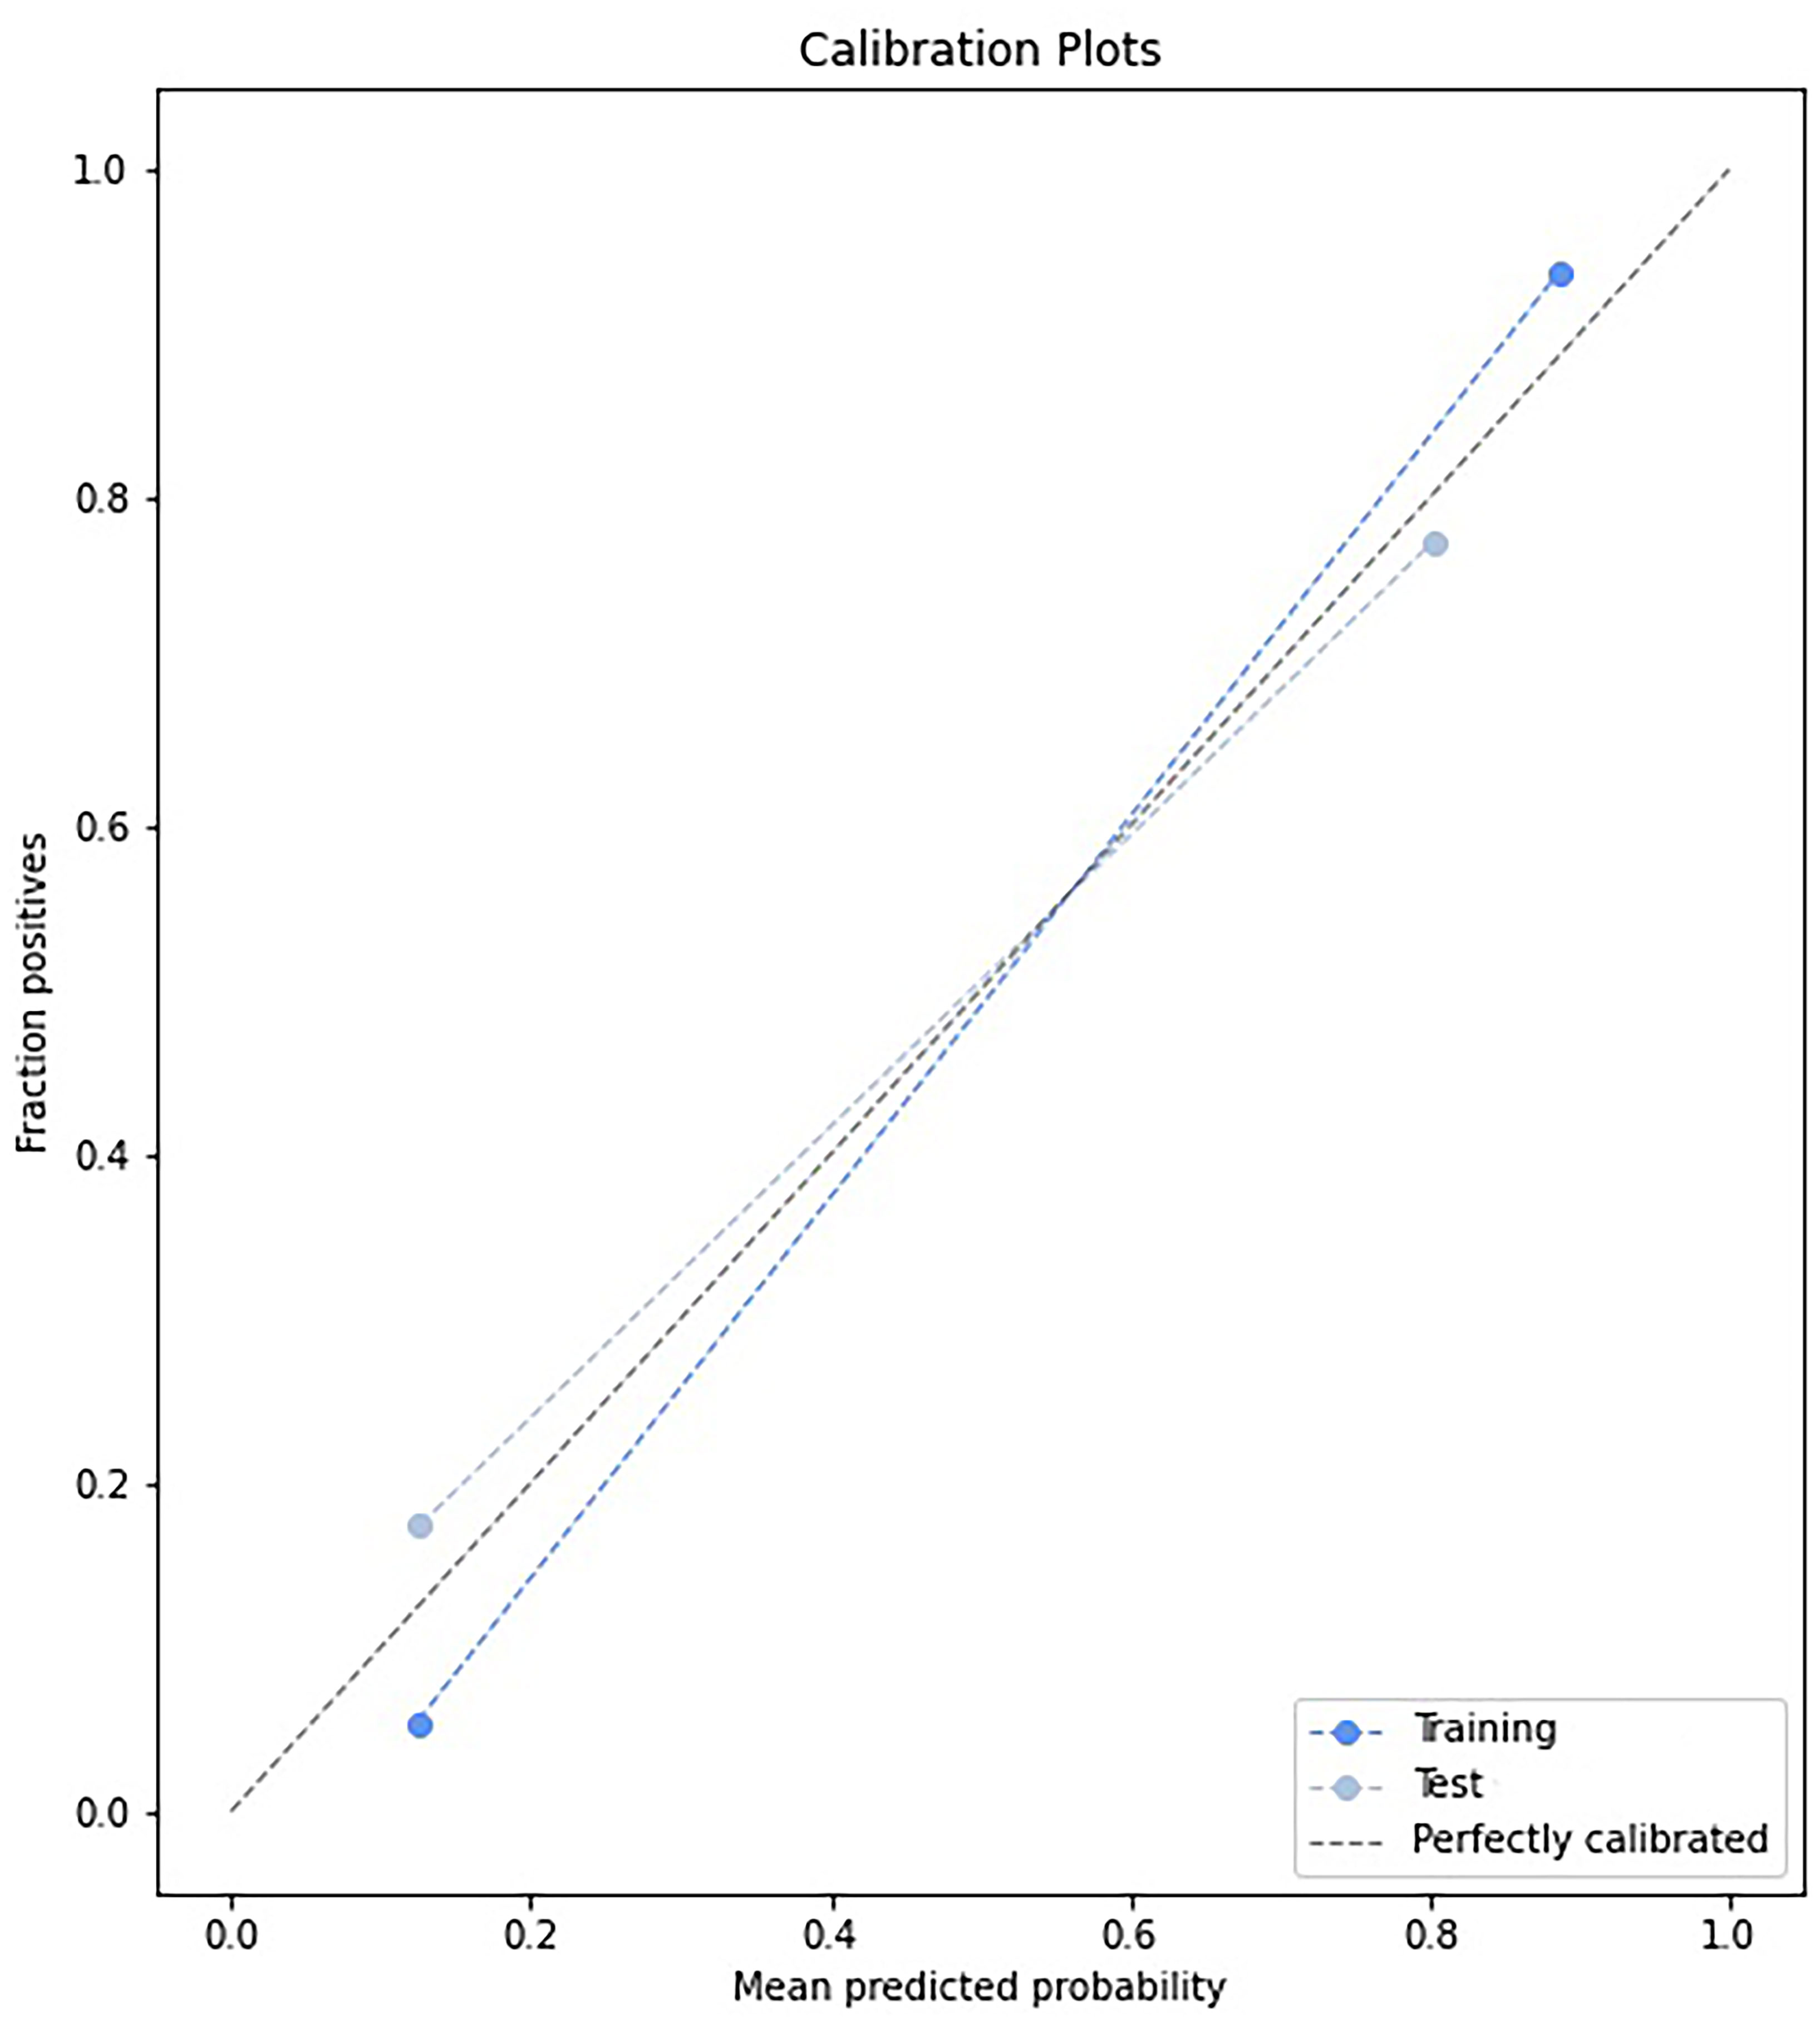
Figure 5 Calibration curve of the model (GC+SP+Clin).
Supplement material Figure E3 showed the ROC curves of the testing group on each fold. The five-fold cross-validated AUCs of this model were 0.96, 0.92, 0.91, 0.90, and 0.88, which were all very close to the AUC of our combined model (GC+SP+Clin, AUC=0.91).
The decision curve showed relatively good performances for the GC+SP+Clin model compared with that for the GC model, SP model and GC+SP model. Across the majority of the range of reasonable threshold probabilities, the decision curve analysis showed that the GC+SP+Clin model had a higher overall benefit than the other models (Figure 6). In addition, the sensitivity, specificity, accuracy, F1-score and precision of different models in the diagnosis of GC differentiation are shown in Table 4. Finally, the sensitivity and specificity of enhanced CT were 53% and 51%, respectively.
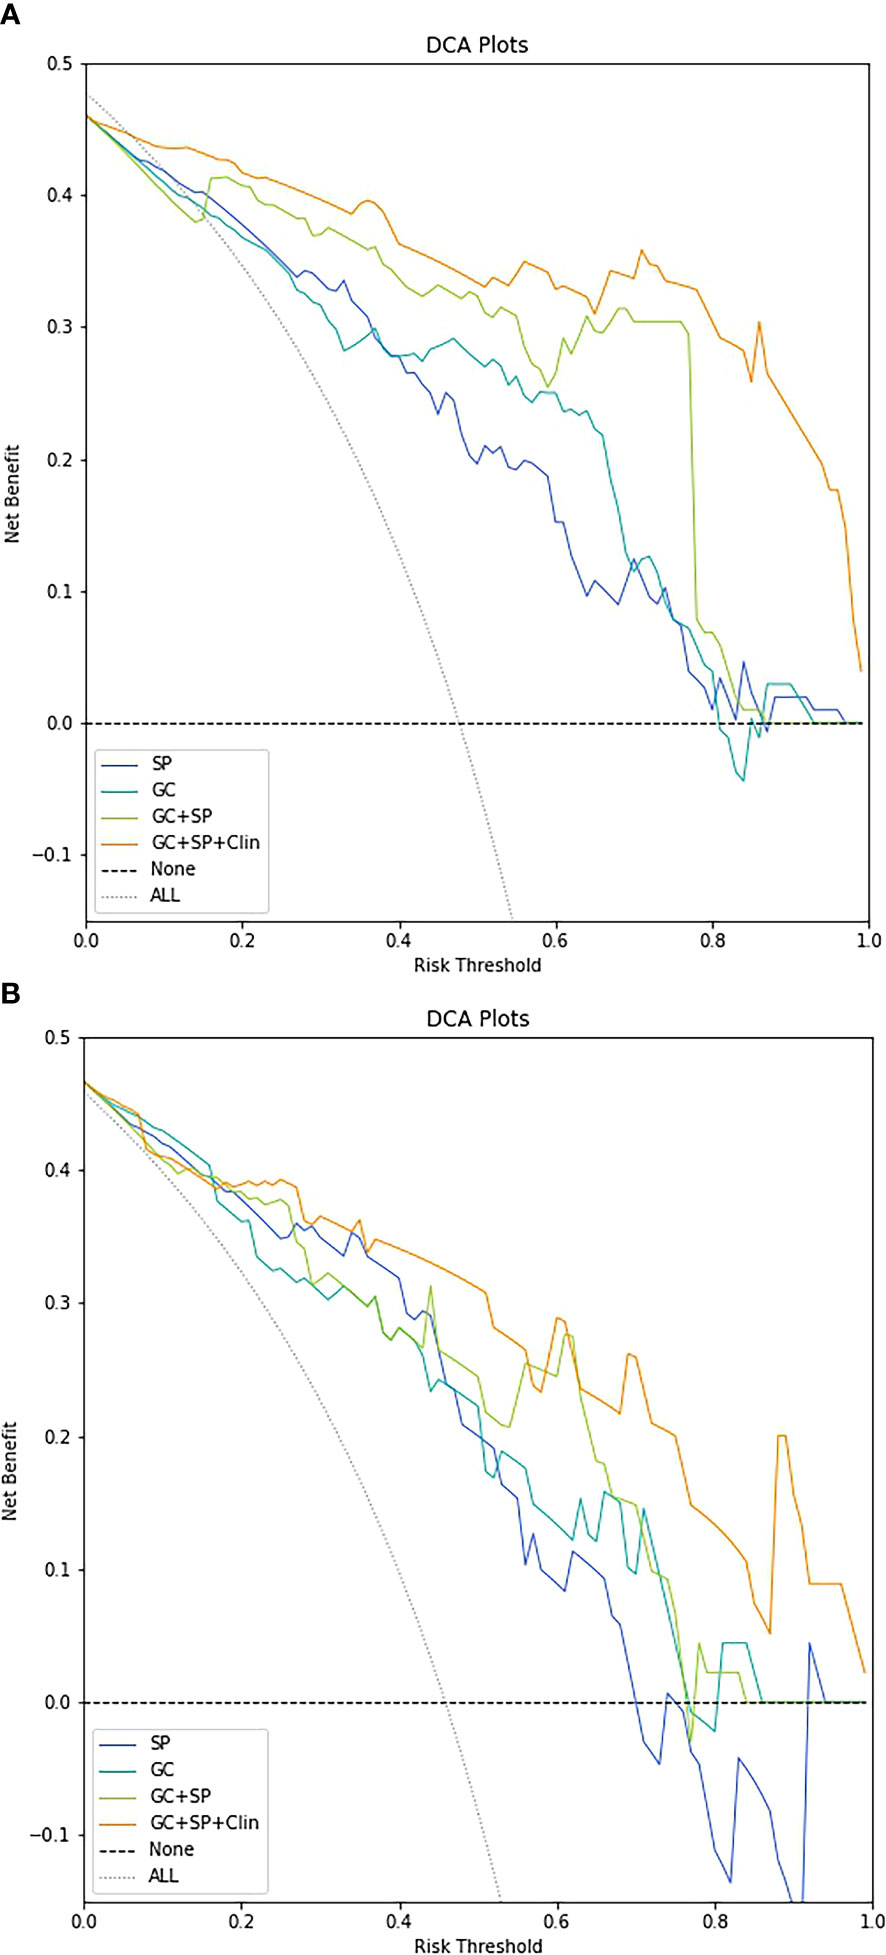
Figure 6 Decision-curve analysis for the different models in the train cohort (A) and test cohort (B).
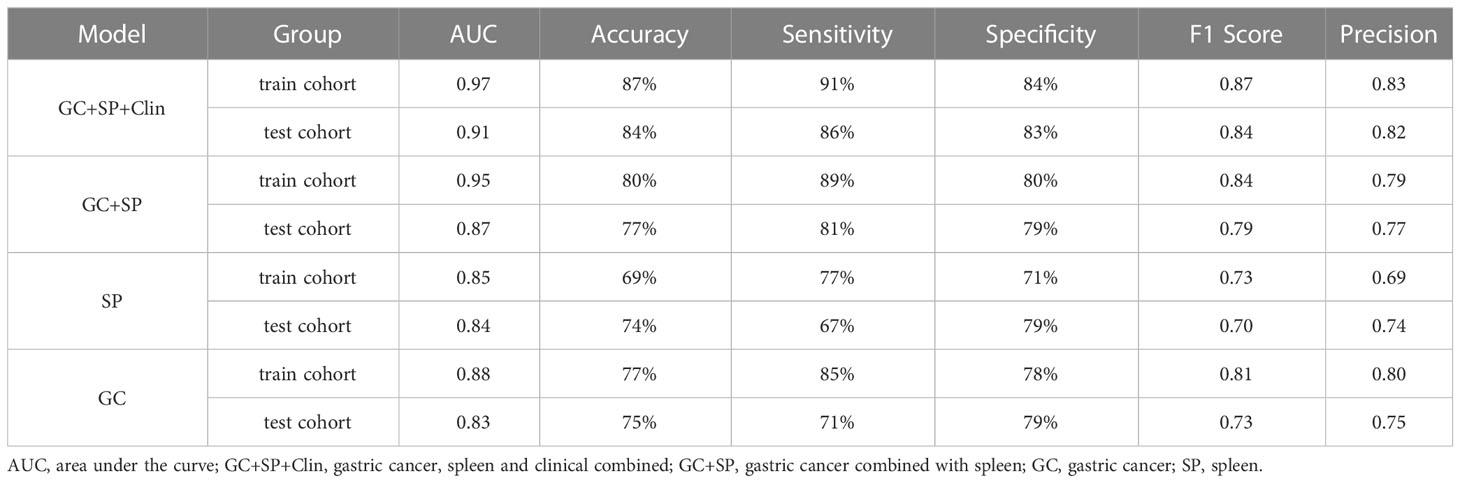
Table 4 Comparison of the effectiveness of each model in identifying differentiation state in GC.
Discussion
In this study, we investigated the value of splenic radiomic features in differentiating advanced gastric cancer with different degrees of differentiation. Preliminary analysis showed that the splenic radiomic features could distinguish the degree of AGC differentiation. On this basis, the value of tumor combined with spleen radiomic features in differentiating AGC differentiation degree was further studied. To quantify the value of spleen and tumor in differentiating poorly differentiated from non-poorly differentiated GC, we developed and tested a nomogram incorporating the radiomic features described above. Compared with general enhanced CT (sensitivity 53%, specificity 51%), the results have shown that the combined nomogram constructed by us can noninvasively stratify poorly differentiation and non-poorly differentiation GC, and it can efficiently identify patients with different degrees of differentiation, providing strong evidence for clinical treatment and personalized patient management.
In the present study, the various AGC histological types presented significant differences in their clinical and tumor features. And the five-year survival rates of patients with well differentiation, moderate differentiation and poorly differentiation were 87%, 57%, and 51%, respectively (2, 3). However, studies have shown that there are considerable histological differences between preoperative endoscopic biopsy and postoperative pathological results due to limitations such as sampling error, with 18% undifferentiated EGCs being diagnosed as differentiated type on initial biopsy histology (27). CT is a routinely used and easily accessible source of information in clinical oncology, and CT based radiomics has been widely used in the diagnosis and classification of GC, prognosis prediction and therapeutic effect evaluation (21, 24, 25). In our study, the radiomic characteristics of GC tumors were correlated with the differentiation status of GC, and the model was further established, which showed good performance in predicting the differentiation status of GC (the AUC of test cohort, 0.83). As a cavity organ, the delineation of tumor lesions is easily affected by the contents of the stomach, which will affect the extraction of radiomic features and reduce the accuracy of the model.
The spleen is closely associated with tumor development, and previous studies have shown that spleen features can predict tumor development (7, 16, 17, 28). Therefore, we studied the relationship between the radiomic characteristics of spleen and GC, and the results showed that the radiomic model established based on spleen was comparable to that of GC model, and the AUC was 0.84 [95% CI: 0.71, 0.96], with sensitivity was 67%, specificity was 79%. Consistent with the results of previous studies, spleen has important value in the diagnosis and treatment evaluation of GC (16, 17, 28). Studies have shown that dendritic cells, as powerful antigen presenting cells in the immune system, are closely related to the occurrence and development of tumors. However, dendritic cells in GC tissues were lower than those in normal tissues (11, 12). This also indicates that it is feasible to reflect the development of GC by the radiological features of spleen. In this study, we also confirmed in the training cohort that there was a statistical difference between the poorly differentiation and non-poorly differentiation groups in the splenic artery phase CT attenuation value and splenomegaly. Further univariate and multivariate analysis determined that the splenic artery phase CT attenuation value was an independent risk factor for predicting GC differentiation status (adjust OR=1.027, [95% CI: 1.00, 1.05], p=0.02).
Feng et al. showed that, compared with poorly differentiated GC, non-poorly differentiated GC tended to be elderly, male, small tumor size, shallow invasion depth, and less lymph node metastasis (2). Our results also confirm the results of Feng et al. In both the training cohort and the test cohort, there were statistical differences in age and cTNM stage between the two groups; in the training cohort (p<0.05), there were significant differences in cT and cN status between the two groups(p<0.05); In the test cohort, there were more males in the non-poorly differentiated group than in the poorly differentiated group(p<0.05). Further univariate and multivariate analysis of the clinical features of the training set showed that age (adjust OR=1.071, [95% CI: 1.02, 1.12], p=0.004) and cTNM stage (adjust OR=0.157, [95% CI: 0.06, 0.40], p=0.000) were independent risk factors for GC differentiation.
To sum up, we combined the radiomic features obtained above to establish a radiomic nomogram (GC+SP model). At the same time, the obtained clinical independent risk factors affecting the differentiation of GC were included to establish a combined nomogram (GC+SP+Clin model). And the developed nomogram exerted a powerful predictive ability in both training and test cohorts with AUCs of 0.97 [95% CI: 0.95, 0.99] and 0.91 [95% CI: 0.83, 0.99], respectively, which were higher than other models. Furthermore, the results of five-fold cross validation also show that the final established combined model has good stability. In addition, the decision curve showed that the GC+SP+Clin model had a higher overall benefit than the other models. This result is also consistent with previous studies. The constructed combined model contains more characteristic parameters, which can improve the prediction efficiency of the model (7, 22, 27).
There are several limitations in this study. First of all, as a single-center, small-sample study, we lack external validation, so we need to cooperate with other institutions to conduct a multi-center, large-sample study. Second, no further survival analysis and clinical efficacy study were conducted, because this study was only a preliminary exploration, and other relevant studies will be further carried out in the follow-up study. Finally, only the maximum and upper and lower layers were sketched for the ROI of the spleen, so the key points of spleen volume mentioned in other studies were not included (7, 17), which will be supplemented in the following studies. In addition, serological immune indicators and tumor markers included in relevant studies were not included in the final model establishment of this study (16, 28–30), which may be related to the small sample size. Therefore, further studies with more detailed sample size need to be carried out.
Conclusion
This study provides valuable insights into splenic CT image-based determinants of differentiation status in GC. In addition, we proposed and validated a Nomogram based on spleen and GC for inferring the state of differentiation in GC. We found that the Nomogram has good predictive power and can be used as an easy-to-implement, non-invasive and practical quantitative tool for predicting the state of differentiation in GC. In short, nomogram based on spleen combined with GC helps to identify GC patients with different differentiated states, so that they can benefit from treatment.
Data availability statement
The original contributions presented in the study are included in the article/Supplementary Material. Further inquiries can be directed to the corresponding author.
Ethics statement
The studies involving human participants were reviewed and approved by The Institutional Review Board of the first affiliated Hospital of Zhengzhou University (No. 2021-KY-1070-002). Written informed consent for participation was not required for this study in accordance with the national legislation and the institutional requirements. A waiver of informed consent was obtained.
Author contributions
All authors contributed to the study conception and design. Material preparation, data collection and analysis were performed by DL, PL, XC, MC, BZ, ML, and CH. The first draft of the manuscript was written by DL, PL, and XC, and all authors commented on previous versions of the manuscript. All authors contributed to the article and approved the submitted version.
Conflict of interest
Author XC is employed by the Beijing Deepwise & League of PHD Technology Company, and author CH is employed by the Beijing Deepwise & League of PHD Technology Company.
The remaining authors declare that the research was conducted in the absence of any commercial or financial relationships that could be construed as a potential conflict of interest.
Publisher’s note
All claims expressed in this article are solely those of the authors and do not necessarily represent those of their affiliated organizations, or those of the publisher, the editors and the reviewers. Any product that may be evaluated in this article, or claim that may be made by its manufacturer, is not guaranteed or endorsed by the publisher.
Supplementary material
The Supplementary Material for this article can be found online at: https://www.frontiersin.org/articles/10.3389/fonc.2023.1167602/full#supplementary-material
Abbreviations
GC, gastric cancer; SP, spleen; cTNM, clinical tumor node metastasis.
References
1. Sung H, Ferlay J, Siegel RL, Laversanne M, Soerjomataram I, Jemal A, et al. Global cancer statistics 2020: GLOBOCAN estimates of incidence and mortality worldwide for 36 cancers in 185 countries. CA Cancer J Clin (2021) 71:209–49. doi: 10.3322/caac.21660
2. Feng F, Liu J, Wang F, Zheng G, Wang Q, Liu S, et al. Prognostic value of differentiation status in gastric cancer. BMC Cancer (2018) 18:865. doi: 10.1186/s12885-018-4780-0
3. Zu H, Wang H, Li C, Xue Y. Clinicopathologic characteristics and prognostic value of various histological types in advanced gastric cancer. Int J Clin Exp Pathol (2014) 7:5692–700.
4. Adachi Y, Yasuda K, Inomata M, Sato K, Shiraishi N, Kitano S. Pathology and prognosis of gastric carcinoma: well versus poorly differentiated type. Cancer (2000) 89:1418–24. doi: 10.1002/1097-0142(20001001)89:73.3.CO;2-1
5. Park SR, Kim MJ, Ryu KW, Lee JH, Lee JS, Nam BH, et al. Prognostic value of preoperative clinical staging assessed by computed tomography in resectable gastric cancer patients: a viewpoint in the era of preoperative treatment. Ann Surg (2010) 251:428–35. doi: 10.1097/SLA.0b013e3181ca69a7
6. Tsurumaru D, Miyasaka M, Nishimuta Y, Asayama Y, Nishie A, Kawanami S, et al. Differentiation of early gastric cancer with ulceration and resectable advanced gastric cancer using multiphasic dynamic multidetector CT. Eur Radiol (2016) 26:1330–7. doi: 10.1007/s00330-015-3938-2
7. Wang X, Sun J, Zhang W, Yang X, Zhu C, Pan B, et al. Use of radiomics to extract splenic features to predict prognosis of patients with gastric cancer. Eur J Surg Oncol (2020) 46:1932–40. doi: 10.1016/j.ejso.2020.06.021
8. Liang P, Ren XC, Gao JB, Chen KS, Xu X. Iodine concentration in spectral CT: assessment of prognostic determinants in patients with gastric adenocarcinoma. AJR Am J Roentgenol (2017) 209:1033–8. doi: 10.2214/AJR.16.16895
9. Li R, Li J, Wang X, Liang P, Gao J. Detection of gastric cancer and its histological type based on iodine concentration in spectral CT. Cancer Imaging (2018) 18:42. doi: 10.1186/s40644-018-0176-2
10. Chen XH, Ren K, Liang P, Chai YR, Chen KS, Gao JB. Spectral computed tomography in advanced gastric cancer: can iodine concentration non-invasively assess angiogenesis? World J Gastroenterol (2017) 23:1666–75. doi: 10.3748/wjg.v23.i9.1666
11. Lewis SM, Williams A, Eisenbarth SC. Structure and function of the immune system in the spleen. Sci Immunol (2019) 4:eaau6085. doi: 10.1126/sciimmunol.aau6085
12. Toge T, Kuroi K, Kuninobu H, Yamaguchi Y, Kegoya Y, Baba N, et al. Role of the spleen in immunosuppression of gastric cancer: predominance of suppressor precursor and suppressor inducer T cells in the recirculating spleen cells. Clin Exp Immunol (1988) 74:409–12.
13. Zhou X, Yan DM, Zhu WF, Liu WJ, Nie HY, Xu S, et al. Efficacy and safety of hou gu mi xi in patients with spleen qi deficiency syndrome who underwent radical gastrectomy for gastric cancer: protocol for a multicenter, randomized, double-blind, placebo-controlled trial. Trials (2019) 20:343. doi: 10.1186/s13063-019-3429-x
14. Zhao L, Zhao AG, Zhao G, Xu Y, Zhu XH, Cao ND, et al. Survival benefit of traditional chinese herbal medicine (a herbal formula for invigorating spleen) in gastric cancer patients with peritoneal metastasis. Evid Based Complement Alternat Med (2014) 2014:625493. doi: 10.1155/2014/625493
15. Xu Y, Zhao AG, Li ZY, Zhao G, Cai Y, Zhu XH, et al. Survival benefit of traditional Chinese herbal medicine (a herbal formula for invigorating spleen) for patients with advanced gastric cancer. Integr Cancer Ther (2013) 12:414–22. doi: 10.1177/1534735412450512
16. Pan B, Zhang W, Chen W, Zheng J, Yang X, Sun J, et al. Establishment of the radiologic tumor invasion index based on radiomics splenic features and clinical factors to predict serous invasion of gastric cancer. Front Oncol (2021) 11:682456. doi: 10.3389/fonc.2021.682456
17. Zhang WT, Zhu C, Wang X, Wang SJ, Chen XD, Chen XL, et al. Preoperative splenic density for the prediction of survival and adjuvant chemotherapy benefits in gastric cancer. J Cancer (2020) 11:6133–9. doi: 10.7150/jca.47559
18. Lambin P, Leijenaar RTH, Deist TM, Peerlings J, de Jong EEC, van Timmeren J, et al. Radiomics: the bridge between medical imaging and personalized medicine. Nat Rev Clin Oncol (2017) 14:749–62. doi: 10.1038/nrclinonc.2017.141
19. Van Griethuysen JJM, Fedorov A, Parmar C, Hosny A, Aucoin N, Narayan V, et al. Computational radiomics system to decode the radiographic phenotype. Cancer Res (2017) 77:e104–7. doi: 10.1158/0008-5472.CAN-17-0339
20. Sun RJ, Fang MJ, Tang L, Li XT, Lu QY, Dong D, et al. CT-based deep learning radiomics analysis for evaluation of serosa invasion in advanced gastric cancer. Eur J Radiol (2020) 132:109277. doi: 10.1016/j.ejrad.2020.109277
21. Dong D, Tang L, Li ZY, Fang MJ, Gao JB, Shan XH, et al. Development and validation of an individualized nomogram to identify occult peritoneal metastasis in patients with advanced gastric cancer. Ann Oncol (2019) 30:431–8. doi: 10.1093/annonc/mdz001
22. Li Z, Zhang D, Dai Y, Dong J, Wu L, Li Y, et al. Computed tomography-based radiomics for prediction of neoadjuvant chemotherapy outcomes in locally advanced gastric cancer: a pilot study. Chin J Cancer Res (2018) 30:406–14. doi: 10.21147/j.issn.1000-9604.2018.04.03
23. Giganti F, Marra P, Ambrosi A, Salerno A, Antunes S, Chiari D, et al. Pre-treatment MDCT-based texture analysis for therapy response prediction in gastric cancer: comparison with tumour regression grade at final histology. Eur J Radiol (2017) 90:129–37. doi: 10.1016/j.ejrad.2017.02.043
24. Xu Q, Sun Z, Li X, Ye C, Zhou C, Zhang L, et al. Advanced gastric cancer: CT radiomics prediction and early detection of downstaging with neoadjuvant chemotherapy. Eur Radiol (2021) 31:8765–74. doi: 10.1007/s00330-021-07962-2
25. Wang W, Peng Y, Feng X, Zhao Y, Seeruttun SR, Zhang J, et al. Development and validation of a computed tomography-based radiomics signature to predict response to neoadjuvant chemotherapy for locally advanced gastric cancer. JAMA Netw Open (2021) 4:e2121143. doi: 10.1001/jamanetworkopen.2021.21143
26. Liu S, Liu S, Ji C, Zheng H, Pan X, Zhang Y, et al. Application of CT texture analysis in predicting histopathological characteristics of gastric cancers. Eur Radiol (2017) 27:4951–9. doi: 10.1007/s00330-017-4881-1
27. Lee JH, Kim JH, Rhee K, Huh CW, Lee YC, Yoon SO, et al. Undifferentiated early gastric cancer diagnosed as differentiated histology based on forceps biopsy. Pathol Res Pract (2013) 209:314–8. doi: 10.1016/j.prp.2013.02.014
28. Huang YS, Chen XD, Shi MM, Xu LB, Wang SJ, Chen WS, et al. Diffuse reduction of spleen density is an independent predictor of post-operative outcomes after curative gastrectomy in gastric cancer: a multi-center study. Front Oncol (2020) 10:1050. doi: 10.3389/fonc.2020.01050
29. Chen X, Yang Z, Yang J, Liao Y, Pang P, Fan W, et al. Radiomics analysis of contrast-enhanced CT predicts lymphovascular invasion and disease outcome in gastric cancer: a preliminary study. Cancer Imaging (2020) 20:24. doi: 10.1186/s40644-020-00302-5
Keywords: spleen, differentiation, radiomics, tomography, x-ray computed, gastric cancer
Citation: Lyu D, Liang P, Huang C, Chen X, Cheng M, Zhu B, Liu M, Yue S and Gao J (2023) Are radiomic spleen features useful for assessing the differentiation status of advanced gastric cancer? Front. Oncol. 13:1167602. doi: 10.3389/fonc.2023.1167602
Received: 16 February 2023; Accepted: 21 April 2023;
Published: 05 May 2023.
Edited by:
Hong Huang, Chongqing University, ChinaReviewed by:
Bing Fan, Jiangxi Provincial People’s Hospital, ChinaRuoyu Wu, Chongqing University, China
Copyright © 2023 Lyu, Liang, Huang, Chen, Cheng, Zhu, Liu, Yue and Gao. This is an open-access article distributed under the terms of the Creative Commons Attribution License (CC BY). The use, distribution or reproduction in other forums is permitted, provided the original author(s) and the copyright owner(s) are credited and that the original publication in this journal is cited, in accordance with accepted academic practice. No use, distribution or reproduction is permitted which does not comply with these terms.
*Correspondence: Pan Liang, bGlhbmdwYW4uMUAxNjMuY29t; YmVzdGxpYW5ncGFuQDE2My5jb20=