
95% of researchers rate our articles as excellent or good
Learn more about the work of our research integrity team to safeguard the quality of each article we publish.
Find out more
ORIGINAL RESEARCH article
Front. Oncol. , 23 August 2023
Sec. Radiation Oncology
Volume 13 - 2023 | https://doi.org/10.3389/fonc.2023.1167328
 Zhiyong Zhou1†
 Xusheng Qian1,2†
 Jisu Hu1,2Chen Geng1
 Yongsheng Zhang3Xin Dou4
 Tuanjie Che5,6
 Jianbing Zhu6*
 Yakang Dai1*
Objective: This study aimed to evaluate the effectiveness of multi-phase-combined contrast-enhanced CT (CECT) radiomics methods for noninvasive Fuhrman grade prediction of clear cell renal cell carcinoma (ccRCC).
Methods: A total of 187 patients with four-phase CECT images were retrospectively enrolled and then were categorized into training cohort (n=126) and testing cohort (n=61). All patients were confirmed as ccRCC by histopathological reports. A total of 110 3D classical radiomics features were extracted from each phase of CECT for individual ccRCC lesion, and contrast-enhanced variation features were also calculated as derived radiomics features. These features were concatenated together, and redundant features were removed by Pearson correlation analysis. The discriminative features were selected by minimum redundancy maximum relevance method (mRMR) and then input into a C-support vector classifier to build multi-phase-combined CECT radiomics models. The prediction performance was evaluated by the area under the curve (AUC) of receiver operating characteristic (ROC).
Results: The multi-phase-combined CECT radiomics model showed the best prediction performance (AUC=0.777) than the single-phase CECT radiomics model (AUC=0.711) in the testing cohort (p value=0.039).
Conclusion: The multi-phase-combined CECT radiomics model is a potential effective way to noninvasively predict Fuhrman grade of ccRCC. The concatenation of first-order features and texture features extracted from corticomedullary phase and nephrographic phase are discriminative feature representations.
Renal cell carcinoma (RCC) is the seventh most common malignant tumors in humans, and its incidence is increasing 2% annually around the world (1). RCC is generally categorized into clear cell renal cell carcinoma (ccRCC) and non-clear cell renal cell carcinoma (non-ccRCC) (2). ccRCC is the most common histological subtype of RCC, accounting for more than 70% of all RCC cases (3). Compared with non-ccRCC, ccRCC receives more attentions in clinical practice due to its higher metastatic potential and worse prognosis (4).
The Fuhrman nuclear grade is a widely used grading system in the pathological nuclear grading of ccRCC (5), which is established as an independent histological prognostic factor and is significant for the clinical management of ccRCC (6). Fuhrman nuclear grade stratifies ccRCC tumors into four grades based on nuclear morphology (7). A preoperative percutaneous biopsy of renal masses is a widely used method and considered as a gold standard for histology diagnosis and treatment plan. However, it cannot roundly reflect the Fuhrman grades of the entire tumor and may be discordant with surgical histopathology (accuracy=46–64%) (8, 9) due to the high spatial heterogeneity and inherent genetic heterogeneity of ccRCC (10). Since more than 70% of renal masses are discovered incidentally on routine clinical imaging, preoperative noninvasive assessment of Fuhrman grade by using multi-phase contrast-enhanced CT (multi-phase CECT) has received widespread attentions (7).
In recent years, artificial intelligence methods using radiomics analysis have gradually attracted increased attention due to its excellent performance on cancer classification and survival prediction in radiation oncology. Radiomics methods translate medical imaging data into high-dimension features, which represent microscale information of tumors, e.g., tumor microenvironment, micro-vessel density, and irregularity of nuclear shape and arrangement. Theoretically, radiomics analysis is a machine learning architecture, which provides interpretable image features as noninvasive radiology biomarkers for auxiliary diagnose or prognosis (11–14). Some studies have shown that radiomics methods could provide valuable information for predicting benign and malignant tumors, tumor subtypes, and tumor grade for RCC (15–17). However, these previous studies are confined by the limitations that radiomics features were extracted from single-phase CECT images (usually extracted from nephrographic phase of CECT) (18, 19), which may lead to the loss of some tumor biological information (20), e.g., wash-in-and-wash-out.
The primary purpose of this study was to investigate the effectiveness and ability of multi-phase-combined CECT radiomics models with incorporated 3D classical radiomics and contrast-enhanced variation features to noninvasively distinguish low and high grades in simplified Fuhrman grading system of ccRCC.
The study was approved by our local institutional review board. We collected CT images, histopathology reports, and clinical data of patients who had undergone surgical resections of ccRCC between January 2009 and January 2019.
A patient was included in this study if he/she underwent a preoperative CECT with a four-phase renal mass CT imaging protocol (unenhanced phase, corticomedullary phase, nephrographic phase, and delay phase) and had a histopathology report proven as ccRCC with a diagnosis of Fuhrman grades. The exclusion criteria were as follows: 1) lack of Fuhrman grades in histopathology reports (n=36); 2) lack of CT images (n=4); 3) incomplete contrast-enhanced phases (n=17); 4) incomplete lesion in CT images (n=2); and 5) suboptimal CT imaging quality (n=1).
A total of 187 samples were finally enrolled in our retrospective study. All samples were categorized into low- and high grade according to the simplified Fuhrman grade system. Figure 1 portrays the patient recruitment flowchart.
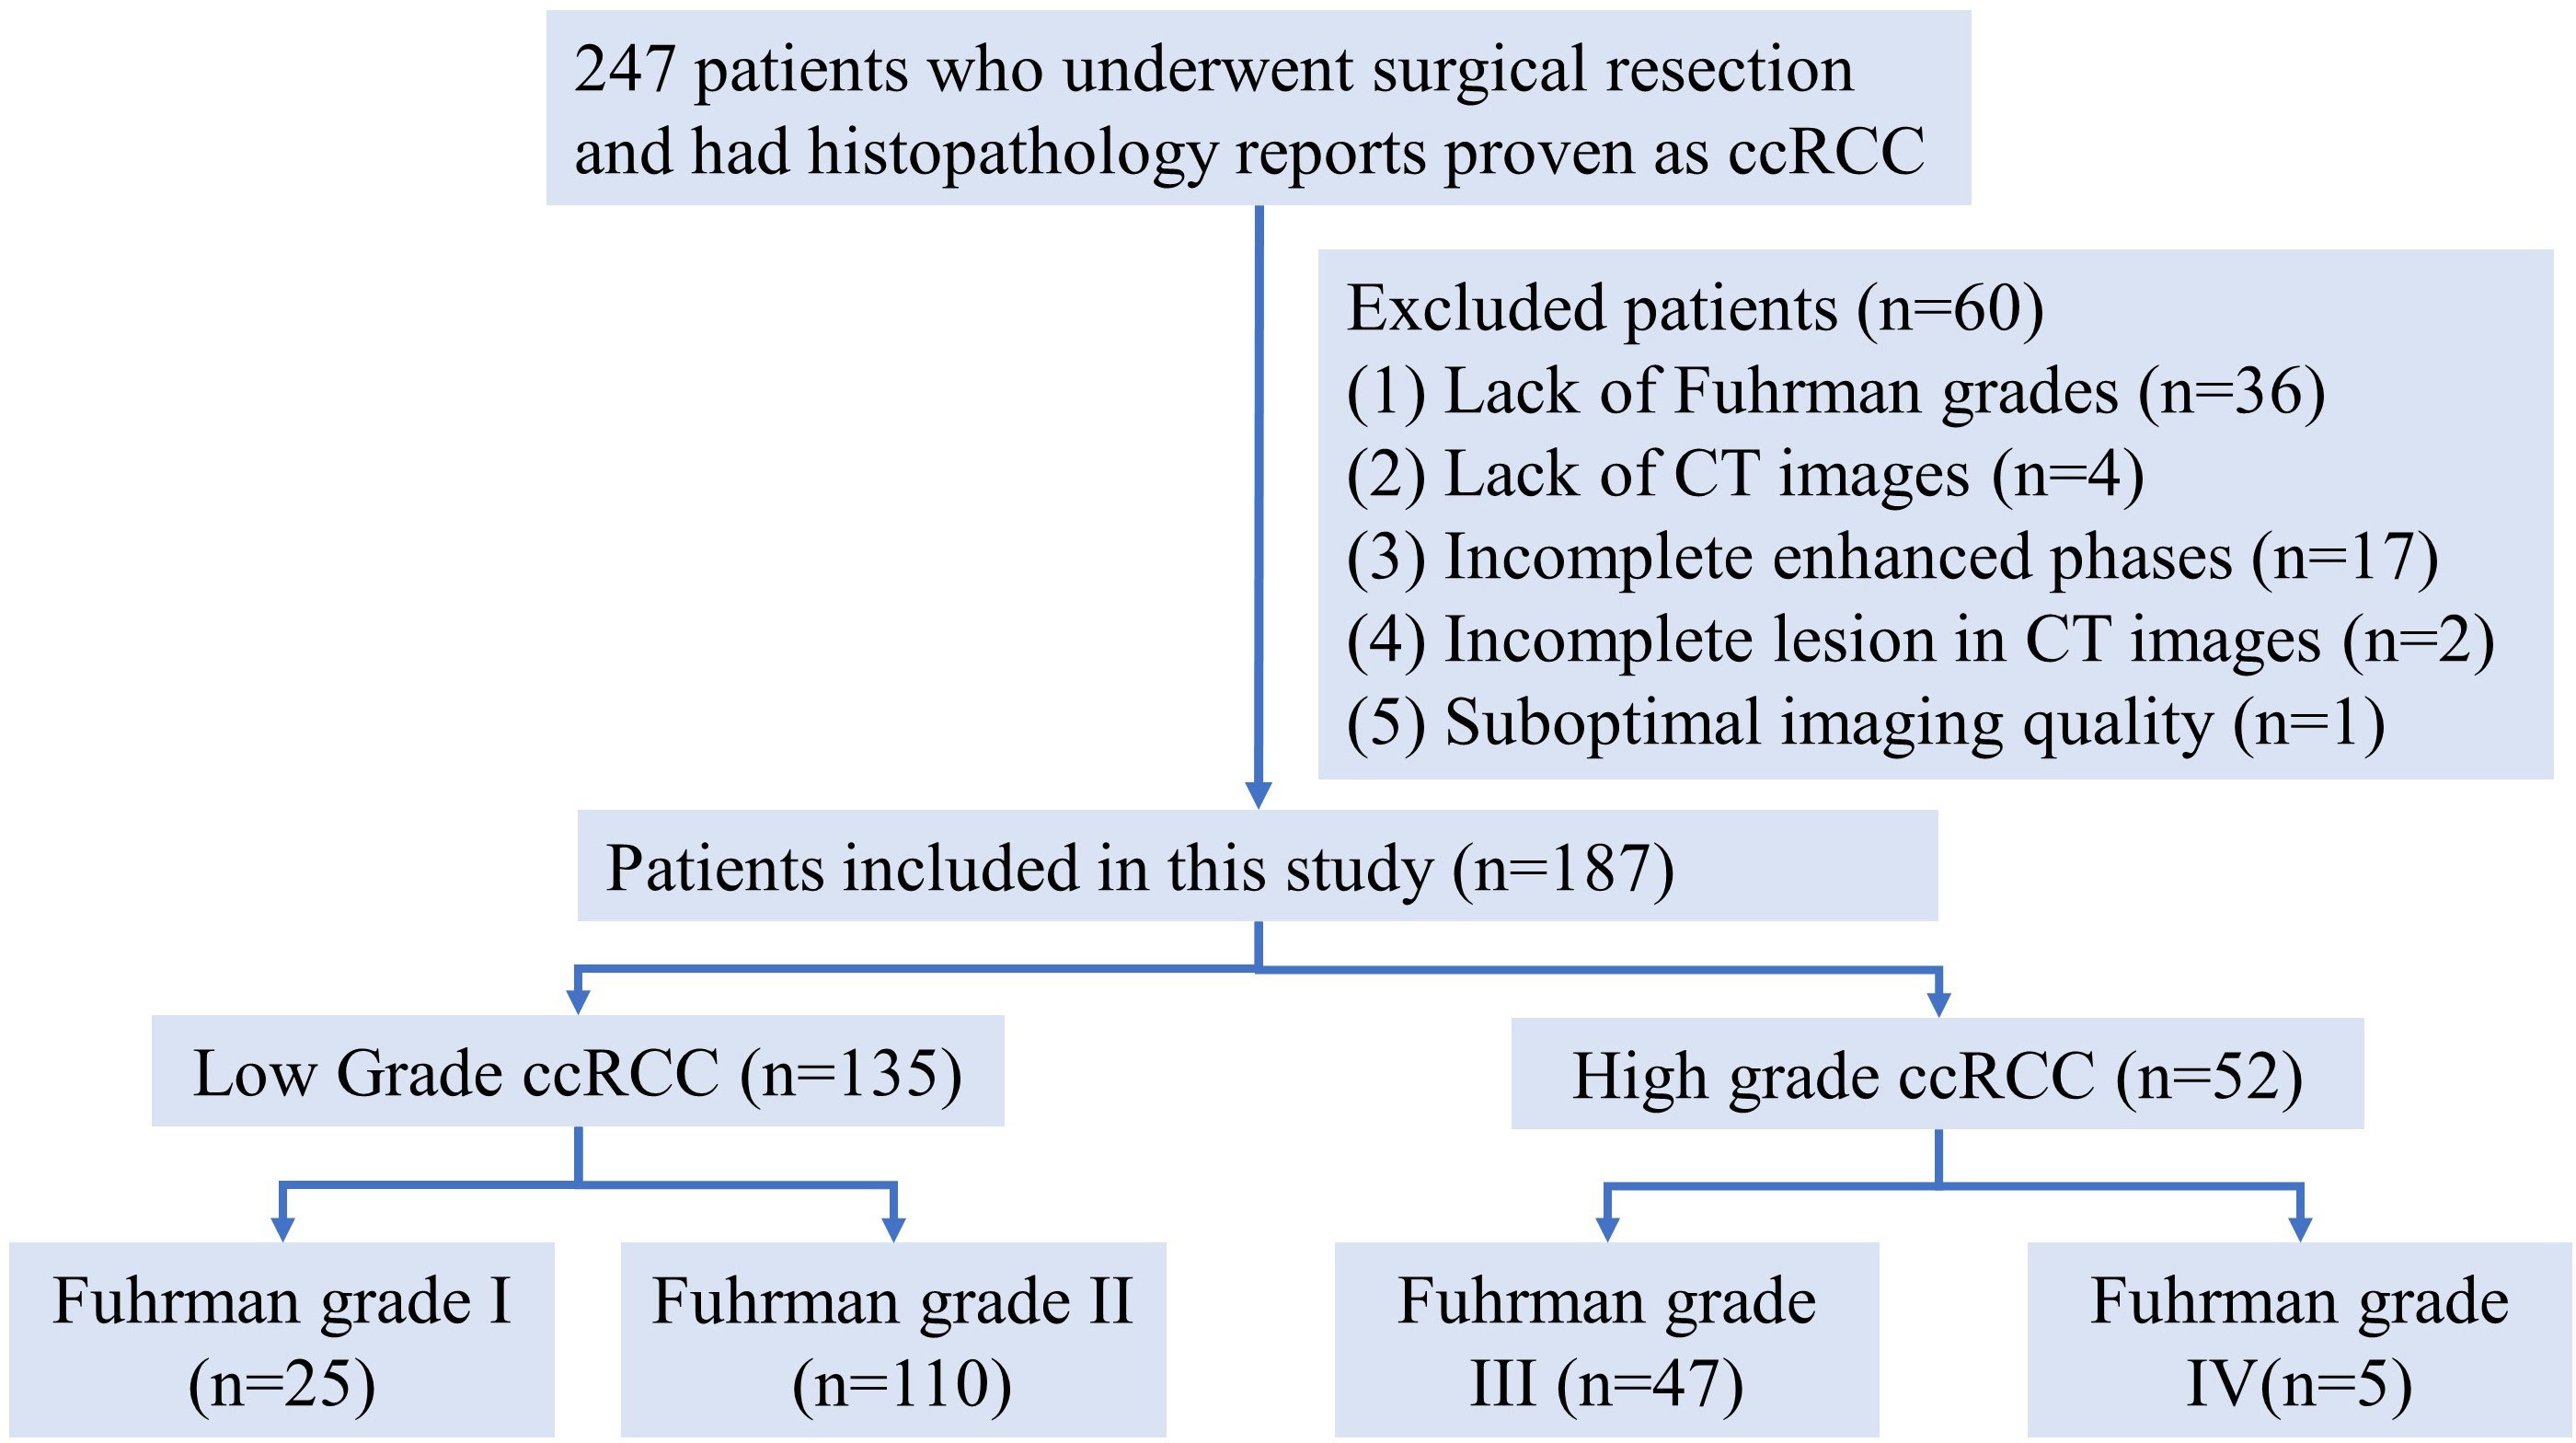
Figure 1 Patient recruitment flowchart.
In order to ensure reproducibility of pathological diagnosis and reduce the intra-/inter-observer variability (5), the traditional four-tiered Fuhrman grading system (FGS) was re-categorized into a simplified Fuhrman grading system with low grade (corresponding to grade I and II in the traditional FGS) and high grade (grade III and IV in the traditional FGS). The simplified FGS could predict prognosis and cancer-specific mortality as good as the traditional four-tiered FGS, which is also widely used in clinical practice (21). Fuhrman grading was accomplished by a genitourinary pathologist with 12 years of experience.
Preoperative four-phase CECT images were acquired from our institutional PACS. All patients underwent CT on a 64-channel MD-CT scanner (GE, Philips). The acquisition parameters were as follows: tube voltage, 120 kV; auto tube current, 200–400 mA depended on patient size; reconstruction slice thickness, 0.625–1.5 mm; pitch, 0.984; collimation, 0.625×64 mm; and tube rotation of 0.5 s. The contrast agent for enhanced scanning is iohexol injection (300 mgI/ml, Yangzi River Pharmaceutical Co., Ltd., Taizhou, Jiangsu Province, China), the dosage of contrast agent is 0.5gI/kg body weight, and the injection time of contrast agent is fixed at 30 s.
All patients in this study underwent preoperative four-phase CECT scans: unenhanced phase, corticomedullary phase, nephrographic phase, and delay phase. The timing of the corticomedullary phase was established by bolus tracking (GE Medical Systems, Beijing, China), which was used to determine the onset of imaging. A circular region of interest (ROI) was placed in the thoracoabdominal aorta junction with a trigger set to begin at 150 HU. CECT images were acquired at 10s (corticomedullary phase), 70–80s (nephrographic phase), and 120–180s (delay phase) after the threshold of 150 HU was reached.
Figure 2 shows the flowchart of building a multi-phase-combined CECT radiomics model for the Fuhrman grade prediction of ccRCC, which mainly includes three steps: image preparing, feature extraction, and radiomics model building. The workflow detail of building multi-phase-combined CECT radiomics model was described in the following subsections.
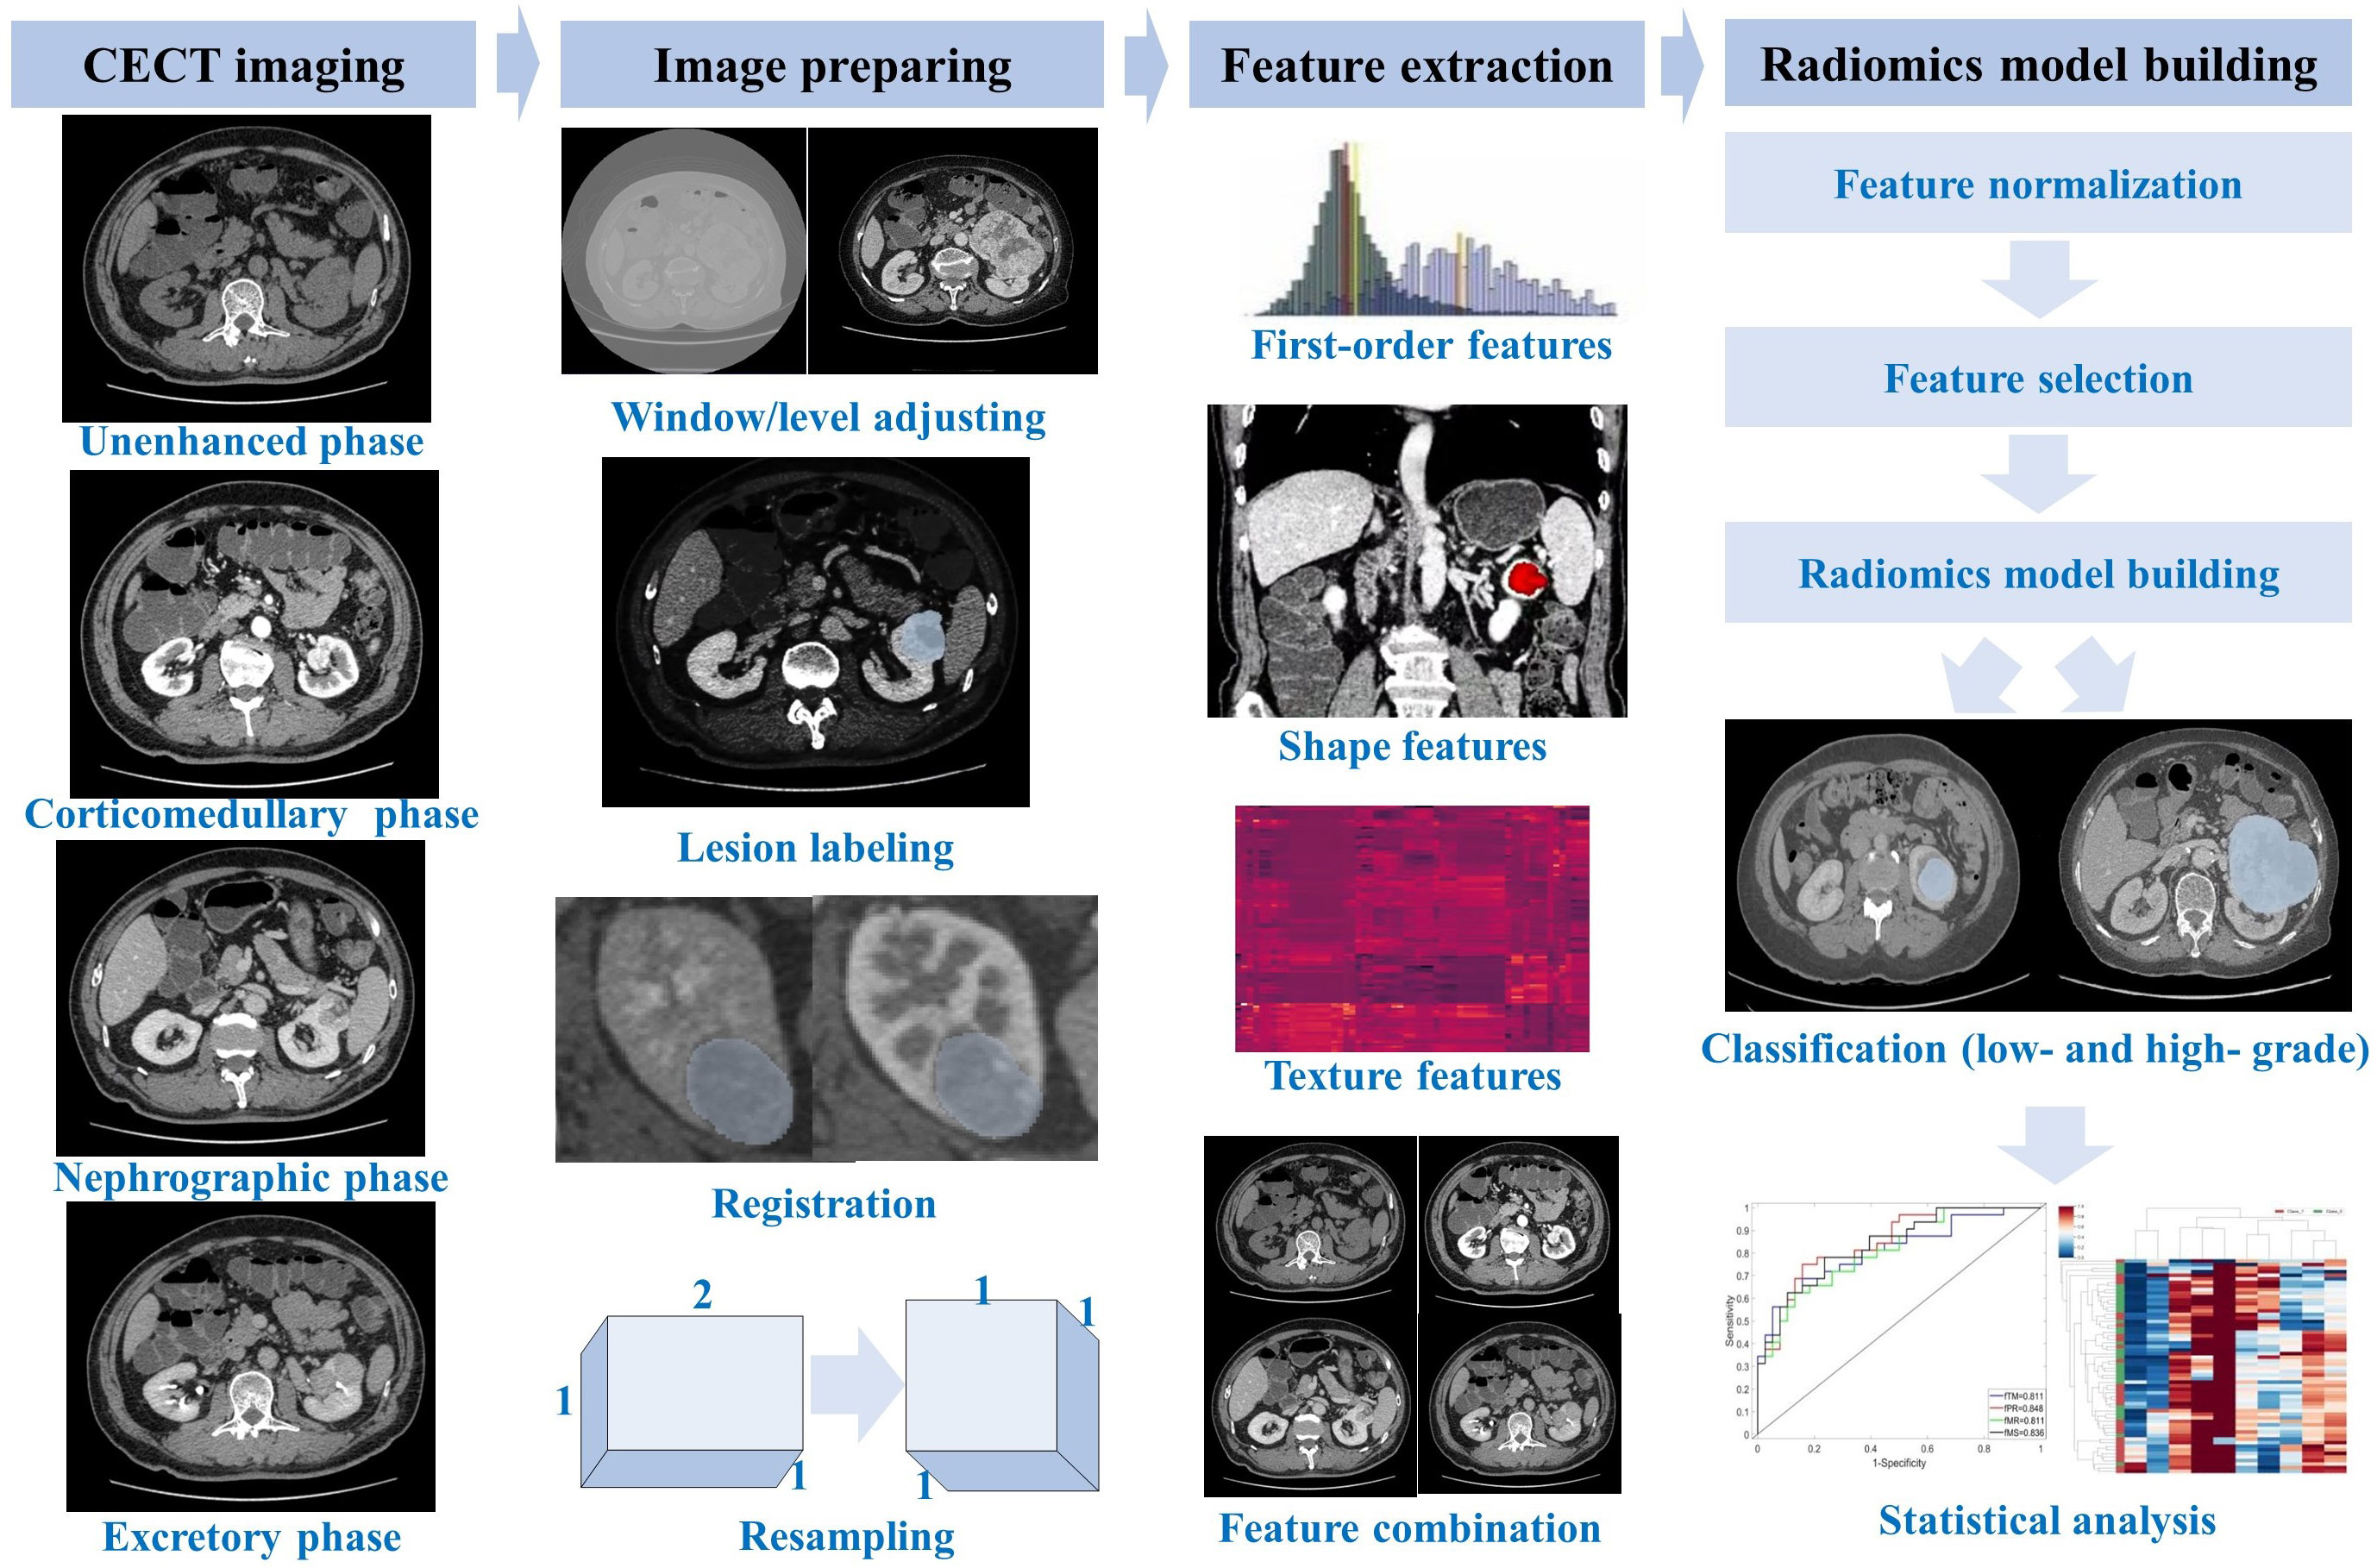
Figure 2 Flowchart of multi-phase-combined radiomics model building for Fuhrman grade prediction of ccRCC.
All CT images with anonymized DICOM format were retrieved from PACS. In order to obtain the target ROI in CECT images, two senior radiologists segmented the entire tumor masses (shown in Figure 3) by delineating the outline of all contiguous slices of the tumors in nephrographic phase CECT with itk-SNAP (http://www.itksnap.org/). Both the two radiologists were blinded to the segmentation of each other and to the clinical and histopathological reports. The ROIs of tumor masses in nephrographic phase CECT images were then applied to the other three phases with slight adjustments tailoring VOIs in each phase by an affine-registration method. The affine registration was performed by elastix (22) (https://elastix.lumc.nl/) to guarantee the corresponding voxels on different phases fits to each other.
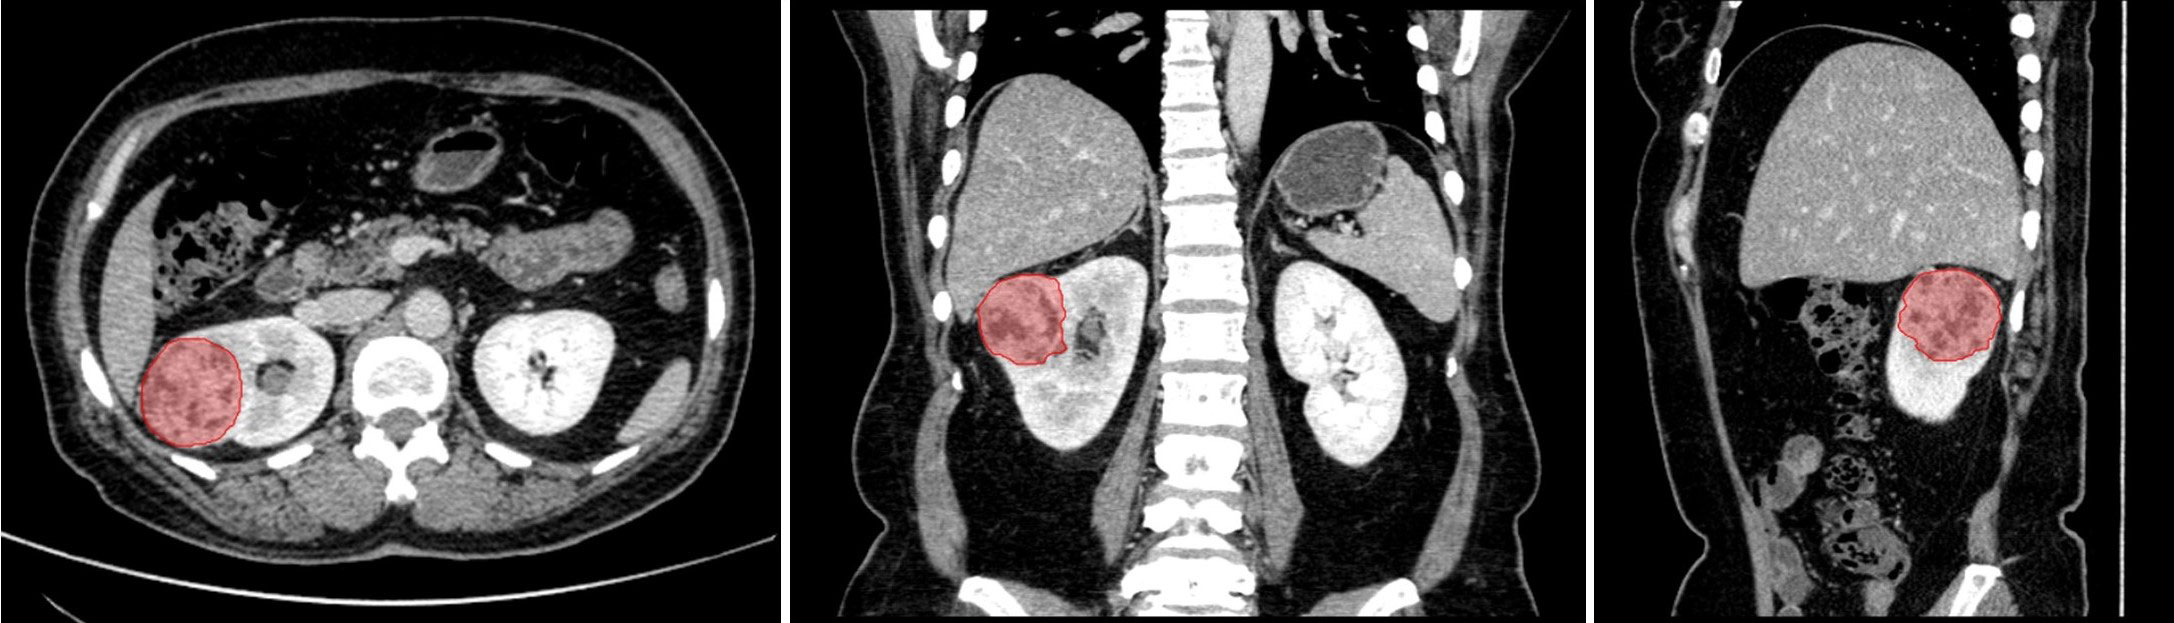
Figure 3 The segmentation of entire tumor mass (red region) on nephrographic phase CT. From left to right are axial, coronal and sagittal.
Some other preprocessing methods were performed before radiomics feature extraction: all images were resampled into voxel spacing of 1 mm ×1 mm ×1 mm using B- spline interpolation, the size of bin width is 25, and the density value of each voxel was shifted 1,000 HU to guarantee a positive value.
A total of 110 3D classical radiomics features were extracted from each ROI in single-phase CT image by using PyRadiomics (14), which is an open-source python package for radiomics feature extraction from medical images. These classical radiomics features could be categorized into seven types: first-order features (n=19), shape features (n=16), gray level co-occurence matrix features (GLCM, n=24), gray level run length matrix features (GLCM, n=16), gray level size zone matrix features (GLSZM, n=16), neighboring gray tone difference matrix features (NGTDM, n=5), and gray level dependence matrix features (GLDM, n=14). GLCM, GLCM, GLSZM, NGTDM, and GLDM are widely known as texture features. The detail of extracted feature names is listed in Appendix A. All features are in compliance with the definitions of Imaging Biomarker Standardization Initiative (23). In this study, the classical radiomics features were termed as , , , and corresponding to the unenhanced phase, corticomedullary phase, nephrographic phase, and delay phase. In order to comprehensively reflect the tumor biological information, features extracted from different phases were furtherly concatenated together to build multi-phase-combined radiomics models. Concretely, the concatenation of features combined with two phases were termed as , , , , , and , including 220 features in the two-phase feature set; the concatenation of features combined with three phases were termed as , , , and , including 330 features in the three-phase feature set; the concatenation of features combined with four phases were termed as , including with 440 features in it.
Variations in contrast enhanced between different phases were quantitative descriptors to represent wash-in-and-wash-out, which macroscopically reflected the hemodynamics and micro-vessel density of individual ccRCC lesion. However, the direct concatenation of classical radiomics features may be limited, since it is a challenge for common machine learning classifiers to mine the latent variations in contrast enhanced between different phases. Therefore, contrast-enhanced variation (CEV) features FCEV were proposed as
of which denoted the extracted feature from non-nephrographic phase and was a corresponding feature extracted from the nephrographic phase. FCEV quantitatively represented the variation of first-order features and texture features between nephrographic phase and others phases. The nephrographic phase was selected as a fiducial phase in this study due to its key role in noninvasive auxiliary diagnose for ccRCC (24–27), although any phase could be theoretically considered as a fiducial phase to calculate CEV features. The concatenation of nephrographic phase features F3 and other single-phase CEV features were termed as (concatenation of and –), (concatenation of and –), and (concatenation of and −). The concatenation of nephrographic phase features and two-phase CEV features were termed as (concatenation of , –, and –), (concatenation of , –, and –), (concatenation of , Fpha 2–, and –). The concatenation of nephrographic phase features and other three-phase CEV features were termed as (concatenation of , -, –, and –). Two examples (, ) of multiple-phase feature concatenation are shown as Figure 4.
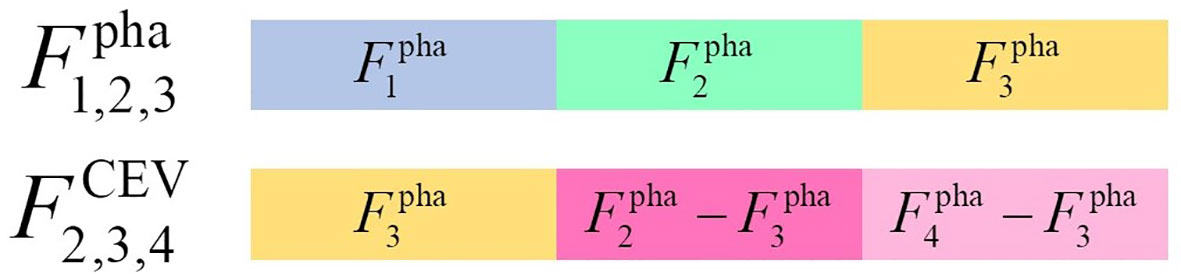
Figure 4 The samples of multiple-phase feature concatenation.
A total of 22 types of image feature sets were finally constructed, which could be categorized into five groups: (1) single-phase feature group, including , , , and ; (2) two-phase-combined feature group, including , , , , , and ; (3) three-phase-combined feature group, including , , , and ; (4) four-phase-combined feature group: ; and (5) CEV feature group, including , , , , , , and .
This study aimed to comprehensively investigate the effectiveness of multi-phase- combined radiomic features. Some existing methods were included in the 22 models. The single-phase models (, , , and ) were equivalent to the method in (28), was equivalent to the method in (29), and is equivalent to the method in (30).
As a preprocessing procedure of feature selection, each feature was standardized to achieve a zero mean and unit variance in the training cohort to avoid the effect of different scales. The feature of test cohort was standardized by applying the standardized hyperparameters (mean and standard deviation) obtained from the training cohort. In order to select discriminative features, a sophisticated feature selection procedure was performed as follows. First, low reproducibility features were removed if variance in normalized feature value was smaller than 10−3. Some uncertainty could be introduced into the tumor delineation. The segmentation of intra- and inter-observer was confirmed by two experienced radiologists. The intraclass correlation coefficients (ICCs) were computed by a two-way mixed-effect model to assess the inter- and intra-observer reproducibility. The features with ICC lower than 0.75 were considered as the poor agreement of the feature and therefore were removed. Second, Pearson correlation analysis (31) was performed to identify the distinctiveness of features and remove the redundant features if their absolute correlations were higher than 0.5. Some studies have shown that an additional feature ranking procedure was an effective way to improve the final performance of classification (32). Therefore, a multivariate ranking method, named as minimum redundancy maximum relevance (mRMR), was applied to identify the most important features on the criterion of both minimum redundancy and maximum relevance. Finally, only the top 20 important features in each features set were selected and input into a C-SVC (C-support vector classifier) (33) to build multi-phase-combined radiomics models. C-SVC is a widely used classifier based on support vector machine, which showed its efficiency and robustness in disease prediction (34–36).
A total of 22 radiomics models were built to evaluate the ability and effectiveness of the proposed multi-phase-combined radiomics models. A total of 126 samples who underwent surgery before December 2016 were assigned into the training cohort, and the remaining 61 samples were assigned into the test cohort. We trained models and fine-tuned hyper-parameters by fivefold cross-validation with five repeated experiments in the training cohort to reduce the data selection bias and alleviate the overfitting. In the training cohort, the training data and validation data were randomly re-selected for fivefold cross-validation in each experiment. Finally, the model’s performance was assessed on the testing cohort, which was independent to the training cohort. The fine-tuned hyper-parameters were C=0.5, kernel=ploy, degree=7, and gamma=1/(feature number). The test cohort was used to assess the performance of all models by the area under the curve (AUC) of receiver operating characteristic curve (ROC). The statistical analysis was completed by using Python v3.8.
There were 187 patients (mean age, 58.80 ± 13.88 years; age range, 21–88 years) enrolled in this study, including 127 men (mean age, 59.76 ± 13.45 years; age range, 24–88 years) and 60 women (mean age, 56.77 years ± 13.63; age range, 21–83 years). There were 135 low-grade ccRCC patients (Fuhrman I: n=24, 12.83%; Fuhrman II: n=111, 59.36%) and 52 high-grade ccRCC patients (Fuhrman III: n=47, 25.13%; Fuhrman IV: n=5, 2.67%). The demographics and characteristics of the whole patient cohort are provided in Table 1. There were significant differences in gender between low grade and high grade (p<0.05), while there was no significant difference in age and tumor size between low grade and high grade (p > 0.05).

Table 1 Demographics and characteristics of the study population.
Specifically, 126 samples (low grade=93, high grade=33) who underwent surgery before December 2016 were assigned into the training cohort, and the rest 61 samples (low grade=42, high grade=19) were assigned into the test cohort. The demographics and characteristics of training and test cohorts are demonstrated in Table 2.
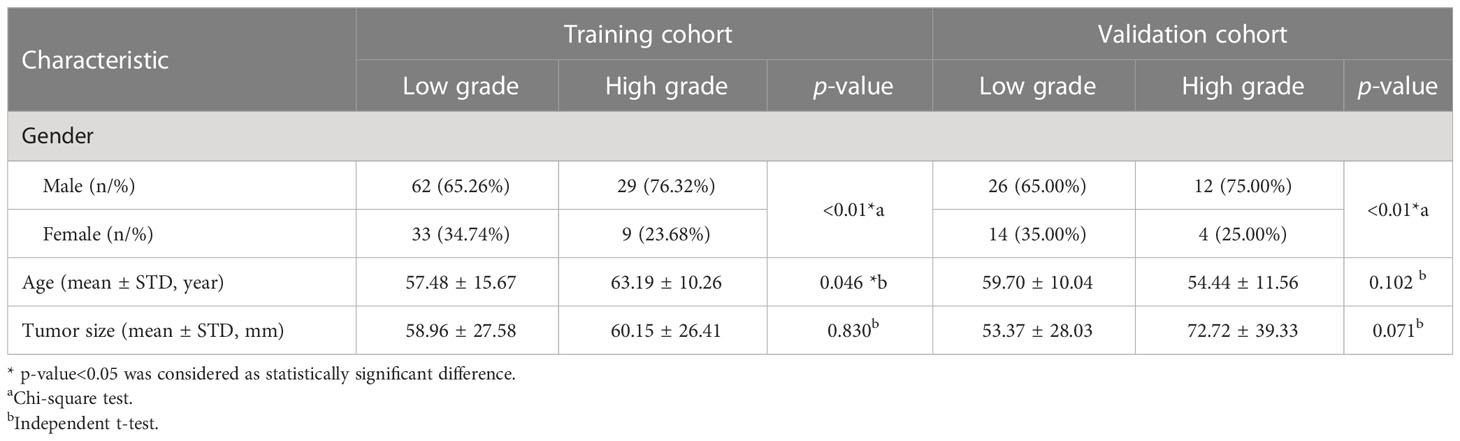
Table 2 Demographics and characteristics of the training cohort and validation cohort.
The 22 radiomics models were built by importing top 20 important features into a C-SVC classifier, and the optimized parameter configurations were determined by fivefold cross-validation with five repeated experiments. The training and validation data were randomly re-selected in each experiment. The discriminative capabilities of all radiomics models were evaluated on the test cohort with AUC, which are illustrated in Figure 5. The ROC value of an individual model was higher than 0.7 considered as a discriminative model in this study (26). Eight models showed their excellent discriminative capabilities: one model was built by single-phase features (), five models were built by the concatenation of multi-phase features (, , , , and ), and two models were built by concatenation of CEV features ( and ). The ROC curves of these discriminative models are shown in Figure 6.
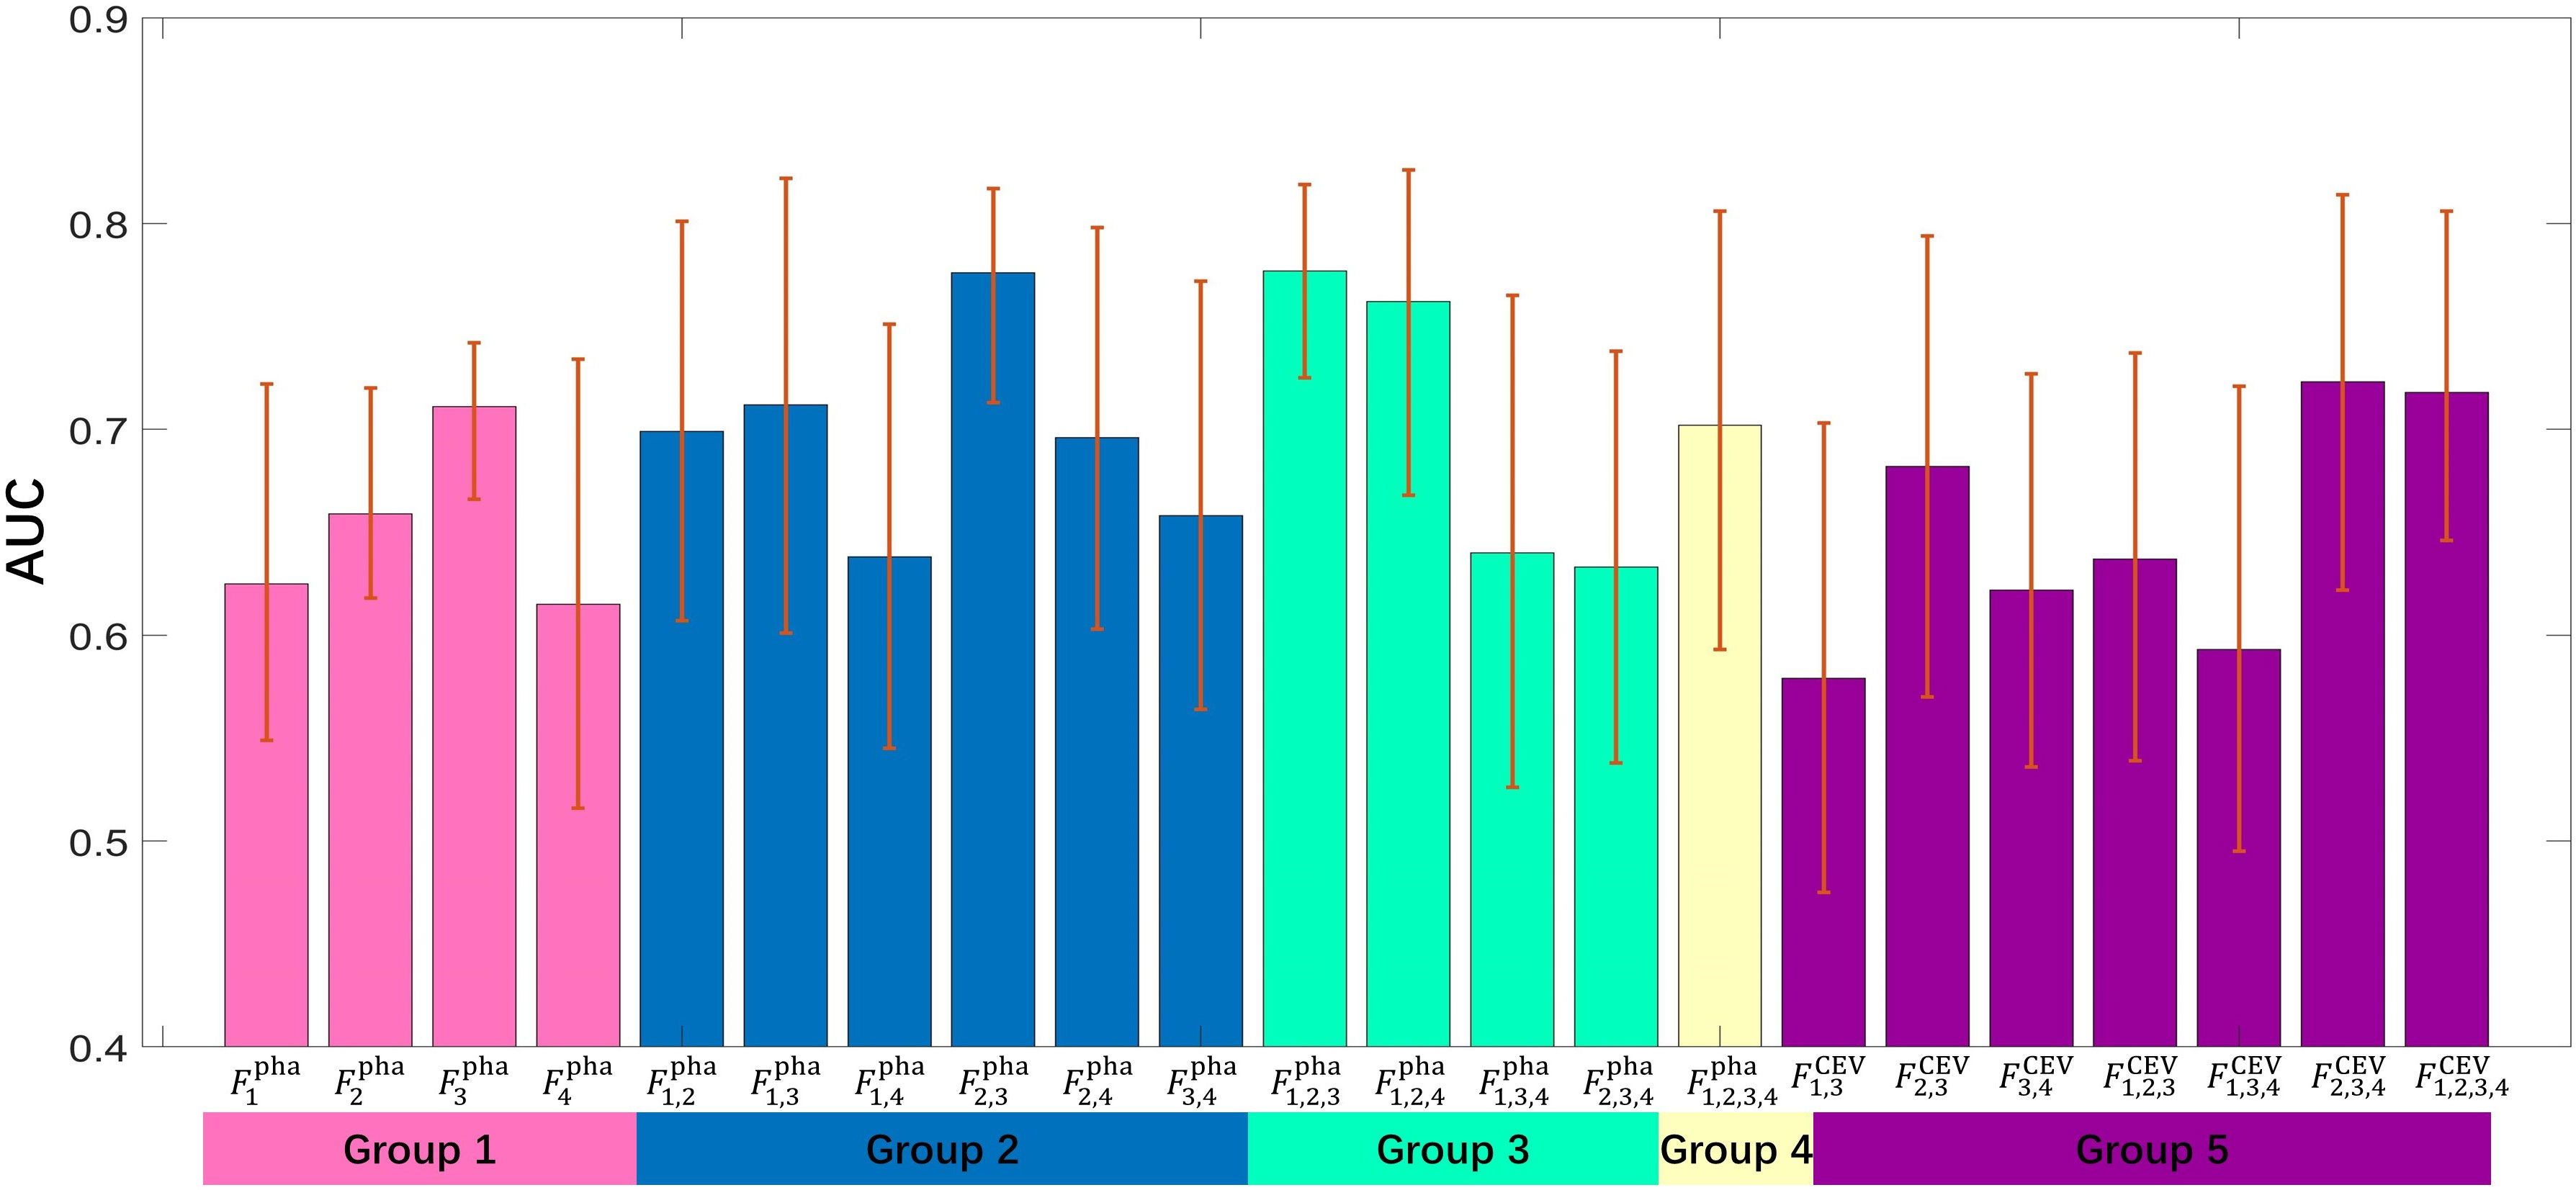
Figure 5 The bar height represents an AUC value of individual model; the error bar represents the upper and lower bounds of 95% CI.
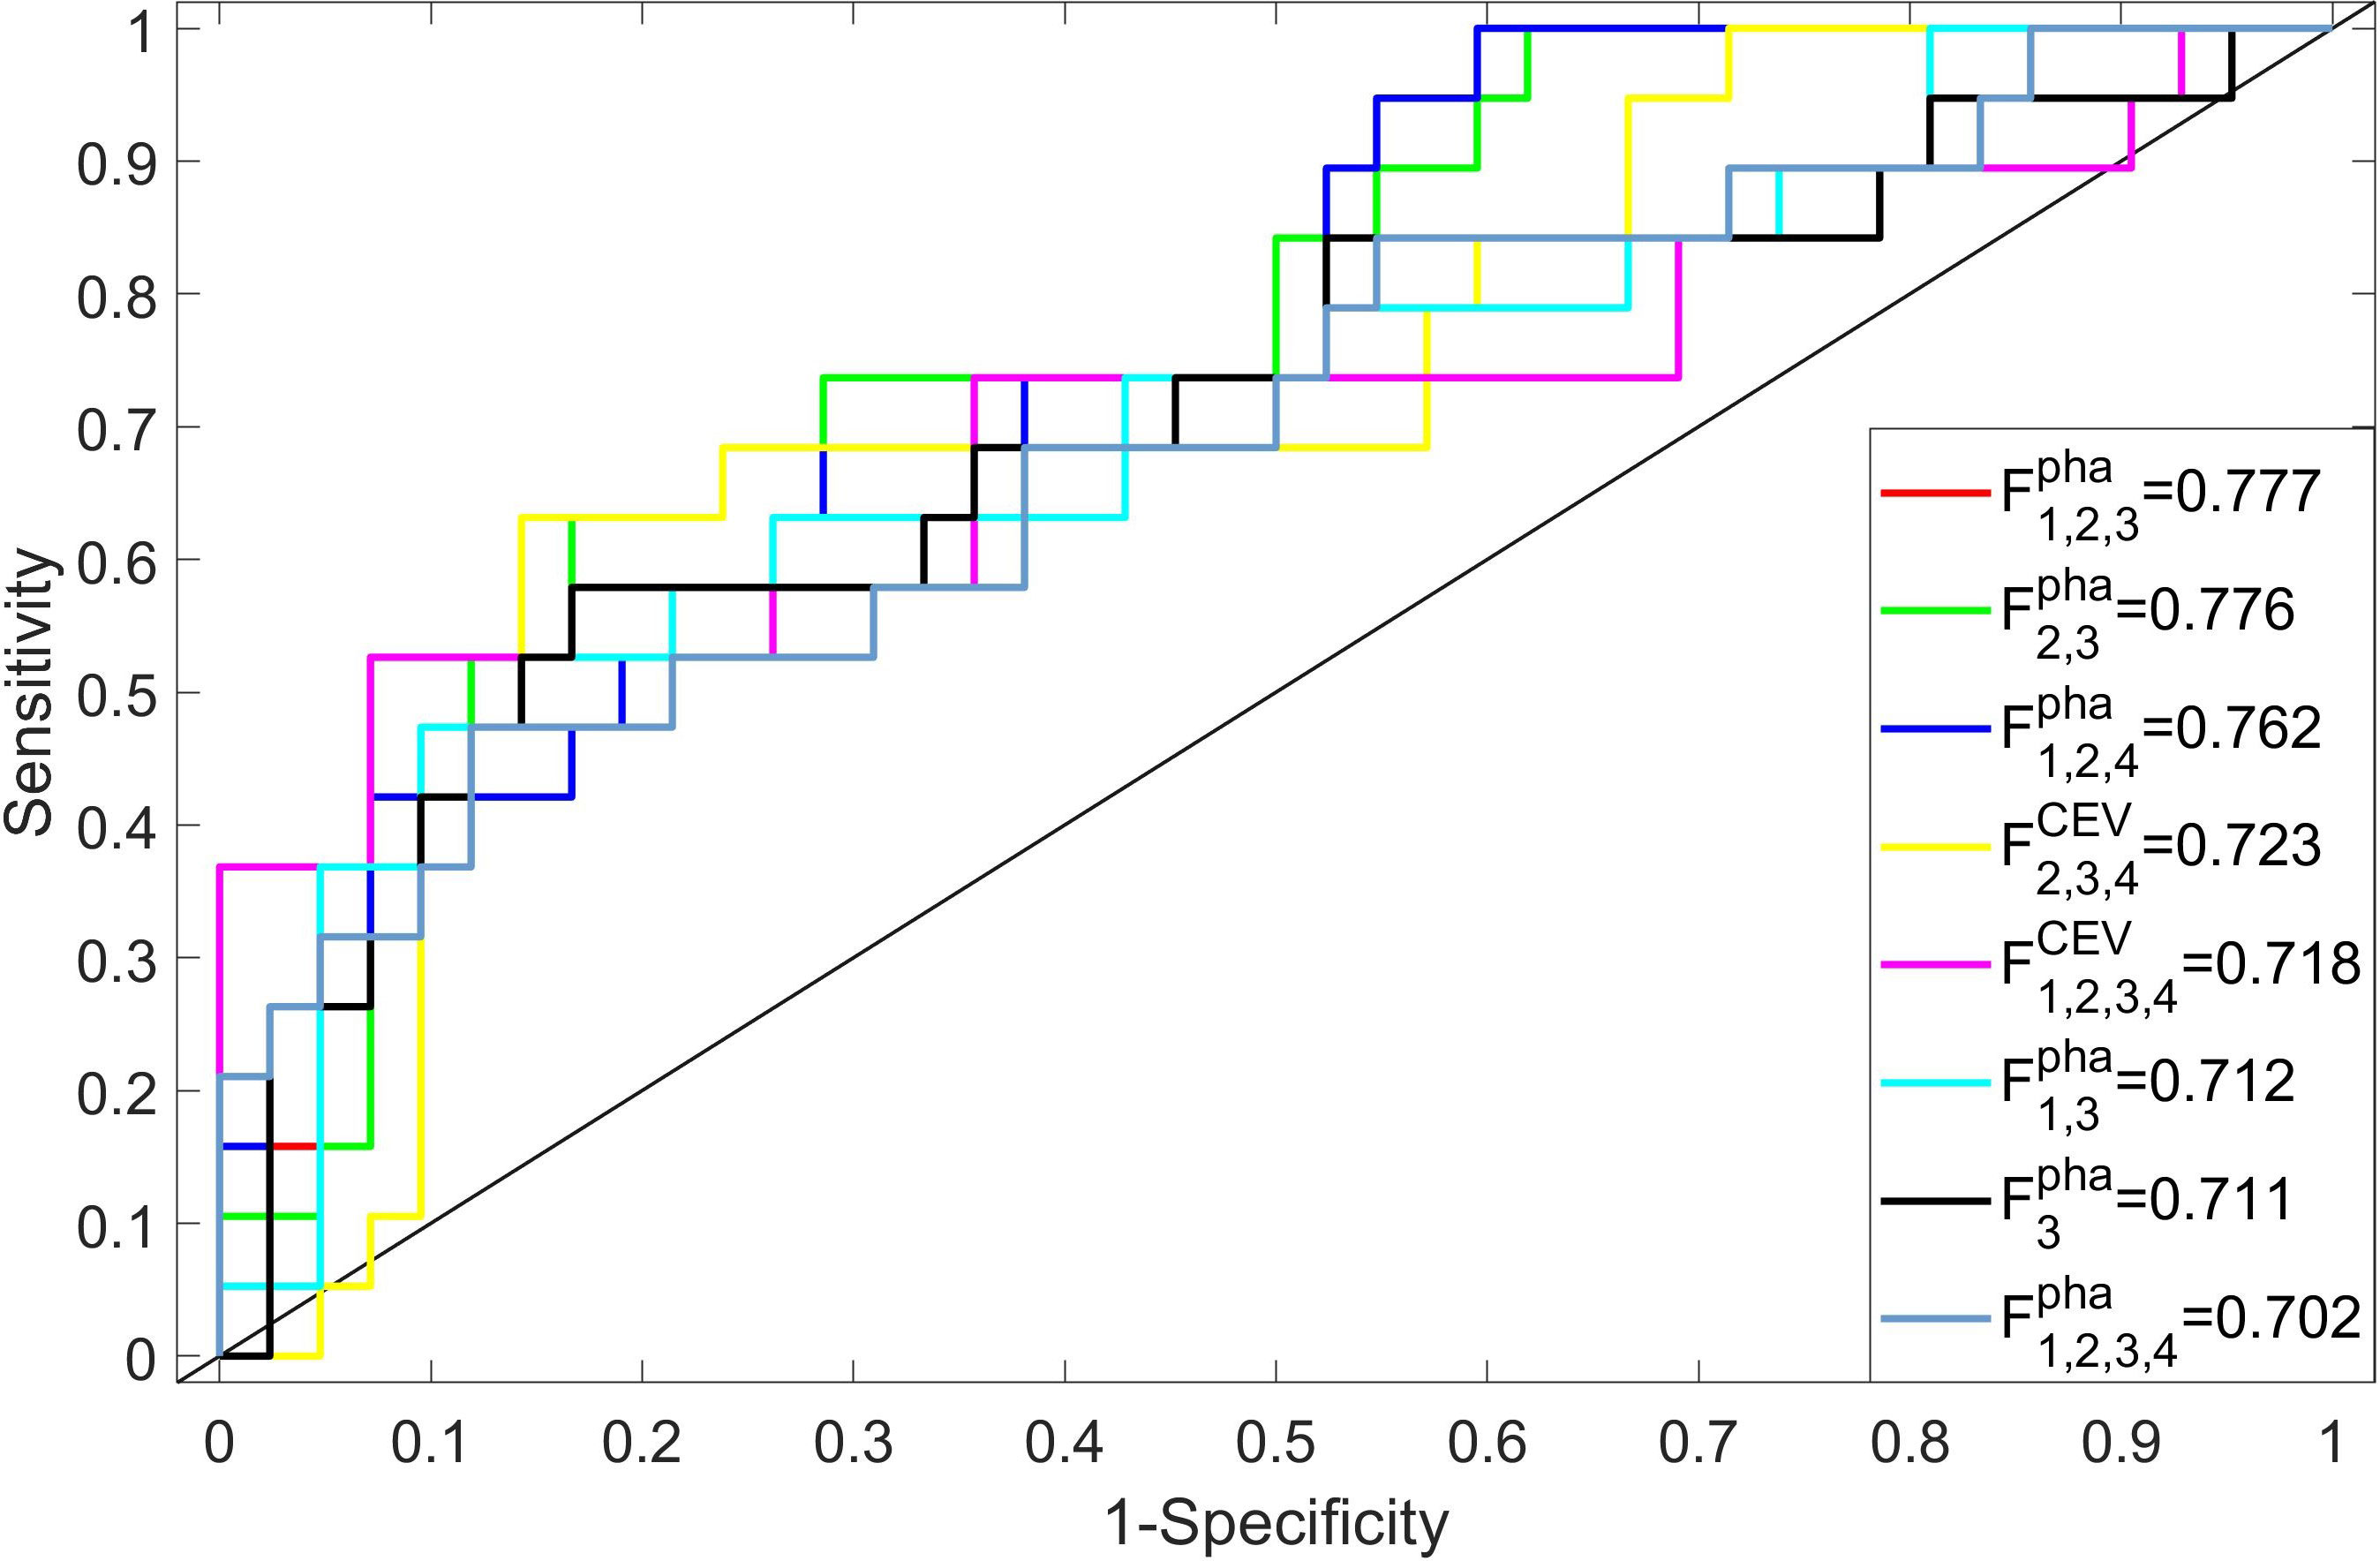
Figure 6 The performance (ROC and AUC value) of the discriminative models (AUC>0.7).
In comparison to other single-phase models, showed its best performance (AUC=0.711), which suggested that features extracted from nephrographic phase may be considered as potential radiology biomarkers for ccRCC Fuhrman grade prediction. Figure 6 also shows that six multi-phase-combined radiomics models (: AUC=0.777; , AUC=0.776; : ACU=0.762; : ACU=0.723; : ACU=0.718; and : ACU=0.712) had better performance than , which demonstrated that the employing of multiphasic features could achieve superior statistical performance for Fuhrman grade differentiation of ccRCC. Fpha 1,2,3 showed its highest performance in all models (AUC=0.777, 95% CI: 0.732–0.836, accuracy=0.743, sensitivity=0.692, and specificity= 0.819). A significant difference was observed between and (p value=0.039), which demonstrates that the multi- phase-combined CECT radiomics models outperforms the radiomics model with single-phase radiomics features.
mRMR ranked all features and selected 20 key features to build radiomics models. We counted the frequency of these key features in all radiomics models, and their percentage is summarized in Figures 7, 8. Figure 7 summarizes the percentage of key features selected by mRMR in discriminative models. It showed that first-order, CEV, and GLCM types were the most frequently selected feature types in all models and discriminative models. There were 39 features selected by mRMR as key features (3D classical radiomics features=24, CEV feature=15) in discriminative models, and their frequencies are shown in Figure 8.
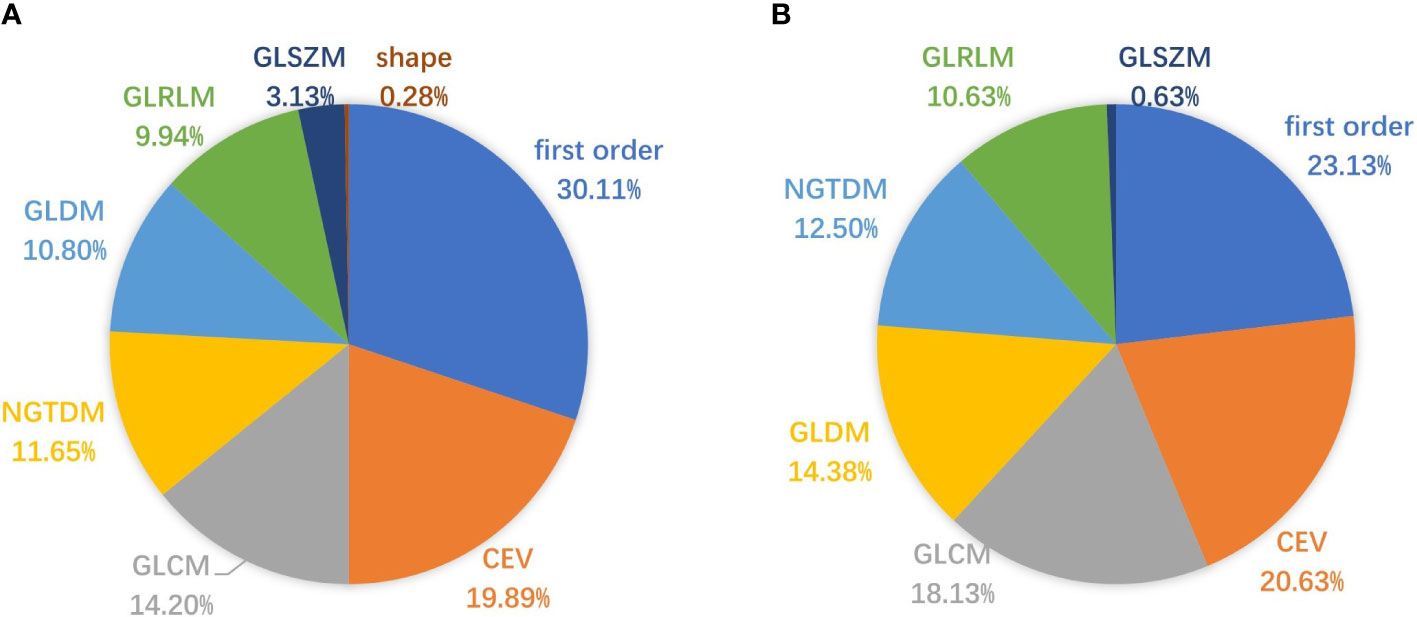
Figure 7 Pie charts representing the percentage (%) of key features selected by mRMR. (A) The percentage of key features in all radiomics models; (B) the percentage of key features in discriminative models.
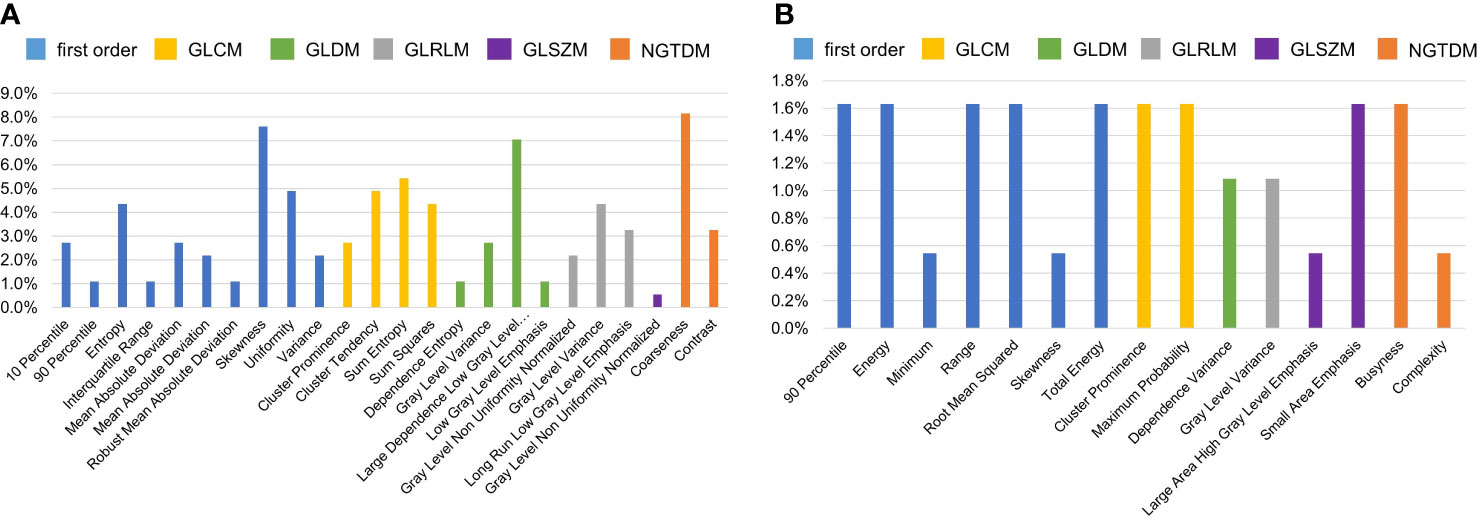
Figure 8 The frequency of key features selected by mRMR in discriminative models. The higher frequency of individual feature denoted that it played the more important role in the discriminative model. (A) The frequencies of key 3D classical radiomics features selected by mRMR in discriminative models; (B) the frequencies of CEV features selected by mRMR in discriminative models.
The top 10 most frequently selected features are shown in Table 3. In order to further verify the effectivity of the top 10 most frequently selected features, the significant differences in these features between low grade and high grade were calculated on the nephrographic phase, which is also summarized in Table 3. CEV features also played important roles in Fuhrman grading of ccRCC; the characterization of the most frequently selected CEV features is summarized in Table 4.
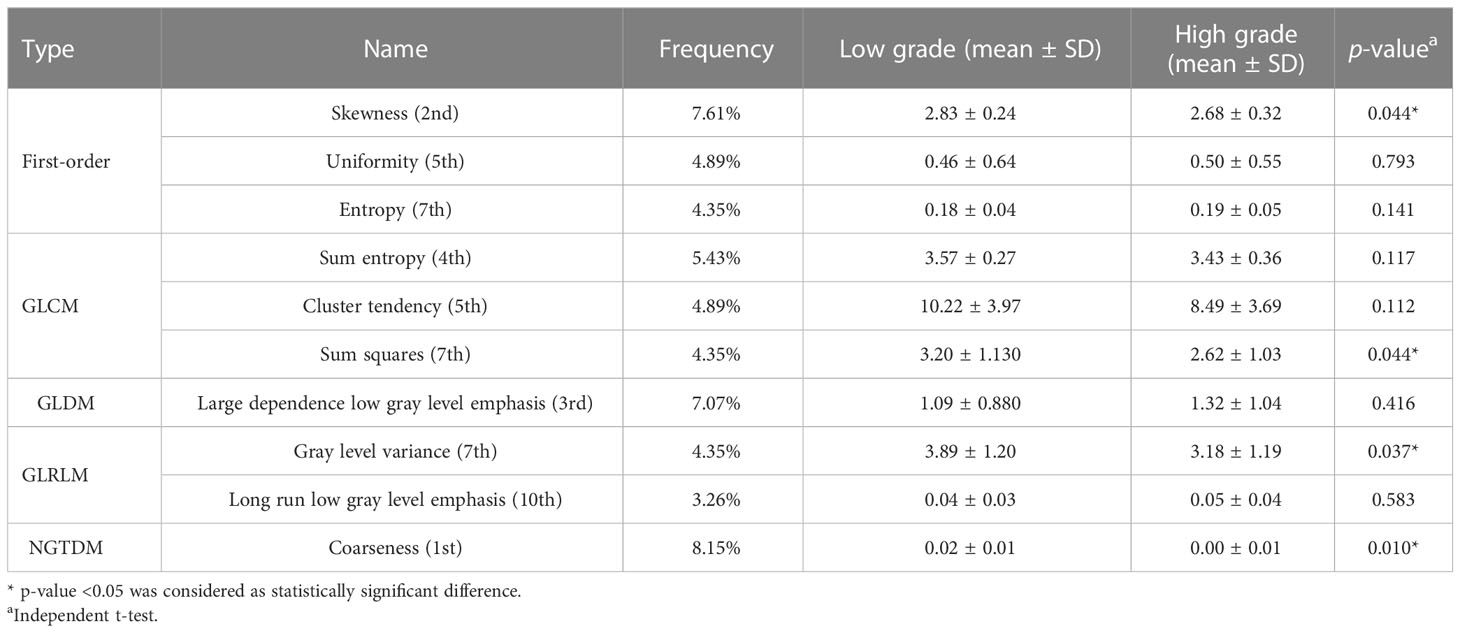
Table 3 The characterization of the top 10 most frequently selected features on nephrographic phase images.
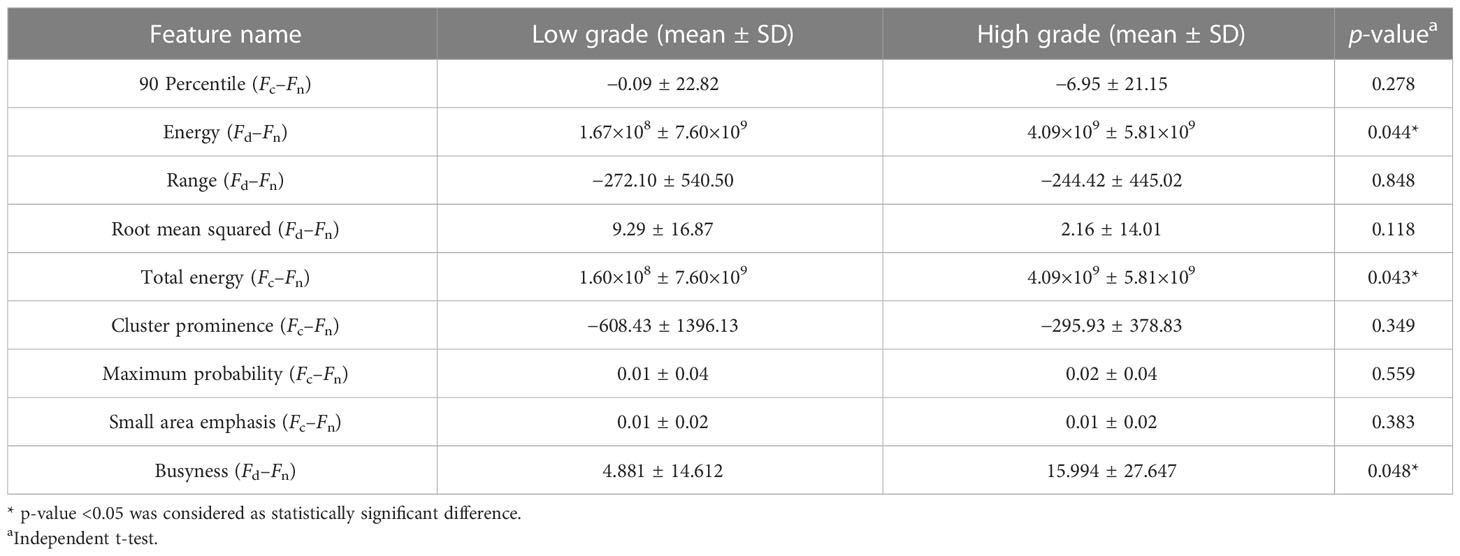
Table 4 The characterization of the most frequently selected CEV features.
The originality of this retrospective study was to proposed multi-phase-combined CECT radiomics models for the noninvasive Fuhrman grading of ccRCC, which concatenated multi-phase 3D radiomics features and CEV features to comprehensively reflect the microscale information of tumors.
Some studies have shown that single-phase radiomics model may be a promising noninvasive method to predict the Fuhrman grade of ccRCC (37, 38). Demirjian et al. (39) evaluated the effectiveness of CT-based radiomics features in discriminating Fuhrman grades and TNM stages. Saelin et al. (40) evaluated some statistical differences in sex, age, tumor size, and CT imaging features according to the Fuhrman grade of ccRCCs. They found intratumoral necrosis on CT was a strong and independent predictor of biologically aggressive ccRCCs. Hussain et al. (41) proposed a learnable image histogram in a deep neural network framework that can learn task-specific image histograms. This method learned a statistical context features directly from the images and deploys it to extract representative discriminant textural image features.
Lin et al. (24) built a machine learning model to predict Fuhrman grades by combining three phases of CECT and claimed that it achieved superior statistical performance compared with the single-phase radiomics model. Ding et al. (12) incorporated texture features and six non-texture features for preoperatively differentiating Fuhrman grades. The texture features were extracted from the corticomedullary- and nephrographic-phase CECT images. The LASSO (42) was used to select the most valuable texture features and calculate a texture score for each patient. A logistic regression model was used to discriminate the high- from low- grade ccRCC at nephrectomy. Mostafa et al. (43) used three-phase CT scans (unenhanced, corticomedullary phase, and nephrographic phase) to build radiomic models. They first applied Laplacian of Gaussian and wavelet filter on delineated tumor volumes and then extracted tumor shape, size, intensity statistics, and texture from each segmented tumor volume. They selected features to build three classification models (SVM, random forest, and logistic regression) to discriminate Fuhrman grades. Shu et al. (15) extracted 1,029 radiomic features from corticomedullary and nephrographic phases and then used LASSO regression method to select features. Then, the selected features were constructed using three classification models (corticomedullary phase, nephrographic phase, and their combination) by logistic regression method to discriminate high- and low- grade ccRCC. Feng et al. (44) also used three-phase CECT (non-contrast phase, corticomedullary phase, and nephrographic phase) to extract first-order image features and reflect tumor heterogeneity. They also found that entropy, which reflects texture irregularity and chaos, was an independent and excellent texture feature to discriminate Fuhrman grades. However, they did not comprehensively investigate the performance of different phases and their combinations.
In this study, we built multi-phase- combined radiomics models by extracting 3D classical radiomics features and computing CEV features from the entire 3D tumor mass. The following were the innovations of this study. (1) We extracted radiomics features from four-phase CECT to build multi-phase-combined radiomics models for ccRCC Fuhrman grading. The advantage of multi-phase-combined radiomics models is that the multi-phase features may be theoretically related to the hemodynamics and micro-vessel density of ccRCC tumors (45–47), since ccRCC is a highly angiogenic and vascularized tumor type (48). The experiments also showed that the combined model with the corticomedullary phase and the nephrographic phase could identify Fuhrman grades with the best performance. (2) We introduced 3D CEV features to quantitatively represent the variation in classical radiomics features between different phases, since the variation of first-order and texture features may reflect the enhancement of the inhomogeneity of the ccRCC tumor mass (49, 50). CEV features could serve as potential radiology biomarkers to macroscopically depict the hemodynamics and micro-vessel density of ccRCC tumors. (3) We comprehensively investigated the roles of classical radiomics features, CEV features, and their combinations, found that the first- order, CEV, and GLCM feature types played key roles in ccRCC Fuhrman grading.
Our study showed that there was one single-phase model () and seven multi-phase-combined models (, , , , and , , ) considered as discriminative model (AUC>0.7). The statistical results demonstrated that five multi-phase-combined radiomics models had better performance than single-phase models, of which and model shown the highest AUC values in all models. The performance of and is significantly better than (p- value <0.05). Compared with other single-phase models, the model showed its high performance, whose AUC value was comparable to some multi-phase-combined radiomics models. In addition, four discriminative multi-phase-combined radiomics models (, , , and ) included nephrographic phase features, which denoted that nephrographic phase features played a key role in distinguishing Fuhrman grades of ccRCC.
First-order, CEV, and GLCM feature types were the top 3 most frequently selected feature types in discriminative models, meaning that they played crucial roles in Fuhrman grade prediction. The top 10 most frequently selected features respectively belong to first-order type (n=3), GLCM type (n=3), GLDM type (n=1), GLRLM type (n=2), and NGTDM type (n=1). Coarseness was the top 1 most frequently selected feature in discriminative models. It captures the spatial change rate of gray-level intensities and reflects the gray level difference between the central pixel and its neighborhoods. Skewness is the second most frequently selected feature, which measures the asymmetry of the gray-level intensity distribution curve. Large dependence, low gray-level emphasis is the third most frequently selected feature, which measures the joint distribution of large dependence with lower gray-level values. Entropy and sum entropy measure the inherent randomness of gray-level intensities, which reflect the tumor heterogeneity and were usually considered as biomarkers for tumor stage in radiation oncology (15, 44, 51).
Two models combining CEV features (, ) were considered as discriminative models, which denoted that CEV features could be used as supplementary features for decision-making in Fuhrman grading. There were 15 CEV features ranked as important feature by mRMR, of which the variation in first-order features (frequency=9.24%) made up the highest proportion in the CEV feature group.
There were some limitations in this study. It was a relatively small sample size, and there was no external test set due to our strict inclusion criteria, which required all four phases of contrast-enhanced CT to be available for all patients. The radiomics applications would suffer from poor external validation due to inter-institutional variations of CT protocol and workflow. Therefore, a prospective and multicenter experimental study was necessary for further validation in an independent cohort. The second limitation is the use of the Fuhrman nuclear grading system instead of the latest WHO/ISUP grading system (52–54), as some of the included cases date back to 2009 when the Fuhrman grading system was widely used. The third limitation is that only 110 3D classical radiomics features were extracted from each phase to build the models. Some preprocessing methods (e.g., Laplacian of Gaussian, wavelet filter, gradient filter, and local binary pattern filter) could generate derived images, and more features extracted from derived images could enhance the performance of radiomic models (43). Moreover, the AUC value will be higher if clinical variables are incorporated into the models (55, 56).
In conclusion, the multi-phase-combined CECT radiomics methods could noninvasively predict the Fuhrman grades of ccRCC. The multi-phase features with 3D classical radiomics features and CEV features may serve as noninvasive radiology biomarkers for Fuhrman grade prediction.
The original contributions presented in the study are included in the article/Supplementary Material. Further inquiries can be directed to the corresponding author.
Institutional Review Board approval was not required because this is a retrospective study with anonymous data. Study subjects or cohorts have not been previously reported in other publications. Written informed consent was not required for this study because this is a retrospective study with anonymous data.
ZZ: Conceptualization, Methodology, Funding acquisition, Writing-Original Draft. XQ: Software, Validation. JH: Formal analysis. CG: Validation. YZ: Validation. XD: Investigation. TC: Formal analysis. JZ: Resources, Writing-Review & Editing, Funding acquisition. YD: Writing-Review & Editing, Funding acquisition. All authors contributed to the article and approved the submitted version.
This study was supported by National Natural Science Foundation of China (62271480), Youth Innovation Promotion Association CAS (2021324), Jiangsu Key Technology Research Development Program (BE2021612), Suzhou Science & Technology Projects for People’s Livelihood (SKY2021031, SKY2022052), Natural Science Foundation of Shandong Province under Grant (ZR2022QF093).
The authors declare that the research was conducted in the absence of any commercial or financial relationships that could be construed as a potential conflict of interest.
All claims expressed in this article are solely those of the authors and do not necessarily represent those of their affiliated organizations, or those of the publisher, the editors and the reviewers. Any product that may be evaluated in this article, or claim that may be made by its manufacturer, is not guaranteed or endorsed by the publisher.
The Supplementary Material for this article can be found online at: https://www.frontiersin.org/articles/10.3389/fonc.2023.1167328/full#supplementary-material
AUC, area under the curve; ccRCC, clear cell renal cell carcinoma; CECT, contrast-enhanced CT; CEV, contrast-enhanced variation; CI, confidence interval; C-SVC, C-support vector classifier; FGS, Fuhrman grading system; GLCM, gray level co-occurrence matrix; GLDM, gray level dependence matrix; GLRLM, gray level run length matrix; GLSZM, gray level size zone matrix; ICCs, intraclass and interclass correlation coefficients; mRMR, minimum redundancy maximum relevance; NGTDM, neighboring gray tone difference matrix; RCC, renal cell carcinoma; ROC, receiver operating characteristic.
1. Hsieh JJ, Purdue MP, Signoretti S, Swanton C, Albiges L, Schmidinger M, et al. Renal cell carcinoma. Nat Rev Dis Primers (2017) 3(1):17009. doi: 10.1038/nrdp.2017.9
2. Cheville JC, Lohse CM, Zincke H, Weaver AL, Blute ML. Comparisons of outcome and prognostic features among histologic subtypes of renal cell carcinoma. Am J Surg Pathol (2003) 27(5):612–24. doi: 10.1097/00000478-200305000-00005
3. Young JR, Margolis D, Sauk S, Pantuck AJ, Raman SS. Clear cell renal cell carcinoma: discrimination from other renal cell carcinoma subtypes and oncocytoma at multiphasic multidetector CT. Radiology (2013) 267(2):444–53. doi: 10.1148/radiol.13112617
4. Sun M, Shariat SF, Cheng C, Ficarra V, Murai M, Oudard S, et al. Prognostic factors and predictive models in renal cell carcinoma: A contemporary review. Eur Urol (2011) 60(4):644–61. doi: 10.1016/j.eururo.2011.06.041
5. Luo S, Wei R, Lu S, Lai S, Wu J, Wu Z, et al. Fuhrman nuclear grade prediction of clear cell renal cell carcinoma: influence of volume of interest delineation strategies on machine learning-based dynamic enhanced CT radiomics analysis. Eur Radiol (2022) 32(4):2340–50. doi: 10.1007/s00330-021-08322-w
6. Ljungberg B, Albiges L, Abu-Ghanem Y, Bedke J, Capitanio U. European association of urology guidelines on renal cell carcinoma: the 2022 update. Eur Urol (2019) 75:799–810. doi: 10.1016/j.eururo.2019.02.011
7. Delahunt B, Egevad L, Montironi R, Srigley JR. International society of urological pathology (ISUP) consensus conference on renal neoplasia. Am J Surg Pathol (2013) 37(10):1463–8. doi: 10.1097/PAS.0b013e318299f14a
8. Silverman SG, Israel GM, Trinh Q-D. Incompletely characterized incidental renal masses: emerging data support conservative management. Radiology (2015) 275(1):28–42. doi: 10.1148/radiol.14141144
9. Ball MW, Bezerra SM, Gorin MA, Cowan M, Pavlovich CP, Pierorazio PM, et al. Grade heterogeneity in small renal masses: potential implications for renal mass biopsy. J Urol (2015) 193(1):36–40. doi: 10.1016/j.juro.2014.06.067
10. Gerlinger M, Rowan AJ, Horswell S, Larkin J, Endesfelder D, Gronroos E, et al. Intratumor heterogeneity and branched evolution revealed by multiregion sequencing. N Engl J Med (2012) 366(10):883–92. doi: 10.1056/NEJMoa1113205
11. Zhu X, Dong D, Chen Z, Fang M, Zhang L, Song J, et al. Radiomic signature as a diagnostic factor for histologic subtype classification of non-small cell lung cancer. Eur Radiol (2018) 28(7):2772–8. doi: 10.1007/s00330-017-5221-1
12. Ding J, Xing Z, Jiang Z, Chen J, Pan L, Qiu J, et al. CT-based radiomic model predicts high grade of clear cell renal cell carcinoma. Eur J Radiol (2018) 103:51–6. doi: 10.1016/j.ejrad.2018.04.013
13. Lambin P, Leijenaar RTH, Deist TM, Peerlings J, de Jong EEC, van Timmeren J, et al. Radiomics: the bridge between medical imaging and personalized medicine. Nat Rev Clin Oncol (2017) 14(12):749–62. doi: 10.1038/nrclinonc.2017.141
14. van Griethuysen JJM, Fedorov A, Parmar C, Hosny A, Aucoin N, Narayan V, et al. Computational radiomics system to decode the radiographic phenotype. Cancer Res (2017) 77(21):104–7. doi: 10.1158/0008-5472.CAN-17-0339
15. Shu J, Tang Y, Cui J, Yang R, Meng X, Cai Z, et al. Clear cell renal cell carcinoma: CT-based radiomics features for the prediction of Fuhrman grade. Eur J Radiol (2018) 109:8–12. doi: 10.1016/j.ejrad.2018.10.005
16. Wang P, Pei X, Yin X-P, Ren J-L, Wang Y, Ma L-Y, et al. Radiomics models based on enhanced computed tomography to distinguish clear cell from non-clear cell renal cell carcinomas. Sci Rep (2021) 11(1):13729. doi: 10.1038/s41598-021-93069-z
17. Coy H, Young JR, Douek ML, Pantuck A, Brown MS, Sayre J, et al. Association of qualitative and quantitative imaging features on multiphasic multidetector CT with tumor grade in clear cell renal cell carcinoma. Abdominal Radiol (2019) 44(1):180–9. doi: 10.1007/s00261-018-1688-8
18. Feng Z, Rong P, Cao P, Zhou Q, Zhu W, Yan Z, et al. Machine learning-based quantitative texture analysis of CT images of small renal masses: Differentiation of angiomyolipoma without visible fat from renal cell carcinoma. Eur Radiol (2018) 28(4):1625–33. doi: 10.1007/s00330-017-5118-z
19. Zhang G-M-Y, Shi B, Sun H, Jin Z-Y, Xue H-D. Differentiating pheochromocytoma from lipid-poor adrenocortical adenoma by CT texture analysis: feasibility study. Abdominal Radiol (2017) 42(9):2305–13. doi: 10.1007/s00261-017-1118-3
20. Hodgdon T, McInnes MDF, Schieda N, Flood TA, Lamb L, Thornhill RE, et al. Can quantitative CT texture analysis be used to differentiate fat-poor renal angiomyolipoma from renal cell carcinoma on unenhanced CT images? Radiology (2015) 276(3):787–96. doi: 10.1148/radiol.2015142215
21. Becker A, Hickmann D, Hansen J, Meyer C, Rink M, Schmid M, et al. Critical analysis of a simplified Fuhrman grading scheme for prediction of cancer specific mortality in patients with clear cell renal cell carcinoma — Impact on prognosis. Eur J Surg Oncol (EJSO) (2016) 42(3):419–25. doi: 10.1016/j.ejso.2015.09.023
22. Klein S, Staring M, Murphy K, Viergever M, Pluim J. elastix: A toolbox for intensity-based medical image registration. IEEE Trans Med Imaging (2009) 29(1):196–205. doi: 10.1109/TMI.2009.2035616
23. Zwanenburg A, Vallières M, Abdalah MA, Aerts HJWL, Andrearczyk V, Apte A, et al. Image biomarker standardisation initiative. Radiother Oncol (2018) 127):S543–4. doi: 10.1016/S0167-8140(18)31291-X
24. Lin F, Cui EM, Lei Y, Luo LP. CT-based machine learning model to predict the Fuhrman nuclear grade of clear cell renal cell carcinoma. Abdominal Radiol (2019) 44(7):2528–34. doi: 10.1007/s00261-019-01992-7
25. Yu H, Scalera J, Khalid M, Touret A-S, Bloch N, Li B, et al. Texture analysis as a radiomic marker for differentiating renal tumors. Abdominal Radiol (New York) (2017) 42(10):2470–8. doi: 10.1007/s00261-017-1144-1
26. Lai S, Sun L, Wu J, Wei R, Luo S, Ding W, et al. Multiphase contrast-enhanced CT-based machine learning models to predict the fuhrman nuclear grade of clear cell renal cell carcinoma. Cancer Manag Res (2021) 13:999–1008. doi: 10.2147/CMAR.S290327
27. Cohan RH, Sherman LS, Korobkin M, Bass JC, Francis IR. Renal masses: assessment of corticomedullary-phase and nephrographic-phase CT scans. Radiology (1995) 196(2):445–51. doi: 10.1148/radiology.196.2.7617859
28. Chen M, Yin F, Yu Y, Zhang H, Wen G. CT-based multi-phase Radiomic models for differentiating clear cell renal cell carcinoma. Cancer Imaging (2021) 21(1):42. doi: 10.1186/s40644-021-00412-8
29. Zhu YH, Wang X, Zhang J, Chen YH, Kong W, Huang YR. Low enhancement on multiphase contrast-enhanced CT images: an independent predictor of the presence of high tumor grade of clear cell renal cell carcinoma. Am J Roentgenol (2014) 203(3):295–30. doi: 10.2214/AJR.13.12297
30. Nguyen K, Schieda N, James N, McInnes MDF, Wu M, Thornhill RE. Effect of phase of enhancement on texture analysis in renal masses evaluated with non-contrast-enhanced, corticomedullary, and nephrographic phase–enhanced CT images. Eur Radiol (2021) 31(3):1676–86. doi: 10.1007/s00330-020-07233-6
31. Gillies RJ, Kinahan PE, Hricak H. Radiomics: images are more than pictures, they are data. Radiology (2016) 278(2):563–77. doi: 10.1148/radiol.2015151169
32. Parmar C, Grossmann P, Bussink J, Lambin P, Aerts HJWL. Machine learning methods for quantitative radiomic biomarkers. Sci Rep (2015) 5:13087. doi: 10.1038/srep13087
33. Novakovic J, Veljovic A. (2011). C-Support Vector Classification: Selection of kernel and parameters in medical diagnosis, in: 2011 IEEE 9th International Symposium on Intelligent Systems and Informatics. (Subotica, Serbia: IEEE).
34. Zheng Y, Zhou D, Liu H, Wen M. CT-based radiomics analysis of different machine learning models for differentiating benign and Malignant parotid tumors. Eur Radiol (2022) 32(10):6953–64. doi: 10.1007/s00330-022-08830-3
35. Chen X, Wang H, Huang K, Liu H, Ding H, Zhang L, et al. CT-based radiomics signature with machine learning predicts MYCN amplification in pediatric abdominal neuroblastoma. Front Oncol (2021) 11:687884. doi: 10.3389/fonc.2021.687884
36. Zhang Y, Ko C-C, Chen J-H, Chang K-T, Chen T-Y, Lim S-W, et al. Radiomics approach for prediction of recurrence in non-functioning pituitary macroadenomas. Front Oncol (2020) 10. doi: 10.3389/fonc.2020.590083
37. Kocak B, Durmaz ES, Ates E, Kaya OK, Kilickesmez O. Unenhanced CT texture analysis of clear cell renal cell carcinomas: A machine learning–based study for predicting histopathologic nuclear grade. Am J Roentgenol (2019) 212(6):W132–9. doi: 10.2214/AJR.18.20742
38. Zhou Z, Qian X, Hu J, Ma X, Zhou S, Dai Y, et al. CT-based peritumoral radiomics signatures for Malignancy grading of clear cell renal cell carcinoma. Abdominal Radiol (2021) 46(6):2690–8. doi: 10.1007/s00261-020-02890-z
39. Demirjian NL, Varghese BA, Cen SY, Hwang DH, Aron M, Siddiqui I, et al. CT-based radiomics stratification of tumor grade and TNM stage of clear cell renal cell carcinoma. Eur Radiol (2022) 32(4):2552–63. doi: 10.1007/s00330-021-08344-4
40. Oh S, Sung DJ, Yang KS, Sim KC, Han NY, Park BJ, et al. Correlation of CT imaging features and tumor size with Fuhrman grade of clear cell renal cell carcinoma. Acta Radiologica (2016) 58(3):376–84. doi: 10.1177/0284185116649795
41. Hussain MA, Hamarneh G, Garbi R. Learnable image histograms-based deep radiomics for renal cell carcinoma grading and staging. Comput Med Imaging Graph (2021) 90:101924. doi: 10.1016/j.compmedimag.2021.101924
42. Muthukrishnan R, Rohini R. (2016). LASSO: A feature selection technique in predictive modeling for machine learning, in: 2016 IEEE International Conference on Advances in Computer Applications (ICACA). (Coimbatore, India: IEEE).
43. Nazari M, Shiri I, Hajianfar G, Oveisi N, Abdollahi H, Deevband MR, et al. Noninvasive Fuhrman grading of clear cell renal cell carcinoma using computed tomography radiomic features and machine learning. La radiologia Med (2020) 125:754–62. doi: 10.1007/s11547-020-01169-z
44. Feng Z, Shen Q, Li Y, Hu Z. CT texture analysis: a potential tool for predicting the Fuhrman grade of clear-cell renal carcinoma. Cancer Imaging (2019) 19(1):6. doi: 10.1186/s40644-019-0195-7
45. Reiner CS, Roessle M, Thiesler T, Eberli D, Klotz E, Frauenfelder T, et al. Computed tomography perfusion imaging of renal cell carcinoma: systematic comparison with histopathological angiogenic and prognostic markers. Invest Radiol (2013) 48(4):183–91. doi: 10.1097/RLI.0b013e31827c63a3
46. Yuan Q, Kapur P, Zhang Y, Xi Y, Carvo I, Signoretti S, et al. Intratumor heterogeneity of perfusion and diffusion in clear-cell renal cell carcinoma: correlation with tumor cellularity. Clin Genitourin Cancer (2016) 14(6):e585–94. doi: 10.1016/j.clgc.2016.04.007
47. Wang J, Min P, Wang P, Cheng W, Zhang X, Wang Y, et al. Dynamic CT evaluation of tumor vascularity in renal cell carcinoma. Am J Roentgenol (2006) 186(5):1423–30. doi: 10.2214/AJR.04.1408
48. Shinagare AB, Krajewski KM, Braschi-Amirfarzan M, Ramaiya NH. Advanced renal cell carcinoma: role of the radiologist in the era of precision medicine. Radiology (2017) 284(2):333–51. doi: 10.1148/radiol.2017160343
49. Kopp RP, Aganovic L, Palazzi KL, Cassidy FH, Sakamoto K, Derweesh IH. Differentiation of clear from non-clear cell renal cell carcinoma using CT washout formula. Can J Urol (2013) 20(3):6790–7.
50. Sureka B, Lal A, Khandelwal N, Joshi K, Singh SK, Agarwal MM, et al. Dynamic computed tomography and Doppler findings in different subtypes of renal cell carcinoma with their histopathological correlation. J Cancer Res Ther (2014) 10(3):552–7. doi: 10.4103/0973-1482.137924
51. Deng Y, Soule E, Samuel A, Shah S, Cui E, Asare-Sawiri M, et al. CT texture analysis in the differentiation of major renal cell carcinoma subtypes and correlation with Fuhrman grade. Eur Radiol (2019) 29(12):6922–9. doi: 10.1007/s00330-019-06260-2
52. Shu J, Wen D, Xi Y, Xia Y, Cai Z, Xu W, et al. Clear cell renal cell carcinoma: Machine learning-based computed tomography radiomics analysis for the prediction of WHO/ISUP grade. Eur J Radiol (2019) 121:108738. doi: 10.1016/j.ejrad.2019.108738
53. Dagher J, Delahunt B, Rioux-Leclercq N, Egevad L, Srigley JR, Coughlin G, et al. Clear cell renal cell carcinoma: validation of World Health Organization/International Society of Urological Pathology grading. Histopathology (2017) 71(6):918–25. doi: 10.1111/his.13311
54. Zhou H, Mao H, Dong D, Fang M, Gu D, Liu X, et al. Development and external validation of radiomics approach for nuclear grading in clear cell renal cell carcinoma. Ann Surg Oncol (2020) 27(10):4057–65. doi: 10.1245/s10434-020-08255-6
55. Zhou Y, Wu D, Yan S, Xie Y, Zhang S, Lv W, et al. Feasibility of a clinical-radiomics model to predict the outcomes of acute ischemic stroke. Korean J Radiol (2022) 23(8):811–20. doi: 10.3348/kjr.2022.0160
Keywords: clear cell renal cell carcinoma, radiomics, Fuhrman grading, multi-phase feature, texture
Citation: Zhou Z, Qian X, Hu J, Geng C, Zhang Y, Dou X, Che T, Zhu J and Dai Y (2023) Multi-phase-combined CECT radiomics models for Fuhrman grade prediction of clear cell renal cell carcinoma. Front. Oncol. 13:1167328. doi: 10.3389/fonc.2023.1167328
Received: 16 February 2023; Accepted: 24 July 2023;
Published: 23 August 2023.
Edited by:
Lorenzo Placidi, Agostino Gemelli University Polyclinic (IRCCS), ItalyReviewed by:
Ankush Jajodia, Juravinski Hospital, CanadaCopyright © 2023 Zhou, Qian, Hu, Geng, Zhang, Dou, Che, Zhu and Dai. This is an open-access article distributed under the terms of the Creative Commons Attribution License (CC BY). The use, distribution or reproduction in other forums is permitted, provided the original author(s) and the copyright owner(s) are credited and that the original publication in this journal is cited, in accordance with accepted academic practice. No use, distribution or reproduction is permitted which does not comply with these terms.
*Correspondence: Jianbing Zhu, emVubzE4MzlAMTI2LmNvbQ==; Yakang Dai, ZGFpeWtAc2liZXQuYWMuY24=
†These authors share first authorship
Disclaimer: All claims expressed in this article are solely those of the authors and do not necessarily represent those of their affiliated organizations, or those of the publisher, the editors and the reviewers. Any product that may be evaluated in this article or claim that may be made by its manufacturer is not guaranteed or endorsed by the publisher.
Research integrity at Frontiers
Learn more about the work of our research integrity team to safeguard the quality of each article we publish.