
94% of researchers rate our articles as excellent or good
Learn more about the work of our research integrity team to safeguard the quality of each article we publish.
Find out more
ORIGINAL RESEARCH article
Front. Oncol., 05 June 2023
Sec. Gynecological Oncology
Volume 13 - 2023 | https://doi.org/10.3389/fonc.2023.1152991
This article is part of the Research TopicMolecular Predictive Pathology in Gynecologic MalignanciesView all 15 articles
 Razaul Haque1,2†‡
 Jaebon Lee3†‡
 Joon-Yong Chung4‡Ha-Yeon Shin5‡Hyosun Kim5‡Jae-Hoon Kim5‡
 Jae Won Yun6*‡
 Eun-Suk Kang1,2,7*‡
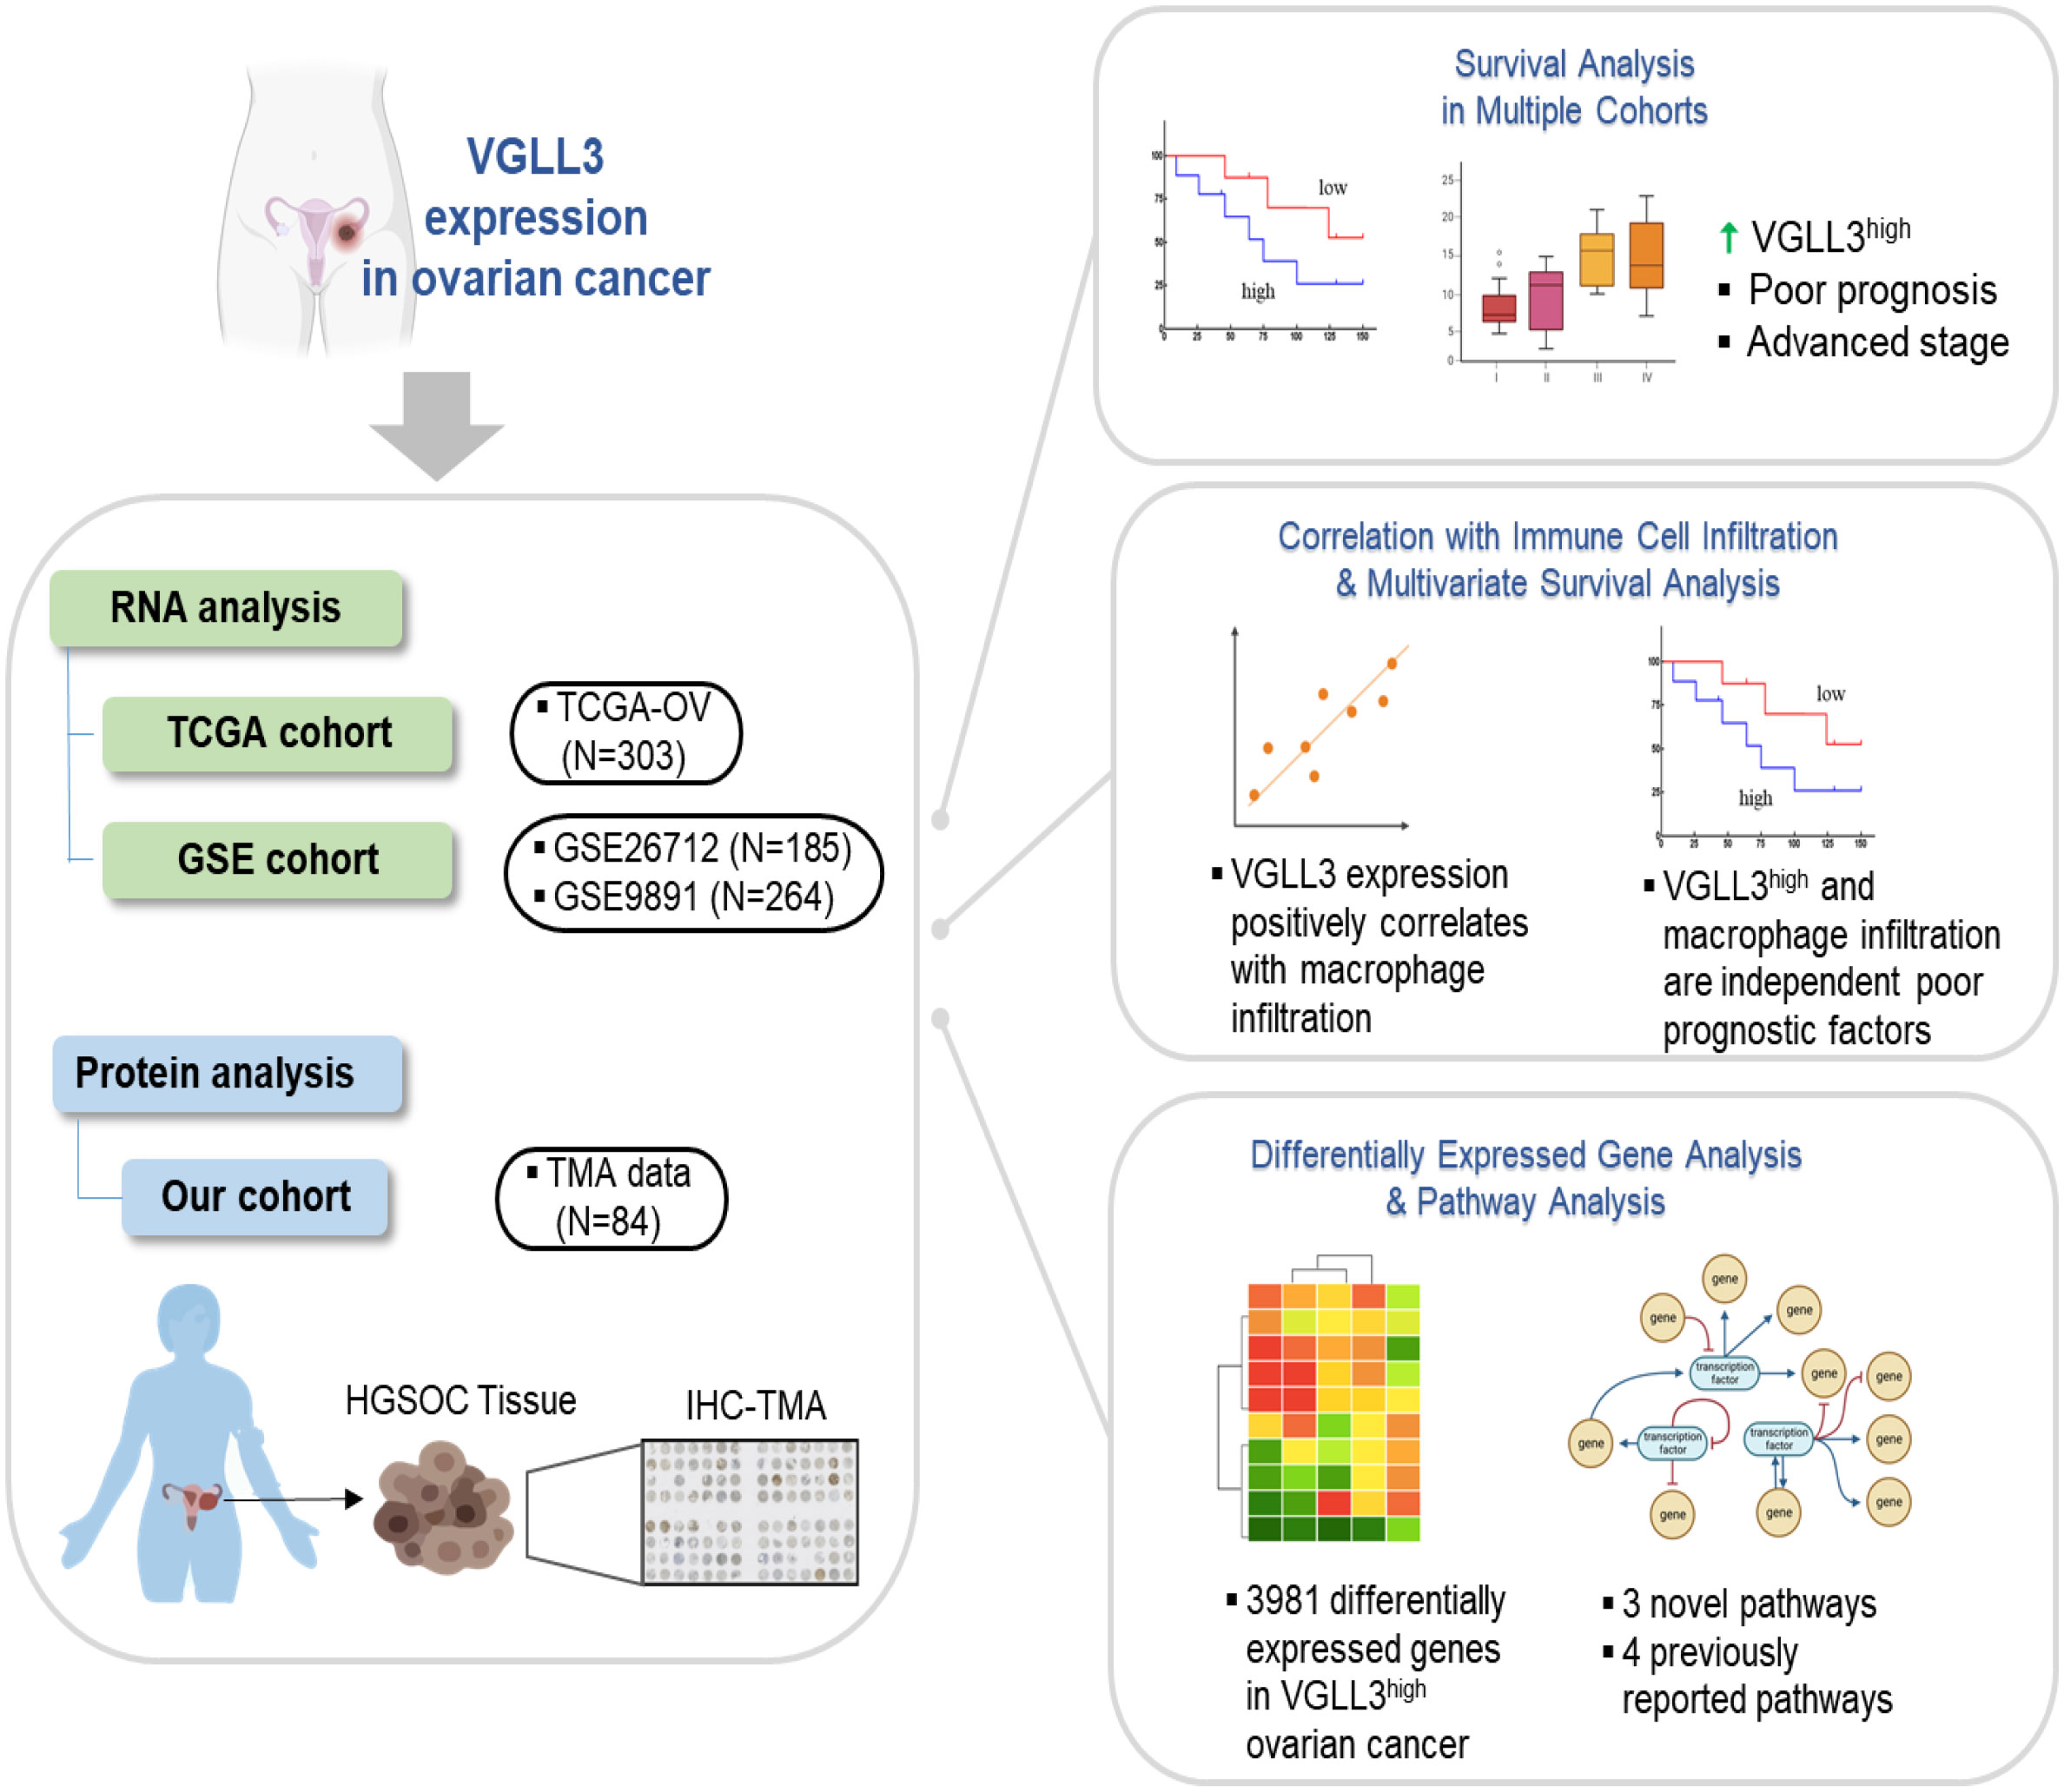
Background/objective: High-grade serous ovarian carcinoma (HGSOC) is the most common histologic type of epithelial ovarian cancer (EOC). Due to its poor survival outcomes, it is essential to identify novel biomarkers and therapeutic targets. The hippo pathway is crucial in various cancers, including gynaecological cancers. Herein, we examined the expression of the key genes of the hippo pathway and their relationship with clinicopathological significance, immune cells infiltration and the prognosis of HGSOC.
Methods: The Cancer Genome Atlas (TCGA) and Gene Expression Omnibus (GEO) data were curated to analyse the mRNA expression as well as the clinicopathological association and correlation with immune cell infiltration in HGSOC. The protein levels of significant genes in the HGSOC tissue were analysed using Tissue Microarray (TMA)-based immunohistochemistry. Finally, DEGs pathway analysis was performed to find the signalling pathways associated with VGLL3.
Results: VGLL3 mRNA expression was significantly correlated with both advanced tumor stage and poor overall survival (OS) (p=0.046 and p=0.003, respectively). The result of IHC analysis also supported the association of VGLL3 protein with poor OS. Further, VGLL3 expression was significantly associated with tumor infiltrating macrophages. VGLL3 expression and macrophages infiltration were both found to be independent prognostic factors (p=0.003 and p=0.024, respectively) for HGSOC. VGLL3 was associated with four known and three novel cancer-related signalling pathways, thus implying that VGLL3 is involved in the deregulation of many genes and pathways.
Conclusion: Our study revealed that VGLL3 may play a distinct role in clinical outcomes and immune cell infiltration in patients with HGSOC and that it could potentially be a prognostic marker of EOC.
Graphical Abstract
Epithelial ovarian cancer (EOC) is the most dominant form of ovarian cancer, which accounts for the highest rates of mortality and morbidity among the female sex (1). Despite the immense advancements in treatment strategy, the 5-year overall survival rate of EOC is still under 45% (2). Such poor prognosis may result from the complex and obscure pathogenesis of EOC, late diagnosis, a lack of predictive biomarkers, and ineffective target identification (3). Tumors in human ovary can be categorized into surface epithelial-stromal tumors, sex cord-stromal tumors, and germ cell tumors (4). Surface epithelial-stromal carcinoma can be further sub-grouped into serous (HGSOC and low-grade serous ovarian carcinoma), mucinous carcinoma, endometrioid carcinoma, clear cell carcinoma, and transitional cell carcinoma (or Brenner type (4). HGSOC considered as the most lethal EOC diagnosed at advanced stages, and results even higher percentage of mortality in ovarian cancer (5). However, characterization of HGSOC is very difficult, as they account for a very low number of mutations, and there is a scarcity of appropriate diagnosis markers. According to TCGA, the most common mutation found in Tp53 (96% cases), whereas mutations in other commonly mutated oncogenes such as KRAS, BRAF, NRAS, and PIK3CA are very rare in HGSOC (all less than 1%) (6, 7). Therefore, there is an urgent need to explore novel biomarkers to improve the diagnosis and early detection of HGSOC to improve treatment efficiency.
The hippo pathway is a critical regulator of morphogenesis, organ size determination, and tumorigenesis in many tissues, including the reproductive system (8, 9). Formation of the YAP/TAZ-TEADs complex serves as the key mechanism that stimulates the expression of target genes (e.g., connective tissue growth factor and cysteine-rich angiogenic inducer 61) that are essential for cell proliferation and survival (10). As a tumor suppressor pathway, dysregulation of the hippo pathway has been reported in various cancers (11). Yes-associated protein (YAP) and transcriptional coactivator with PDZ-binding motif (TAZ) plays an oncogenic role in EOC tumorigenesis by increasing cell proliferation and apoptotic resistance, reducing contact inhibition, and improving motility and anchorage-independent growth (12, 13). However, their clinicopathological outcomes in EOC are still debated.
Hippo pathway not only regulated by its core (YAP/TAZ) components, but also other regulatory and signalling molecules. Vestigial-like 3 (VGLL3) is a member of the VGLL family that also serves as a cofactor for transcriptional enhanced associate domains (TEADs) and participate in hippo signalling (14). TEAD1-4 recruits VGLL3 competitively to YAP/TAZ for their transcriptional activity (15). Despite the physiologic function is unknown, VGLL3 has recently been reported to be associated with the inhibition of adipocyte differentiation and the regulation of trigeminal nerve formation and cranial neural crest migration (16, 17). Now a day’s multiple pieces of evidence suggest that VGLL3 is associated with different cancers (18–21). VGLL3 has previously been reported to play a tumor suppressive role in EOC by Gambaro et al. in 2013 (22). Since then, there have been no further reports elucidating the role of VGLL3 in EOC. Moreover, Gambaro et al. derived the hypothesis from a chromosome transfer experiment wherein the transfer of a chromosome fragment containing VGLL3 gene suppressed tumor phenotypes in the ovarian tumor cell line OV90 (23, 24). However, VGLL3 as a single-gene transfer did not generate stable VGLL3 expression and was unable to suppress the proliferation of OV90 cells (22). Therefore, it is essential to re-evaluate the role of VGLL3 in EOC.
There is increasing evidence suggesting that immune cell infiltration plays a crucial role in the prognosis of various tumors and affects OS. Infiltration of different immune cells, such as T cells, macrophages, mast cells, and natural killer cells, is known to be associated with either favourable or unfavourable prognosis (25). Zhang et al. recently showed that VGLL3 serves as a novel unfavourable prognostic biomarker in stomach adenocarcinoma and correlates with immune evasion, particularly due to infiltration of macrophages and dendritic cells (21). However, the role of VGLL3 in the immune microenvironment of EOC remains to be elucidated
In this study, we performed a comprehensive analysis using public databases and web tools, as well as tissue microarray (TMA) to investigate the significance of key genes in hippo pathways, including VGLL3, VGLL4, TEAD3, TEAD4, YAP, and TAZ, on the clinicopathological characteristics and immune cell infiltration features of HGSOC. We also investigated the role of VGLL3 as a prognostic factor of HGSOC and its association with cancer-related signal transduction pathways.
The information on the mRNA expression and the clinical data of ovarian cancer were acquired from the Cancer Genome Atlas (TCGA) repository, Genome Data Analysis Centre (GDAC) (https://gdac.broadinstitute.org/), and the University of California Santa Cruz browser (https://xenabrowser.net/datapages/). For further analysis, 303 samples that had clinical and mRNA information available were selected (Table 1). The expression of genes was compared between normal ovarian (n=88) and tumor (n=426) tissues based on the GEPIA2 database (26) (http://gepia2.cancer-pku.cn/#index). For the validation of gene expression in HGSOC, we acquired data from the gene expression omnibus (GEO) in the form of GSE26712 (10 normal ovarian vs. 185 tumor tissue) and GSE9891 (264 HGSOC tissue samples).
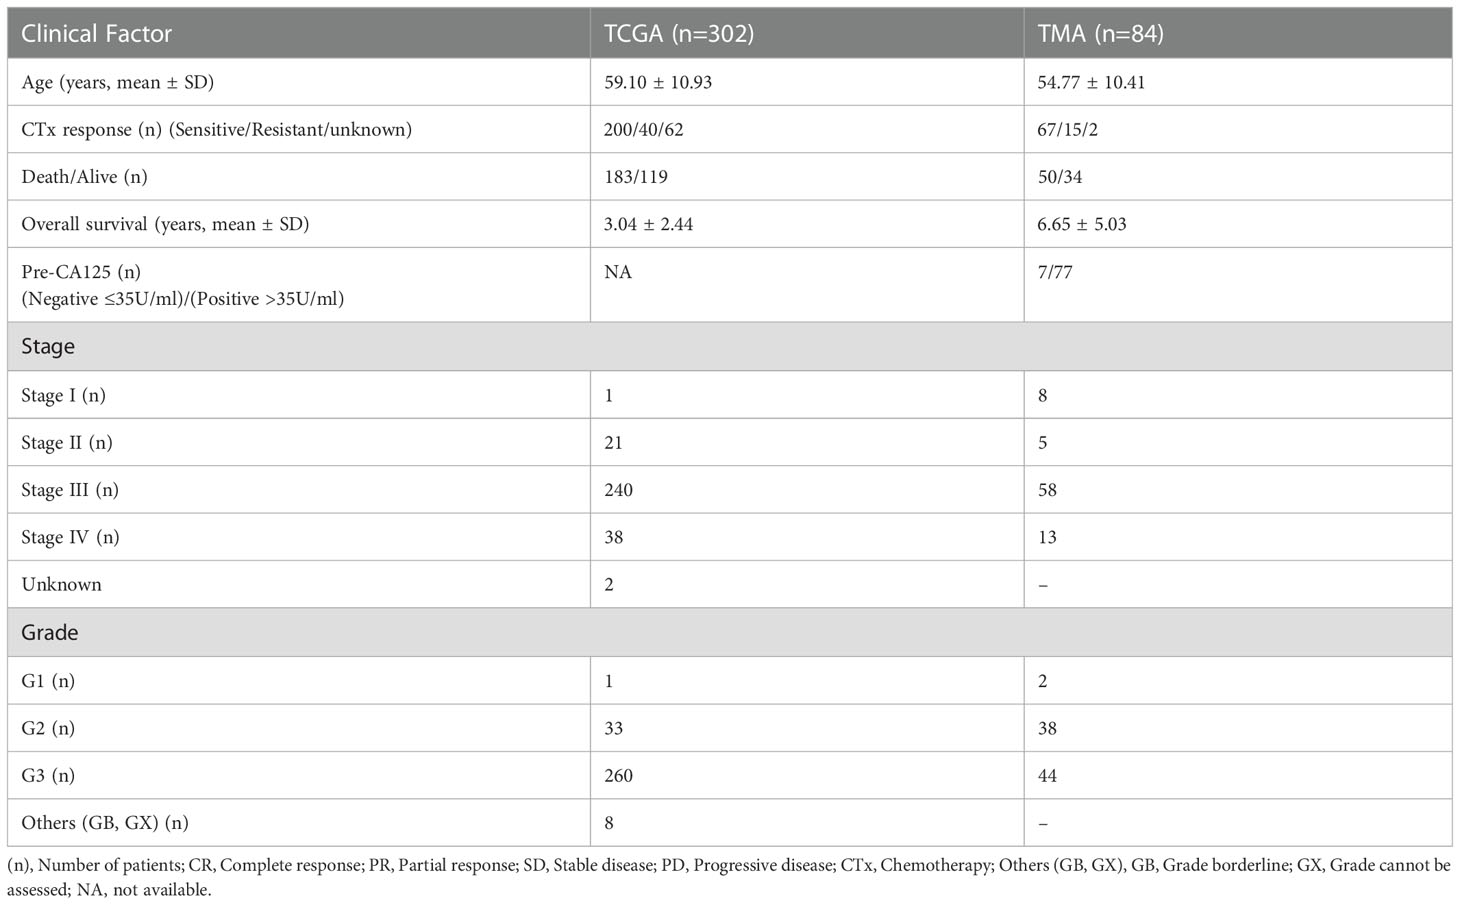
Table 1 Clinicopathological features of high-grade serous ovarian carcinoma patients from The Cancer Genome Atlas and TMA datasets.
Four ovarian cancer cell lines, namely SKOV3, OVCAR3, OVCA429, OVCA433 and five primary EOC cell lines including YDOV-13 (originated from a malignant Brenner tumor), YDOV-139, YDOV-157, YDOV-161(originated from serous cystadenocarcinomas) and YDOV-151 (originated from a mucinous cystadenocarcinoma) were used in this study (27–30). The primary cell lines were established in Jae-Hoon Kim’s lab and all cell lines were kindly provided by Jae-Hoon Kim (Gangnam Severance Hospital, Yonsei University). SKOV3 and OVCAR3 cell lines were maintained in RPMI-1640 media supplemented with 10% FBS and 1% with penicillin/streptomycin. The other cell lines were maintained in DMEM media containing 10% FBS and 1% penicillin/streptomycin. All the cell lines were cultured at 37°C in 5% CO2.
At 70-80% of confluence, cells were washed with PBS, after which total RNA was extracted using TRIzol reagent (Ambion, Carlsbad, USA) according to the manufacturer’s protocol. Total RNA (1 μg) from each sample was reverse-transcribed into cDNA using the Maxima First Strand cDNA Synthesis Kit (Thermo Scientific, Waltham, MA) according to the manufacturer’s protocol. Real-time quantitative polymerase chain reaction (RT-qPCR) was performed to quantify mRNA expression using SYBR Green PCR Master Mix (Enzynomics, Daejeon, Republic of Korea) and the QuantStudio 6 Flex real-time PCR system (Applied Biosystems, Foster City, CA). Relative mRNA expression was quantified using the comparative Ct (ΔCt) method and expressed as 2-ΔΔCt. The following primers were used for PCR: VGLL3: Forward 5’- CCAACTACAGTCACCTCTGCTAC-3’ and Reverse 5’- ACCACGGTGATTCCTTACTCTTG-3’, GPADH: Forward 5’- ATGGAAATCCCATCACCATCTT-3’ and Reverse 5’- CGCCCCACTTGATTTTGG-3’.
Total cell lysates were isolated using cell lysis buffer (RIPA buffer: Cell Signaling Technology #9806, Danvers, MA) containing protease inhibitor cocktail (Roche, Nutley, NJ). Protein concentrations were determined by BCA assay (Sigma-Aldrich, St. Louis, MO). Proteins were separated by SDS-PAGE and transferred from gels to 0.2 μm nitrocellulose membranes (Pall Corporation, Washington, NY). The nitrocellulose membrane was further incubated overnight at 4°C with rabbit anti-VGLL3 (1:1000, Novus Biologicals, NB100-56875, Centennial, USA) and rabbit anti-GAPDH (1:2000, Novus Biologicals, 4650S, Centennial, USA). After that membranes were incubated with HRP-conjugated anti-Rabbit IgG (1:1000, Cell Signaling Technology, 7074S, Danvers, MA) secondary antibody for 1 hour at RT, protein bands were visualised using western blotting luminol reagent (Santa Cruz Biotechology, Inc., Dallas, Texas).
The unstained slides from 84 HGSOC and 66 adjacent normal ovarian epithelial TMA blocks and their corresponding sets of clinical information were obtained from the Korea Gynaecologic Cancer Bank (KGCB) of Gangnam Severance Hospital, Yonsei University College of Medicine (No. HTB-P2021-5), funded by the Korean Government Ministry of Science and ICT (MSIT) (NRF-2017M3A9B8069610). All the patients were treated with first line chemotherapy. Tissue samples and medical records were obtained with the approval of the Institutional Review Board of Gangnam Severance Hospital (IRB#, HTB-P2021-5), Seoul, Republic of Korea. All procedures were conducted in accordance with the guidelines of the Declaration of Helsinki. Tumor staging was performed according to the classification established by the International Federation of Gynaecology and Obstetrics (FIGO). For all study participants, CA125 levels were measured at primary diagnosis up to 1 week preoperatively using Elecsys CA125 II ECLIA (Roche Diagnostics, Rotkreuz, Switzerland). The demographics and clinical characteristics of the individuals that participated in this study are listed in Table 1.
The estimated abundance of tumor-infiltrating immune cells (TIICs) was calculated using immunedeconv in R, which was downloaded from the Tumor Immune Estimation Resource (TIMER) 2.0 website (http://timer.cistrome.org/) (31). To elaborate, TIICs were inferred using three different tools, including EPIC (http://epic.gfellerlab.org/), TIMER (https://cistrome.shinyapps.io/timer/), and CIBERSORT (https://cibersort.stanford.edu). These three computational algorithms use deconvolution-based approaches that model gene expressions as the weighted sum of the expression profiles of the admixed cell types (32–34). The outlier of TIICs was eliminated using Tukey’s method. Then, a correlation analysis between the abundance of TIICs and gene expressions was conducted using Pearson’s method. A p-value < 0.05 and a correlation co-efficient R ≥ 0.30 were considered to represent a significant correlation.
VGLL3 protein expressions were analysed by immunohistochemical guided TMA, which was described before (35). Briefly, deparaffinised and rehydrated sections were retrieved via microwave for 10 min in a pH 6.0 citrate buffer. Endogenous peroxidase was then inactivated using peroxidase blocking solution (Agilent, S2023, Dako, Glostrup, Denmark) for 20 minutes. Next, the tissue samples were incubated with the anti-VGLL3 primary antibody (1:200, Novus Biologicals, NBP2-31590, Centennial, USA) for 2 h at 25°C. The secondary antibody was applied for 1 h at 25°C, after which detection was performed using DAB Substrate-Chromogen solution (Agilent, K5007, Dako, Glostrup, Denmark). Lastly, the sections were counterstained using haematoxylin and mounted.
Stained TMA slides were digitized using the NanoZomer XR digital pathology (NDP) system (Hamamatsu, Hamamatsu City, Japan) at ×40 objective magnification with a single-focus layer. Digitized images were automatically analysed using Visiopharm software version 6.9.1 (Visiopharm, Hørsholm, Denmark). Regarding the expression value of VGLL3 nuclear staining, a brown nuclear staining intensity (0=negative, 1=weak, 2=moderate, and 3=strong) and a respective percentage were obtained. For VGLL3 cytoplasmic assessment, a brown cytoplasmic intensity (weak and strong) was obtained, and each proportion was analysed. Histoscores were calculated by multiplying the percentage of positive cells by their staining intensity.
VGLL3 mRNA raw read counts downloaded from GDAC were used to identify the association with differentially expressed genes (DEGs) using the DESeq2 package in R, and the cut-off value of FDR (offered as adjusted p-value) was 0.001 (p-value < 2.04e-4) (36). Using the identified DEGs correlated with VGLL3, pathway analysis was performed using ConsensusPathDB (http://cpdb.molgen.mpg.de/) (37). Next, among the identified pathways (p value < 0.01, q value < 0.2), cancer-related pathways were selected through a literature review and manual curation. We also conducted a heatmap analysis using complex heatmap package in R to identify the significant genes that were associated with selected pathways and high VGLL3 expression.
Data were statistically analysed using R software version 4.0.2. (R 4.0.2, Auckland, New Zealand). All data values are expressed as mean ± standard error of the mean (S.E.M). To compare gene expression among groups with different clinical and pathological features, the DESeq2 package, Mann-Whitney test, and Kruskal-Wallis test were used. For survival analysis, Kaplan-Meier plot and log-rank test were conducted using the survival and survminer packages in R (38). To identify the independent prognostic factor, Cox regression analyses were performed and visualised using the forest plot package in R (39). p-values <0.05 were considered to be statistically significant.
HGSOC tumors samples from 302 TCGA and 84 TMA datasets were analysed according to stage and grade. TMA data was further analysed based on age, pre-CA125 level, and chemosensitivity after initial treatment. CA125 levels of >35 IU/mL (n=77) were considered to be positive, while levels of ≤35 IU/mL (n=7) were considered to be negative.
First, we analysed the expression levels of six key genes in the hippo pathway (YAP1, TAZ, TEAD3, TEAD4, VGLL3, and VGLL4) in HGSOC. We found that the expressions of VGLL4, TEAD3, TEAD4, and YAP1 were all increased in HGSOC. By contrast, the expressions of VGLL3 and TAZ were low in HGSOC (Figure 1A). The result was comparable to those obtained from the GSE9891 cohort (Supplementary Figure S1A). Interestingly, VGLL3 expression was the lowest among all the genes in both the TCGA (p=<2e-16) and GSE9891 cohorts (p=<2e-16) (Figure 1A and Supplementary Figure S1A). When tumors were compared to normal ovarian samples, we found that VGLL3 was significantly lower in tumor samples than it was in normal ovarian samples in both the TCGA and GSE26712 cohorts (p<0.05 and p=2.4e-07, respectively) (Supplementary Figures S1B, C). Whereas, TEAD4 was significantly higher in tumor samples compared to normal ovarian samples in both the TCGA and GSE26712 cohorts (p<0.05 p=5.8e-07) (Supplementary Figures S1B, C). There were no significant differences observed regarding the expressions of YAP1 and VGLL4 between tumor and normal ovaries in either cohort. However, the expression of TAZ and TEAD3 were discrepant between different datasets. Expression of TAZ in HGSOC was significantly lower in TCGA cohort (p<0.05), but higher in the GSE26712 cohort (p=2e-06) compared to normal ovary (Supplementary Figures S1B, C). No significant difference was observed in TEAD3 expression between HGSOC vs. normal ovary in the TCGA cohort although it significantly increased in the GSE26712 cohort p=2.6e-05.
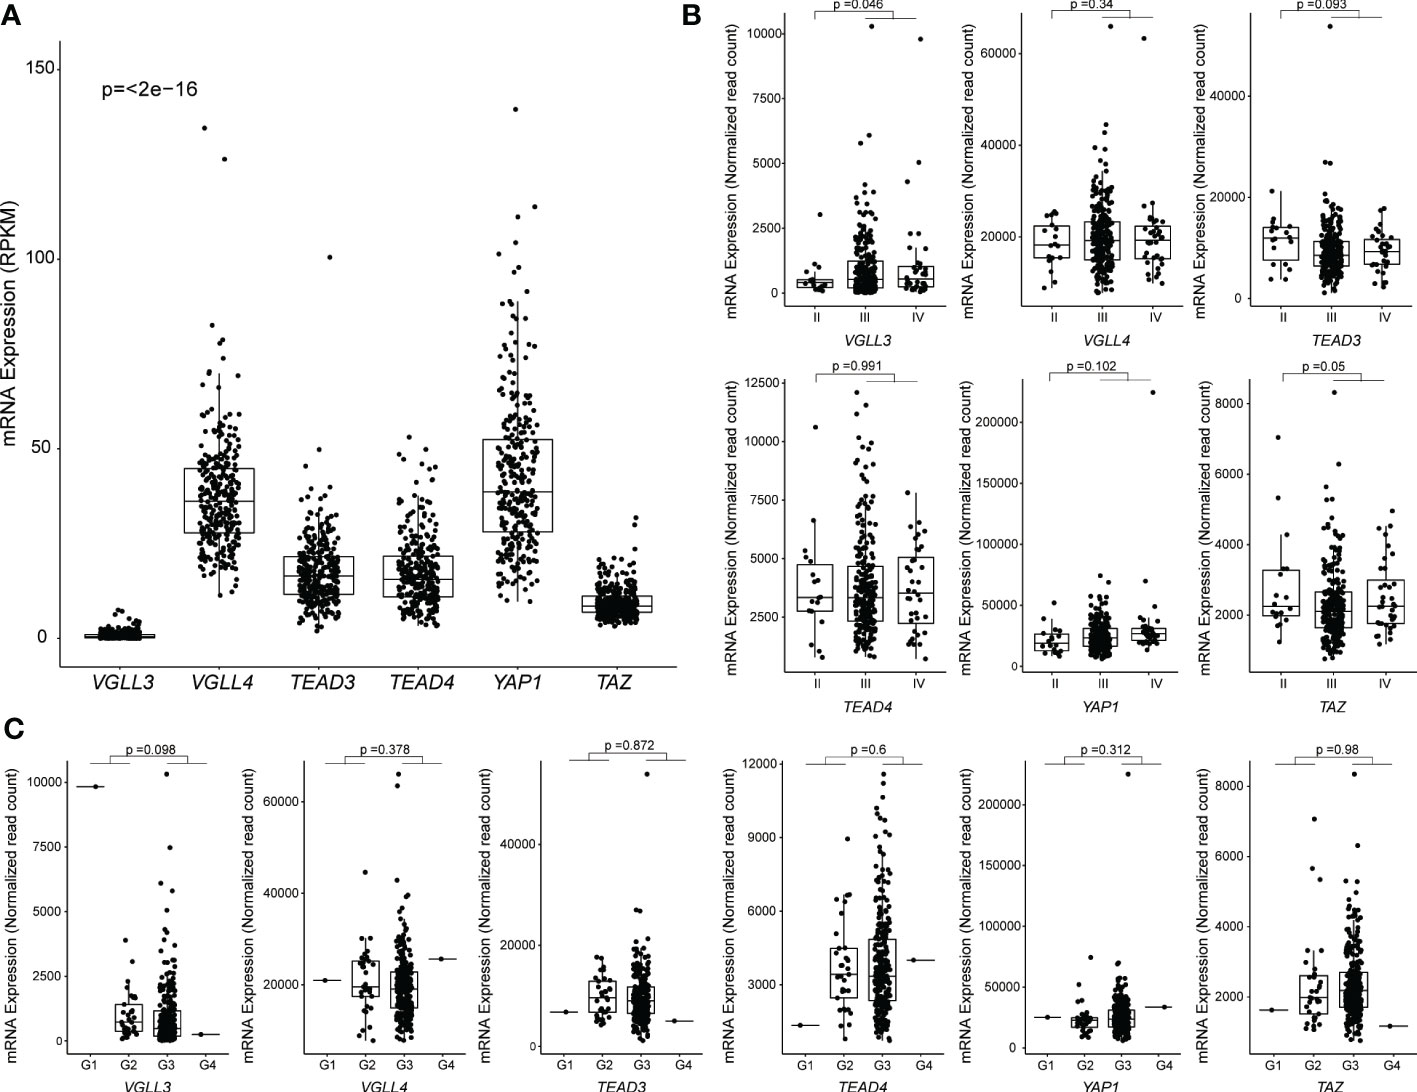
Figure 1 Correlation between mRNA expression and clinicopathological features in The Cancer Genome Atlas (TCGA) ovarian cancer data. Samples without RPKM and Raw read counts data were omitted. (A) Levels of mRNA expression among six genes. RPKM data from 296 samples were used, and the p-values were calculated using the Kruskal-Wallis test. (B) Levels of mRNA expression among different stages of HGSOC: Stage I (n = 0), Stage II (n = 18), Stage III (n = 239), Stage IV (n = 36). The p-value was calculated using the DESeq2 package. (C) Levels of mRNA expression among different grades of HGSOC: G1 (n = 1), G2 (n = 33), G3 (n = 254), G4 (n = 1). The p-value was calculated using the DESeq2 package. Each point represents an individual sample.
Finally, we checked the expression of VGLL3 both in mRNA and protein level in different OC cell lines. We observed different cell lines express different level of VGLL3 mRNA and protein (data not shown). Interestingly, we noticed that there was discrepancy of VGLL3 expression between mRNA and protein level in same cell line. The discrepancy was more prominent in SKOV3, YDOV13, and YDOV139 cell line (data not shown) and less prominent in OVCAR3 cell line, whereas, there was no observable discrepancy found in OVCA429, OVCA433, YDOV151, YDOV157 and YDOV161 cell lines in terms of VGLL3 expression at the mRNA and protein level.
Next, we explored the correlation of the above six hippo-related genes with the progression of HGSOC. VGLL3 expression was found to be significantly increased in the advanced stages (stage III+IV) of HGSOC tumors (p=0.046) compared to in the early stage II (Figure 1B). However, VGLL4, TEAD3, TEAD4, YAP, and TAZ did not show any significant difference between stage II vs. stage III+IV in HGSOC (Figure 1B). When we checked the expressions of those six genes in different grades, we didn’t observe significant differences in any genes between (G1+G2) vs. (G3+G4). However, for VGLL3 expression, there was a decreasing trend observed in (G3+G4) relative to (G1+G2) (p=0.098) (Figure 1C).
Next, we checked the correlations of those six genes with the OS of patients with HGSOC. The mRNA expression of each gene was categorised into high and low groups (Supplementary Figure S2). The data showed that only VGLL3 had a significant association with OS (p=0.003) (Figure 2), which was consistent in both the GSE26712 and GSE9891 (p=0.048, p=0.012, respectively) cohorts (Supplementary Figure S2B, C right panel). VGLL3high correlated with the lower OS in HGSOC, while VGLL3low was associated with better OS. However, the other five genes did not show any significant correlation with OS (Figure 2). Taken together, these findings suggest that the role of VGLL3 mRNA is distinctive in HGSOC compared to the other five genes, which correlated with the characteristics of advanced tumor stages of HGSOC and poor survival outcomes.
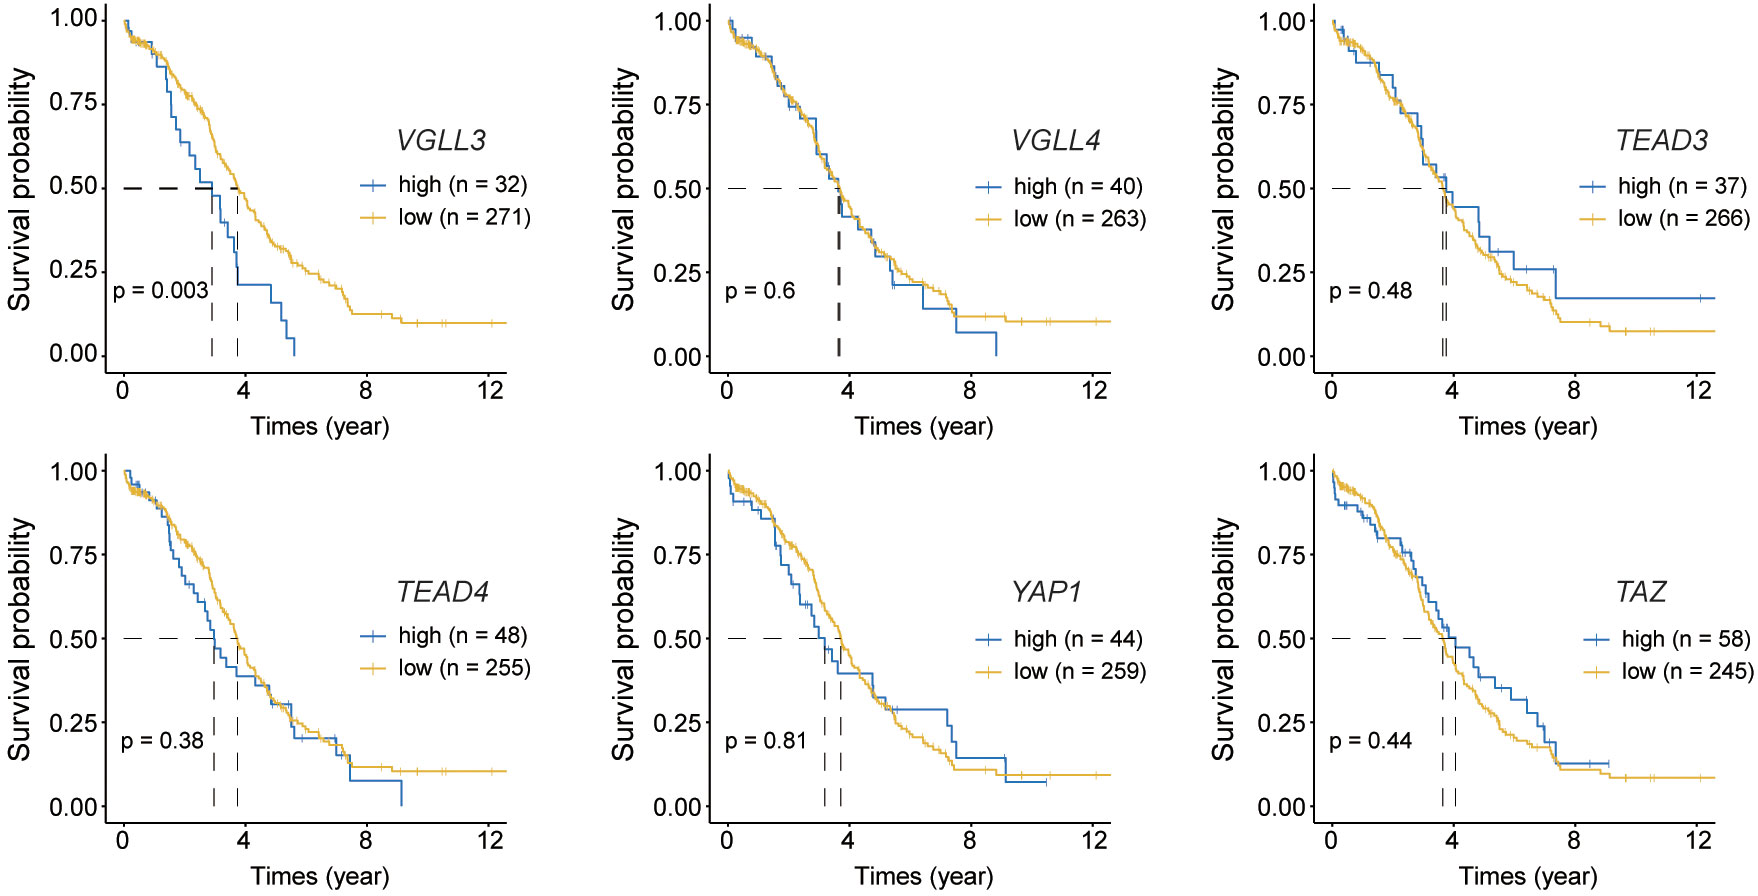
Figure 2 Kaplan–Meier curves for overall survival of six target genes. Normalised read counts data for 302 The Cancer Genome Atlas (TCGA) ovarian cancer samples were analysed for overall survival while comparing the high and low expression of each gene; Top: from left to right VGLL3 (p=0.003), VGLL4 (p=0.6), TEAD3 (p=0.48); Bottom: from left to right TEAD4 (p=0.38), YAP1 (p=0.81), TAZ (p=0.44). High and low expression of each gene was selected based on the visual distinction described in Supplementary Figure S2. Statistical significance was evaluated using the log-rank test.
Then, we checked the correlation of six genes with immune cell infiltration and found that VGLL3 was positively correlated with infiltration of macrophage, CD4+ T cell, and CD8+ T cell in HGSOC, while it was negatively correlated with B cells (Figures 3A–C). Interestingly, the correlation of VGLL3 with macrophage infiltration was strongest among all other TIICs in HGSOC. This finding was consistently revealed in all three computational tools (EPIC, R=0.38; p=1.8e-11, TIMER, R=0.44; p=2.7e-15, and CIBERSORT, R=0.44; p=7.2e-16). However, we could not find any significant correlation between the other five genes and HGSOC TIICs (Supplementary Figure S3). Then, we checked the correlation of VGLL3 with two different subtypes of macrophage (M1 and M2 macrophage). We noted that, while there was no significant correlation found between VGLL3 with M1 macrophage (Supplementary Figure S4A), VGLL3 was found to be significantly correlated with M2 macrophage infiltration R=0.44; p=5.7e-16 (Supplementary Figure S4B), thus suggesting that the association of VGLL3 with macrophage mainly comes from M2 macrophage.
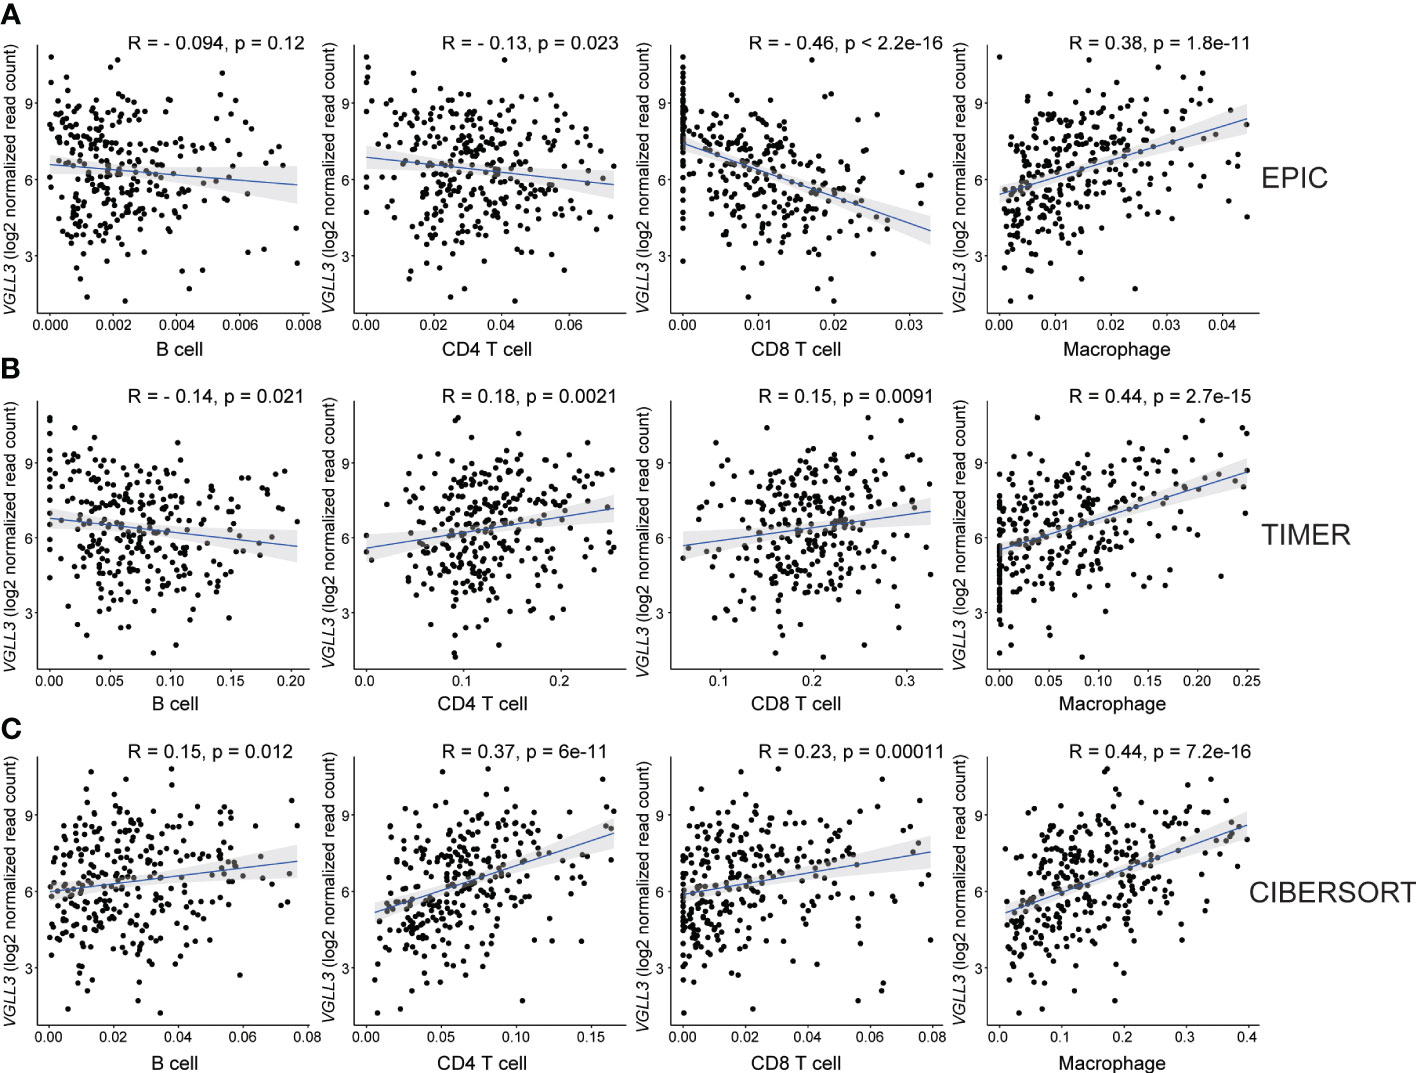
Figure 3 Correlation between VGLL3 mRNA expression and immune cell infiltration. The levels of immune cell infiltrations were estimated using three databases: (A) EPIC, (B) TIMER, and (C) CIBERSORT abs mode. The three methods show that macrophage and VGLL3 reached a consensus on a significantly positive correlation. The X-axis is the estimated values of three algorithms that represent immune cell fractions and the Y-axis represents the VGLL3 mRNA expression. For CIBERSORT, cell fractions for each immune cell were considered as a summation of their subsets. After eliminating outliers of immune cell fractions using Tukey’s method, Pearson’s method was performed to determine the correlation between VGLL3 gene and the immune cells (from left to right: B cell, CD4+ T cell, CD8+ T cell and macrophage), and the correlation coefficient was shown as R. For 303 The Cancer Genome Atlas (TCGA) ovarian cancer samples, the normalised read counts from TCGA Genome Data Analysis Center (GDAC) database and the immune cell infiltration levels from TIMER 2.0 website were downloaded and used to draw plots. A p <0.05 and R ≥ 0.3 was considered as statistically significant.
Next, we investigated the association of macrophage infiltration with OS in HGSOC. Similar to VGLL3, high levels of macrophages were significantly correlated with poor overall survival (p=0.0057), whereas low levels of macrophage expression correlated with better OS (Figure 4A). Multivariate analysis further confirmed that VGLL3 and macrophages were independent prognostic factors for HGSOC (p=0.003 and p=0.024, respectively) (Figure 4B and Supplementary Figure S5), thus suggesting that VGLL3 serves as an independent unfavourable prognostic marker in HGSOC, possibly in association with macrophage infiltration.
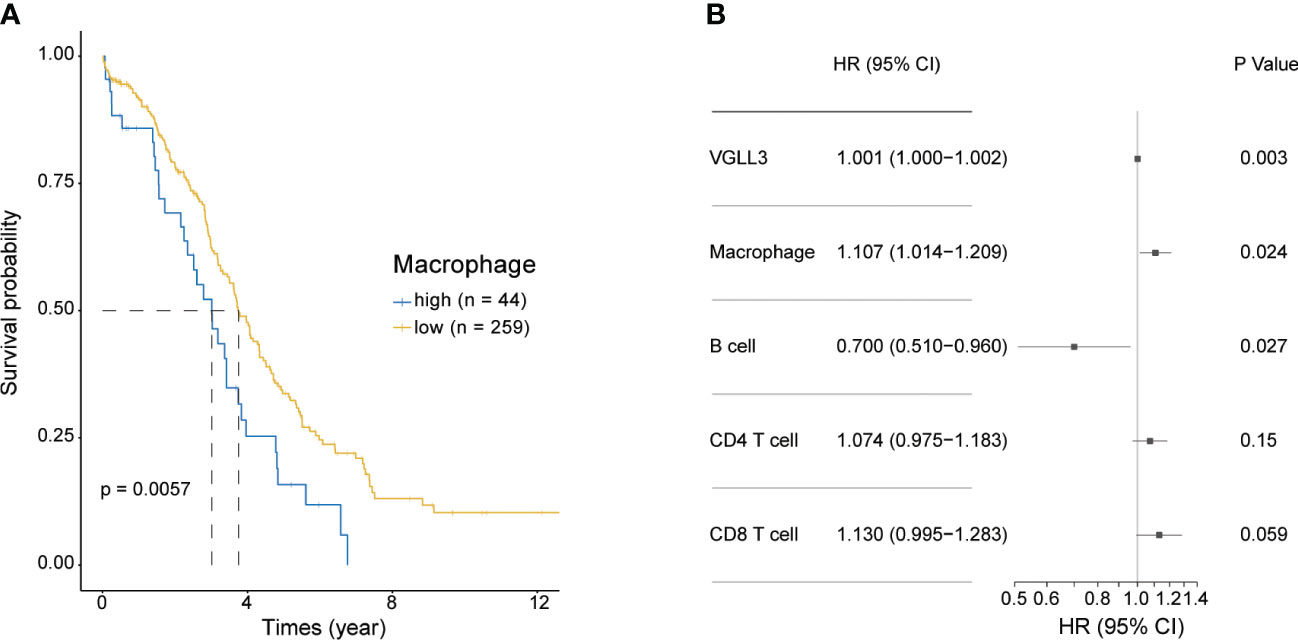
Figure 4 VGLL3 and macrophages are unfavourable prognostic markers. Normalised read counts and infiltrated immune cell fractions estimated using EPIC for 303 HGSOC tissue samples were utilised. (A) Kaplan–Meier survival curves of OS comparing high (n=44) and low (n=259) macrophage infiltration in HGSOC, p=0.0057. (B) Forest plot visualizing the hazard ratio with a 95% confidence interval and p-value was calculated using multivariate Cox regression analysis. The levels of infiltrated immune cells estimated using EPIC were multiplied by 100 to transform them into percentile values. All variables were considered to be continuous variables.
Next, to investigate the significance of VGLL3 protein expression in HGSOC, immunohistochemistry-guided TMA score was analyzed at both nuclear and cytoplasmic level in our HGSOC cohort. Interestingly, VGLL3 protein expressions at both nuclear and cytoplasmic levels were significantly higher (p<0.001) in HGSOC tissues than it was in the normal adjacent tissues (Table 2 and Figures 5A, B). Then, we investigated the correlation of VGLL3 protein expression at both nuclear and cytoplasmic levels with different clinicopathological features of HGSOC (Table 3). There was no significant difference found regarding the expression of VGLL3 protein depending on age, FIGO stage, tumor grade, Pre-CA125 level, and chemo-sensitivity (Table 3).
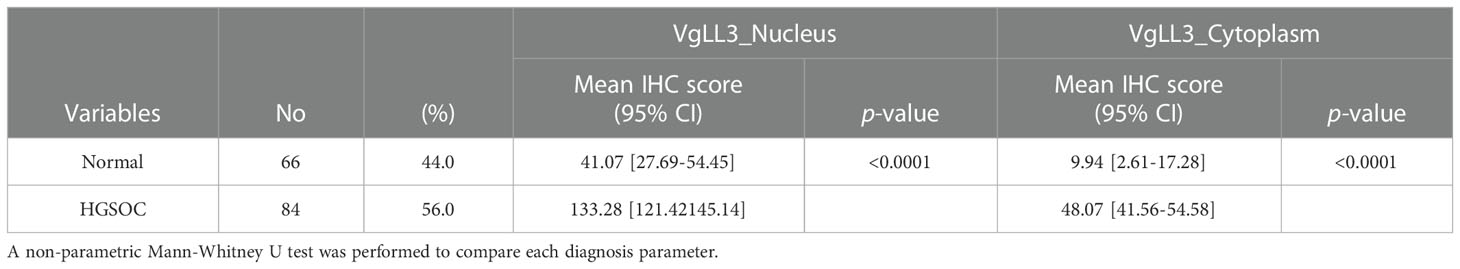
Table 2 Comparison of VGLL3 protein expression in high-grade serous ovarian carcinoma and normal adjacent tissues.
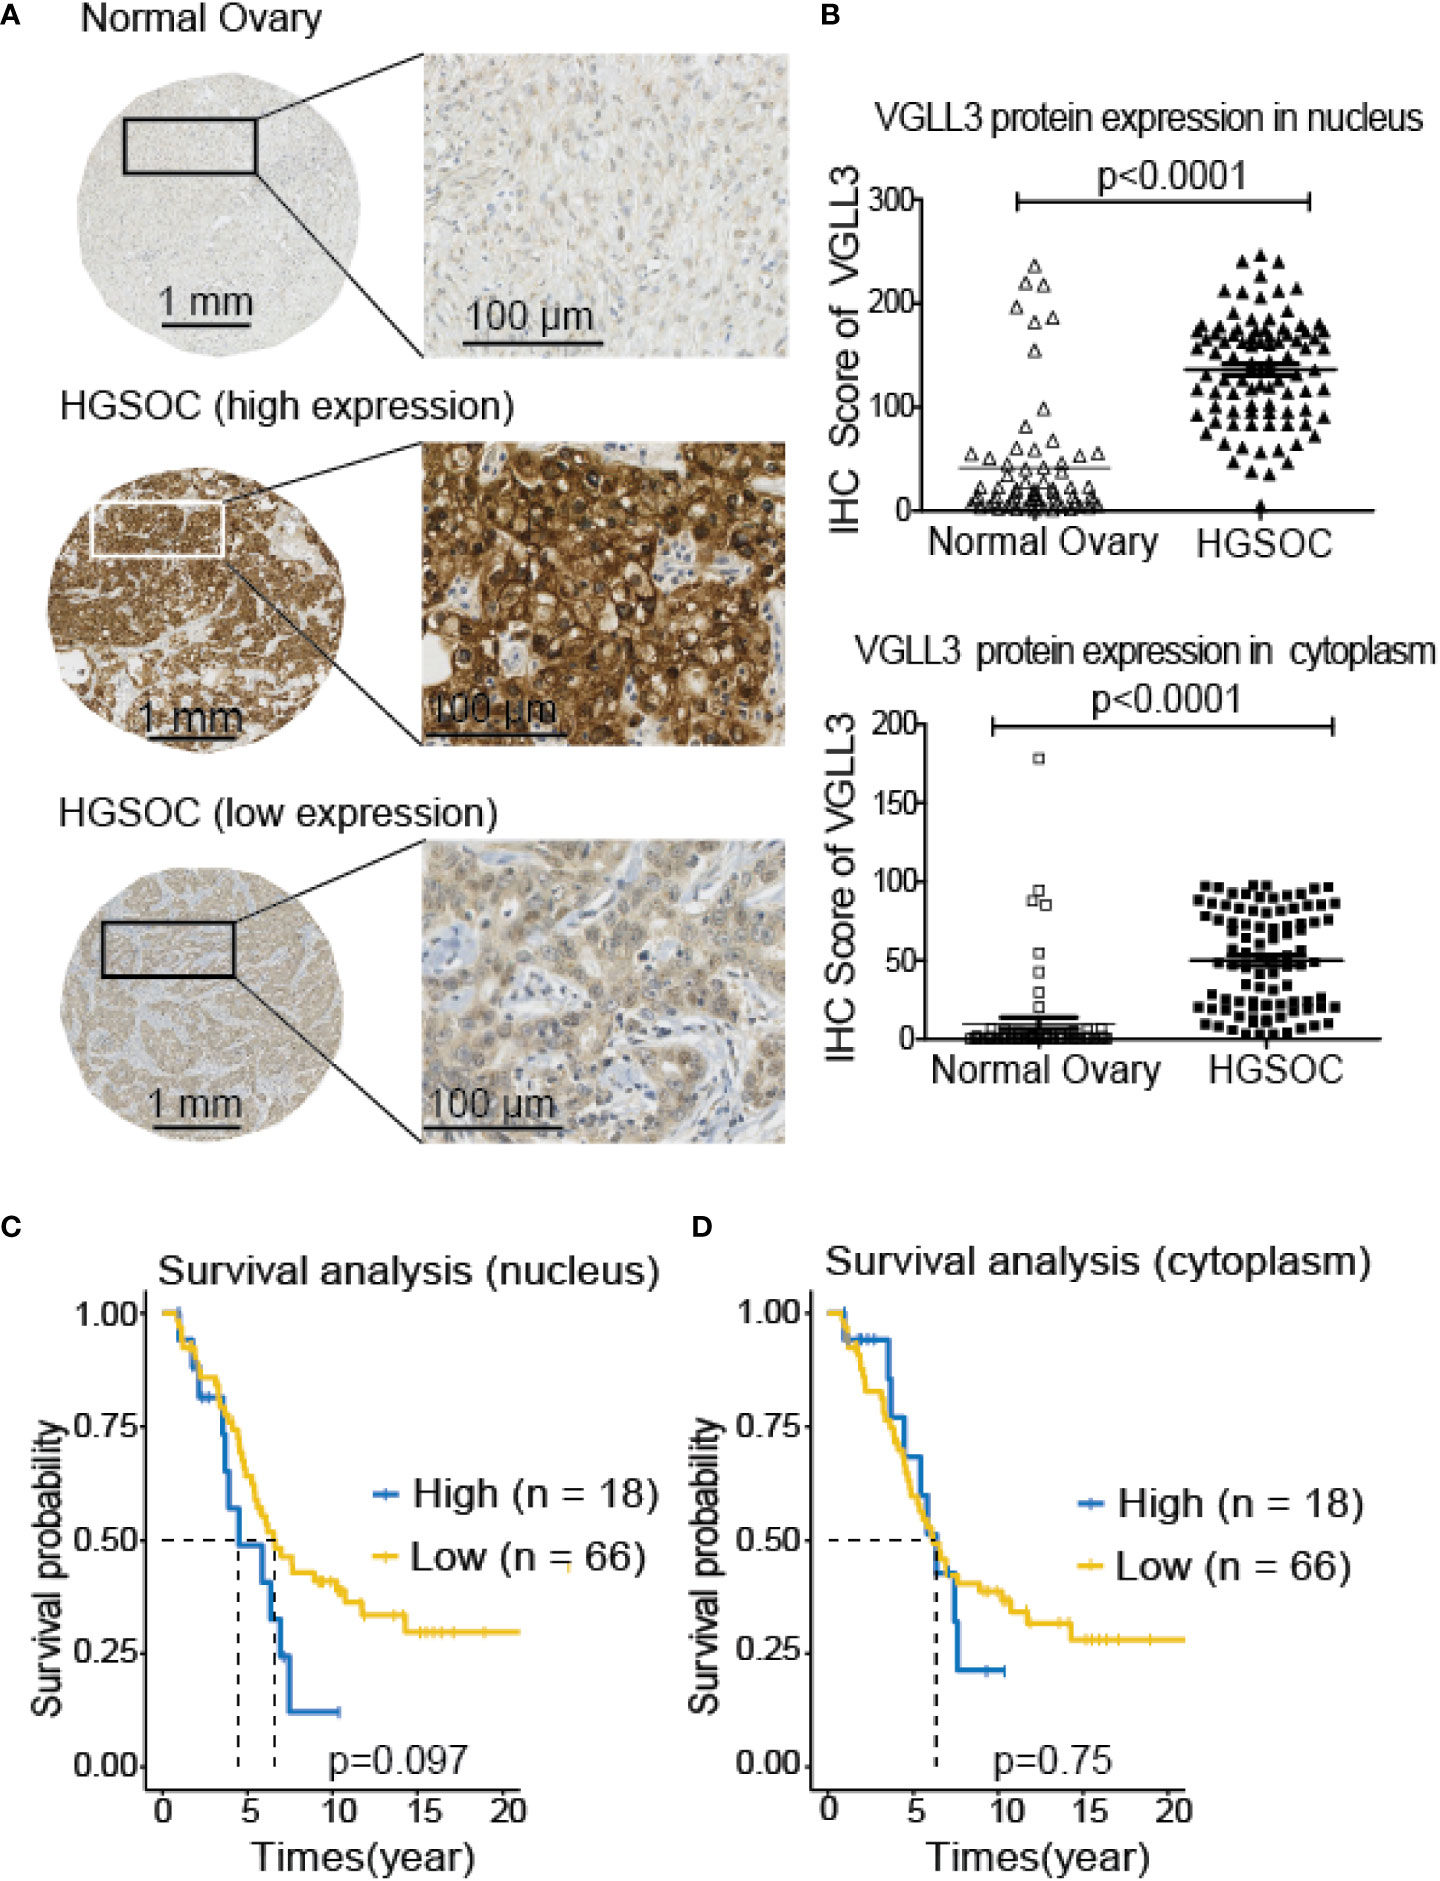
Figure 5 Expression of VGLL3 protein in normal ovary and HGSOC tissues and survival analysis depending on the expression levels of VGLL3 on nucleus and cytoplasm of cells. The unstained TMA blocks from 84 HGSOC and 66 adjacent normal ovarian tissues were immunohistochemically stained with anti-VGLL3 antibody, (A) Representative image of VGLL3 expression between HGSOC and adjacent normal ovary tissues. (B) IHC scores of VGLL3 in both nucleus and cytoplasm were calculated and compared between HGSOC and adjacent normal ovary, p <0.0001. (C, D) Kaplan–Meier survival curves of OS comparing high (n=18) and low (n=66) expression of VGLL3 protein in HGSOC are shown both in nucleus (p=0.097) and cytoplasm (p=0.75). Each point represents an individual sample.
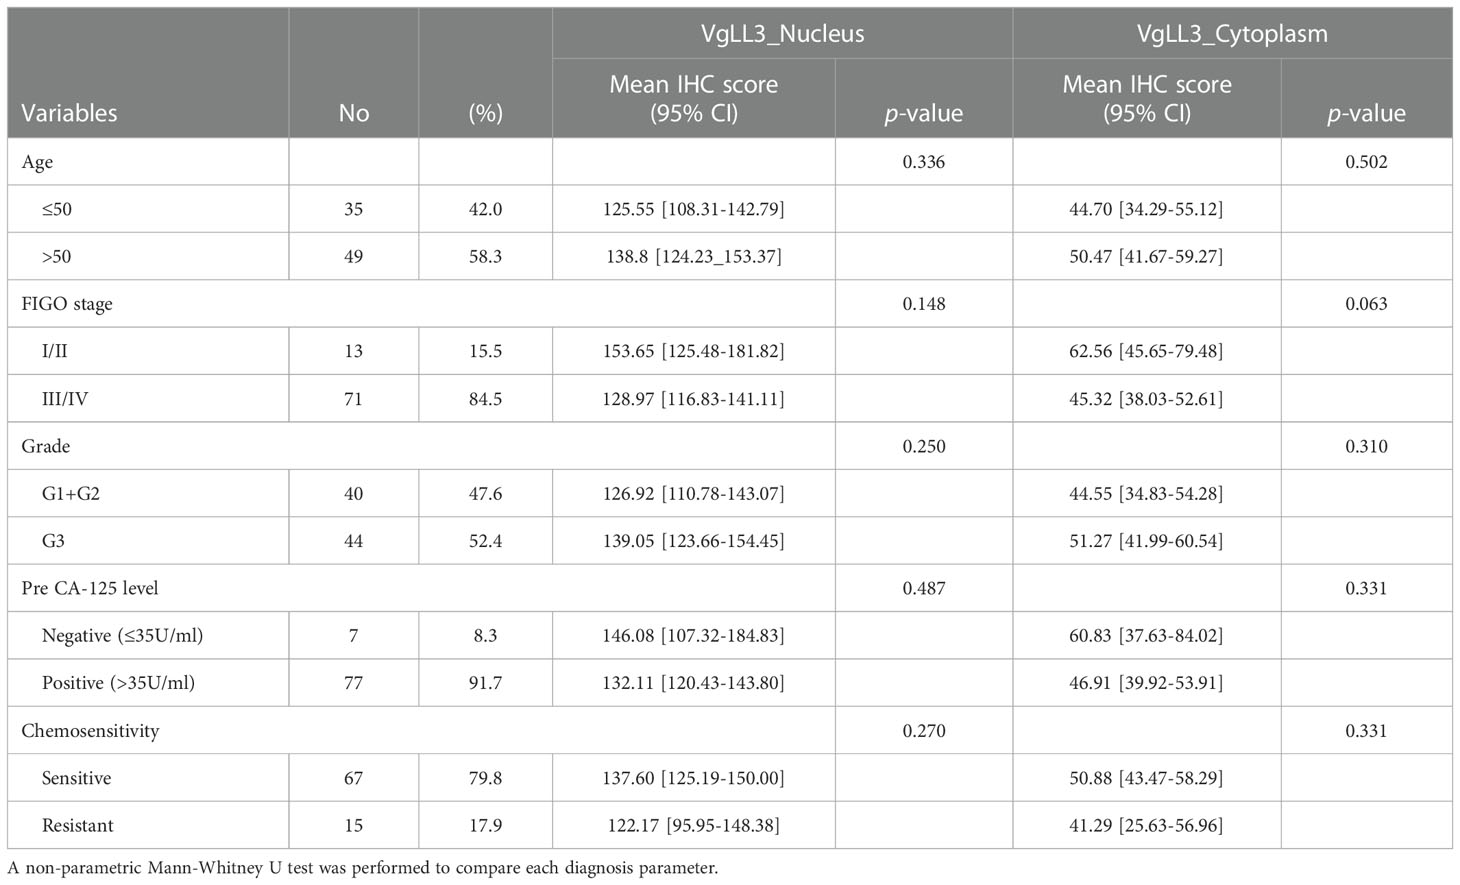
Table 3 VGLL3 protein expression in high-grade serous ovarian carcinoma according to the clinicopathological characteristics.
To evaluate the prognostic role of VGLL3 protein in HGSOC, we applied Kaplan–Meier survival analysis by determining the VGLL3high and VGLL3low groups in a manner similar to that of the mRNA data. We found that high expressions of VGLL3 protein at nuclear levels was correlated with lower OS in patients with HGSOC, although it was not statistically significant (Figures 5C, D).
We investigated VGLL3-related pathways in cancer to explore the potential mechanism in HGSOC. The DEG analysis showed that around 3,981 genes were significantly associated with VGLL3 expression. Pathway analysis using 3,981 DEGs revealed that the gene sets associated with VGLL3 mRNA expression showed enhancements in extracellular matrix organization, focal adhesion, PI3K-Akt signalling pathway, and JAK-STAT signalling pathway (Figure 6A). The association of VGLL3 with those pathways has been previously been reported in different cancers (21). Interestingly, along with previously reported pathways, we identified three novel pathways that were associated with VGLL3: Nonsense-Mediated Decay pathways (NMD), vascular endothelial growth factors A-vascular endothelial growth factor receptor 2 (VEGFA-VEGFR2) signalling pathway, and platelet-derived growth factor (PDGF) signalling pathway (Figure 6B). The heatmap of DEGs revealed a strong correlation with high vs. low VGLL3 mRNA expressions (Supplementary Figure S6).
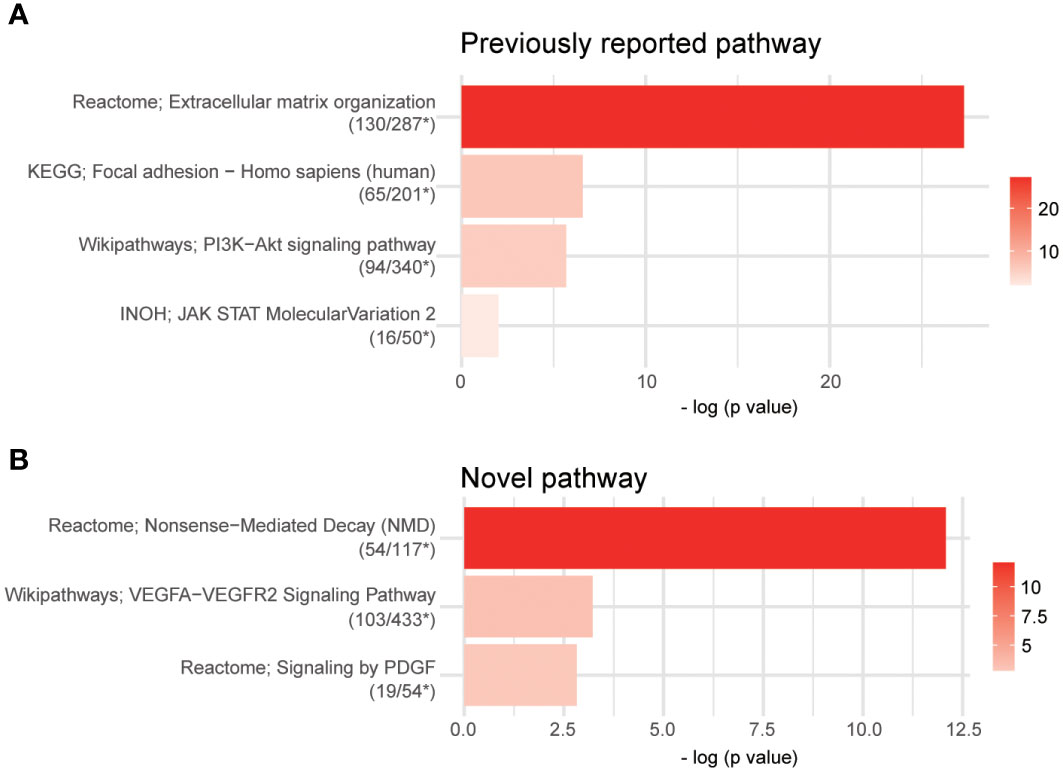
Figure 6 Pathway analysis using over-representation analysis from ConsensusPathDB (CPDB). Overall, 3,981 differentially expressed genes (DEGs) were identified after false discovery rate control (adjust p-value < 0.001, p-value < 2.04e-4). The cutoff p-value and q-value were 0.01 and 0.2 in overrepresentation analysis, respectively. (A) Four previously reported pathways and (B) three novel pathways were captured. Raw read counts for 296 samples from The Cancer Genome Atlas (TCGA) Genome Data Analysis Center (GDAC) database were used for DEGs analysis; *, The number of DEGs overlapped in the pathway/The total number of genes of the pathway.
In recent years, the role played by VGLL3 in cancers has attracted increasing research attention because of its dynamic behaviour in different cancers (18–22). In this study, we found that VGLL3 was an independent unfavourable prognostic factor of HGSOC, likely by affecting immune cells infiltration, particularly macrophages, and regulating or deregulating a significant number of oncogenic genes and pathways. The results suggest that VGLL3 is an important factor for HGSOC that correlates with tumor progression and immune evasion.
The malignancy of EOC largely depends on the constitutive activation/deactivation of different oncogenes, tumor suppressor genes, and transcription factors (40, 41). The correlation of VGLL3 in cancer proliferation, advanced tumor stage, grade, and poor prognosis has previously been reported in other cancers except for ovarian cancer (20–22). In line with previous reports, we found that VGLL3 expression in both mRNA and protein level was also correlated with advanced tumor stage and poor prognosis in HGSOC, suggesting that VGLL3 may promote the progression of HGSOC. Importantly, we may suggest a distinctive role of VGLL3 that conflicts with the previous report by Gambaro et al. where VGLL3 induction showed a tumor-suppressive phenotype in EOC (22). Given the ambivalent nature of genes with both oncogenic and tumor suppressor features, such as SMAD3 (42, 43), the association of VGLL3 with a significant number of genes in the DEG analysis suggests that the role of VGLL3 is too complex to be defined in a simple way. Therefore, a separate study using other OC cell lines is needed to reveal the mechanism of VGLL3 in EOC more precisely.
In contrast to the reduced expression of VGLL3 mRNA in HGSOC, we found that VGLL3 protein expression was increased in HGSOC in comparison with adjacent normal ovarian tissue. A decent explanation for this discrepancy is currently unknown; one possible hypothesis might involve the effect of post-transcriptional modification. For example, mRNA regulatory elements and the affinity of RNA Binding Proteins (RBDs) increase RNA stability and translational efficiency of mRNA molecules, which leads to the aberrant expression of protein in tumor cells (44, 45). Therefore, we assume that post-transcriptional modifications, such as of VGLL3 mRNA regulatory element and RBD, are more active in HGSOC than in the normal, which may increase VGLL3 mRNA stability as well as protein translation, and thereby increase its overexpression in protein level. Alternatively, the post-translation modification of VGLL3 protein might also play a role in stabilizing the VGLL3 protein, preventing their degradation, and thus increasing VGLL3 protein in HGSOC tumors. There is a need for an in-depth study to explore the post-transcriptional regulation of VGLL3 and its effect on VGLL3 mRNA stability and protein expression. Despite the fact that there is a discrepancy in VGLL3 mRNA and protein expression between tumor and normal tissues, we interestingly observed that higher levels of both VGLL3 mRNA and protein expression among tumor tissues were associated with the worse OS in HGSOC.
Tumor-infiltrating lymphocytes and the immune status of the tumor microenvironment have been reported to affect progression, therapeutic effects, and recurrence in many cancers (46). Tumor-associated macrophages (TAMs), which mainly belong to the M2 macrophage phenotype, are known to correlate with poor outcomes in solid cancers and play important roles in tumorigenesis (47). A high density of CD163+ M2-macrophages is predominantly associated with poor prognosis in ovarian cancer and known to be involved in tumor invasion, angiogenesis, metastasis, and early recurrence (48, 49). Moreover, the high M1/M2 ratio of tumor infiltrating macrophages correlates with prolonged survival time in EOC, while low M1/M2 ratio correlates with poor OS (50, 51). In this study, we also observed the association of VGLL3 with macrophage infiltration in HGSOC, which likely contributed to the worsening of OS. Moreover, we found that M2 macrophage was more strongly correlated with VGLL3 than M1 macrophage, suggesting that VGLL3 may be involved in the poor prognosis of HGSOC by association with macrophages, particularly M2 macrophage.
In addition to known clinical and molecular biomarkers such as TP53, BRCA1/2, and MYC, VGLL3 regulates many key genes and pathways, and it is also related to clinical prognosis. High VGLL3 expression has been found to activate several signalling pathways, such as MAPK, JAK-STAT, PI3K/Akt/mTOR, ECM, focal adhesion, and WNT pathways in many tumors (20, 21). In this report, we also discovered those pathways in HGSOC that correlated with high VGLL3 expression. Further, we found three novel pathways (NMD, VEGFA-VEGFR2, PDGF) that were associated with high VGLL3, suggesting that VGLL3 may regulate key genes in those pathways. Frequent activation of ECM, PI3K/Akt/mTOR, and VEGFA-VEGFR2 signalling pathways has been associated with higher invasive and migratory capacities in subpopulations of human OC (52–54). On the other hand, TAMs have reported to correlate with many signalling pathways including PI3K/AKT/mTOR signalling pathway, ECM, and focal adhesion molecules that modulate the tumor microenvironment (55–57). In this study, we connected VGLL3 with macrophage infiltration and signalling pathways and demonstrated that VGLL3 may play a critical role in the poor prognosis of HGSOC. There is still a need for further research to show the direct interaction and functional interplay of VGLL3 with related molecules. It is important to identify new biomarkers to improve the management of ovarian cancer patients. In particular, focus should be given on non-invasive characterization of cancer to discover more efficient markers. Radiomics analysis using imaging techniques and implementations of new radiopharmaceuticals based on molecular features of tumor cells would be a good tool for non-invasive staging, prognosis and restaging of cancers. 2-[18F] FDG PET/CT is considered the most popular and useful imaging technique for relapse detection in ovarian cancer patients, offering prognostic value. Ongoing research is conducting to explore new biomarkers in ovarian cancer patients by analysing imaging biomarkers in combination with clinical, pathological, and analytical data (58, 59).
Obviously, the limitation of our study is that it used public mRNA data not derived from our own patients and lacked evidence from in vitro and in vivo research. Nonetheless, the public DBs including TCGA contain decent numbers of curated data, and the findings were highly correlated with our immunohistochemistry-guided TMA in HGSOC tissue samples. Therefore, VGLL3 has been strongly suggested to have significance and a potential role in both mRNA and protein levels, which represents the strength of this study. Currently, we are conducting research into investigating the molecular mechanism of VGLL3 in HGSOC as a continuation of this study.
This study demonstrated that VGLL3 has potential prognostic value in HGSOC because its overexpression was shown to be associated with advanced tumor stage and poor prognosis. Moreover, VGLL3 was associated with TAM infiltration, which is frequently observed in the immunosuppressive microenvironment of cancer. Finally, the DEGs pathways and co-expressing genes identified in this study suggest the prospective molecular function of VGLL3 in cancer.
The original contributions presented in the study are included in the article/Supplementary Material. Further inquiries can be directed to the corresponding authors.
The studies involving human participants were reviewed and approved by Institutional Review Board of Samsung Medical Center (IRB#, SMC 2021-06-23), Seoul, Republic of Korea, and Institutional Review Board of Gangnam Severance Hospital (IRB#, HTB-P2021-5), Seoul, Republic of Korea. The patients/participants provided their written informed consent to participate in this study.
Conception and design: RH, JY and E-SK. Curation of the data: RH, JL and JY. Analysis and interpretation of data: RH, JL, JY and E-SK. Collection of tissue sample and clinical information: H-YS, HK and J-HK. TMA guided immunohistochemistry perform and analysis: J-YC. Writing, review and revision of the manuscript: RH, JL, JY and E-SK. Supervision and fund acquisition: E-SK. All authors contributed to the article and approved the submitted version.
This study was supported by the National Research Foundation of Korea (NRF-2019R1A2C2088715 and 2022R1F1A1075238), which is funded by the Korean government (The Ministry of Science and ICT), South Korea.
The authors declare that the research was conducted in the absence of any commercial or financial relationships that could be construed as a potential conflict of interest.
All claims expressed in this article are solely those of the authors and do not necessarily represent those of their affiliated organizations, or those of the publisher, the editors and the reviewers. Any product that may be evaluated in this article, or claim that may be made by its manufacturer, is not guaranteed or endorsed by the publisher.
The Supplementary Material for this article can be found online at: https://www.frontiersin.org/articles/10.3389/fonc.2023.1152991/full#supplementary-material
Supplementary Figure 1 | mRNA expression levels of six target genes in HGSOC samples. (A) Expression of six target genes of 264 ovarian cancer tissues. p value was calculated using Kruskal-Wallis test. (B) Expression of six target genes analysed by GEPIA2 in ovarian cancer (n=426) specimen and compared to normal ovarian tissue (n=88). Red color means ovarian cancer tissues and blue color means normal ovarian tissues; *, p<0.05 (C) Expression of six target genes of 185 ovarian cancer tissues compared to those of 10 normal ovarian tissues. p value was calculated using Mann-Whitney U test.
Supplementary Figure 2 | Expression of six target genes and Kaplan-Meier plot. (A) The distribution of each gene expression among 303 samples of The Cancer Genome Atlas (TCGA) ovarian cancer. Dashed line represents the cut-off for high and low expression. (B) Left: Set the cut-off for high VGLL3 and low VGLL3 expression in GSE26712 dataset, Right: Kaplan–Meier survival curves of OS comparing high (n=37) and low (n=148) expression of VGLL3 in HGSOC, p=0.048. (C) Left: Set the cut-off for high VGLL3 and low VGLL3 expression in GSE9891 dataset, Right: Kaplan–Meier survival curves of OS comparing high (n=93) and low (n=171) expression of VGLL3 in HGSOC, p=0. 012. (D) Set the cut-off for high macrophage and low macrophage infiltrations in EPIC data. (E) Set the cut-off for high VGLL3 and low VGLL3 expression in TMA data.
Supplementary Figure 3 | Correlation between five target genes (VGLL4, TEAD3, TEAD4, YAP1, and TAZ) and the level of infiltrated immune cells using (A) EPIC, (B) TIMER, and (C) CIBERSORT abs mode. The X-axis is the estimated values of three algorithms that represent immune cell fractions and the Y-axis represents the VGLL3 mRNA. For CIBERSORT, cell fractions for each immune cell as a summation of their subsets were considered. After eliminating outliers using Tukey’s method, Pearson’s method was performed to find the correlation between VGLL3 genes and the immune cells (from left to right: B cell, CD4+ T cell, CD8+ T cell and macrophage), and the correlation coefficient was shown as R. A p<0.05 was considered as statistically significant.
Supplementary Figure 4 | Correlation of VGLL3 with the subsets of macrophages. After eliminating outliers of the level of infiltrated immune cells using Tukey’s method, Pearson’s method was performed to find the correlation between VGLL3 gene and (A) M1 macrophage and (B) M2 macrophage. Correlation coefficient was shown as R. A p<0.05 and R≥ 0.30 was considered as statistically significant.
Supplementary Figure 5 | Forest plot visualizing hazard ratios with 95% confidence interval and p-values calculated using multivariate Cox regression analysis. Levels of infiltrated immune cells were estimated using TIMER. All variables were considered continuous variables.
Supplementary Figure 6 | Heatmap of DEGs between the VGLL3high and VGLL3low group. For the heatmap, the z score normalised value from the results of DESeq2 were used. The genes presented in the heatmap were selected genes that overlapped with the cancer gene list provided by Bushman laboratory (See Methods). Previously reported pathways had 128 overlapped genes in total, and novel pathways had 55 overlapped genes in total. * previously reported pathways; ** newly found pathways in this study.
HGSOC, High-grade serous ovarian carcinoma; EOC, Epithelial ovarian cancer; OS, overall survival; TEADs, Transcriptional enhanced associate domains; YAP, Yes-associated protein; TAZ, Transcriptional co-activator with PDZ-binding motif; TIICs, Tumor-infiltrating immune cells; IHC, immunohistochemistry; TMA, Tissue Microarray; TCGA, The Cancer Genome Atlas; MSIT, Ministry of Science and ICT; FIGO, Federation of Gynaecology and Obstetrics; TIMER, Tumor Immune Estimation Resource; VEGFR2, Vascular endothelial growth factor receptor 2; PDGF, Platelet-derived growth factor gene; GEO, expression omnibus; RBDs, RNA Binding Proteins.
1. Fitzmaurice C, Dicker D, Pain A, Hamavid H, Moradi-Lakeh M, MacIntyre MF, et al. The global burden of cancer 2013. JAMA Oncol (2015) 1:505–27. doi: 10.1001/jamaoncol.2015.0735
2. Webb PM, Jordan SJ. Epidemiology of epithelial ovarian cancer. Best Pract Res Clin Obstet Gynaecol (2017) 41:3–14. doi: 10.1016/j.bpobgyn.2016.08.006
3. Au KK, Josahkian JA, Francis JA, Squire JA, Koti M. Current state of biomarkers in ovarian cancer prognosis. Future Oncol (2015) 11(23):3187–95. doi: 10.2217/fon.15.251
4. Chen VW, Ruiz B, Killeen JL, Coté TR, Wu XC, Correa CN, et al. Pathology and classification of ovarian tumors. Cancer Suppl (2003) 97:2631–42. doi: 10.1002/cncr.11345
5. Prat J, D’Angelo E, Espinosa I. Ovarian carcinomas: at least five different diseases with distinct histological features and molecular genetics. Hum Pathol (2018) 80:11–27. doi: 10.1016/j.humpath.2018.06.018
6. The Cancer Genome Atlas Research Network. Integrated genomic analyses of ovarian carcinoma. Nature (2011) 474:609–15. doi: 10.1038/nature10166
7. Liu J, Xu W, Li S, Sun R, Cheng W. Multi-omics analysis of tumor mutational burden combined with prognostic assessment in epithelial ovarian cancer based on TCGA database. Int J Med Sci (2020) 17(18):3200–13. doi: 10.7150/ijms.50491
8. Yu FX, Zhao B, Guan KL. Hippo pathway in organ size control, tissue homeostasis, and cancer. Cell (2015) 163(4):811–28. doi: 10.1016/j.cell.2015.10.044
9. Godin P, Tsoi M, Paquet M, Boerboom D. YAP and TAZ are required for the postnatal development and the maintenance of the structural integrity of the oviduct. Reproduction (2020) 160(2):307–18. doi: 10.1530/REP-20-0202
10. Hansen CG, Moroishi T, Guan KL. YAP and TAZ: a nexus for hippo signaling and beyond. Trends Cell Biol (2015) 25(9):499–513. doi: 10.1016/j.tcb.2015.05.002
11. Harvey KF, Zhang X, Thomas DM. The hippo pathway and human cancer. Nat Rev Cancer (2013) 13(4):246–57. doi: 10.1038/nrc3458
12. He C, Lv X, Hua G, Lele SM, Remmenga S, Dong J, et al. YAP forms autocrine loops with the ERBB pathway to regulate ovarian cancer initiation and progression. Oncogene (2015) 34:6040–54. doi: 10.1038/onc.2015.52
13. Jeong GO, Shin SH, Seo EJ, Kwon YW, Heo SC, Kim KH, et al. TAZ mediates lysophosphatidic acid-induced migration and proliferation of epithelial ovarian cancer cells. Cell Physiol Biochem (2013) 32:253–63. doi: 10.1159/000354434
14. Maeda T, Chapman DL, Stewart AF. Mammalian vestigial-like 2, a cofactor of TEF-1 and MEF2 transcription factors that promotes skeletal muscle differentiation. J Biol Chem (2002) 277:48889–98. doi: 10.1074/jbc.M206858200
15. Ma S, Tang T, Probst G, Konradi A, Jin C, Li F, et al. Transcriptional repression of estrogen receptor alpha by YAP reveals the hippo pathway as therapeutic target for ER+ breast cancer. Nat Commun (2022) 13(1):1061. doi: 10.1038/s41467-022-28691-0
16. Halperin DS, Pan C, Lusis AJ, Tontonoz P. Vestigial-like 3 is an inhibitor of adipocyte differentiation. J Lipid Res (2013) 54(2):473–81. doi: 10.1194/jlr.M032755
17. Simon E, Theze N, Fedou S, Thiebaud P, Faucheux C. Vestigial-like 3 is a novel Ets1 interacting partner and regulates trigeminal nerve formation and cranial neural crest migration. Biol Open (2017) 6:1528–40. doi: 10.1242/bio.026153
18. Hélias-Rodzewicz Z, Pérot G, Chibon F, Ferreira C, Lagarde P, Terrier P, et al. YAP1 and VGLL3, encoding two cofactors of TEAD transcription factors, are amplified and overexpressed in a subset of soft tissue sarcomas. Genes Chromosomes Cancer (2010) 49(12):1161–71. doi: 10.1002/gcc.20825
19. Hori N, Okada K, Takakura Y, Takano H, Yamaguchi N, Yamaguchi N. Vestigial-like family member 3 (VGLL3), a cofactor for TEAD transcription factors, promotes cancer cell proliferation by activating the hippo pathway. . J Biol Chem (2020) 295(26):8798–807. doi: 10.1074/jbc.RA120.012781
20. Zhang LH, Wang Z, Li LH, Liu YK, Jin LF, Qi XW, et al. Vestigial like family member 3 is a novel prognostic biomarker for gastric cancer. World J Clin cases (2019) 7(15):1954–63. doi: 10.12998/wjcc.v7.i15.1954
21. Zhang L, Li L, Mao Y, Hua D. VGLL3 is a prognostic biomarker and correlated with clinical pathologic features and immune infiltrates in stomach adenocarcinoma. Sci Rep (2020) 10:1355. doi: 10.1038/s41598-020-58493-7
22. Gambaro K, Quinn MCJ, Wojnarowicz PM, Arcand SL, de Ladurantaye M, Barrès V, et al. Vgll3 expression is associated with a tumor suppressor phenotype in epithelial ovarian cancer. Mol Oncol (2013) 7(3):513–30. doi: 10.1016/j.molonc.2012.12.006
23. Cody NA, Ouellet V, Manderson EN, Quinn MC, Filali-Mouhim A, Tellis P, et al. Transfer of chromosome 3 fragments suppresses tumorigenicity of an ovarian cancer cell line monoallelic for chromosome 3p. Oncogene (2007) 26(4):618–32. doi: 10.1038/sj.onc.1209821
24. Cody NA, Shen Z, Ripeau JS, Provencher DM, Mes-Masson AM, Chevrette M, et al. Characterization of the 3p12.3-pcen region associated with tumor suppression in a novel ovarian cancer cell line model genetically modified by chromosome 3 fragment transfer. Mol Carcinog (2009) 48:1077–92. doi: 10.1002/mc.20535
25. Shuguang Z, Min W, Shiqun W, Jie D, Jiwu W. Pan-cancer analysis of immune cell infiltration identifies a prognostic immune-cell characteristic score (ICCS) in lung adenocarcinoma. Front Immunol (2020) 11:1218. doi: 10.3389/fimmu.2020.01218
26. Tang Z, Kang B, Li C, Chen T, Zhang Z. GEPIA2: an enhanced web server for large-scale expression profiling and interactive analysis. Nucleic Acids Res (2019) 47(W1):W556–60. doi: 10.1111/jcmm.16188
27. Cho H, Kim JH. Lipocalin2 expressions correlate significantly with tumor differentiation in epithelial ovarian cancer. J Histochem Cytochem (2009) 57:513–21. doi: 10.1369/jhc.2009.953257
28. Chay D, Cho H, Lim BJ, Kang ES, Oh YJ, Choi SM, et al. ER-60 (PDIA3) is highly expressed in a newly established serous ovarian cancer cell line, YDOV-139. Int J Oncol (2010) 37:399–412. doi: 10.3892/ijo_00000688
29. Cho H, Kang ES, Hong SW, Oh YJ, Choi SM, Kim SW, et al. Genomic and proteomic characterization of YDOV-157, a newly established human epithelial ovarian cancer cell line. Mol Cell Biochem (2008) 319(1-2):189–201. doi: 10.1007/s11010-008-9892-4
30. Cho H, Lim BJ, Kang ES, Choi JS, Kim JH. Molecular characterization of a new ovarian cancer cell line, YDOV-151, established from mucinous cystadenocarcinoma. Tohoku J Exp Med (2009) 218(2):129–39. doi: 10.1620/tjem.218.129
31. Sturm G, Finotello F, Petitprez F, Zhang JD, Baumbach J, Fridman WH, et al. Comprehensive evaluation of transcriptome-based cell-type quantification methods for immune-oncology. Bioinformatics (2019) 35(14):i436–45. doi: 10.1093/bioinformatics/btz363
32. Racle J, Gfeller D. EPIC: a tool to estimate the proportions of different cell types from bulk gene expression data. Methods Mol Biol (2020) 2120:233–48. doi: 10.1007/978-1-0716-0327-7_17
33. Li T, Fan J, Wang B, Traugh N, Chen Q, Liu JS, et al. TIMER: a web server for comprehensive analysis of tumor-infiltrating immune cells. Cancer Res (2017) 77(21):e108–10. doi: 10.1158/0008-5472.CAN-17-0307
34. Newman AM, Liu CL, Green MR, Gentles AJ, Feng W, Xu Y, et al. Robust enumeration of cell subsets from tissue expression profiles. Nat Methods (2015) 12(5):453–7. doi: 10.1038/nmeth.3337
35. Choi CH, Kang TH, Song JS, Kim YS, Chung EJ, Ylaya K, et al. Elevated expression of pancreatic adenocarcinoma upregulated factor (PAUF) is associated with poor prognosis and chemoresistance in epithelial ovarian cancer. Sci Rep (2018) 8(1):12161. doi: 10.1038/s41598-018-30582-8
36. Love MI, Huber W, Anders S. Moderated estimation of fold change and dispersion for RNA-seq data with DESeq2. Genome Biol (2014) 15:550. doi: 10.1186/s13059-014-0550-8
37. Kamburov A, Stelzl U, Lehrach H and Herwig R. The consensus path DB interaction database: 2013 update. Nucleic Acids Res (2013) 41(1):D793–800. doi: 10.1093/nar/gks1055
38. Therneau TM. Survival: a package for survival analysis in r. In: R package version 3.1-12 (2020). Available at: https://CRAN.R-project.org/package=survival.
39. Gordon M. Forestplot: advanced forest plot using ‘grid’ graphics. In: R package version 2.0.1 (2021). Available at: https://CRAN.R-project.org/package=forestplot.
40. Guo T, Dong X, Xie S, Zhang L, Zeng P, Zhang L. Cellular mechanism of gene mutations and potential therapeutic targets in ovarian cancer. Cancer Manag Res (2021) 13:3081–100. doi: 10.2147/CMAR.S292992
41. Nameki R, Chang H, Reddy J, Rosario I, Corona RI, Lawrenson K. Transcription factors in epithelial ovarian cancer: histotype-specific drivers and novel therapeutic targets. Pharmacol Ther (2021) 220:107722. doi: 10.1016/j.pharmthera.2020.107722
42. Millet C, Zhang YE. Roles of Smad3 in TGF-beta signaling during carcinogenesis. Crit Rev Eukaryot Gene Expr (2007) 17(4):281–93. doi: 10.1615/critreveukargeneexpr.v17.i4.30
43. Bae DS, Blazanin N, Licata M, Lee J, Glick AB. Tumor suppressor and oncogene actions of TGFbeta1 occur early in skin carcinogenesis and are mediated by Smad3. Mol Carcinog (2009) 48(5):441–53. doi: 10.1002/mc.20482
44. Audic Y, Hartley RS. Post-transcriptional regulation in cancer. Biol Cell (2004) 96:479–98. doi: 10.1016/j.biolcel.2004.05.002
45. Lin CY, Beattie A, Baradaran B, Dray E, Duijf PHG. Contradictory mRNA and protein misexpression of EEF1A1 in ductal breast carcinoma due to cell cycle regulation and cellular stress. Sci Rep (2018) 8:13904. doi: 10.1038/s41598-018-32272-x
46. Wang YQ, Chen YP, Zhang Y, Jiang W, Liu N, Yun JP, et al. Prognostic significance of tumor-infiltrating lymphocytes in nondisseminated nasopharyngeal carcinoma: a Large-scale cohort study. Int J Cancer (2018) 142(12):2558–66. doi: 10.1002/ijc.31279
47. Zhang WJ, Wang XH, Gao ST, Chen C, Xu XY, Sun Q, et al. Tumor-associated macrophages correlate with phenomenon of epithelial-mesenchymal transition and contribute to poor prognosis in triple-negative breast cancer patients. J Surg Res (2018) 222:93–101. doi: 10.1016/j.jss.2017.09.035
48. Yafei Z, Jun G, Guolan G. Correlation between macrophage infiltration and prognosis of ovarian cancer-a preliminary study. BioMed Res (2016) 27:305–12.
49. Yin M, Li X, Tan S, Zhou HJ, Ji W, Bellone S, et al. Tumor-associated macrophages drive spheroid formation during early transcoelomic metastasis of ovarian cancer. J Clin Invest (2016) 126(11):4157–73. doi: 10.1172/JCI87252
50. Zhang M, He Y, Sun X, Li Q, Wang W, Zhao A, et al. A high M1/M2 ratio of tumor-associated macrophages is associated with extended survival in ovarian cancer patients. J Ovarian Res (2014) 7:19. doi: 10.1186/1757-2215-7-19
51. Cheng H, Wang Z, Fu L, Xu T. Macrophage polarization in the development and progression of ovarian cancers: an overview. Front Oncol (2019) 9:421. doi: 10.3389/fonc.2019.00421
52. Cho A, Howell VM, Colvin EK. The extracellular matrix in epithelial ovarian cancer - a piece of a puzzle. Front Oncol (2015) 5:245. doi: 10.3389/fonc.2015.00245
53. Ediriweera MK, Tennekoon KH, Samarakoon SR. Role of the PI3K/AKT/mTOR signaling pathway in ovarian cancer: biological and therapeutic significance. Semin Cancer Biol (2019) 59:147–60. doi: 10.1016/j.semcancer.2019.05.012
54. Adham S, Sher I and Coomber B. Molecular blockade of VEGFR2 in human epithelial ovarian carcinoma cells. Lab Invest (2010) 90:709–23. doi: 10.1038/labinvest.2010.52
55. Qiu S, Deng L, Liao X, Nie L, Qi F, Jin K, et al. Tumor-associated macrophages promote bladder tumor growth through PI3K/AKT signal induced by collagen. Cancer Sci (2019) 110(7):2110–8. doi: 10.1111/cas.14078
56. Feng R, Yang S. Effects of combining erlotinib and RNA-interfered downregulation of focal adhesion kinase expression on gastric cancer. J Int Med Res (2016) 44:855–64. doi: 10.1177/0300060516647550
57. Pathria P, Louis TL, Varner JA. Targeting tumor-associated macrophages in cancer. Trends Immunol (2019) 40:310–27. doi: 10.1016/j.it.2019.02.003
58. Delgado Bolton RC, Aide N, Colletti PM, Ferrero A, Paez D, Skanjeti A, et al. EANM guideline on the role of 2-[18F] FDG PET/CT in diagnosis, staging, prognostic value, therapy assessment and restaging of ovarian cancer, endorsed by the American college of nuclear medicine (ACNM), the society of nuclear medicine and molecular imaging (SNMMI) and the international atomic energy agency (IAEA). Eur J Nucl Med Mol Imaging (2021) 10:3286–302. doi: 10.1007/s00259-021-05450-9
59. Delgado Bolton RC, Calapaquí Terán AK, Pellet O, Ferrero A, Giammarile F. The search for new 2-18F-FDG PET/CT imaging biomarkers in advanced ovarian cancer patients: focus on peritoneal staging for guiding precision medicine and management decisions. Clin Nucl Med (2021) 46(11):906–7. doi: 10.1097/RLU.0000000000003784
Keywords: high-grade serous ovarian carcinoma, hippo pathway, VGLL3, prognosis, macrophage
Citation: Haque R, Lee J, Chung J-Y, Shin H-Y, Kim H, Kim J-H, Yun JW and Kang E-S (2023) VGLL3 expression is associated with macrophage infiltration and predicts poor prognosis in epithelial ovarian cancer. Front. Oncol. 13:1152991. doi: 10.3389/fonc.2023.1152991
Received: 28 January 2023; Accepted: 09 May 2023;
Published: 05 June 2023.
Edited by:
Umberto Malapelle, University of Naples Federico II, ItalyReviewed by:
Neveen Said, Wake Forest Baptist Medical Center, United StatesCopyright © 2023 Haque, Lee, Chung, Shin, Kim, Kim, Yun and Kang. This is an open-access article distributed under the terms of the Creative Commons Attribution License (CC BY). The use, distribution or reproduction in other forums is permitted, provided the original author(s) and the copyright owner(s) are credited and that the original publication in this journal is cited, in accordance with accepted academic practice. No use, distribution or reproduction is permitted which does not comply with these terms.
*Correspondence: Jae Won Yun, and5dW5tZEBnbWFpbC5jb20=; Eun-Suk Kang, ZXNrYW5nQHNra3UuZWR1
†These authors have contributed equally to this work
‡ORCID: Razaul Haque, orcid.org/0000-0003-2161-9868
Jaebon Lee, orcid.org/0000-0001-5600-6354
Joon-Yong Chung, orcid.org/0000-0001-5041-5982
Ha-Yeon Shin, orcid.org/0000-0001-6735-1700
Hyosun Kim, orcid.org/0000-0002-2900-4086
Jae-Hoon Kim, orcid.org/0000-0001-6599-7065
Jae Won Yun, orcid.org/0000-0002-9029-8036
Eun-Suk Kang, orcid.org/0000-0001-6386-6520
Disclaimer: All claims expressed in this article are solely those of the authors and do not necessarily represent those of their affiliated organizations, or those of the publisher, the editors and the reviewers. Any product that may be evaluated in this article or claim that may be made by its manufacturer is not guaranteed or endorsed by the publisher.
Research integrity at Frontiers
Learn more about the work of our research integrity team to safeguard the quality of each article we publish.