Abstract
Objective:
This study aimed to develop a clinical–radiomic model based on radiomic features extracted from digital breast tomosynthesis (DBT) images and clinical factors that may help to discriminate between benign and malignant breast lesions.
Materials and methods:
A total of 150 patients were included in this study. DBT images acquired in the setting of a screening protocol were used. Lesions were delineated by two expert radiologists. Malignity was always confirmed by histopathological data. The data were randomly divided into training and validation set with an 80:20 ratio. A total of 58 radiomic features were extracted from each lesion using the LIFEx Software. Three different key methods of feature selection were implemented in Python: (1) K best (KB), (2) sequential (S), and (3) Random Forrest (RF). A model was therefore produced for each subset of seven variables using a machine-learning algorithm, which exploits the RF classification based on the Gini index.
Results:
All three clinical–radiomic models show significant differences (p < 0.05) between malignant and benign tumors. The area under the curve (AUC) values of the models obtained with three different feature selection methods were 0.72 [0.64,0.80], 0.72 [0.64,0.80] and 0.74 [0.66,0.82] for KB, SFS, and RF, respectively.
Conclusion:
The clinical–radiomic models developed by using radiomic features from DBT images showed a good discriminating power and hence may help radiologists in breast cancer tumor diagnoses already at the first screening.
1 Introduction
Breast cancer (BC) is the tumor with the highest incidence worldwide. With 2.3 million new cases estimated in 2020, it represents the 1.7% of new cancer diagnoses and is therefore the most frequently diagnosed according to Global Cancer Statistics 2020 (1). Although screening and advancements in personalized treatments have led to an improvement in survival rates, it is estimated that BC-related deaths will increase 43% globally from 2015 to 2030 (2).
In current radiological practice, mammographic, ultrasonographic, or magnetic resonance imaging (MRI) evaluation of tumors is largely qualitative and includes subjective evaluations such as tumor aspect (spiculated, rounded, with necrosis, microcalcification), density, type of enhancement and anatomic relationship to the surrounding tissues in order to inform further treatment (3, 4). Early studies have shown that the three-dimensional (3D) digital mammography (DBT) examination can lead to an effective reduction in both false-positive and false-negative rates when compared with traditional X-ray mammography for all breast density subtypes (5, 6), especially on heterogeneously dense breasts.
The inclusion of standard digital imaging among the possible sources of big data for precision medicine represents one of the new frontiers of research. Particularly, radiomics (7) offers a great opportunity for diagnosis in several medical fields, yielding the most interesting results in oncology. Radiomics aims to extract quantitative information, which is potentially beyond the perception of the human eye, from medical images to uncover novel features that are associated with treatment outcomes, disease molecular expressions, and/or patient survival (8).
There are few studies concerning the analysis of DBT images and eventually the introduction into clinical practice of methods of automatic cancer detection (9–12). However, the scientific interest in radiomics and artificial intelligence (AI) methods in this setting is rapidly expanding. In this scenario, the aim of our project was the construction of a predictive model of lesion malignancy based on the radiomic features extracted by DBT images and on the clinical and anatomopathological characteristics of the lesions, which could assist radiologists in their first level diagnosis.
2 Material and methods
In the present study, patients who were subjected to tomosynthesis exams were enrolled; DBT imaging was performed at the Breast Unit in the Department of Radiology and Diagnostic Imaging by using the Giotto® CLASS mammography unit. Images were transferred from the picture archiving communication system (PACS) to a dedicated MIM-Maestro system (MIM Software INC.) in which the lesion was identified by the radiologists. This study was approved by the IRCCS Regina Elena Cancer Institute Ethics Committee (CEI number: RS1414/20(2408)). The requirement for obtaining informed consent was waived as it was a retrospective study.
2.1 Patient inclusion
In this study, 150 patients who underwent DBT scans were enrolled, 80 of whom had lesions classified as malignant and 70 benign. Lesions radiologically classified as malignant were subsequently confirmed by pathologic analysis.
Patients were randomly collected among those undergoing DBT at our hospital from May 2021 to May 2022, and their characteristics were quite extensively distributed as shown in Table 1. Those who had previously undergone radio/chemo or immunotherapy treatment or breast surgery and whose regions of interest (ROIs) couldn’t be segmented due to artifacts in the DBT image were excluded.
Table 1
| Age (mean ± SD) | Benign (70) 54.04 ± 13.14 | Malignant (80)66.36 ± 15.21 |
|---|---|---|
| Density: | ||
| A | 15 | 27 |
| B | 26 | 33 |
| C | 25 | 17 |
| D | 4 | 3 |
| Bi-Rads: | ||
| 1-2 | 38 | 0 |
| 3 | 26 | 12 |
| 4a-4b-4c | 6 | 50 |
| 5 | 0 | 18 |
Clinical characteristics.
2.2 Tomosynthesis acquisition/visualization protocol
Parameters for performing DBT scans were selected automatically by the automatic exposure control (AEC) at fixed Target/filter combination (W/Ag 50 ± 5 µm). The images resolution was 2925 × 1342 pixels per each 1 mm reconstructed slice. The initial images reading was performed on a workstation with diagnostic quality monitors (BARCO 5 MP).
2.3 Dataset allocation
The data were randomly divided into the training and validation sets in a ratio of 80:20. In the subdivision process, attention was paid to maintaining the predetermined relationship between patients of one group or the other.
2.4 Lesion contouring
Lesions were always identified by two expert radiologists (more than 10 years of experience). In the case of a very irregular shape, often a malignant lesion, the radiologist manually performed the contouring. Otherwise, a semi-automatic contouring method was applied. In both cases, the most representative DBT slice was chosen according to the radiologist’s indication.
An example of delineated lesions is shown in Figure 1.
Figure 1

(A) Example of the automatic contouring method: the operator identifies the center of the lesion and draws a cross to signal to the software the size of the area of interest. The algorithm then draws a contour based on the density gradients obtained from the values of the pixels of interest. (B) manually delineated lesion.
The algorithm, called “2D Edge”, is part of the MIM-Maestro system (MIM Software INC.). The density gradient method was used to draw a particular region of the image previously identified by the operator. To assess the robustness of the algorithm, a specific lesion of 2.84 cm2 manually delineated by an expert radiologist was also automatically contoured 20 times, resulting in a median area value of 2.83 cm2 (range 2.69–2.99). Furthermore, a qualitative validation regarding the shape was performed.
2.5 Collection of clinical variables
Patient clinical data, such as age, breast density, and Breast Imaging–Reporting and Data System (BI-RADS) scores were collected in a dedicated database specifically created with Microsoft Access software.
The lesion-associated anatomical and pathological data were obtained from the characterization following the biopsy, and data, such as estrogen, progesterone, human epidermal growth factor raptor 2 (HER2) and Ki67 (13) based on the histological evaluation, were also included in the same database.
Malignant or benign status of the lesions was defined according to a breast screening report [NHSBSP https://www.gov.uk/government/publications/breast-screening-national-radiographic-workforce-report-2016]:
B1 not adequate or not representative/probable the lesion was not taken.
B2 benign.
B3 with atypia but probably benign.
B4 with suspected atypia but not diagnostic for malignancy.
B5 malignant (B5a carcinoma in situ, B5b infiltrating carcinoma, B5c all malignant non-epithelial neoplasms).
2.6 Collection of radiomic variables
The images and the contours of the lesion exported from MIM were transferred to an open access software that allowed the extraction of radiomic features: LIFEx (www.lifexsoft.org). The analysis took place using first and second order radiomic features.
A total of 58 features were extracted from the original images: (1) five in the shape category, (2) 22 first-order statistical features and (3) 31 textural (n=6 Gray Level Co-occurrence Matrix [GLCM] + 11 Gray Level Run Length Matrix [GLRM] + 3 Neighboring Gray Level Dependence Matrix [NGLDM] + 11 Gray Level Size Zone Matrix [GLZLM]). All extracted features were obtained from the original image without any kind of filter. LIFEx output was an Excel file containing for each row all the variables extracted from one lesion analysis.
2.7 Development of a clinical-radiomic model
The clinical–radiomic model was constructed by combining age and density with the 58 cited features associated with each lesion. The ratio between training and validation set was chosen trying to balance the two groups (10) while maintaining a reasonable number of patients to train the model (14). The model was then developed with the training set (80% of the patients, n = 120) and tested using the validation set (20% of the patients, n = 30) splitted using a five-fold cross validation method.
2.7.1 Features selection
The number of features suitable for representing the population was chosen considering the dimension and the variability of the sample. Usually, it is considered a good practice to take a number of features in the ratio 1:9 respect to the sample size, to avoid possible overfitting seven features were selected from the initial 60 to build the model. Three different key methods of feature selection have been implemented in Python and included K best (KB), sequential (S), and Random Forest (RF).
The KB is based on a filter method (15). In filter methods, features are selected independently from any machine algorithms using a specific criterion, such as scores in statistical test and variances, to rank the importance of individual features. These methods are also generally effective in computation time and that’s why they are mainly used as the pre-processing step of any feature selection pipeline.
To estimate the degree of linearity between the input features (such as predictor of malignancy) and the output feature, the analysis of variance (ANOVA) F-value method was implemented. To avoid issues with outliers and violations of distributional assumptions, all features were previously normalized using a normal transformation of the ranks. However, any non-linear relationships cannot be detected by ANOVA F-value. Hence in the S method, to avoid and capture also non-linear relationships between input and output features a Mutual information (MI) algorithm was implemented (16). The S method is a wrapper method that finds the best subset of feature by adding a feature at each iteration that best improves the accuracy of the model. The maximum number of features must be set as an input.
The main weakness of filter methods is the lack of consideration of the relationships among features. To obtain a robust model but at the same time not overburden it, it is necessary to discard the information that turns out to be overwhelming. In fact, if two characteristics are strongly correlated, it is sufficient to consider only one for the construction of the final model. This information can be derived by creating a correlation matrix between the characteristics.
The last feature selection method used is an Embedded method, RF (15). It combines the strong points of filter and wrapper methods by taking advantage of machine algorithms that have their own built-in feature selection process.
2.7.2 Machine learning algorithm
Three models were therefore produced, one for each subset of variables, through a machine-learning algorithm, implemented in python language, which exploits the Random Forrest classification based on the Gini index (17). Models M1–3 were obtained from three feature subsets selected by KB, S, and RF, respectively.
2.8 Statistical analysis
The Mann–Whitney (18) test was used to assess the differences between selected features, both clinical and radiomic. All significance tests were considered under α=5% (p-value ≤ 0.05).
The goodness of the three models obtained was compared by analyzing the area under the curve (AUC) of the receiver operating characteristic (ROC) curve (19).
Figure 2 illustrates the workflow of this study.
Figure 2
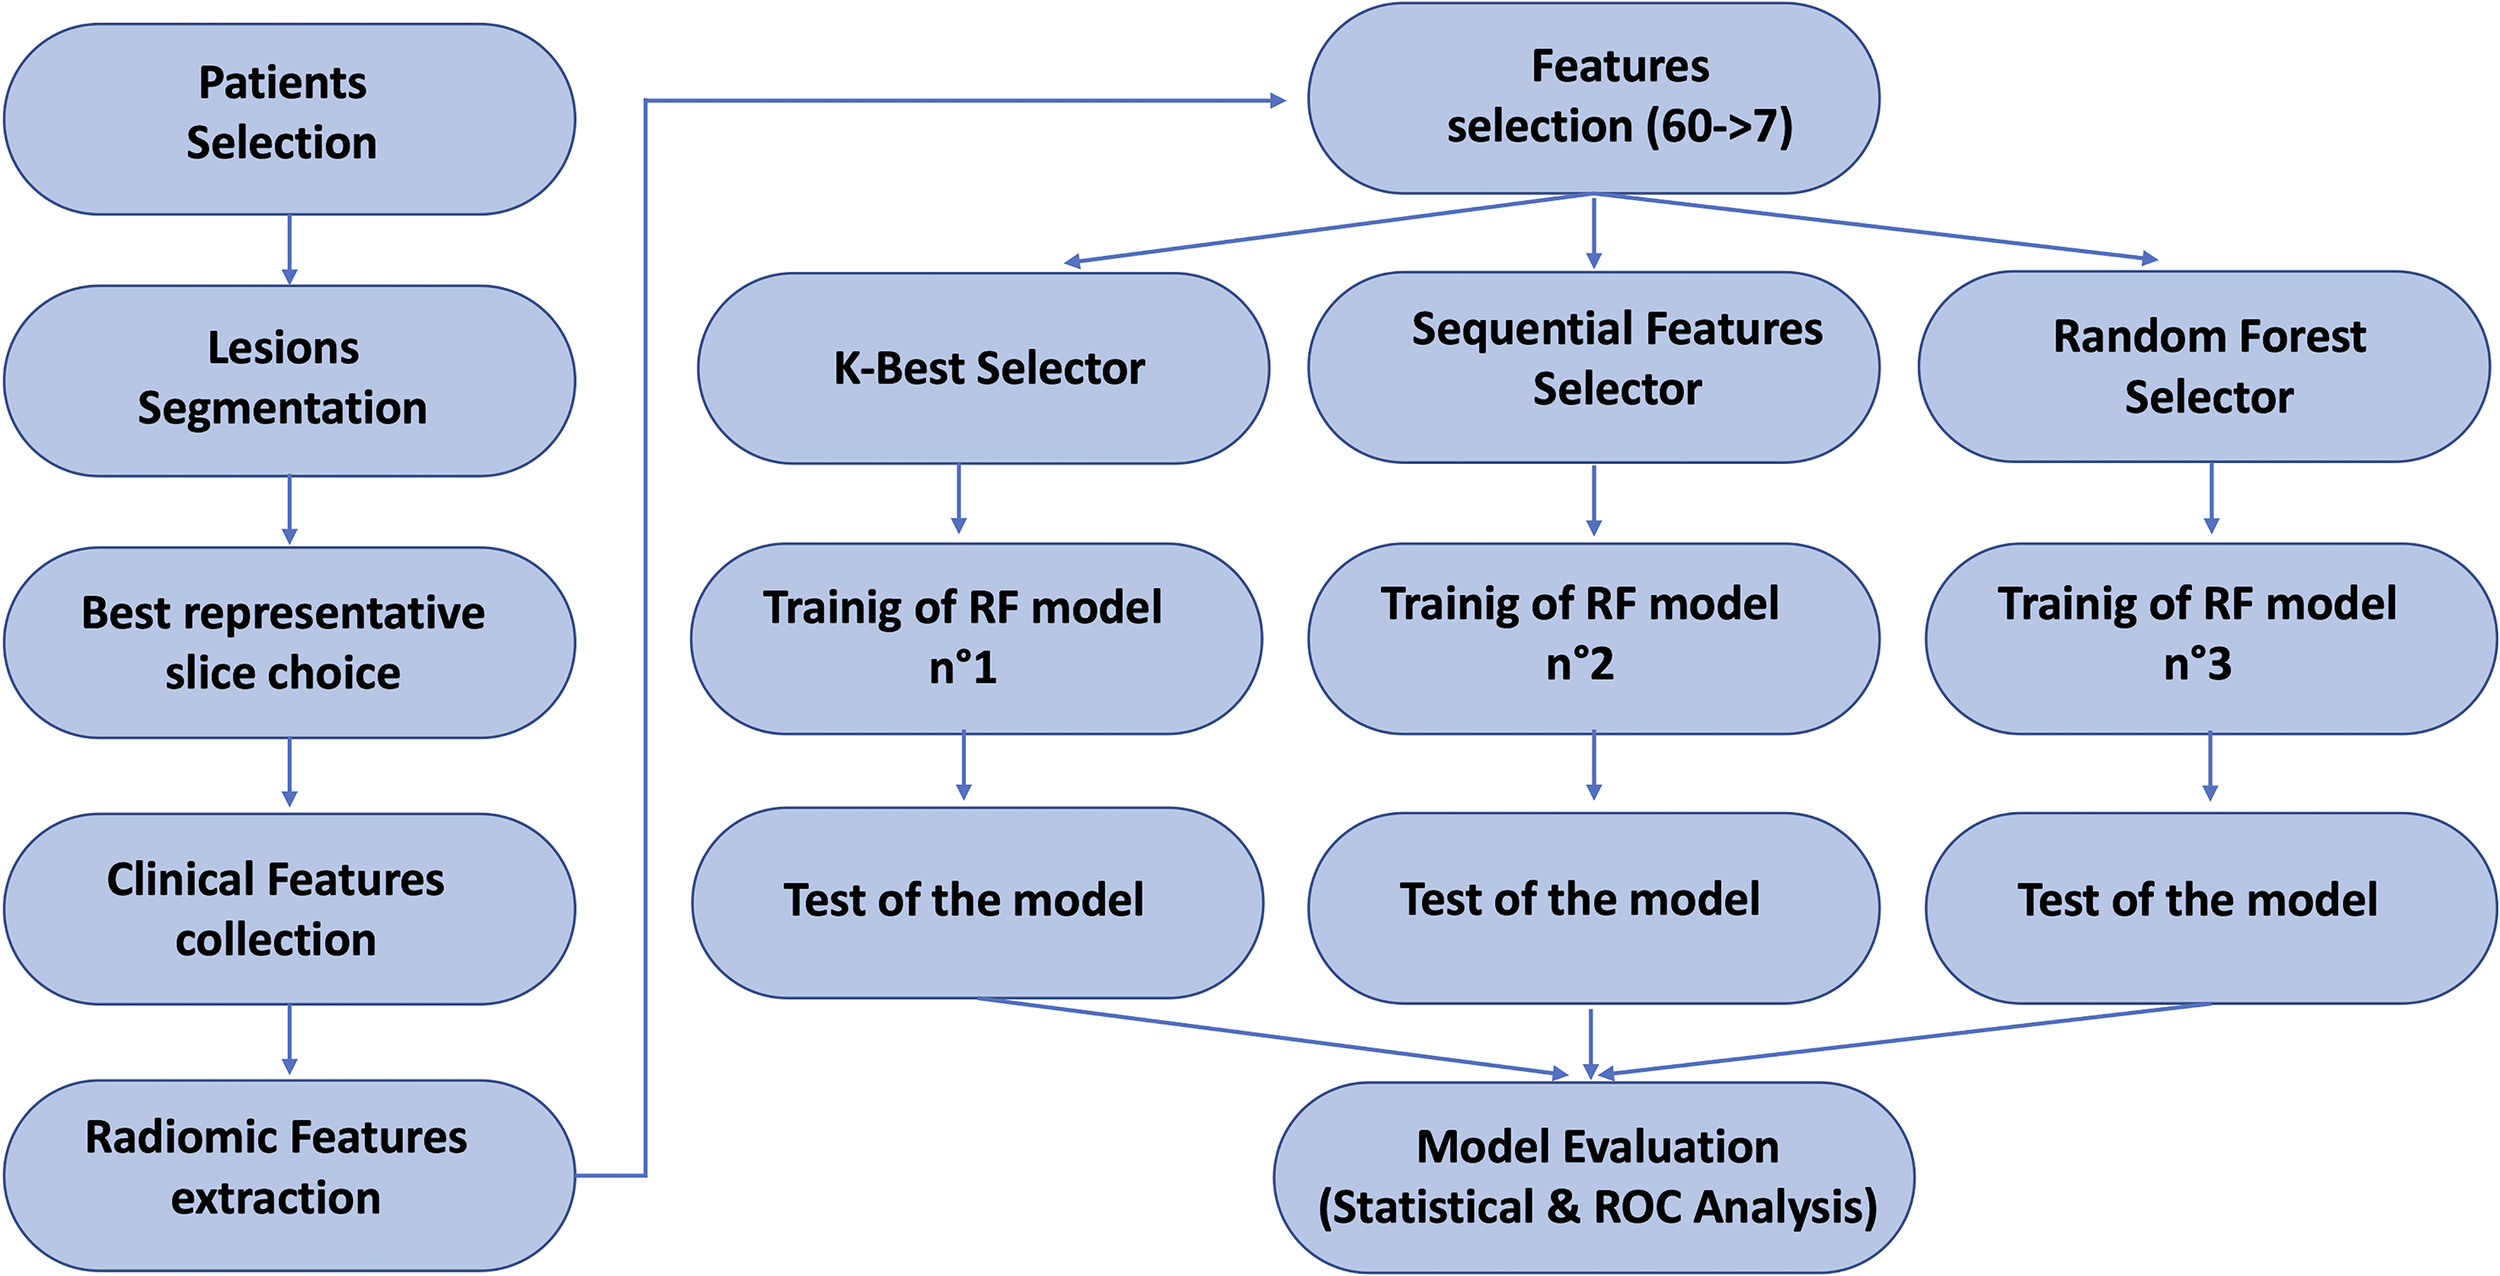
Scheme of the overall pipeline of this study.
3 Results
In Table 1, the clinical characteristics of the enrolled patients are reported.
In Figure 3, results of the analysis of variance (ANOVA) F-value method applied when using the K-best (KB) filter method are shown.
Figure 3

Result of the F-test on the input variables when using the KB filter method.
A high F-value indicates high degree of linearity, and a low F-value indicates a low degree. The presence of some promising variables (such as age and GLCM_Correlation) and others not correlated with the dichotomous output variable was immediately visible.
In the S filter method, MI measures the dependence, also non-linear, of one variable to another by quantifying the amount of information obtained about one feature through the other. MI is symmetric and non-negative; it is zero only if the input and output features are independent (Figure 4).
Figure 4

Mutual Information scores between output and input variables when using the S filter method.
A correlation matrix, such as the one shown in Figure 5 in which the inter-variable dependence was highlighted through the chromatic scale, was created to eliminate highly colinear variables in the feature selection step for the creation of the final model.
Figure 5
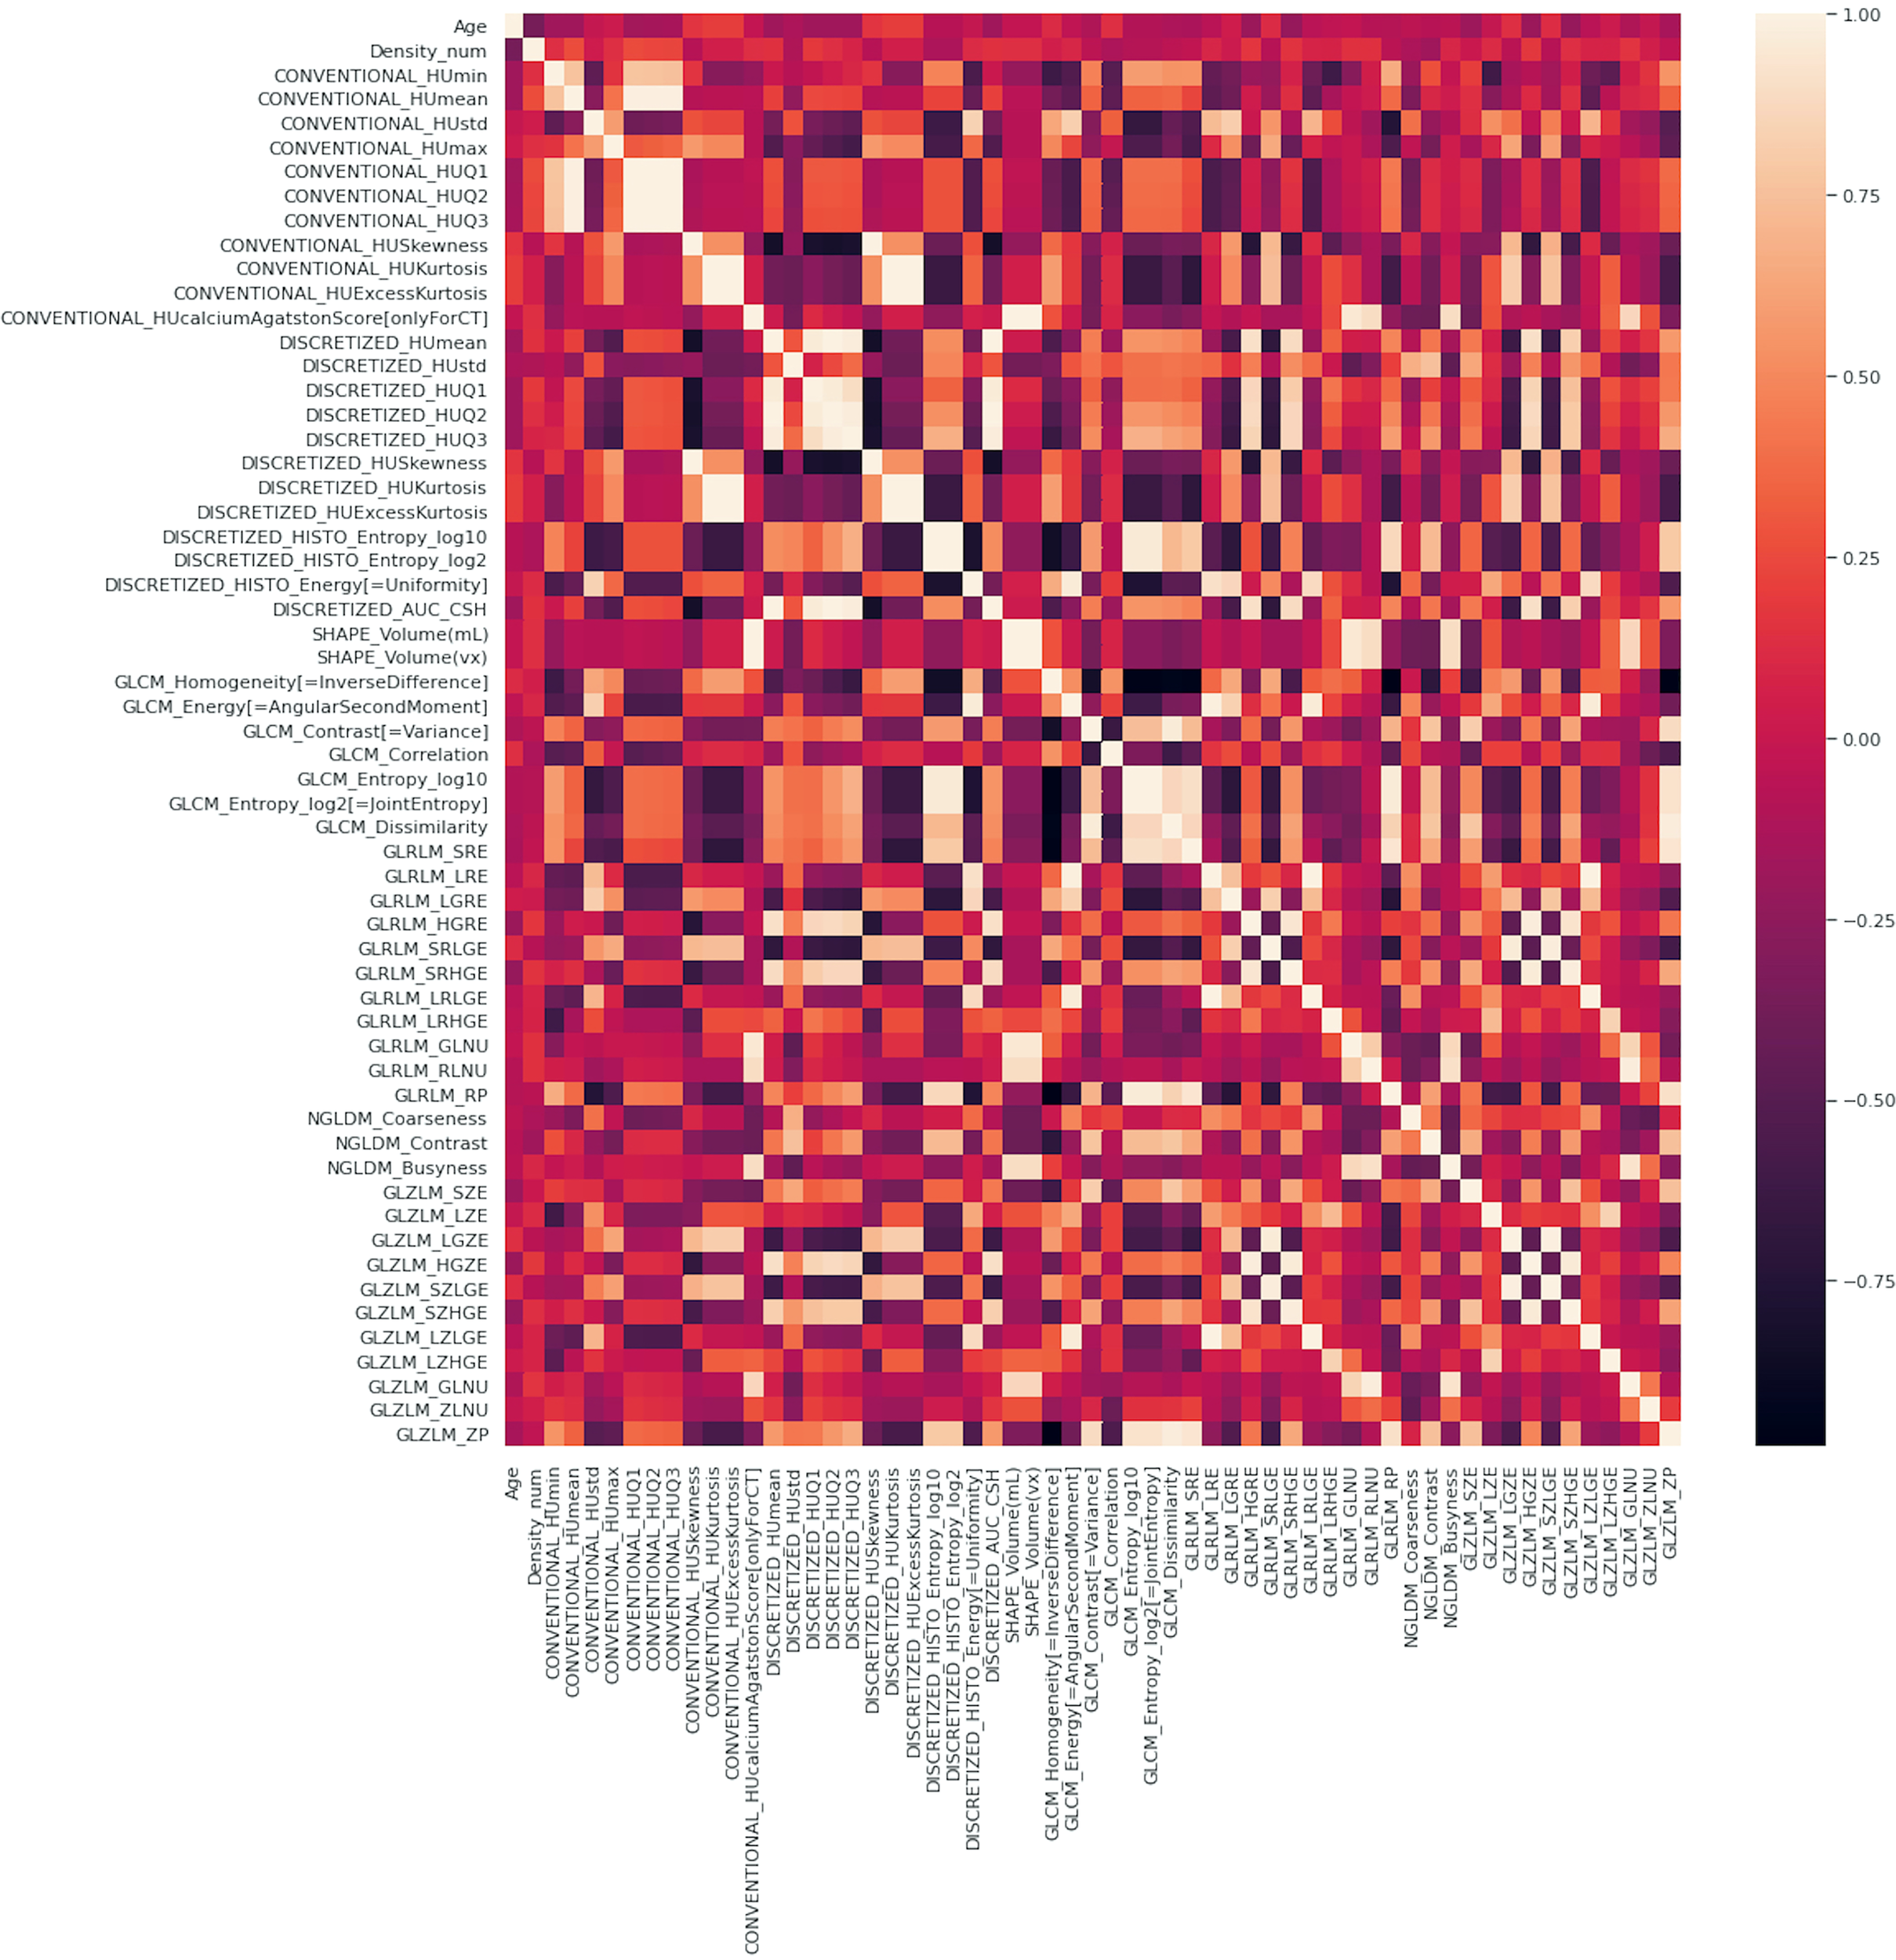
Correlation matrix of the complete set of variables, clinical plus radiomic.
In Figure 6 the accuracy calculated by the S method to choose the most predictive variables is shown. Best accuracy of 0.72 is reached with all the seven variables.
Figure 6
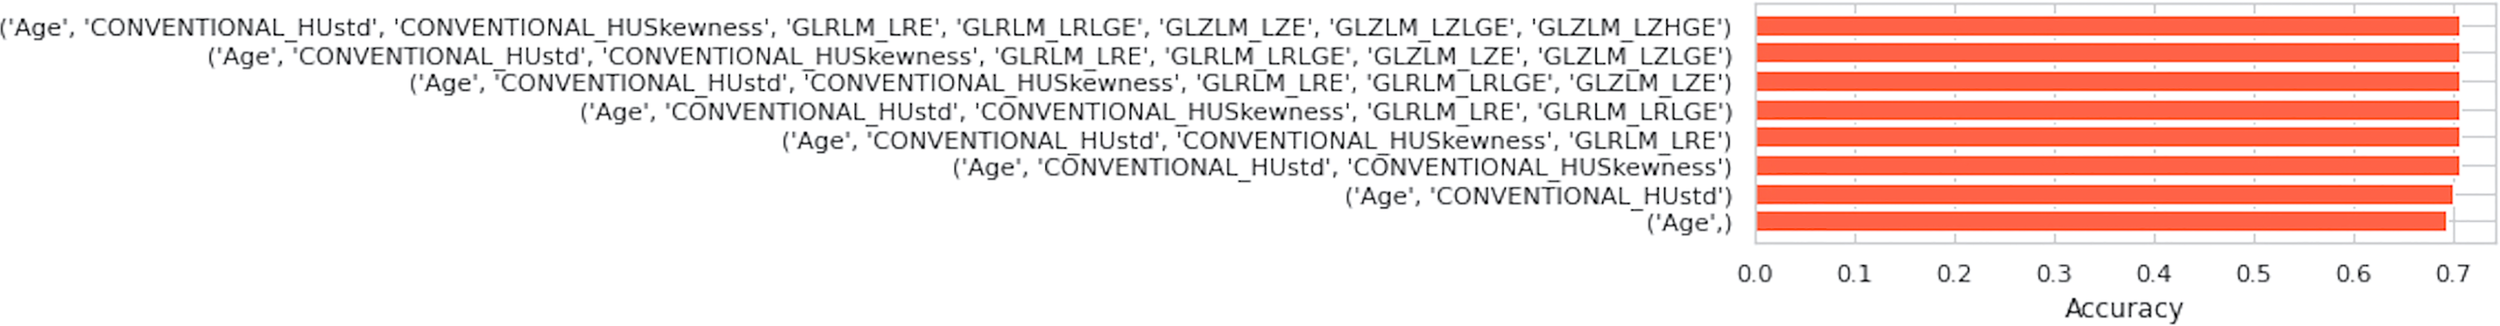
Accuracy plot showed with respect of the subset of features considered.
Finally, the RF method was used.
In Figure 7 the seven features obtained by KB, S, and RF selection methods are shown.
Figure 7
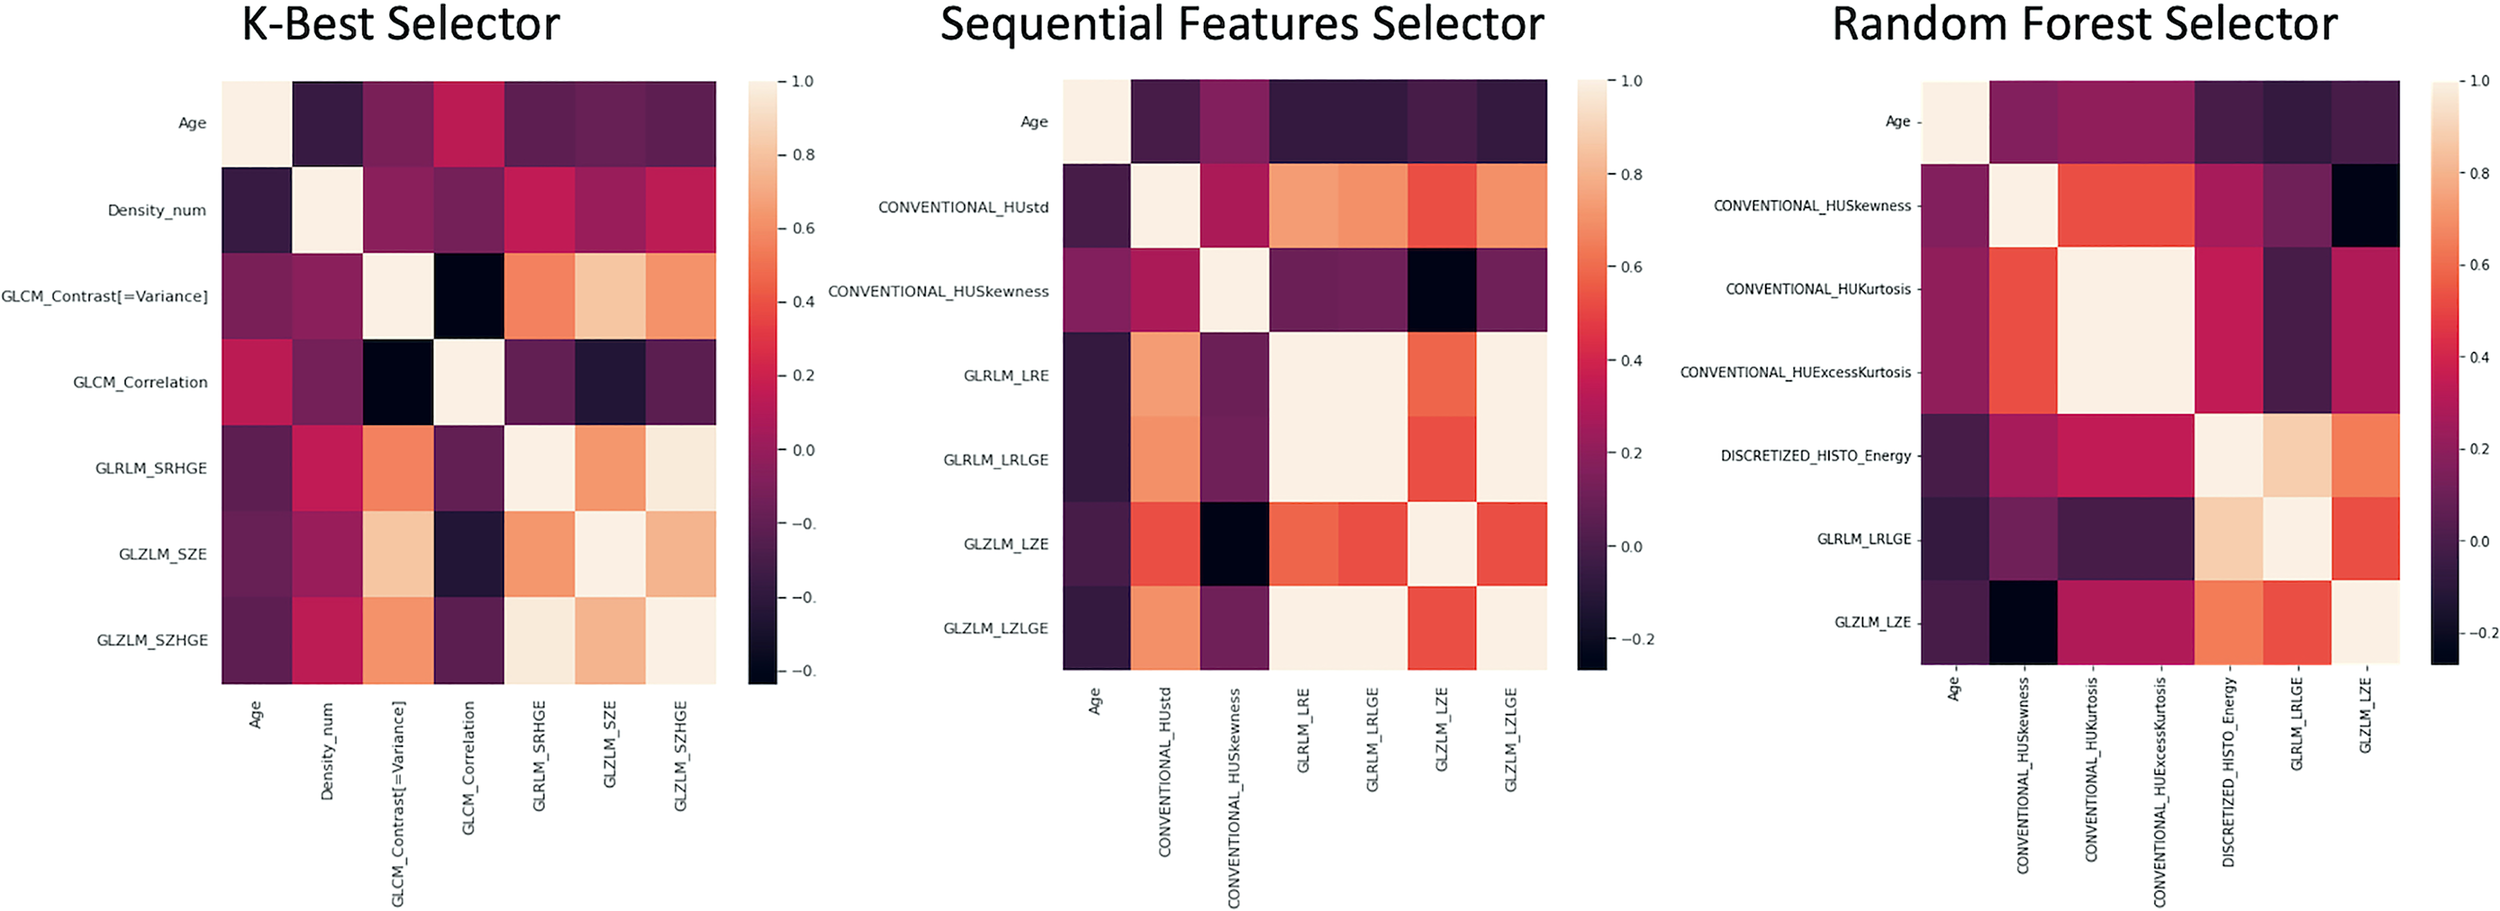
Correlation matrices of the 7 features obtained by KB, S and RF selection method are shown.
Based on the Mann-Whitney test, the following features resulted to be significantly different (p < 0.05) between benign and malignant lesions: (1) age, (2) density, (3) CONVENTIONAL_HUKurtosis, (4) CONVENTIONAL_HUExcessKurtosis, (5) GLCM correlation, (6) GLRLM_LRLGE, (7) GLRLM_SZE, and (8) GLRLM_SZHGE.
In Figure 8, the distribution boxplot together with the p value of four most representative selected features is shown; two clinical and two radiomic, one of first and one of second order.
Figure 8
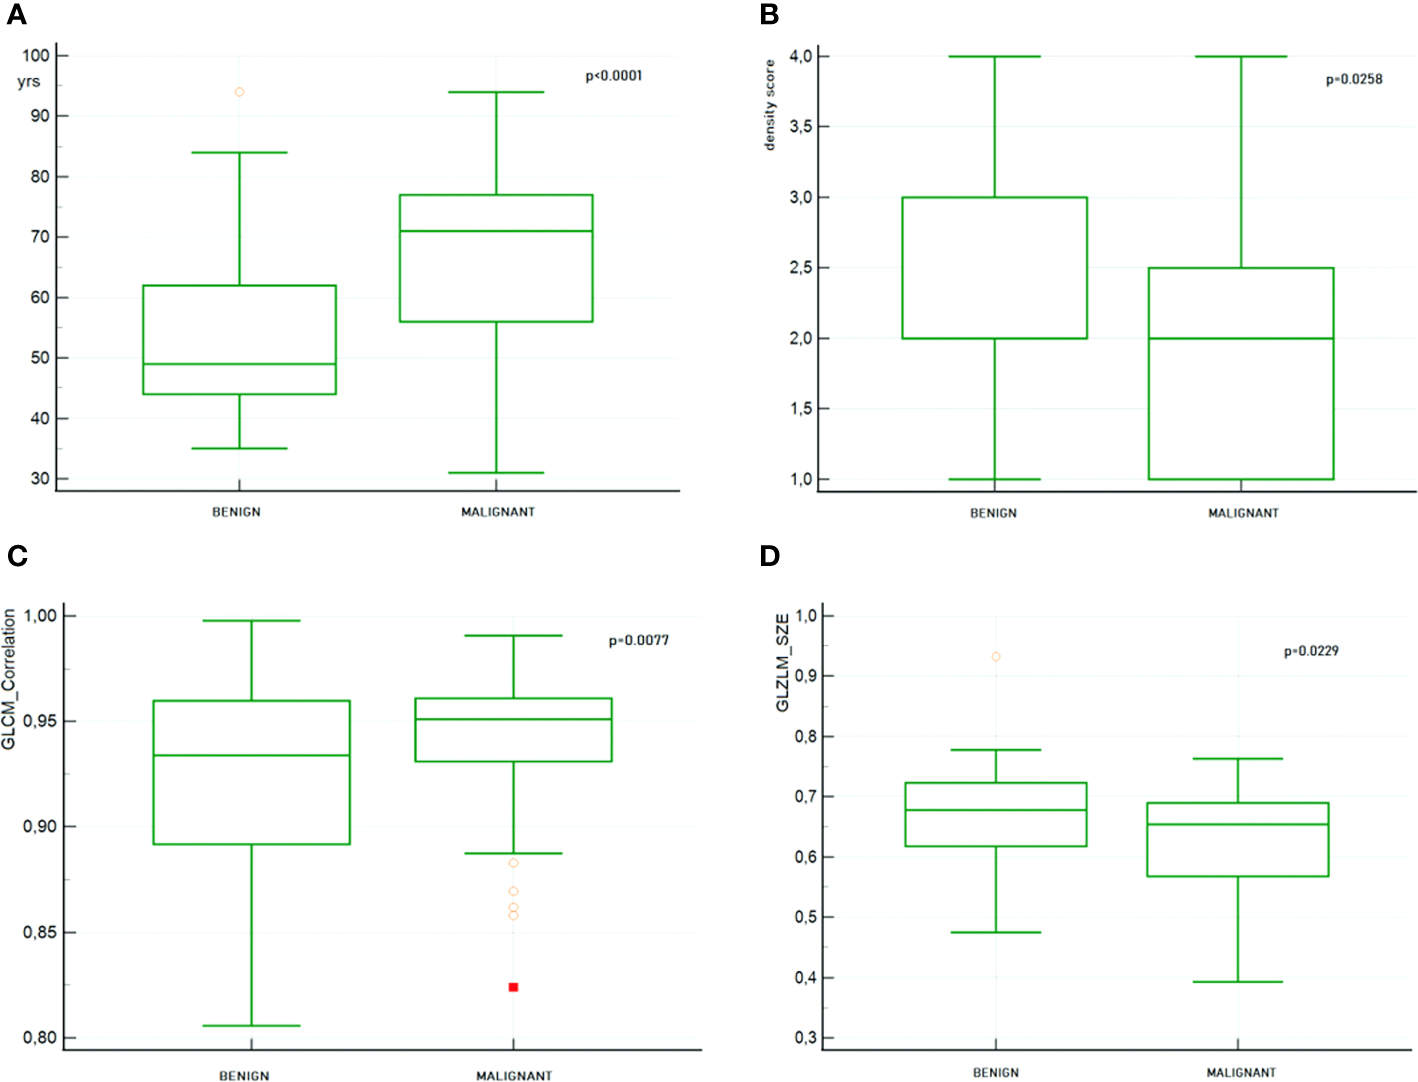
Boxplot together with the p value of 4 most representative selected features. (A) Patient’s age (B) Breast density (C) GLCM_Correlation (D) GLZLM_SZE.
In Supplementary Material the decision tree for each predictive model (M1, M2 and M3) and the corresponding confusion matrices are reported.
Radiomic features provided by the three models showed significant differences (p < 0.05) between malignant and benign lesions.
In Figure 9, the ROC curves for model M1–3 are shown together with their AUC values. The M1 model yielded an AUC value of 0.716 with confidence interval (CI) of [0.635–0.797]. While an AUC value of 0.722 with CI [0.640–10.802] and 0.740 with CI [0.662–0.819] were found for the M2 and M3 models, respectively.
Figure 9
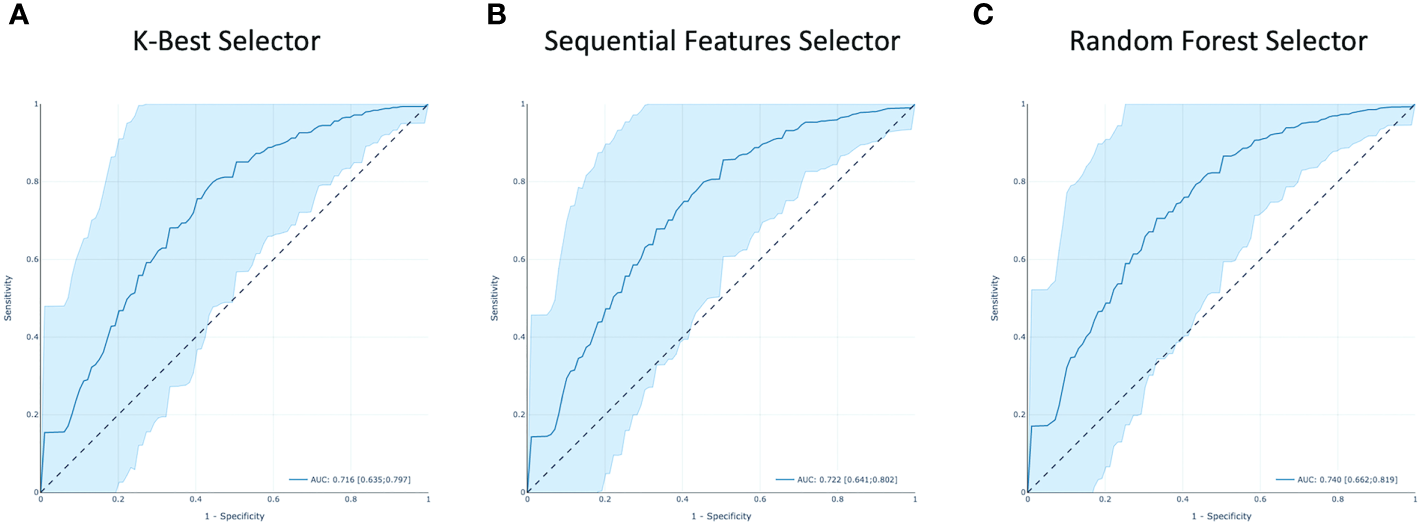
The receiver operating characteristic (ROC) curves of all the models. Area under the curve (AUC) is highlighted. (A–C) are respectively from KB, S and RF features selection methods.
4 Discussion
In a recently published paper (20), it was shown that the proposed radiomic model could help reduce unnecessary biopsies. In fact, especially in the presence of architectural distortion, DBT can detect some apparently benign lesions as suspicious because of its high sensitivity.
Due to its widespread among hospitals and low economic impact, in Italy DBT is used as a first level screening and patients are eventually directed to MRI according to the radiologist’s opinion. So, even if the two methods can probably be complementary (9), DBT is by far the most common diagnostic method.
For this reason, we aimed to develop a model that could help radiologists in their first level diagnosis and eventually to address the patient to further exams.
Having a dataset with high dimensionality a process of feature selection is mandatory to avoid oversampling. In fact, high-dimensional datasets are not preferred because they have lengthy training time and have high risk of overfitting. Feature selection helps to mitigate these problems by selecting features that have high importance to the model so that the data dimensionality can be reduced without much loss of the total information.
In this study, three feature selection methods were used, and consequently, three predictive models were derived. The resulting diagnostic performances of the 3 models are quite similar. The model derived from the RF Selector showed a slightly better performance with respect to the KB and S Selectors yielding AUC values of 0.740 [CI 0.662–0.819], 0.716 [CI 0.635–0.797], and 0.722 [CI 0.641–0.802], respectively.
The best diagnostic performance of the derived models is in accordance with other studies (3, 9, 21) but lower than the one obtained by Niu 2022. This last study enrolled a higher number of patients (185), and besides the tumor itself, the peritumoral areas were found to have a high discriminative power and were subsequently analyzed. However, the study was conducted on a cohort of patients having a very homogenous breast density, a feature that probably impinged on robustness.
It is worth noting that due to the fact that patients enrolled in our study belong to a screening protocol, the mean age was 60.61 ± 15.51 years. This is probably the reason why patients with benign lesions, usually younger, appear to have a higher parenchymal density score. In fact, in our population a significant inverse correlation was found between age and density (p < 0.0001) indicating that age somehow is disguising the density effect.
Some limitations of this study need to be highlighted.
Even if we evaluated the reproducibility of the delineation, feature stability inside repeated contours has not been assessed.
Moreover, in the feature selection step the variance has not been taken into account. In fact, due to the characteristics of the studied population some relevant features would have been excluded, as it was retrospectively investigated.
In addition, we derived our models from a relatively small sample size that could be hopefully augmented. Also, the choice of selecting exams performed by the same mammographer is limiting, and more data from patients enrolled in screening protocols in our institute could be exploited thus overcoming differences in DBT scanner by performing data harmonization. A better model could be constructed using an external validation set. For these reasons, we are designing a wider clinical trial in which, besides including in the delineation also of the peritumoral area, more hospitals will be involved with the aim of building a model that can be shared and whose robustness can be proven among different users.
In conclusion, according to the results obtained in our study, we think that the derived models could be considered as an aid to the radiologist in the diagnosis of breast tumor, at least at a first level screening, due to the good performance shown by the constructed models.
Statements
Data availability statement
The raw data supporting the conclusions of this article will be made available by the authors, without undue reservation.
Ethics statement
The studies involving human participants were reviewed and approved by Comitato Etico Centrale IRCCS Lazio Sezione IFO. Written informed consent for participation was not required for this study in accordance with the national legislation and the institutional requirements.
Author contributions
FM and VL: study design, FM and VL: study conduct, LG and FF: tumor delineation and radiological assessment, AR and LP: anatomo-pathological data support, PO database implementation, FM: data collection, FM and VL: data processing, FM and VL: statistical data analysis, FM and VL: drafting manuscript, AV and PO: manuscript revision. All authors contributed to the article and approved the submitted version.
Conflict of interest
The authors declare that the research was conducted in the absence of any commercial or financial relationships that could be construed as a potential conflict of interest.
Publisher’s note
All claims expressed in this article are solely those of the authors and do not necessarily represent those of their affiliated organizations, or those of the publisher, the editors and the reviewers. Any product that may be evaluated in this article, or claim that may be made by its manufacturer, is not guaranteed or endorsed by the publisher.
Supplementary material
The Supplementary Material for this article can be found online at: https://www.frontiersin.org/articles/10.3389/fonc.2023.1152158/full#supplementary-material
References
1
World Cancer Research Found International. Breast cancer statistics (2020). Available at: https://www.wcrf.org/dietandcancer/cancer-trends/breast-cancer-statistics (Accessed July, 2022).
2
HongnaTFuwenGYapingWJingZJieTYusongLet al. Preoperative prediction of axillary lymph node metastasis in breast carcinoma using radiomics features based on the fat-suppressed t2 sequence. Acad Radiol (2020) 27(9):1217–25. doi: 10.1016/j.acra.2019.11.004
3
TagliaficoASPianaMSchenoneDLaiRMassoneAMHoussamiN. Overview of radiomics in breast cancer diagnosis and prognostication. Breast (2020) 49:74–80. doi: 10.1016/j.breast.2019.10.018
4
ContiADuggentoAIndovinaIGuerrisiMToschiN. Radiomics in breast cancer classification and prediction. Sem Cancer Biol (2021) 72:2021. doi: 10.1016/j.semcancer.2020.04.002
5
RiedlCCLuftNBernhartCWeberMBernathovaMTeaMKet al. Triplemodality screening trial for familial breast cancer underlines the importance of magnetic resonance imaging and questions the role of mammography and ultrasound regardless of patient mutation status, age, and breast density. J Clin Oncol (2015) 33(10):1128–35. doi: 10.1200/JCO.2014.56.8626
6
GilbertFJTuckerLYoungKC. Digital breast tomosynthesis (DBT): a review of the evidence for use as a screening tool. Clin Radiol (2016) 71:141–50. doi: 10.1016/j.crad.2015.11.008
7
LambinPRios-VelazquezELeijenaarRCarvalhoSvan StiphoutRGGrantonPet al. Radiomics: extracting more information from medical images using advanced feature analysis. Eur J Cancer (2012) 48:441–6. doi: 10.1016/j.ejca.2011.11.036
8
O’ConnellAMBartolottaTVOrlandoAJungSHBaekJParkerKJ. Diagnostic performance of an artificial intelligence system in breast ultrasound. J Ultrasound41(1):97–105 doi: 10.1002/jum.15684
9
NiuSWangXZhaoNLiuGKanYDongYet al. Radiomic evaluations of the diagnostic performance of dm, dbt, dce mri, dwi, and their combination for the diagnosis of breast cancer. Front Oncol (2021) 11:725922. doi: 10.3389/fonc.2021.725922
10
NiuSYuTCaoYDongYLuoYJiangX. Digital breast tomosynthesis-based peritumoral radiomics approaches in the differentiation of benign and malignant breast lesions. Diagn Interv Radiol (2022) 28(3):217–25. doi: 10.5152/dir.2022.20664
11
SamalaRKChanH-PHadjiiskiLHelvieMARichterCDChaKH. Breast cancer diagnosis in digital breast tomosynthesis: effects of training sample size on multi-stage transfer learning using deep neural nets. IEEE Trans Med Imaging (2019) 38(3):686–96. doi: 10.1109/TMI.2018.2870343
12
BaiJPosnerRWangTYangCNabaviS. Applying deep learning in digital breast tomosynthesis for automatic breast cancer detection: a review. Med Image Anal (2021) 71:102049. doi: 10.1016/j.media.2021.102049
13
TagliaficoASBignottiBRossiFMatosJCalabreseMValdoraFet al. Breast cancer ki-67 expression prediction by digital breast tomosynthesis radiomics features. Eur Radiol Exp (2019) 3(1):36. doi: 10.1186/s41747-019-0117-2
14
GanLMaMLiuYLiuQXinLChengYet al. A clinical-radiomics model for predicting axillary pathologic complete response in breast cancer with axillary lymph node metastases. Front Oncol (2021) 11:786346. doi: 10.3389/fonc.2021.786346
15
GèronA. Hands-on machine learning with scikit-learn & TensorFlow. USA O’Reilly Media, Inc.: Sebastopol, CA: Gravenstein Highway North. (2017). p. 95472. Available at: https://www.knowledgeisle.com/wp-content/uploads/2019/12/2-Aurélien-Géron-Hands-On-Machine-Learning-with-Scikit-Learn-Keras-and-Tensorflow_-Concepts-Tools-and-Techniques-to-Build-Intelligent-Systems-O’Reilly-Media-2019.pdf
16
HanchuanPFuhuiLDingC. Feature selection based on mutual information criteria of max-dependency, max-relevance, and min-redundancy. IEEE Trans Pattern Anal Mach Intell (2005) 27(8):1226–38. doi: 10.1109/TPAMI.2005.159
17
MenzeBHKelmBMMasuchRHimmelreichUBachertPPetrichWet al. A comparison of random forest and its gini importance with standard chemometric methods for the feature selection and classification of spectral data. BMC Bioinf (2009) 10:213. doi: 10.1186/1471-2105-10-213
18
FayMPProschanMA. Wilcoxon–Mann–Whitney or t-test? on assumptions for hypothesis tests and multiple interpretations of decision rules. Stat Surv (2010) 4:1–39. doi: 10.1214/09-SS051
19
FawcettT. An introduction to ROC analysis. Pattern Recogn Lett (2006) 27:861–74. doi: 10.1016/j.patrec.2005.10.010
20
ChenXZhangYZhouJWangXLiuXNieKet al. Diagnosis of architectural distortion on digital breast tomosynthesis using radiomics and deep learning. Front Oncol (2022) 12:991892. doi: 10.3389/fonc.2022.991892
21
SakaiAOnishiYMatsuiMAdachiHTeramotoASaitoKet al. A method for the automated classification of benign and malignant masses on digital breast tomosynthesis images using machine learning and radiomic features. Radiol Phys Technol (2020) 13(1):27–36. doi: 10.1007/s12194-019-00543-5
Summary
Keywords
radiomic, predictive model, breast cancer, AI, tomosynthesis (DBT)
Citation
Murtas F, Landoni V, Ordòñez P, Greco L, Ferranti FR, Russo A, Perracchio L and Vidiri A (2023) Clinical-radiomic models based on digital breast tomosynthesis images: a preliminary investigation of a predictive tool for cancer diagnosis. Front. Oncol. 13:1152158. doi: 10.3389/fonc.2023.1152158
Received
27 January 2023
Accepted
24 April 2023
Published
12 May 2023
Volume
13 - 2023
Edited by
Mark Trombetta, Allegheny Health Network, United States
Reviewed by
Lorenzo Ugga, University of Naples Federico II, Italy; Ghazaleh Amjad, Iran University of Medical Sciences, Iran
Updates
Copyright
© 2023 Murtas, Landoni, Ordòñez, Greco, Ferranti, Russo, Perracchio and Vidiri.
This is an open-access article distributed under the terms of the Creative Commons Attribution License (CC BY). The use, distribution or reproduction in other forums is permitted, provided the original author(s) and the copyright owner(s) are credited and that the original publication in this journal is cited, in accordance with accepted academic practice. No use, distribution or reproduction is permitted which does not comply with these terms.
*Correspondence: Valeria Landoni, valeria.landoni@ifo.it
Disclaimer
All claims expressed in this article are solely those of the authors and do not necessarily represent those of their affiliated organizations, or those of the publisher, the editors and the reviewers. Any product that may be evaluated in this article or claim that may be made by its manufacturer is not guaranteed or endorsed by the publisher.