
95% of researchers rate our articles as excellent or good
Learn more about the work of our research integrity team to safeguard the quality of each article we publish.
Find out more
ORIGINAL RESEARCH article
Front. Oncol. , 31 March 2023
Sec. Neuro-Oncology and Neurosurgical Oncology
Volume 13 - 2023 | https://doi.org/10.3389/fonc.2023.1145676
This article is part of the Research Topic Research Progress on Immune Microenvironment and Molecular Mechanism of Glioma View all 9 articles
 Ying Zhang1†
 Wei Zhang2†Qiyou Yuan3Wenqing Hong4
 Ping Yin5Tingting Shen1Lutong Fang1Junlan Jiang1Fangxiao Shi1
 Weiwei Chen3*
Background: It is well-established that patients with glioma have a poor prognosis. Although the past few decades have witnessed unprecedented medical advances, the 5-year survival remains dismally low.
Objective: This study aims to investigate the role of transmembrane protein-related genes in the development and prognosis of glioma and provide new insights into the pathogenesis of the disease
Methods: The datasets of glioma patients, including RNA sequencing data and relative clinical information, were obtained from The Cancer Genome Atlas (TCGA), Chinese Glioma Genome Atlas (CGGA) and Gene Expression Omnibus (GEO) databases. Prognostic transmembrane protein-related genes were identified by univariate Cox analysis. New disease subtypes were recognized based on the consensus clustering method, and their biological uniqueness was verified via various algorithms. The prognosis signature was constructed using the LASSO-Cox regression model, and its predictive power was validated in external datasets by receiver operating characteristic (ROC) curve analysis. An independent prognostic analysis was conducted to evaluate whether the signature could be considered a prognostic factor independent of other variables. A nomogram was constructed in conjunction with traditional clinical variables. The concordance index (C-index) and Decision Curve Analysis (DCA) were used to assess the net clinical benefit of the signature over traditional clinical variables. Seven different softwares were used to compare the differences in immune infiltration between the high- and low-risk groups to explore potential mechanisms of glioma development and prognosis. Hub genes were found using the random forest method, and their expression was based on multiple single-cell datasets.
Results: Four molecular subtypes were identified, among which the C1 group had the worst prognosis. Principal Component Analysis (PCA) results and heatmaps indicated that prognosis-related transmembrane protein genes exhibited differential expression in all four groups. Besides, the microenvironment of the four groups exhibited significant heterogeneity. The 6 gene-based signatures could predict the 1-, 2-, and 3-year overall survival (OS) of glioma patients. The signature could be used as an independent prognosis factor of glioma OS and was superior to traditional clinical variables. More immune cells were infiltrated in the high-risk group, suggesting immune escape. According to our signature, many genes were associated with the content of immune cells, which revealed that transmembrane protein-related genes might influence the development and prognosis of glioma by regulating the immune microenvironment. TMEM158 was identified as the most important gene using the random forest method. The single-cell datasets consistently showed that TMEM158 was expressed in multiple malignant cells.
Conclusion: The expression of transmembrane protein-related genes is closely related to the immune status and prognosis of glioma patients by regulating tumor progression in various ways. The interaction between transmembrane protein-related genes and immunity during glioma development lays the groundwork for future studies on the molecular mechanism and targeted therapy of glioma.
Glioma accounts for the largest proportion of malignant craniocerebral tumors (1), with high invasiveness and lethality (2). Clinical cancer research has made great progress in recent years. Nonetheless, the overall survival (OS) remains poor (3). Current treatment alternatives include radical surgical resection, radiotherapy, and chemotherapy. However, these conventional approaches exhibit many limitations in treating this malignant disease, with high recurrence risks. Moreover, radiotherapy and chemotherapy can lead to the toxicity of other important organs, resulting in the lowered life quality of patients. Therefore, emphasis should be placed on comprehensive and individualized treatment, which emphasizes the importance of the quest to identify more specific biomarkers for glioma.
The transmembrane protein (TMEM) family refers to a group of proteins that span the lipid bilayer; however, their structure, biological functions and effects have been largely underinvestigated (4). TMEMs have been documented in all kinds of cells, cytomembranes, the mitochondria, endoplasmic reticulum (ER), and lysosome or Golgi apparatus. Some studies have revealed that different TMEM genes are up or downregulated in cancers, suggesting their potential as tumor suppressors or promoters. Their role has also been described as chemotherapeutic resistance and response to anticancer treatments (5). Current evidence suggests that TMEM proteins are involved in cancer-related signaling pathways, significantly impacting cancer metastasis, recurrence, and patient survival. In ovarian cancer, TMEM119 has been demonstrated to promote tumor cell proliferation, invasion and migration by activating the PDGFRB/PI3K/AKT signaling pathway (6). In hepatocellular carcinoma, TMEM206 upregulation has been associated with poorer patient prognosis (7). What’s more, TMEM43 upregulation has been closely associated with malignant brain tumors, and the inhibition of TMEM43 expression inhibited the growth of brain tumor cells in vitro and in vivo (8). Hence, identifying TMEMs involved in tumor development and progression is a promising approach to finding new targets for glioma therapy.
In this study, we probed different public online datasets from the GEO, TCGA and CGGA databases. 22 TMEM genes were identified in glioma patients, and a prognostic signature was established based on six prognosis-related TMEM genes. The relationship between the signature and clinical attributes and cancer characteristics was assessed. Our signature could accurately predict the clinical outcomes of glioma patients and could be used as an independent prognostic factor, providing new insights for exploring the molecular mechanisms and targeted treatments in this patient population. The random forest method showed that TMEM158 is a potential biomarker for diagnosing and treating glioma.
First, HTSeq-FPKM gene expression data and relative clinical information were downloaded from The Cancer Genome Atlas (TCGA) database (https://portal.gdc.cancer.gov/) as the training group. After patients without complete survival data were excluded, 631 glioma patients with complete follow-up data and follow-up time longer than 30 days were enrolled. During the validation process, the same inclusion criteria were adopted, from the Chinese Glioma Genome Atlas (CGGA) database (http://www.cgga.org.cn/), 618 glioma patients were included from the dataset CGGA-693 and 306 glioma patients from the dataset CGGA-325. 249 glioma patients were enrolled in the dataset GSE16011 (https://www.ncbi.nlm.nih.gov/geo/query/acc.cgi?acc=GSE16011) downloaded from the Gene Expression Omnibus (GEO) database. Using the “Combat” algorithm from the R package “sva”, batch effects due to the abiotic bias were removed among the TCGA-glioma, CGGA-693, CGGA-325, and GSE16011 datasets (9). Finally, 22 transmembrane protein-related genes were obtained and 14 present in all four datasets (ANO1, TMEM17, TMEM25, TMEM45A, TMEM88, TMEM97, TMEM98, TMEM140, TMEM156, TMEM158, TMEM176A, TMEM43, TMEM116) (10).
The R package “survival” was used to conduct the univariate Cox and Kaplan Meier (KM) survival analyses in the TCGA-glioma, CGGA-693, CGGA-325, and GSE16011 datasets. To ensure the accuracy of the results, a P value< 0.001 was used as the screening criteria to identify transmembrane protein-related prognostic genes. The R package “ConsensusClusterPlus” was used for unsupervised clustering to identify new subtypes to further understand the prognostic value of transmembrane protein-related prognostic genes (11). The number of new subgroupswase was based on the consensus cumulative distribution function (CDF) plot, delta area plot, and cluster consensus. The packages “survival” and “survminer” were applied to conduct KM survival analysis and the log-rank test on transmembrane protein subtypes. The heatmap showed the differential expression profiles of all transmembrane protein-related prognostic genes in the four subtypes. Principal Component Analysis (PCA) was performed to reduce the dimensionality of the data and verify differential expression patterns among various subtypes. The Microenvironment Cell Populations-counter (MCP-Counter) method was used to evaluate the abundance of immune cells in the subtypes (12). Moreover, the Estimation of Stromal and Immune cells in Malignant Tumors using Expression data (ESTIMATE) algorithm was adopted to estimate mesenchymal and immune cells in malignant tumor tissues and calculate the tumor purity of different molecular subpopulations (13). In addition, we applied the gene set variation analysis (GSVA) algorithm to compare the tumor microenvironment (TME) differences (14, 15). Moreover, we compared the differential HLA expression levels in different subtypes.
Using the TCGA-glioma dataset as the training cohort, the Lasso-Cox regression analysis was performed to screen out nine transmembrane proteins-related prognostic genes (TPRPGs), and the multicollinearity was eliminated. At last, a risk score signature was obtained by multiplying the β (Coef) value by the TPRPG expression value as follows (β1*TPRPG1+β2* TPRPG2 +β3* TPRPG3+⋯+βn* TPRPGn), where β refers to the coefficient of TPRPGs (16, 17). The median risk score was set as the threshold to divide 631 patients into high- or low-risk groups. Then KM survival and receiver operating characteristic (ROC) analyses were conducted. To determine whether the signature could be used as an independent prognosis index of clinical traits, including age, gender, and staging, univariate and multivariate Cox regression analyses were performed on age, gender, staging and the signature of glioma patients. Decision Curve Analysis (DCA) was conducted to assess whether the signature could benefit patients. Additionally, we used the R package “rms” to improve the accuracy during glioma prognosis prediction to construct a nomogram based on multivariate characteristics. The ROC and calibration curves were depicted to evaluate the accuracy of the nomogram.
Seven different softwares (12, 18–23) were used to quantify and compare the abundance of immune infiltration between high- and low-risk groups. Moreover, the Pearson correlation between the signature genes and risk scores with immune cell contents was calculated. In a study by Thorsson V et al. (24), immunogenomics analysis was conducted on more than 10000 tumors, and six immune subtypes of pan-cancer (C1 (wound healing), C2 (IFN-g dominant), C3 (inflammatory), C4 (lymphocyte depleted), C5 (immunologically quiet), C6 (TGF-β dominant) were identified. These immune subtypes could be used to identify patterns of immune responses that may influence prognosis. Three main immune types were identified in the TCGA-glioma, namely C3 (inflammatory), C4 (lymphocyte depleted), and C5 (immunologically quiet). Finally, we assessed the distribution of each immune subtype in the at-risk population.
According to the random forest algorithm, we sorted the genes in the signature based on the survival importance to determine hub genes (25). Moreover, the Tumor Immune Single-cell Hub (TISCH) database was used to locate the expression profiles of the hub gene at the single-cell level (26).
The flowchart of this study is shown in Figure 1. Nine key TPRPGs (ANO1, TMEM25, TMEM45A, TMEM88, TMEM97, TMEM140, TMEM158, TMEM176A, and TMEM43) were related to prognosis (Figure 2A). Based on the integrated results from the consensus cumulative distribution function (CDF) plot, delta area plot, and cluster-consensus, the optimal number of clusters was determined to be four, indicating the presence of four transmembrane protein-related subtypes (C1, C2, C3, C4)(Figures 2B–E). The PCA plots (Figures 2F, G) and the heatmap (Figure 2H) showed that the prognostic transmembrane protein-related genes exhibited differential expression in the four subgroups. Among all groups, most deaths were observed in C1 (Figure 3A). Based on KM survival analysis, C1 had the worst prognosis (Figure 3B). The tumor purity of C1 was the lowest, while it was the highest in C2 (Figure 3C). Consistent with the results from the ESTIMATE algorithm, almost all TME-related scores were highest in the C1 subgroup based on the signature (Figure 3D). The abundance of immune and non-immune cells was higher in C1 than in other subgroups (Figure 3E). Besides, HLA expression in C1 was the highest (Figure 3F).
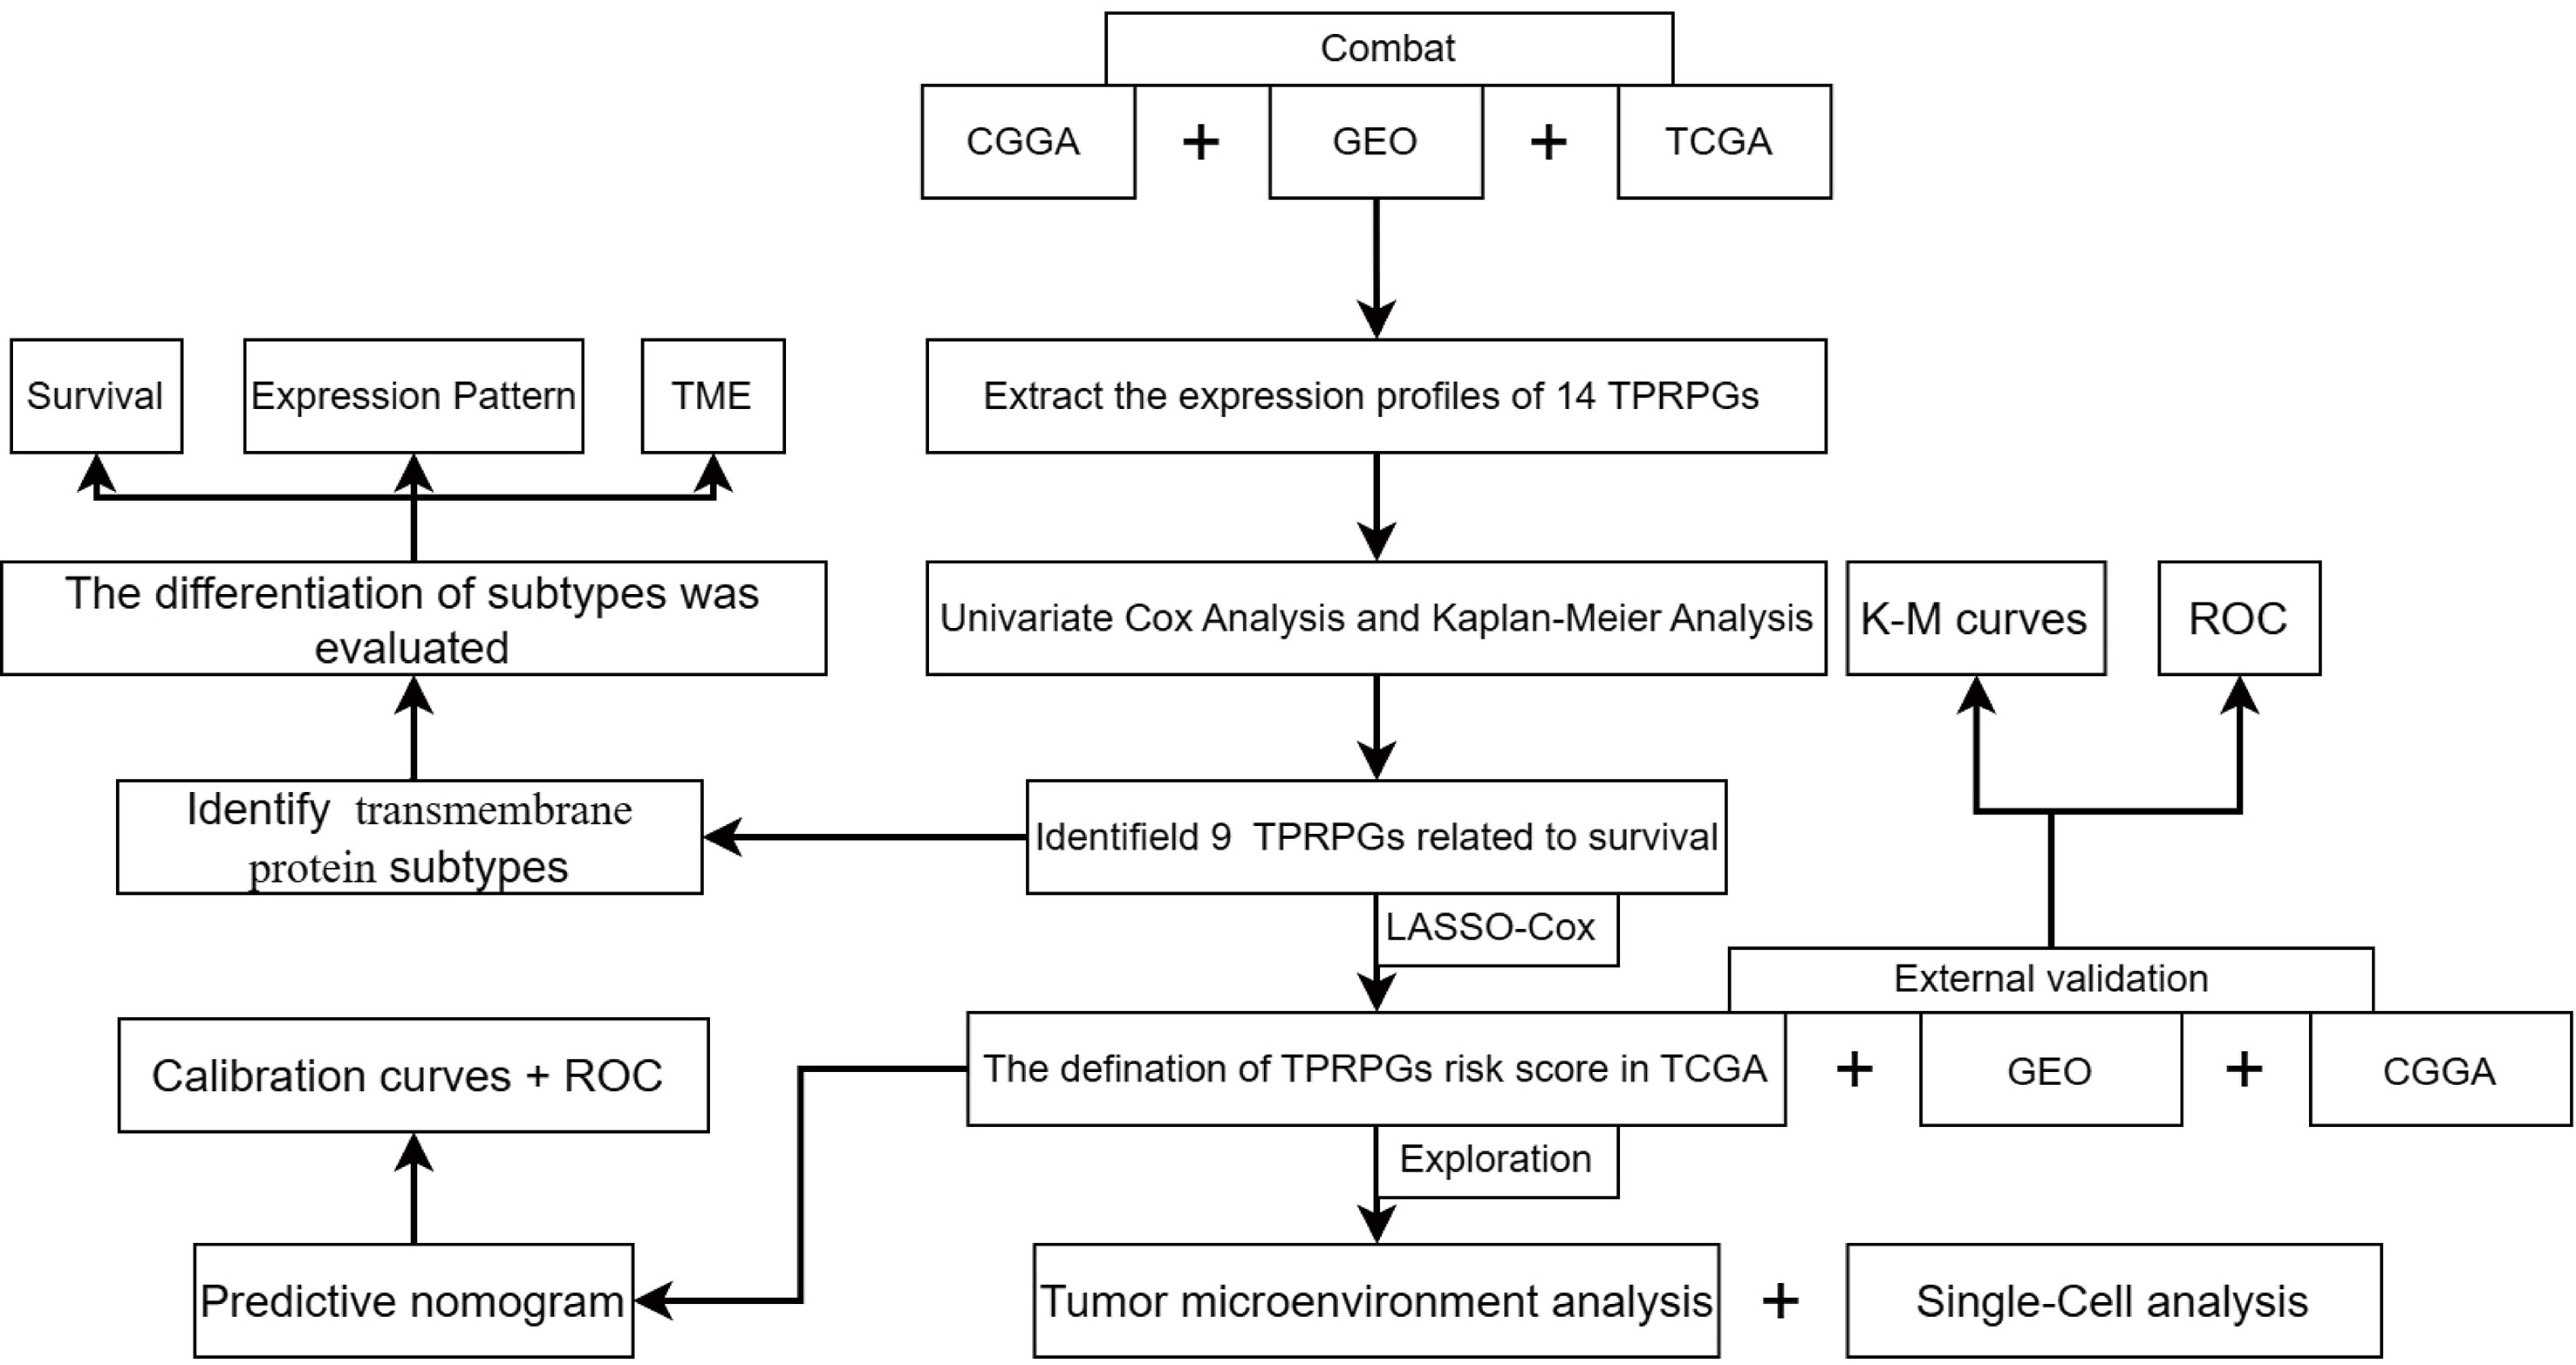
Figure 1 The work flowchart.
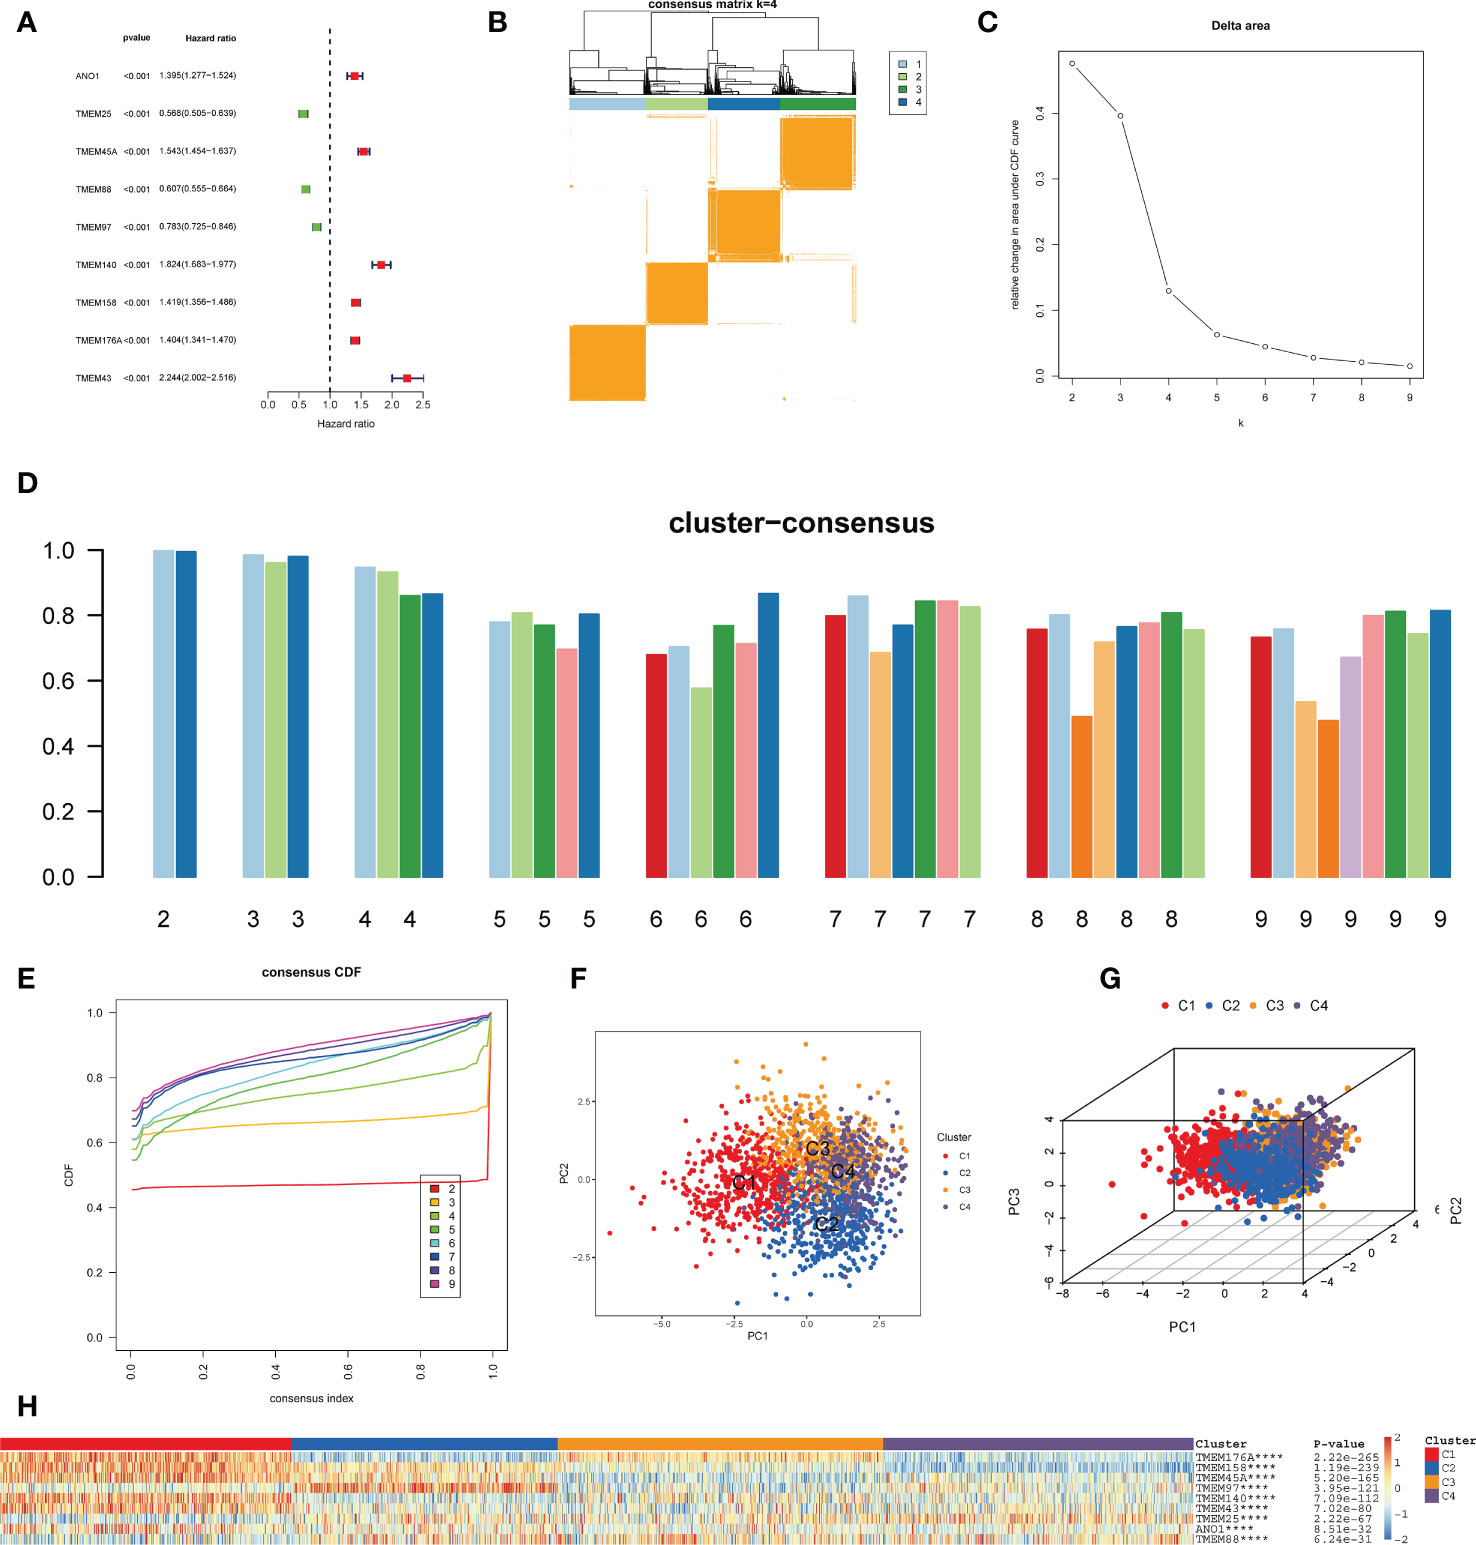
Figure 2 Identification of transmembrane protein-related subtypes. (A) Forest plot of nine prognostic transmembrane protein-related genes in glioma based on the univariate Cox regression analysis. (B) Subgroups of glioma defined by nine prognostic transmembrane protein-related genes. The 4 cohorts’ consensus score matrix for all samples when k =4. When two random samples had a higher consensus score in distinct interactions, they were more likely to be clustered. (C) The Delta Area Plot shows the relative change between k and k-1 relative to the area under the CDF curve. When k = 5, the area under the curve only increases slightly, so 4 was the appropriate k value. (D) Cluster-Consensus Plot shows the cluster-consensus value of each category under different k values (the mean of pairwise consensus values of members in the cluster). The higher (lower) the value represents, the higher (lower) the stability. It can determine the cluster-consensus value under the same k value and between different k values. k= 4 is the most suitable choice for satisfying both the maximum clustering and relatively high Cluster-Consensus conditions. (E) The consistency Cumulative Distribution Function (CDF) plot shows the cumulative distribution function when k takes different values, which is used to determine when k takes what value; the CDF reaches an approximate maximum when the clustering analysis results are the most reliable. Given the small k value for the CDF negative slope, k=4 was selected. (F, G) The principal component analysis (PCA) of glioma samples. The points of different colors represent samples of different groups. A closer distance between the points suggests that the expression of transmembrane protein-related genes is similar. (H) The heatmap of the expression of transmembrane protein-related genes in the four types of samples. The rows represent genes, the columns represent samples, red indicates high expression, blue indicates low expression, and the categories of samples are marked with different colors on the top of the heatmap. Survival analysis was performed using univariate Cox regression analysis. Molecular subtypes were identified using the unsupervised hierarchical clustering method. Differential analysis was conducted using the Kruskal-Wallis test. ****p < 0.0001.

Figure 3 Discrimination of Different Subtypes. (A) The proportion of survival status of patients in four transmembrane protein-related subtypes. (B) Kaplan–Meier survival analysis of OS for patients with the four transmembrane protein-related subtypes. (C) Comparisons between the four subgroups in terms of tumor purity in tumor tissues. (D) Boxplots were used to display the expressions difference of tumor microenvironment signature. (E) Comparison of the abundance of immune-infiltrating cells among the four subgroups by the MCP-counter algorithm in tumor tissues. (F) Boxplots were used to display the expressions difference of HLA genes. ∗∗∗P < 0.001; ∗∗∗∗p < 0.0001. Survival analysis was conducted using the Kaplan-Meier method. Figure 2C adopted the Wilcoxon test method. Other Differential analyses were conducted using the Kruskal-Wallis test.
The LASSO regression model was conducted using the expression profile data of 9 transmembrane protein-related prognostic genes, and the transmembrane protein-related prognostic risk signature was then established. The “cv.glmnet” function was used to perform 10-fold cross-validation to identify six genes (TMEM45A, TMEM88, TMEM140, TMEM158, TMEM176A, and TMEM43) with a regression coefficient. The risk scoring formula was as follows: risk score = (0.166782270191739*TMEM45A) + (-0.105110143608762*TMEM88) + (0.429175423075546*TMEM140) + (0.333132856396644*TMEM158) + (0.275424964997017*TMEM176A)+(0.118615470161412*TMEM43) (Figures 4A–C). Univariate (Figure 4D) and multivariate (Figure 4E) Cox regression analyses were used to distinguish independent risk factors. Results showed that age, staging and risk score were independent predictors of OS in glioma patients. All patients were divided into high- or low-risk groups according to the median value in the training group. KM curves showed that the low-risk group had a relatively better prognosis (Figures 4F–I). Moreover, the 1-, 2-, and 3-year area under curve (AUC) values of the 6-gene risk signature yielded satisfactory sensitivity and specificity in both the training group and the external validation set (Figures 4J–M).
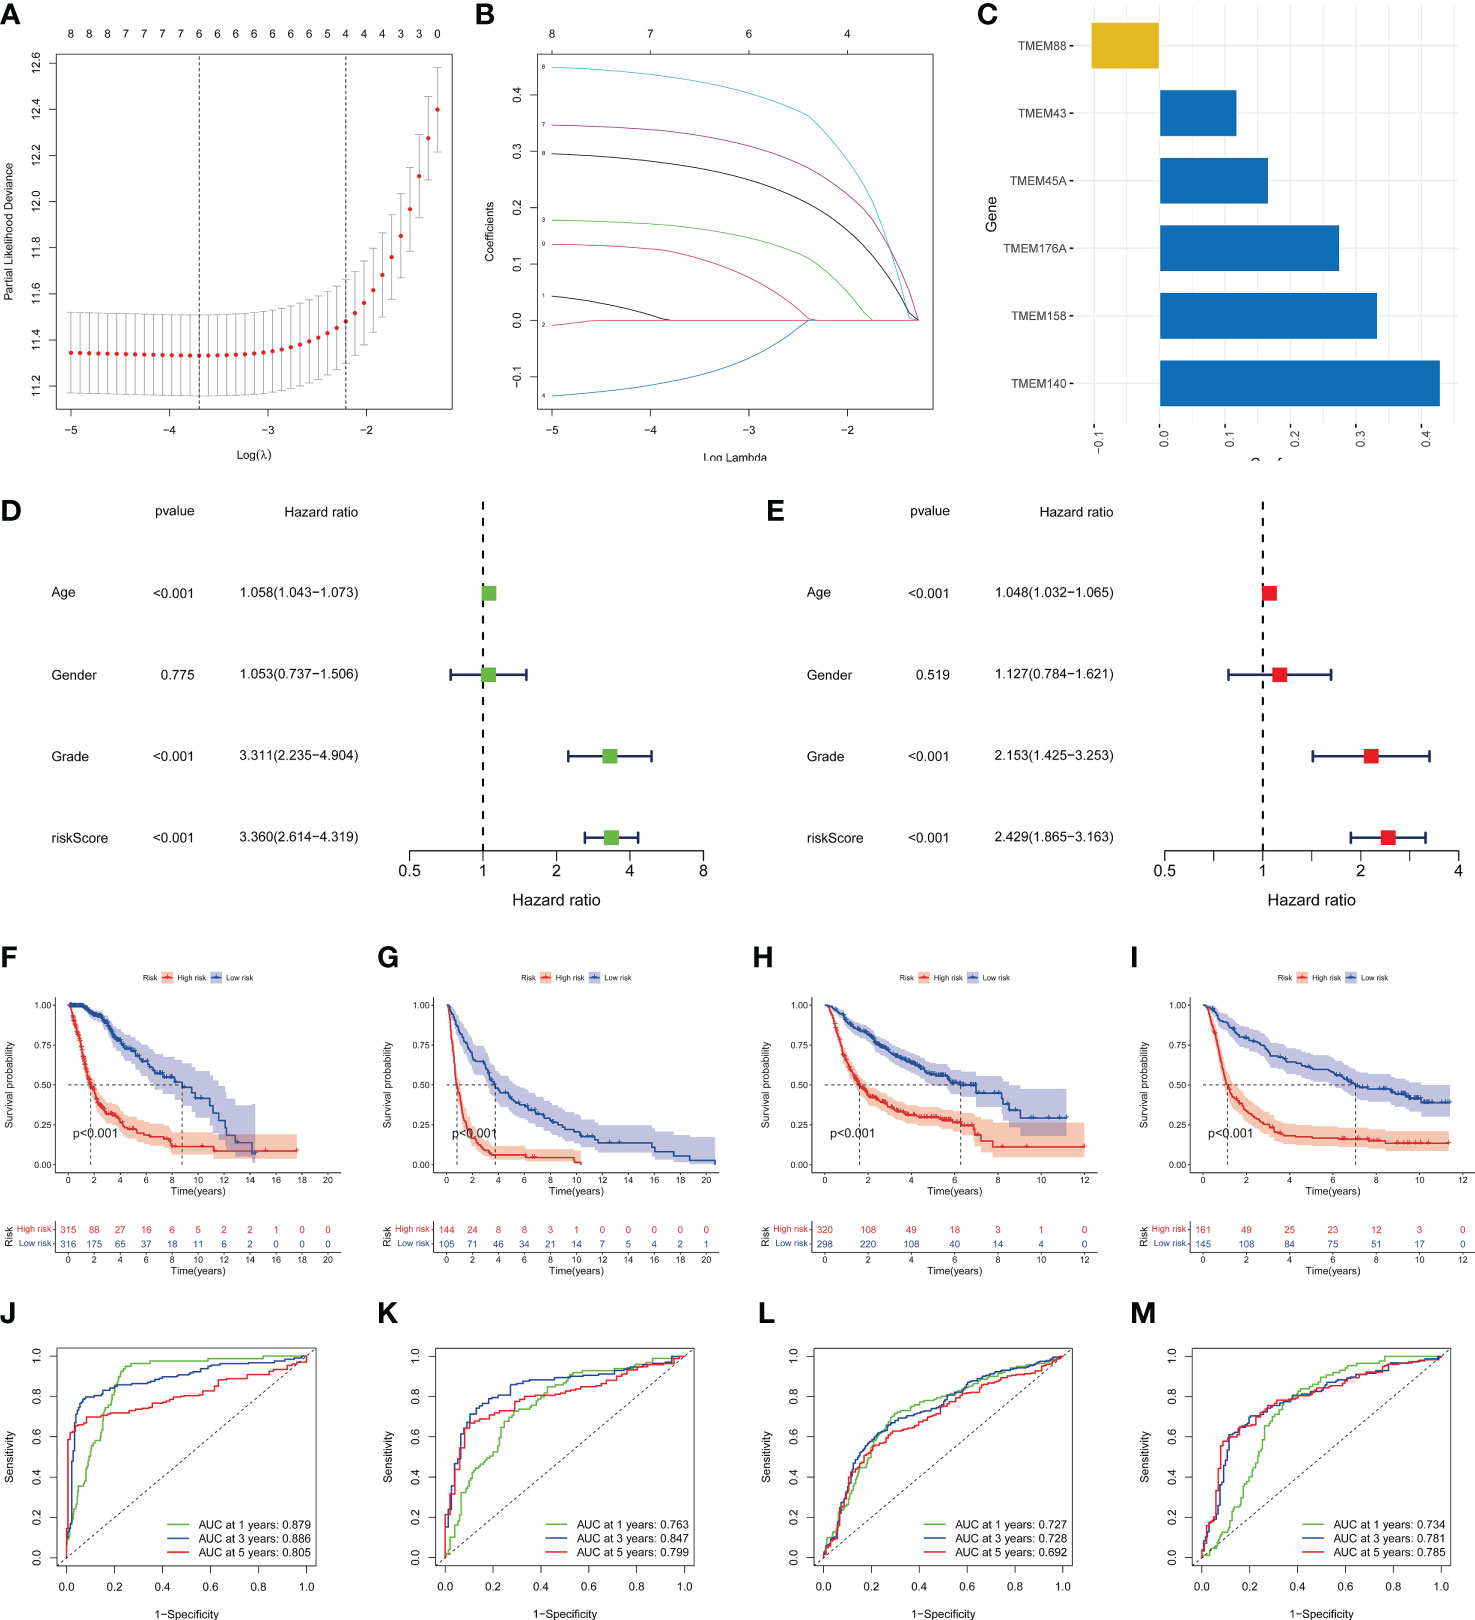
Figure 4 Identification of the transmembrane protein prognostic signature. (A, B) LASSO Cox regression analysis of the 9 OS-related transmembrane proteins. (C) The 6 genes included in the signature. Corresponding coefficients were depicted by horizontal bars, respectively. (D, E) Univariate and multivariate Cox regression revealed significant survival-related clinicopathological parameters in the forest plots diagram. (F-I) Kaplan–Meier OS curves with difference detection by log-rank test for patients from the training and validation datasets. TCGA-glioma, GSE16011, CGGA693, and CGGA325 datasets are arranged from left to right. (J-M) ROC analysis of the 6-genes signature in the four datasets.
The staging index is an important clinicopathological feature of glioma. Our results revealed that the risk score had significant differences in G2 and G3 grades (p value< 0.001) (Figure 5A). DCA plots illustrated a net clinical benefit of the signature to predict glioma survival compared with traditional clinical variables (Figure 5B). Then, a nomogram was established to predict the OS for glioma patients (Figure 5C). Based on the results of multivariate analysis, a score was assigned for each predictor, and three factors were integrated into the nomogram to predict OS in patients with glioma. The calibration curve showed that the 1-, 2-, and 3-year OS predicted by the nomogram were in accordance with the actual outcomes (Figure 5D). Besides, the 1-, 2-, and 3-year AUC values were 0.901, 0.856 and 0.775, respectively (Figure 5E).
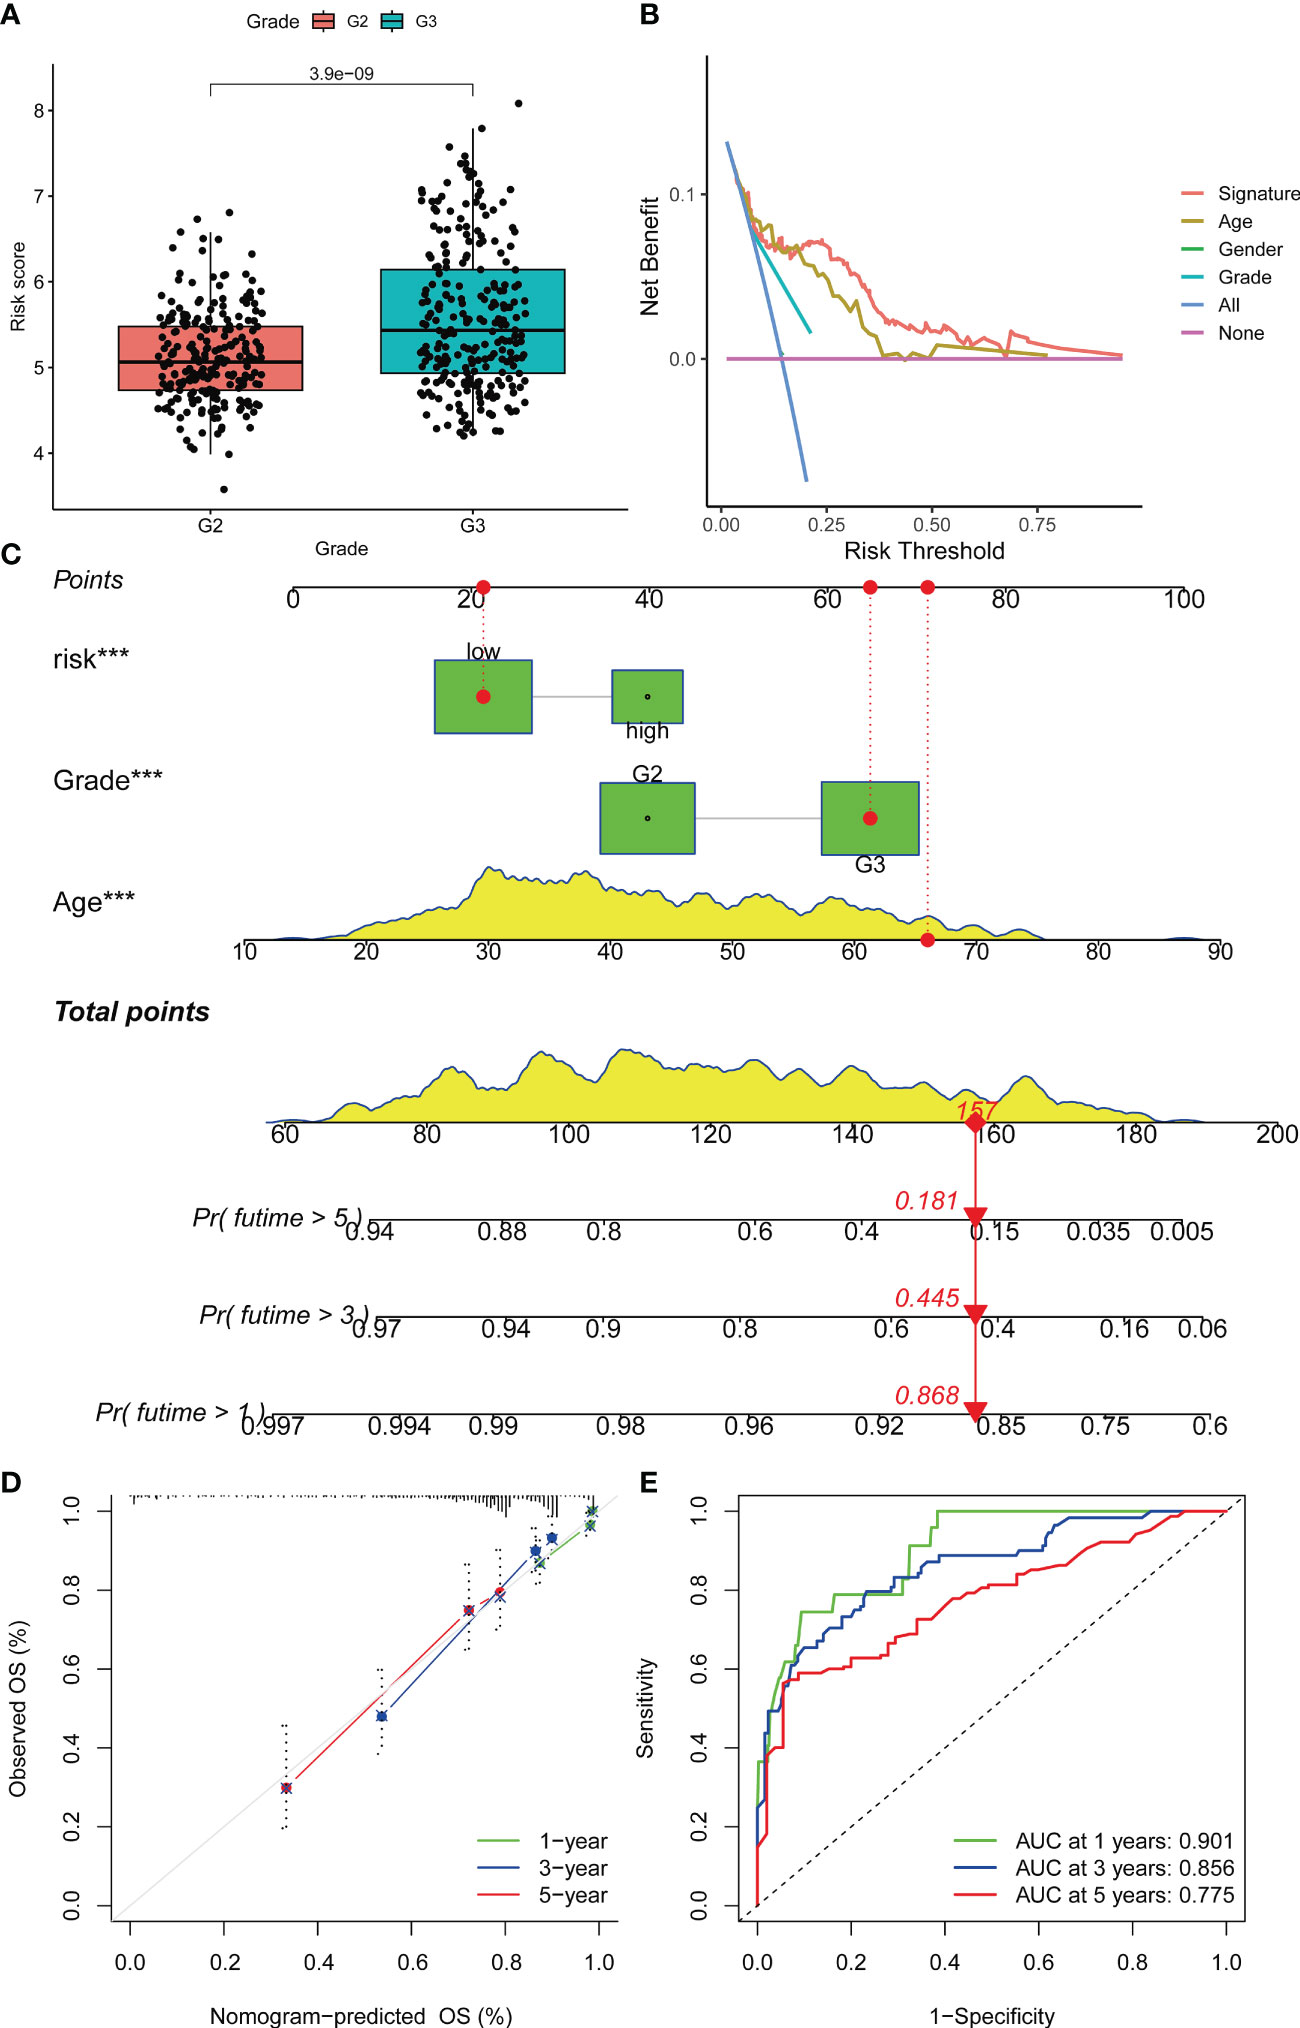
Figure 5 Prognostic prediction of glioma patients with other clinical factors based on the OS model. (A) Boxplots were used to display the difference in risk scores in different tumor grades. (B) Decision curve analysis of the constructed risk prediction model. Using the signature to predict patient survival can benefit the patient similar to other conventional clinical variables. (C) Nomogram integrating risk and clinical characteristics. (D) calibration of the nomogram at 1-year, 3- year and 5-year survival in the TCGA cohort. (E) Time-dependent ROC curve of the constructed nomogram model. Nomogram was built using the Multivariate proportional hazards model. Differential analyses were conducted using the Wilcoxon test. ***p < 0.001.
The high- and low-risk groups exhibited significant microenvironmental heterogeneity, and the high-risk group was associated with relatively more immune cell infiltration (Figure 6A). Glioma patients were identified as three immune subtypes, including inflammatory (immune C3), lymphocyte depleted (immune C4) and immunologically quiet (immune C5). C4 and C5 were the main types, while the latter had a higher risk score (Figures 6B, C). The risk score and six genes identified by the signature were correlated with the abundance of immune cells. Multi-software analysis showed that CD8+T cell, memory CD4+ T cell, Macrophage (M0, M1, M2), and Myeloid dendritic cell exhibited a low to moderate positive correlation with the risk score. Besides, a low to moderate negative correlation was found between B cells and the risk score (Figures 6D–J), demonstrating that transmembrane protein-related genes may influence the development and prognosis of glioma by regulating the immune microenvironment.
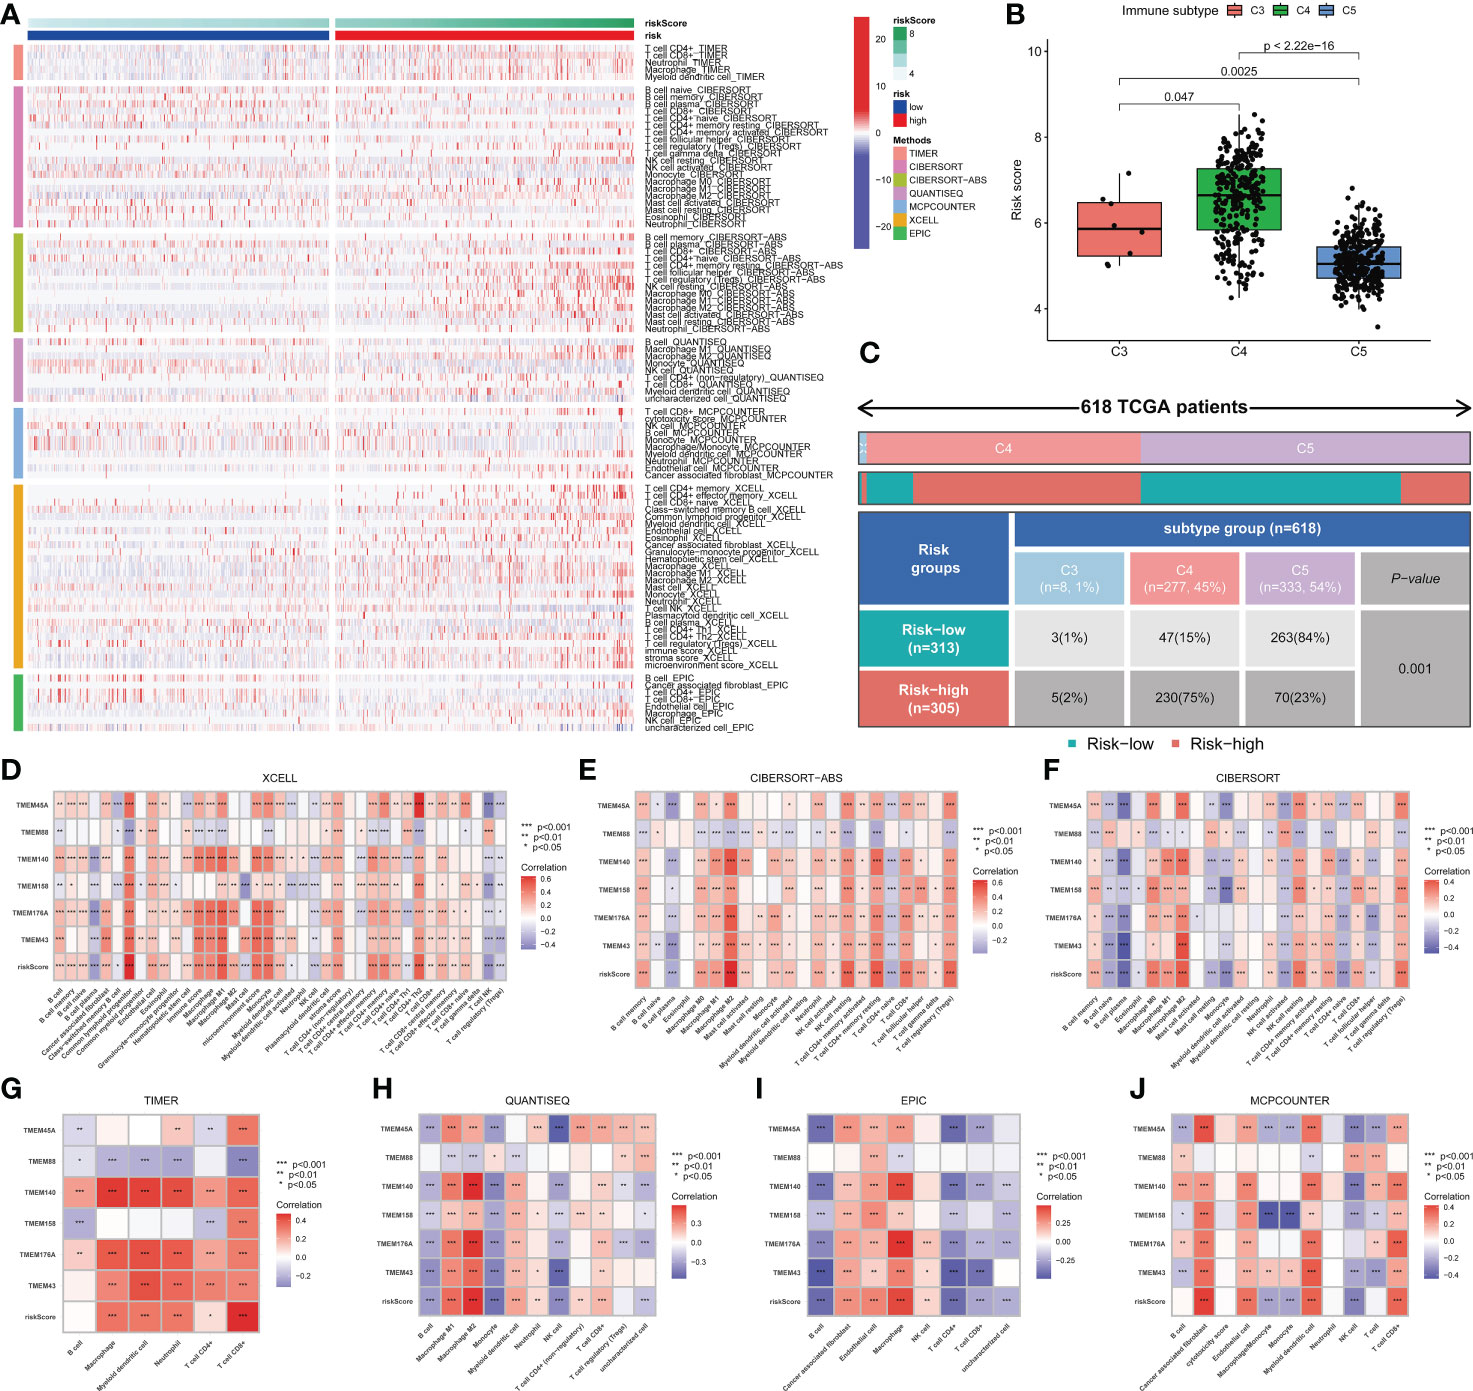
Figure 6 Immune cell infiltration in glioma. (A) Differences in immune cell infiltration between high- and low-risk patients. (B) Three immune types were identified in the TCGA-glioma dataset, namely Inflammatory (Immune C3), Lymphocyte Depleted (Immune C4) and Immunologically Quiet (Immune C5). Significant differences in risk scores were observed between different immune subtypes. (C) The association between risk groups with immune subtypes in the TCGA-Glioma cohort. (D-J) Correlation between risk score, genes in the model and different types of immune cell content based on 7 immune infiltration algorithms. Correlation analysis was conducted using Pearson correlation analysis. Differential analyses were conducted using the Wilcoxon test.
Further, we adopted the “randomForestSRC” R package to undergo feature selection. Figure 7A exhibited the relationship between the error rate and the number of classification trees and the out-of-bag feature importance of 6 genes, among which TMEM158 was the most important. The TISCH database was utilized to analyze the expression profile of TMEM158 based on the single-cell dataset Glioma_GSE148842 (Figure 7B). TMEM158 was mainly expressed in malignant cells but was low in oligodendrocytes (Figure 7C). Results from the 15 single-cell datasets were consistent, corroborating that TMEM158 was expressed in multiple malignant cells, especially in AC-like malignant cells (Figure 7D).
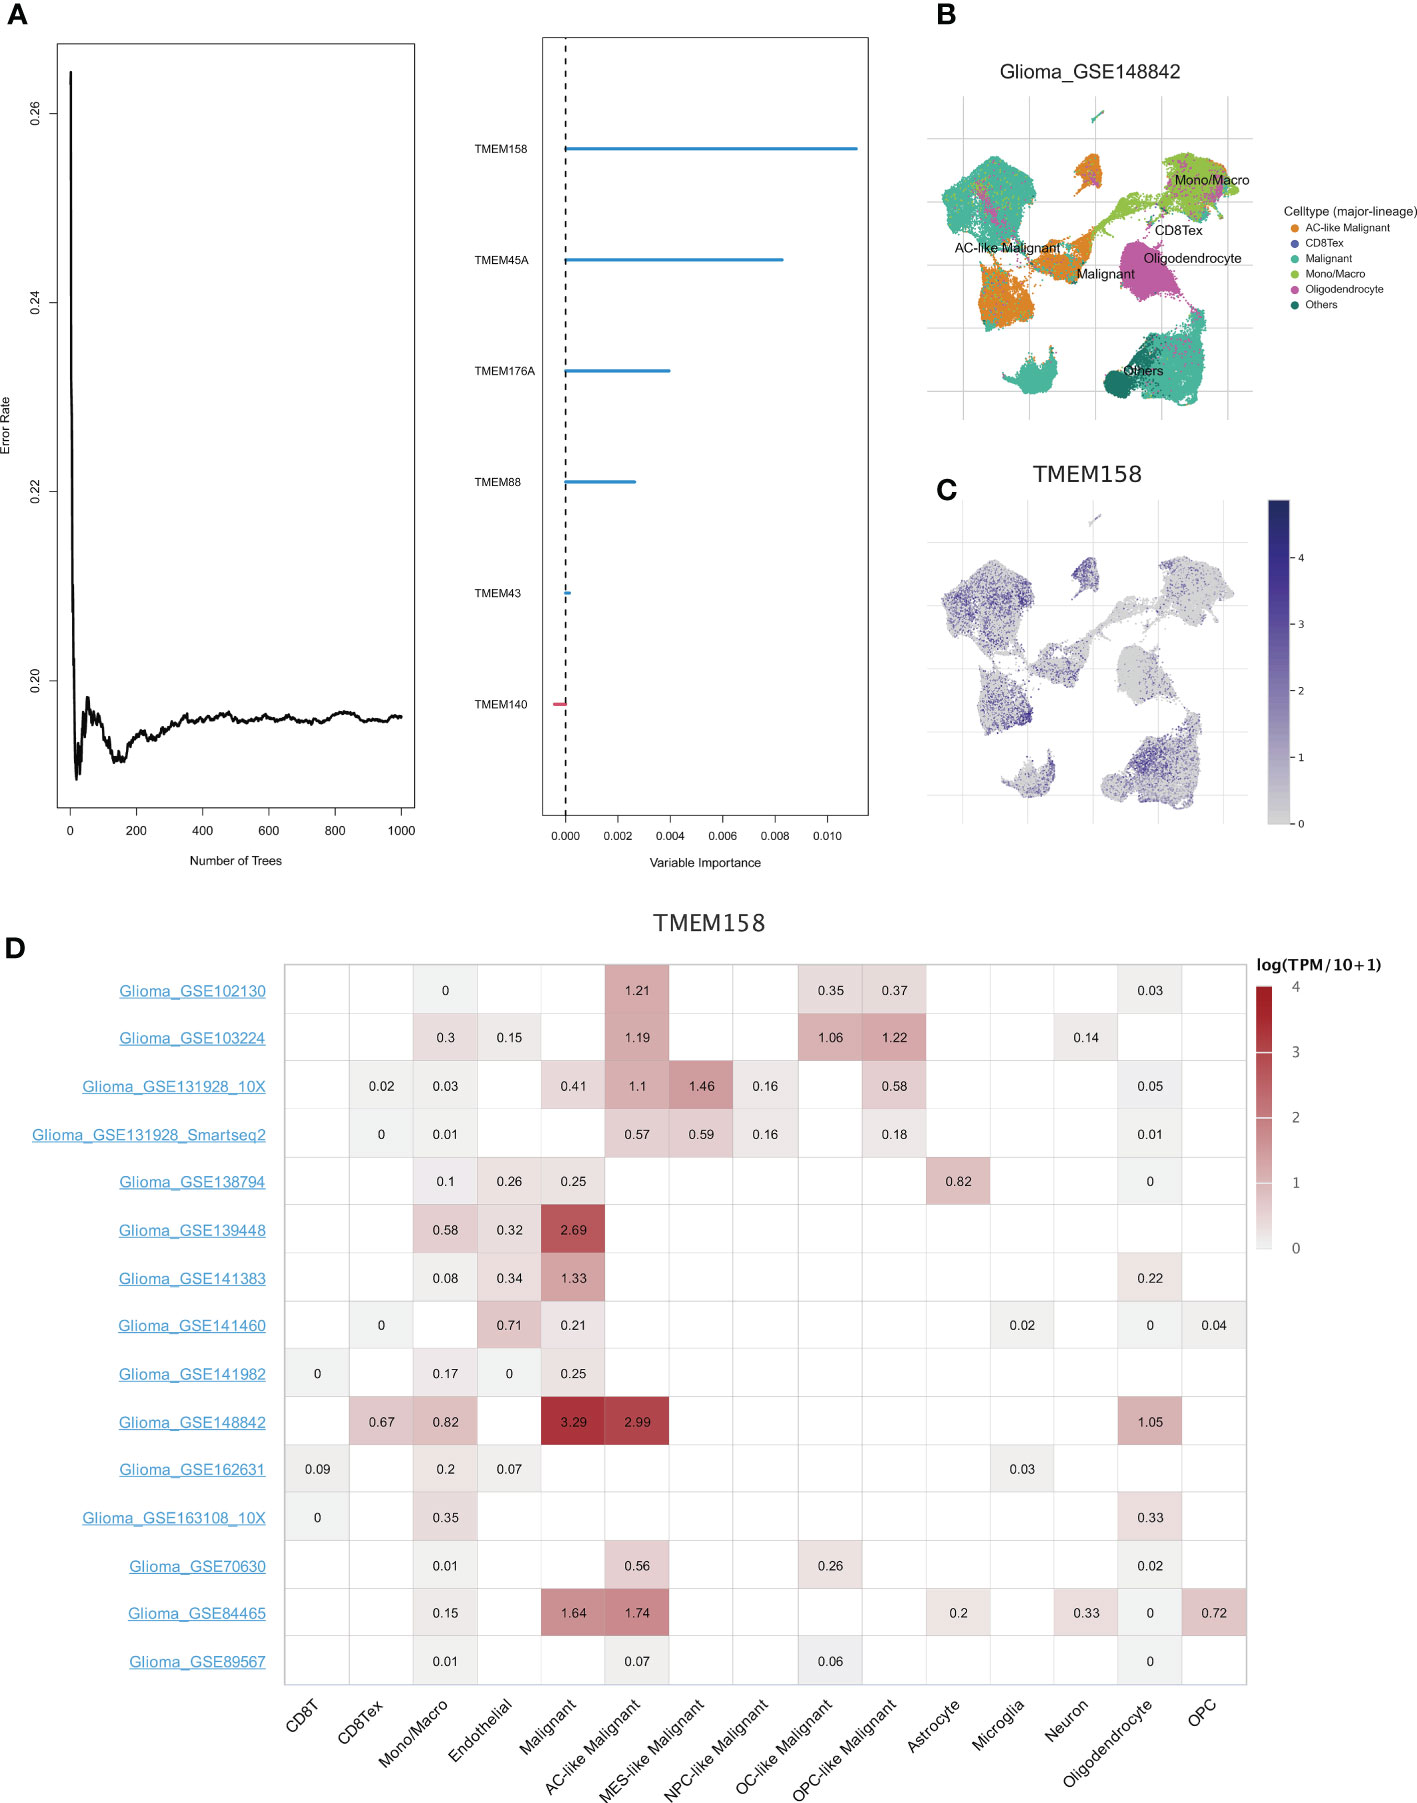
Figure 7 Identification of hub genes using the random forest algorithm. (A) The graph shows the error rate of the data as a function of the classification tree and the out-of-bag importance values for the predictors. (B) Annotation of all cell types in dataset GSE148842 based on the TISCH database. (C, D) Expressions of TMEM158 in GSE148842 and other Glioma single-cell datasets.
As the most prevalent primary tumor of the brain and spinal cord (27), glioma is widely thought to be derived from the neuroglial stem or progenitor cells (28). Due to the high recurrence rate and poor prognosis of glioma, it is essential to predict clinical outcomes to guide treatment strategies for this patient population. Conventional therapies, including surgery, chemotherapy, and radiotherapy, exhibit limitations in improving the clinical prognosis of glioma patients. The advent of immunotherapy has brought new hope, given its ability to penetrate the blood-brain barrier since the pioneering discovery of lymphatics in the central nervous system (29). However, not all patients can benefit from the long-term treatment course. Therefore, the quest for potent biomarkers should be emphasized for the optimal selection of patients for individualized treatment.
In this study, we found that the overall expression pattern of transmembrane protein-related genes was associated with malignant characteristics and the prognosis of glioma. Upon further validation, we inferred that these genes are significant for in-depth exploration of the pathogenesis of glioma. After the screening, six hub genes (TMEM45A, TMEM88, TMEM140, TMEM158, TMEM176A, and TMEM43) were identified, and a risk signature was constructed. The signature was validated using a series of approaches to more accurately and effectively predict clinical outcomes of glioma than traditional clinical variables and reflect clinicopathologic features associated with malignancy. In addition, we systematically analyzed the correlations between characteristic risk score-related genes and immune cell contents in gliomas and targeted the expression of hub genes based on 15 single-cell datasets. These findings may explain the poorer survival rates in the high-risk group to some extent and highlight the role of transmembrane protein-related genes in further stratifying the survival of glioma patients. Our transmembrane protein-related gene signature may be a vital auxiliary tool to assist clinicians in predicting the prognosis of glioma.
We analyzed the expression data of 14 transmembrane protein-related genes in glioma patients who were followed up for more than 30 days in the TCGA, CGGA and GEO databases and screened 9 transmembrane protein-related genes with prognostic significance. Finally, a 6-gene signature was built based on the risk genes TMEM45A, TMEM140, TMEM158, TMEM176A and TMEM43, and the protective gene TMEM88 by comparing their coefficient values. Over the years, these genes have been extensively studied, especially in some cancer types. In this respect, TMEM45A has been associated with various cancer features, such as cell proliferation, invasion, migration, and Epithelial-Mesenchymal Transition (EMT), and silencing TMEM45A can reverse cisplatin resistance (30–33). TMEM140 has been underexplored in the field of oncology. However, it can reportedly inhibit herpes simplex virus-1 (HSV-1) proliferation by selectively blocking the exit of the viral nucleocapsid during viral assembly (34). TMEM158 plays an important role in many cancers since it is upregulated in the renin-angiotensin system (Ras)-induced senescence process (35). Moreover, TMEM158 has been reported as the key regulator for tumorigenesis and drug resistance in colorectal cancer (36). What’s more, overexpression of TMEM158 is significantly associated with clinicopathologic features (including tumor size, TNM staging, and vascular infiltration) and poor prognosis of pancreatic cancer (PC) patients, and it could promote proliferation, migration, and invasion of PC cells through activation of transforming growth factor (TGF)-β1 and Phosphoinositide 3-Kinase (PI3K)/protein kinase B (AKT) signaling pathways (37).
Cuajungco MP et al. confirmed that human TMEM176A and 176B protein levels were significantly elevated in lymphoma and lung carcinoma but not in normal tissues, which substantiated that TMEM176A and 176B could be potential biomarkers for some human cancers (38). An increasing body of evidence suggests that TMEM176A can inhibit tumor cell growth and migration by constraining extracellular signal-regulated kinase (ERK) signal transduction in lung, pancreatic and liver cancer (39–41). Intriguingly, upregulated TMEM176A expression has been demonstrated to prevent dendritic cell (DC) maturation and inhibit DC activity in the general population when DCs have been shown to mediate recovery from central nervous system damage and/or protective autoimmunity (42). These findings might illustrate its potential role as a risk factor in glioma. Moreover, TMEM43 has been correlated with different diseases. For example, the deficiency of TMEM43 is widely thought to cause arrhythmogenic right ventricular cardiomyopathy type 5 (ARVD5) (43). Furthermore, Jiang C et al. verified that high TMEM43 expression was closely related to brain tumor malignancy, and inhibiting the expression of TMEM43 in brain tumor cells could lead to its growth in vitro and in vivo (8). In contrast, the TMEM88 gene was found to be a protective factor against glioma in the present study. Consistently, TMEM88 upregulation can result in the decreased ability of cell proliferation and invasion dramatically in bladder cancer, and nude mouse models substantiated that the overexpression of TMEM88 prevents tumor formation and growth of bladder cancer cells (44). Similar findings have been reported in thyroid cancer (45). Overall, patients in the low-risk group had higher OS than those in the high-risk group based our novel signature. External dataset and internal KM validations demonstrated that the signature had good predictive efficacy and was independent of other clinical traits. Importantly, our novel signature could enable clinicians to assess patient survival more accurately and effectively.
The tumor microenvironment is a complex system that plays an essential role in the proliferation and progression of tumor cells. Based on our signature, it was found that differential TME features were displayed in the high- and low-risk group. Moreover, the low-risk group was associated with more significant immune cell infiltration. Meanwhile, the low-risk group had a better prognosis. Additionally, some types of immune cells like CD8+T cells, CD4+ memory T cells, Macrophages (M0, M1, M2), and Myeloid DCs were positively correlated with risk scores. In contrast, B cells and risk scores were negatively correlated, possibly due to potential immune escape in the high-risk group. Glioma-associated microglia or macrophages and medullary suppressor cells were the most infiltrated cell types in the TME of gliomas, and their levels negatively correlated with the prognosis of cancer. In addition, bone marrow-derived suppressor cells inhibit NK cell-mediated cytotoxic responses (46). Immune cells perform immune surveillance functions through cell migration. It has been established that glioma has a rather complex tumor immune microenvironment (TIME). Interestingly, glioma-associated myeloid cells significantly promoted the invasiveness of glioma tumor cells (47). Moreover, a high infiltration of regulatory T cells is closely associated with poor clinical outcomes in glioma (48). A study revealed that in the TIME of glioma patients, immune cell infiltration was elevated in the high-risk group, with higher infiltration of tumor immune cells correlated with more advanced tumor grade (49), consistent with our findings.
However, the limitations of our study should be acknowledged. Our findings were based on retrospective data from TCGA, CGGA and GEO databases, with missing data on treatment and relapse. Indeed, in vivo or in vitro experiments and prospective clinical studies are warranted to validate our findings.
In summary, this study identified a 6-gene signature with prognostic value for glioma patients. Our study presents a predictive model and biomarker for glioma patients and provides the foothold for further research to improve the outcomes of this patient population.
The original contributions presented in the study are included in the article/Supplementary Material. Further inquiries can be directed to the corresponding author.
YZ and WZ carried out the analysis and made tables and figures. YZ, WZ, QY, WH, PY, TS, LF, JJ, and FS wrote and revised the manuscript. WC, YZ, and WZ conceived the study. All authors contributed to the article and approved the submitted version.
The authors thank the reviewers for their valuable remarks.
The authors declare that the research was conducted in the absence of any commercial or financial relationships that could be construed as a potential conflict of interest.
All claims expressed in this article are solely those of the authors and do not necessarily represent those of their affiliated organizations, or those of the publisher, the editors and the reviewers. Any product that may be evaluated in this article, or claim that may be made by its manufacturer, is not guaranteed or endorsed by the publisher.
The Supplementary Material for this article can be found online at: https://www.frontiersin.org/articles/10.3389/fonc.2023.1145676/full#supplementary-material
1. Ostrom QT, Gittleman H, Stetson L, Virk SM, Barnholtz-Sloan JS. Epidemiology of gliomas. Cancer Treat Res (2015) 163:1–14. doi: 10.1007/978-3-319-12048-5_1
2. Ostrom QT, Bauchet L, Davis FG, et al. The epidemiology of glioma in adults: a "state of the science" review. Neuro Oncol (2014) 16(7):896–913. doi: 10.1093/neuonc/nou087
3. Lim M, Xia Y, Bettegowda C, Weller M. Current state of immunotherapy for glioblastoma. Nat Rev Clin Oncol (2018) 15(7):422–42. doi: 10.1038/s41571-018-0003-5
4. Marx S, Dal Maso T, Chen JW, et al. Transmembrane (TMEM) protein family members: Poorly characterized even if essential for the metastatic process. Semin Cancer Biol (2020) 60:96–106. doi: 10.1016/j.semcancer.2019.08.018
5. Schmit K, Michiels C. TMEM proteins in cancer: A review. Front Pharmacol (2018) 9:1345. doi: 10.3389/fphar.2018.01345
6. Sun T, Bi F, Liu Z, Yang Q. TMEM119 facilitates ovarian cancer cell proliferation, invasion, and migration via the PDGFRB/PI3K/AKT signaling pathway. J Transl Med (2021) 19(1):111. doi: 10.1186/s12967-021-02781-x
7. Zhang L, Liu SY, Yang X, Wang YQ, Cheng YX. TMEM206 is a potential prognostic marker of hepatocellular carcinoma. Oncol Lett (2020) 20(5):174. doi: 10.3892/ol.2020.12035
8. Jiang C, Zhu Y, Zhou Z, et al. TMEM43/LUMA is a key signaling component mediating EGFR-induced NF-κB activation and tumor progression. Oncogene (2017) 36(20):2813–23. doi: 10.1038/onc.2016.430
9. Johnson WE, Li C, Rabinovic A. Adjusting batch effects in microarray expression data using empirical bayes methods. Biostatistics (2007) 8(1):118–27. doi: 10.1093/biostatistics/kxj037
10. Liberzon A, Birger C, Thorvaldsdóttir H, Ghandi M, Mesirov JP, Tamayo P. The molecular signatures database (MSigDB) hallmark gene set collection. Cell Syst (2015) 1(6):417–25. doi: 10.1016/j.cels.2015.12.004
11. Wilkerson MD, Hayes DN. ConsensusClusterPlus: a class discovery tool with confidence assessments and item tracking. Bioinformatics (2010) 26(12):1572–3. doi: 10.1093/bioinformatics/btq170
12. Becht E, Giraldo NA, Lacroix L, et al. Estimating the population abundance of tissue-infiltrating immune and stromal cell populations using gene expression. Genome Biol (2016) 17(1):218. doi: 10.1186/s13059-016-1070-5
13. Yoshihara K, Shahmoradgoli M, Martínez E, et al. Inferring tumour purity and stromal and immune cell admixture from expression data. Nat Commun (2013) 4:2612. doi: 10.1038/ncomms3612
14. Mariathasan S, Turley SJ, Nickles D, et al. TGFβ attenuates tumour response to PD-L1 blockade by contributing to exclusion of T cells. Nature (2018) 554(7693):544–8. doi: 10.1038/nature25501
15. Hänzelmann S, Castelo R, Guinney J. GSVA: gene set variation analysis for microarray and RNA-seq data. BMC Bioinf (2013) 14:7. doi: 10.1186/1471-2105-14-7
16. Friedman J, Hastie T, Tibshirani R. Regularization paths for generalized linear models via coordinate descent. J Stat Software (2010) 33(1):1–22. doi: 10.18637/jss.v033.i01
17. Simon N, Friedman J, Hastie T, Tibshirani R. Regularization paths for cox's proportional hazards model via coordinate descent. J Stat Software (2011) 39(5):1–13. doi: 10.18637/jss.v039.i05
18. Newman AM, Liu CL, Green MR, et al. Robust enumeration of cell subsets from tissue expression profiles. Nat Methods (2015) 12(5):453–7. doi: 10.1038/nmeth.3337
19. Aran D, Hu Z, Butte AJ. xCell: digitally portraying the tissue cellular heterogeneity landscape. Genome Biol (2017) 18(1):220. doi: 10.1186/s13059-017-1349-1
20. Li T, Fan J, Wang B, et al. TIMER: A web server for comprehensive analysis of tumor-infiltrating immune cells. Cancer Res (2017) 77(21):e108–10. doi: 10.1158/0008-5472.CAN-17-0307
21. van Veldhoven CM, Khan AE, Teucher B, et al. Physical activity and lymphoid neoplasms in the European prospective investigation into cancer and nutrition (EPIC). Eur J Cancer (2011) 47(5):748–60. doi: 10.1016/j.ejca.2010.11.010
22. Tamminga M, Hiltermann TJN, Schuuring E, Timens W, Fehrmann RS, Groen HJ. Immune microenvironment composition in non-small cell lung cancer and its association with survival. Clin Transl Immunol (2020) 9(6):e1142. doi: 10.1002/cti2.1142
23. Finotello F, Mayer C, Plattner C, et al. Molecular and pharmacological modulators of the tumor immune contexture revealed by deconvolution of RNA-seq data. Genome Med (2019) 11(1):34. doi: 10.1186/s13073-019-0638-6
24. Thorsson V, Gibbs DL, Brown SD, et al. The immune landscape of cancer. Immunity (2018) 48(4):812–830.e14. doi: 10.1016/j.immuni.2018.03.023
25. Taylor JM. Random survival forests. J Thorac Oncol (2011) 6(12):1974–5. doi: 10.1097/JTO.0b013e318233d835
26. Sun D, Wang J, Han Y, et al. TISCH: a comprehensive web resource enabling interactive single-cell transcriptome visualization of tumor microenvironment. Nucleic Acids Res (2021) 49(D1):D1420–30. doi: 10.1093/nar/gkaa1020
27. Chen R, Smith-Cohn M, Cohen AL, Colman H. Glioma subclassifications and their clinical significance. Neurotherapeutics (2017) 14(2):284–97. doi: 10.1007/s13311-017-0519-x
28. Weller M, Wick W, Aldape K, et al. Glioma. Nat Rev Dis Primers (2015) 1:15017. doi: 10.1038/nrdp.2015.17
29. Xu S, Tang L, Li X, Fan F, Liu Z. Immunotherapy for glioma: Current management and future application. Cancer Lett (2020) 476:1–12. doi: 10.1016/j.canlet.2020.02.002
30. Liu Y, Liu L, Mou ZX. TMEM45A affects proliferation, apoptosis, epithelial-mesenchymal transition, migration, invasion and cisplatin resistance of HPV-positive cervical cancer cell lines. Biochem Genet (2022) 60(1):173–90. doi: 10.1007/s10528-021-10094-3
31. Guo J, Chen L, Luo N, Yang W, Qu X, Cheng Z. Inhibition of TMEM45A suppresses proliferation, induces cell cycle arrest and reduces cell invasion in human ovarian cancer cells. Oncol Rep (2015) 33(6):3124–30. doi: 10.3892/or.2015.3902
32. Zhang L, Wu F, Zhao J. Transmembrane protein 45A regulates the proliferation, migration, and invasion of glioma cells through nuclear factor kappa-b. Anticancer Drugs (2020) 31(9):900–7. doi: 10.1097/CAD.0000000000000890
33. Schmit K, Chen JW, Ayama-Canden S, et al. Characterization of the role of TMEM45A in cancer cell sensitivity to cisplatin. Cell Death Dis (2019) 10(12):919. doi: 10.1038/s41419-019-2088-x
34. Guan Y, Guo L, Yang E, et al. HSV-1 nucleocapsid egress mediated by UL31 in association with UL34 is impeded by cellular transmembrane protein 140. Virology (2014) 464(465):1–10. doi: 10.1016/j.virol.2014.06.034
35. Barradas M, Gonos ES, Zebedee Z, et al. Identification of a candidate tumor-suppressor gene specifically activated during ras-induced senescence. Exp Cell Res (2002) 273(2):127–37. doi: 10.1006/excr.2001.5434
36. Liu L, Zhang J, Li S, Yin L, Tai J. Silencing of TMEM158 inhibits tumorigenesis and multidrug resistance in colorectal cancer. Nutr Cancer (2020) 72(4):662–71. doi: 10.1080/01635581.2019.1650192
37. Fu Y, Yao N, Ding D, et al. TMEM158 promotes pancreatic cancer aggressiveness by activation of TGFβ1 and PI3K/AKT signaling pathway. J Cell Physiol (2020) 235(3):2761–75. doi: 10.1002/jcp.29181
38. Cuajungco MP, Podevin W, Valluri VK, Bui Q, Nguyen VH, Taylor K. Abnormal accumulation of human transmembrane (TMEM)-176A and 176B proteins is associated with cancer pathology. Acta Histochem (2012) 114(7):705–12. doi: 10.1016/j.acthis.2011.12.006
39. Li H, Yang W, Zhang M, et al. Methylation of TMEM176A, a key ERK signaling regulator, is a novel synthetic lethality marker of ATM inhibitors in human lung cancer. Epigenomics (2021) 13(17):1403–19. doi: 10.2217/epi-2021-0217
40. Guo Y, Cao F, Hu S, et al. TMEM176A acts as a tumor suppressor gene in pancreatic cancer by inhibiting ERK signaling. Discovery Med (2020) 30(161):145–53.
41. Li H, Zhang M, Linghu E, et al. Epigenetic silencing of TMEM176A activates ERK signaling in human hepatocellular carcinoma. Clin Epigenetics (2018) 10(1):137. doi: 10.1186/s13148-018-0570-4
42. Picotto G, Morse LR, Nguyen N, Saltzman J, Battaglino R. TMEM176A and TMEM176B are candidate regulators of inhibition of dendritic cell maturation and function after chronic spinal cord injury. J Neurotrauma (2020) 37(3):528–33. doi: 10.1089/neu.2019.6498
43. Merner ND, Hodgkinson KA, Haywood AF, et al. Arrhythmogenic right ventricular cardiomyopathy type 5 is a fully penetrant, lethal arrhythmic disorder caused by a missense mutation in the TMEM43 gene. Am J Hum Genet (2008) 82(4):809–21. doi: 10.1016/j.ajhg.2008.01.010
44. Zhao X, Li G, Chong T, et al. TMEM88 exhibits an antiproliferative and anti-invasive effect in bladder cancer by downregulating wnt/β-catenin signaling. J Biochem Mol Toxicol (2021) 35(8):e22835. doi: 10.1002/jbt.22835
45. Geng Q, Chen X, Chen N. Transmembrane protein 88 exerts a tumor-inhibitory role in thyroid cancer through restriction of wnt/β-catenin signaling. Exp Cell Res (2020) 395(2):112193. doi: 10.1016/j.yexcr.2020.112193
46. Trepat X, Chen Z, Jacobson K. Cell migration. Compr Physiol (2012) 2(4):2369–92. doi: 10.1002/cphy.c110012
47. Glass R, Synowitz M. CNS macrophages and peripheral myeloid cells in brain tumours. Acta Neuropathol (2014) 128(3):347–62. doi: 10.1007/s00401-014-1274-2
48. Qian M, Wang S, Guo X, et al. Hypoxic glioma-derived exosomes deliver microRNA-1246 to induce M2 macrophage polarization by targeting TERF2IP via the STAT3 and NF-κB pathways. Oncogene (2020) 39(2):428–42. doi: 10.1038/s41388-019-0996-y
Keywords: Glioma, transmembrane protein, prognostic signature, immunity, TMEM158
Citation: Zhang Y, Zhang W, Yuan Q, Hong W, Yin P, Shen T, Fang L, Jiang J, Shi F and Chen W (2023) Illustrating the biological functions and diagnostic value of transmembrane protein family members in glioma. Front. Oncol. 13:1145676. doi: 10.3389/fonc.2023.1145676
Received: 16 January 2023; Accepted: 17 March 2023;
Published: 31 March 2023.
Edited by:
Carlo Cenciarelli, National Research Council (CNR), ItalyReviewed by:
Noha Mohamed Abd Elfadeal, Suez Canal University, EgyptCopyright © 2023 Zhang, Zhang, Yuan, Hong, Yin, Shen, Fang, Jiang, Shi and Chen. This is an open-access article distributed under the terms of the Creative Commons Attribution License (CC BY). The use, distribution or reproduction in other forums is permitted, provided the original author(s) and the copyright owner(s) are credited and that the original publication in this journal is cited, in accordance with accepted academic practice. No use, distribution or reproduction is permitted which does not comply with these terms.
*Correspondence: Weiwei Chen, MTU4NTI3NDAwQHFxLmNvbQ==
†These authors have contributed equally to this work and share first authorship
Disclaimer: All claims expressed in this article are solely those of the authors and do not necessarily represent those of their affiliated organizations, or those of the publisher, the editors and the reviewers. Any product that may be evaluated in this article or claim that may be made by its manufacturer is not guaranteed or endorsed by the publisher.
Research integrity at Frontiers
Learn more about the work of our research integrity team to safeguard the quality of each article we publish.