 Zhi-hao Yang1,2*†
 Yi-jing Han
 Ming Cheng
 Jing Li
 Jian-bo Gao
94% of researchers rate our articles as excellent or good
Learn more about the work of our research integrity team to safeguard the quality of each article we publish.
Find out more
ORIGINAL RESEARCH article
Front. Oncol., 20 June 2023
Sec. Gastrointestinal Cancers: Gastric and Esophageal Cancers
Volume 13 - 2023 | https://doi.org/10.3389/fonc.2023.1143291
Purpose: The present study aimed to investigate the clinical prognostic significance of radiomics signature (R-signature) in patients with gastric neuroendocrine neoplasm (GNEN).
Methods and Materials: A retrospective study of 182 patients with GNEN who underwent dual-phase enhanced computed tomography (CT) scanning was conducted. LASSO-Cox regression analysis was used to screen the features and establish the arterial, venous and the arteriovenous phase combined R-signature, respectively. The association between the optimal R-signature with the best prognostic performance and overall survival (OS) was assessed in the training cohort and verified in the validation cohort. Univariate and multivariate Cox regression analysis were used to identify the significant factors of clinicopathological characteristics for OS. Furthermore, the performance of a combined radiomics-clinical nomogram integrating the R-signature and independent clinicopathological risk factors was evaluated.
Results: The arteriovenous phase combined R-signature had the best performance in predicting OS, and its C-index value was better than the independent arterial and venous phase R-signature (0.803 vs 0.784 and 0.803 vs 0.756, P<0.001, respectively). The optimal R-signature was significantly associated with OS in the training cohort and validation cohort. GNEN patients could be successfully divided into high and low prognostic risk groups with radiomics score median. The combined radiomics-clinical nomogram combining this R-signature and independent clinicopathological risk factors (sex, age, treatment methods, T stage, N stage, M stage, tumor boundary, Ki67, CD56) exhibited significant prognostic superiority over clinical nomogram, R-signature alone, and traditional TNM staging system (C-index, 0.882 vs 0.861, 882 vs 0.803, and 0.882 vs 0.870 respectively, P<0.001). All calibration curves showed remarkable consistency between predicted and actual survival, and decision curve analysis verified the usefulness of the combined radiomics-clinical nomogram for clinical practice.
Conclusions: The R-signature could be used to stratify patients with GNEN into high and low risk groups. Furthermore, the combined radiomics-clinical nomogram provided better predictive accuracy than other predictive models and might aid clinicians with therapeutic decision-making and patient counseling.
Gastric neuroendocrine neoplasms (GNEN) are a group of rare and heterogeneous neoplasms originating from gastric neuroendocrine cells, with the fifth highest rate in the entire digestive tract (7.2%) (1). In the past 40 years, with the improvement of the understanding of GNEN and the progress of pathological diagnosis technology, the diagnostic rate and incidence of GNEN have been increasing year by year. The increase of GNEN ranks the first among all the incidence sites of neuroendocrine tumors, and the overall survival rate of GNEN is the second worst, inferior to pulmonary neuroendocrine tumors (2).
In 2019, the latest version of the World Health Organization classification criteria classified neuroendocrine neoplasm into highly differentiated neuroendocrine tumors (NET) and poorly differentiated neuroendocrine carcinoma (NEC), as well as mixed neuroendocrine-nonneuroendocrine neoplasm (MiNEN) with both highly and poorly differentiated components (3). At present, there were problems of over-treatment and inconsistent treatment protocols for NET in clinical practice, and insufficient attention was paid to NEC and MiNEN due to its rarity and related studies were few. However, in fact, patients with NEC or MiNEN had a worse prognosis and were more likely to have distant recurrence than patients with gastric adenocarcinoma (4).
So far, the most commonly used prognostic assessment tools for GNEN are the American Joint Committee on Cancer (AJCC) and the European Society of Neuroendocrine Neoplasms (ENETS) TNM staging system (5). Several previous studies have shown a distinct biological behavior between NET and NEC, with the latter being more aggressive and having worse prognosis (6, 7), but the system based solely on anatomically relevant prognostic factors, does not fully reflect tumor heterogeneity in predicting the long-term prognosis of NEN (8–11). In addition, in current clinical practice, two different protocols are used for GNEN staging, gastric neuroendocrine tumor (GNET) follows AJCC’s 8th edition of gastroenteropancreatic neuroendocrine tumor staging, while gastric neuroendocrine carcinoma (GNEC) follows AJCC’s 8th edition of gastric cancer. The two different protocols are not convenient for clinical use (12). Therefore, the current AJCC and ENETS TNM staging system still needs to be further improved, and it is urgent to find a novel and reliable biomarker to ensure a more accurate and convenient prediction of the prognosis of GNEN patients (13).
Conventional CT imaging can be used to predict the prognosis of patients with gastric cancer and GNEN (14, 15). However, the prognostic utility of conventional medical imaging is inherently limited by mutual accuracy and reproducibility. Advances in medical imaging technology and analytical methods have led to the development of radiomics, which is dedicated to transforming these medical images into high-dimensional, mineable data that can be used to objectively and quantitatively describe tumor phenotypes in a robust and reproducible manner (16). Radiomics enables non-invasive analysis of tumor heterogeneity and has been successfully applied to predict metastasis, recurrence and other clinical outcomes of renal, lung, breast and colorectal cancers (17–21). However, radiomics-based research for prediction prognosis of GNEN patients are still lacking. In this study, we develop and validate a radiomics signature (R-signature) for the prediction of OS in GNEN patients and subsequently to determine whether a novel nomogram combining R-signature and independent clinicopathological risk factors could provide more accurate prognostic prediction in such patients.
The retrospective study was approved by an institutional review board and waived informed consent requirements. A total of 182 GNEN patients who were pathologically confirmed by surgical resection or endoscopic biopsy were enrolled from August 2011 to December 2020. The inclusion criteria were as follows (1): GNEN patients with definite biopsy pathology or postoperative pathological diagnosis; (2) enhanced abdominal CT examination before treatment; (3) complete clinical and pathological data; (4) the follow-up information was complete and reliable. The exclusion criteria were as follows: (1) pathological findings were obtained after neoadjuvant chemotherapy, radiotherapy or other treatments; (2) metastatic GNEN but not primary GNEN; (3) observation and evaluation of the influence of poor CT image quality; (4) the lesion was too small (less than 5mm in length and diameter) to sketch the region of interest (ROI); (5) patients with other primary tumors or severe heart, liver and renal insufficiency. The recruitment process is shown in Figure 1.

Figure 1 The patient recruitment pathway with inclusion and exclusion details.
The patients were randomly divided into training and validation datasets in a 7:3 ratio by computer random number method. Baseline demographic and clinicopathological data were retrospectively extracted from each patient’s electronic medical record. CT image information was obtained from picture archiving and communication system (PACS) and lesion characteristics were recorded.
The follow-up endpoint that this study focused on was OS, which refers to the date of diagnosis to the date of death or the end date of follow-up. Follow-up was conducted every 3 months for the first 2 years, every 6 months for the second to fifth years, and annually thereafter. The end point of follow-up was January 2022. The shortest follow-up time was 12 months and the longest follow-up time was 124 months (mean 29.5 months). Follow-up was conducted by searching inpatient medical records, outpatient return records, or telephone calls to obtain follow-up information.
The patients were advised to fast for more than 8 hours before examination to ensure gastric emptying. Racemic anisodamine was intramuscularly injected 15 to 20 min before the scan to reduce gastrointestinal peristalsis, and 800 to 1000 mL of warm water was instructed to ensure good gastric filling 5 min before the scan. Perform temporary and effective breathing exercises to reduce the production of respiratory movement artifacts. All patients underwent arterial phase and venous phase enhanced scanning. The details regarding CT image retrieval procedure and the acquisition parameters are described in Table S1.
The radiomics workflow is shown in Figure 2. The full sequence target images of arterial phase and venous phase with thickness of 5 mm were downloaded from the PACS system and stored in DICOM format. The three-dimensional ROI was manually outlined layer by layer along the tumor edge in software ITK-SNAP (version 3.8.0, http://www.itksnap.org). Before feature extraction, image resampling and gray discretization were used to standardize the two-phase CT images.
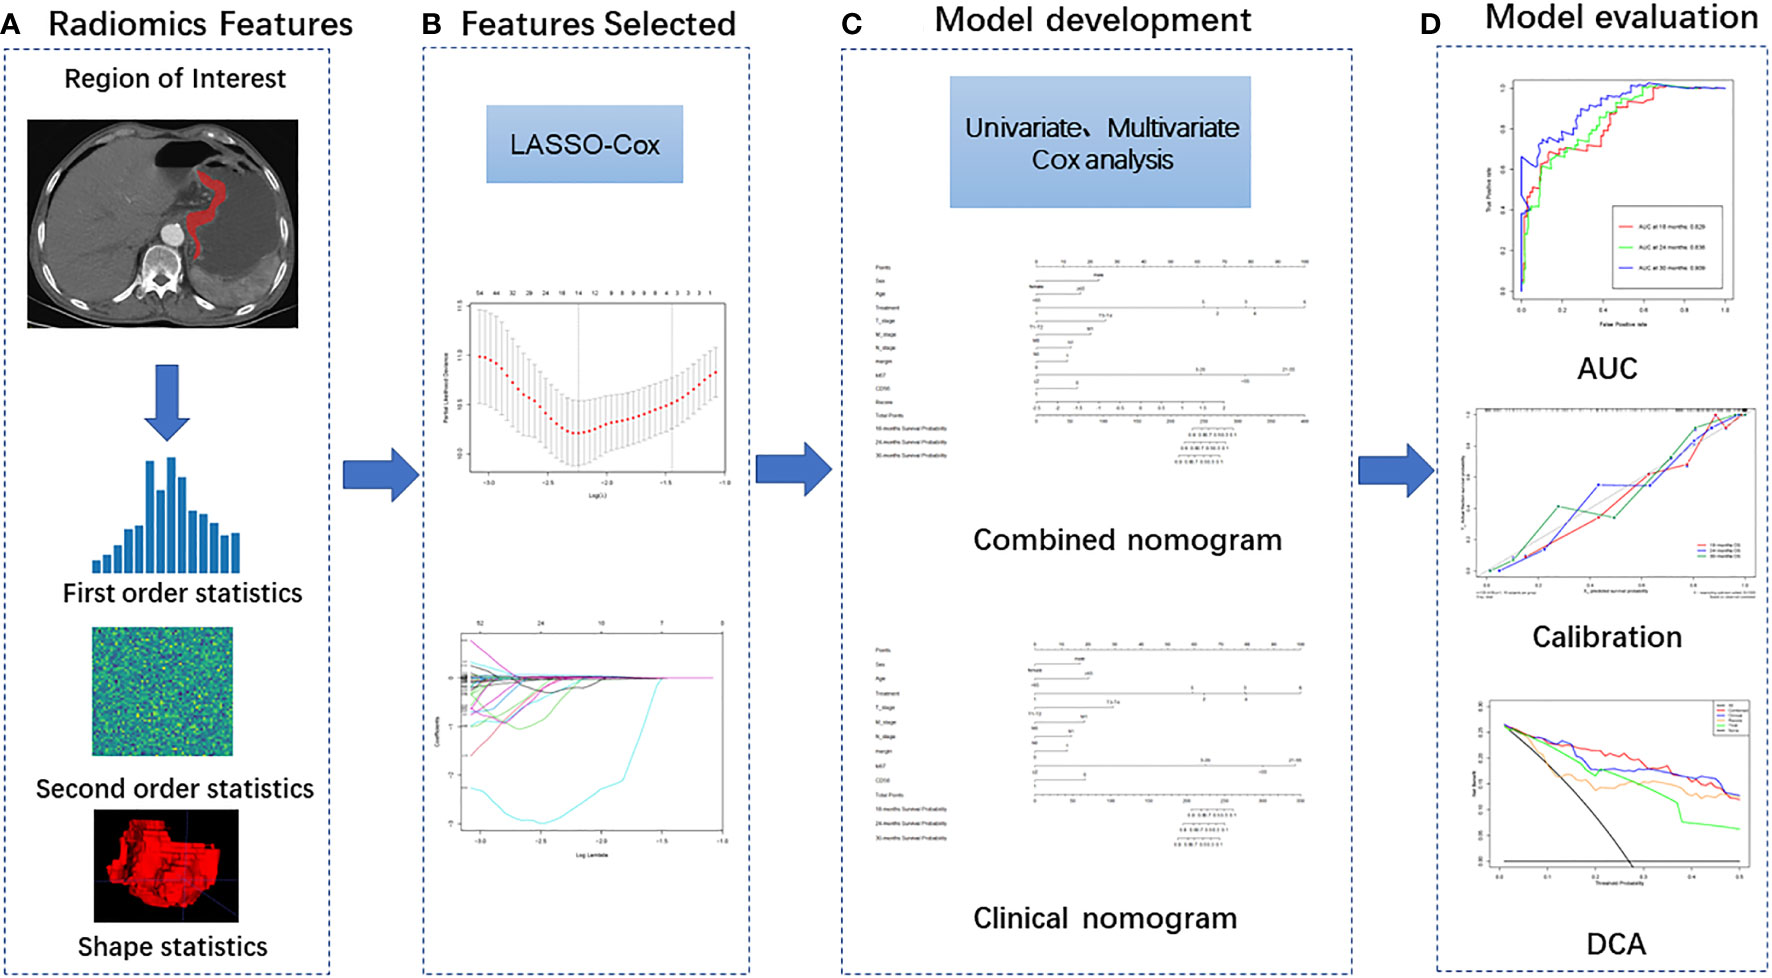
Figure 2 Radiomics workflow including four steps: (A) Image segmentation and feature extraction; (B) Feature selection; (C) Model development and (D) Model evaluation.
Feature extraction was implemented using PyRadiomics (version 3.0.1) developed by the American Association for Cancer Research. The 1781 radiomics features were extracted from arterial and venous phase respectively, including the following three categories: (1) Shape and size features, which quantitatively describe the geometric characteristics of ROI, such as the three-dimensional diameter, surface area, volume and sphericity of the tumor, which can describe the three-dimensional size and morphology of the tumor; (2) First-order features also known as image intensity features, they are extracted from the histogram information of the tumor region and used to determine the difference between the gray histogram and gray distribution of each ROI; (3) Second-order texture feature, they reflect the spatial arrangement relationship between the gray scale of the image voxel, which are extracted based on the following matrices: Gray Level Co-occurrence Matrix (GLCM), Gray Level Run Length Matrix (GLRLM), Gray Level Dependence Matrix (GLDM), Gray Level Size Zone Matrix (GLSZM), Neighbouring Gray Tone Difference Matrix (NGTDM). In addition, first-order features and second-order texture features were extracted again after filter changes by the following filters: Wavelet, Laplacian of Gaussian (LoG), Square, Square Root, Logarithm, Exponential, Gradient, Local Binary Pattern (2D), Local Binary Pattern (3D).
In order to ensure the stability of the radiomics features, 50 patients were randomly selected one month after the completion of the first ROI segmentation and were segmented by the same radiologist and another radiologist (with 5 and 10 years of image diagnosis experience, respectively). Intra-class and inter-class correlation coefficients were used to evaluate intra-observer and inter-observer repeatability, and radiomics features with both of which >0.75 were retained for subsequent analysis. The first radiologist delineated the remaining ROI.
The least absolute shrinkage and selection operator (LASSO) penalized Cox proportional hazards regression, which is an accepted algorithm for feature selection in high-dimensional variables was applied to select the optimal prognostic features of the arterial, venous and arteriovenous phases. Then, based on the selected radiomics features of each phase, the R-signature were constructed respectively. Cox proportional risk model was used to calculate the Harrell’s consistency index (C-index) and 95% confidence interval (CI) of the R-signature of each phase, and the R-signature with the best performance of predicting prognosis was selected for subsequent analysis. The C-index, which ranges from 0.5 to 1.0, is commonly used to evaluate the performance of prognostic models in survival analysis. Its higher values revealed that it had greater ability to group patients into different disease progressions. Finally, a multiple-feature-based R-signature, the radiomics score (R-score), was then constructed for predicting survival. A formula was used to calculate the R-score of each individual, which was generated by a linear combination of screening features multiplied by their respective LASSO Cox coefficients. Patients were divided into high risk group and low risk group according to the median R-score of the training group: patients with scores higher than the median were classified as high risk group, and those with scores higher than the median were classified as low risk group. The validation group was grouped with the same cut-off value.
The potential association of the R-signature with OS was first assessed in the training cohort and then validated in the validation cohort by using Kaplan-Meier survival analysis and the difference in survival between the stratified subgroups was determined using the log-rank test. In addition, the prognostic accuracy of the R-score was assessed through the time-dependent receiver operating characteristic (ROC) analysis and the correlated area under the ROC curve (AUC).
To demonstrate the incremental value of the R-signature relative to the TNM staging system and clinicopathological risk factors for individualized survival assessment of OS, a combined radiomics-clinical model and a purely clinical model were developed in the training cohort. The former combined the radiomics signature and independent clinicopathological risk factors screened based on multivariate Cox analysis, while the latter contained only independent clinicopathological risk factors. Both models were visualized in the form of nomograms. To compare model predicted survival with actual survival, a calibration curve was drawn. In order to quantify the differentiation performance of the models, the C-index values of R-signature, TNM staging system, clinical nomogram and the combined radiomics-clinical nomogram were calculated. Finally, the clinical practicability of each model was determined by comparing the net benefits under different threshold probabilities through decision curve analysis.
Statistical analysis was performed using R software (version 3.1.0) and SPSS software (version 23.0). The continuous variables were first tested for normality. If they fit the normal distribution, they were described in the form of mean standard deviation and compared by the t test of two independent samples. Otherwise, it was described by median (upper and lower quartiles) and compared by Mann-Whitney U test. Classification variables were corrected by Pearson Chi-square test, Chi-square test or Fisher exact test. SPSS was used for univariate and multivariate Cox regression analysis to screen independent risk factors affecting OS. The “glmnet” software package of R software was used for LASSO Cox regression analysis. The “rms” software package was used to generate nomogram and calibration curves, and “dca.R” software package was used for decision curve analysis.
Of the 182 GNEN patients included in the study, 130 (71.4%) were male and 52 (28.6%) were female. The median age (interquartile interval [IQR]) of all patients was 64 years (56-70 years). The treatment methods of all patients were as follows: 23 endoscopic treatments; 46 patients underwent surgical resection; 40 patients received chemotherapy; 10 patients underwent surgical resection after neoadjuvant chemotherapy; 56 patients underwent chemotherapy after surgical resection; another 7 patients were not treated. The median (IQR) survival time for OS in the training cohort was 21.2 (13.46-37.53) months and the mean survival time was 28.94 months. The median survival time (IQR) for OS in the validation cohort was 24.57 (13.75-43.99) months and the mean survival time was 30.91 months. Up to the last follow-up, the number of deaths was 59 (46.0%) in the training cohort and 23 (42.5%) in the validation cohort. The clinicopathological features between the high-risk and low-risk groups in the training and validation cohorts are shown in Table 1.
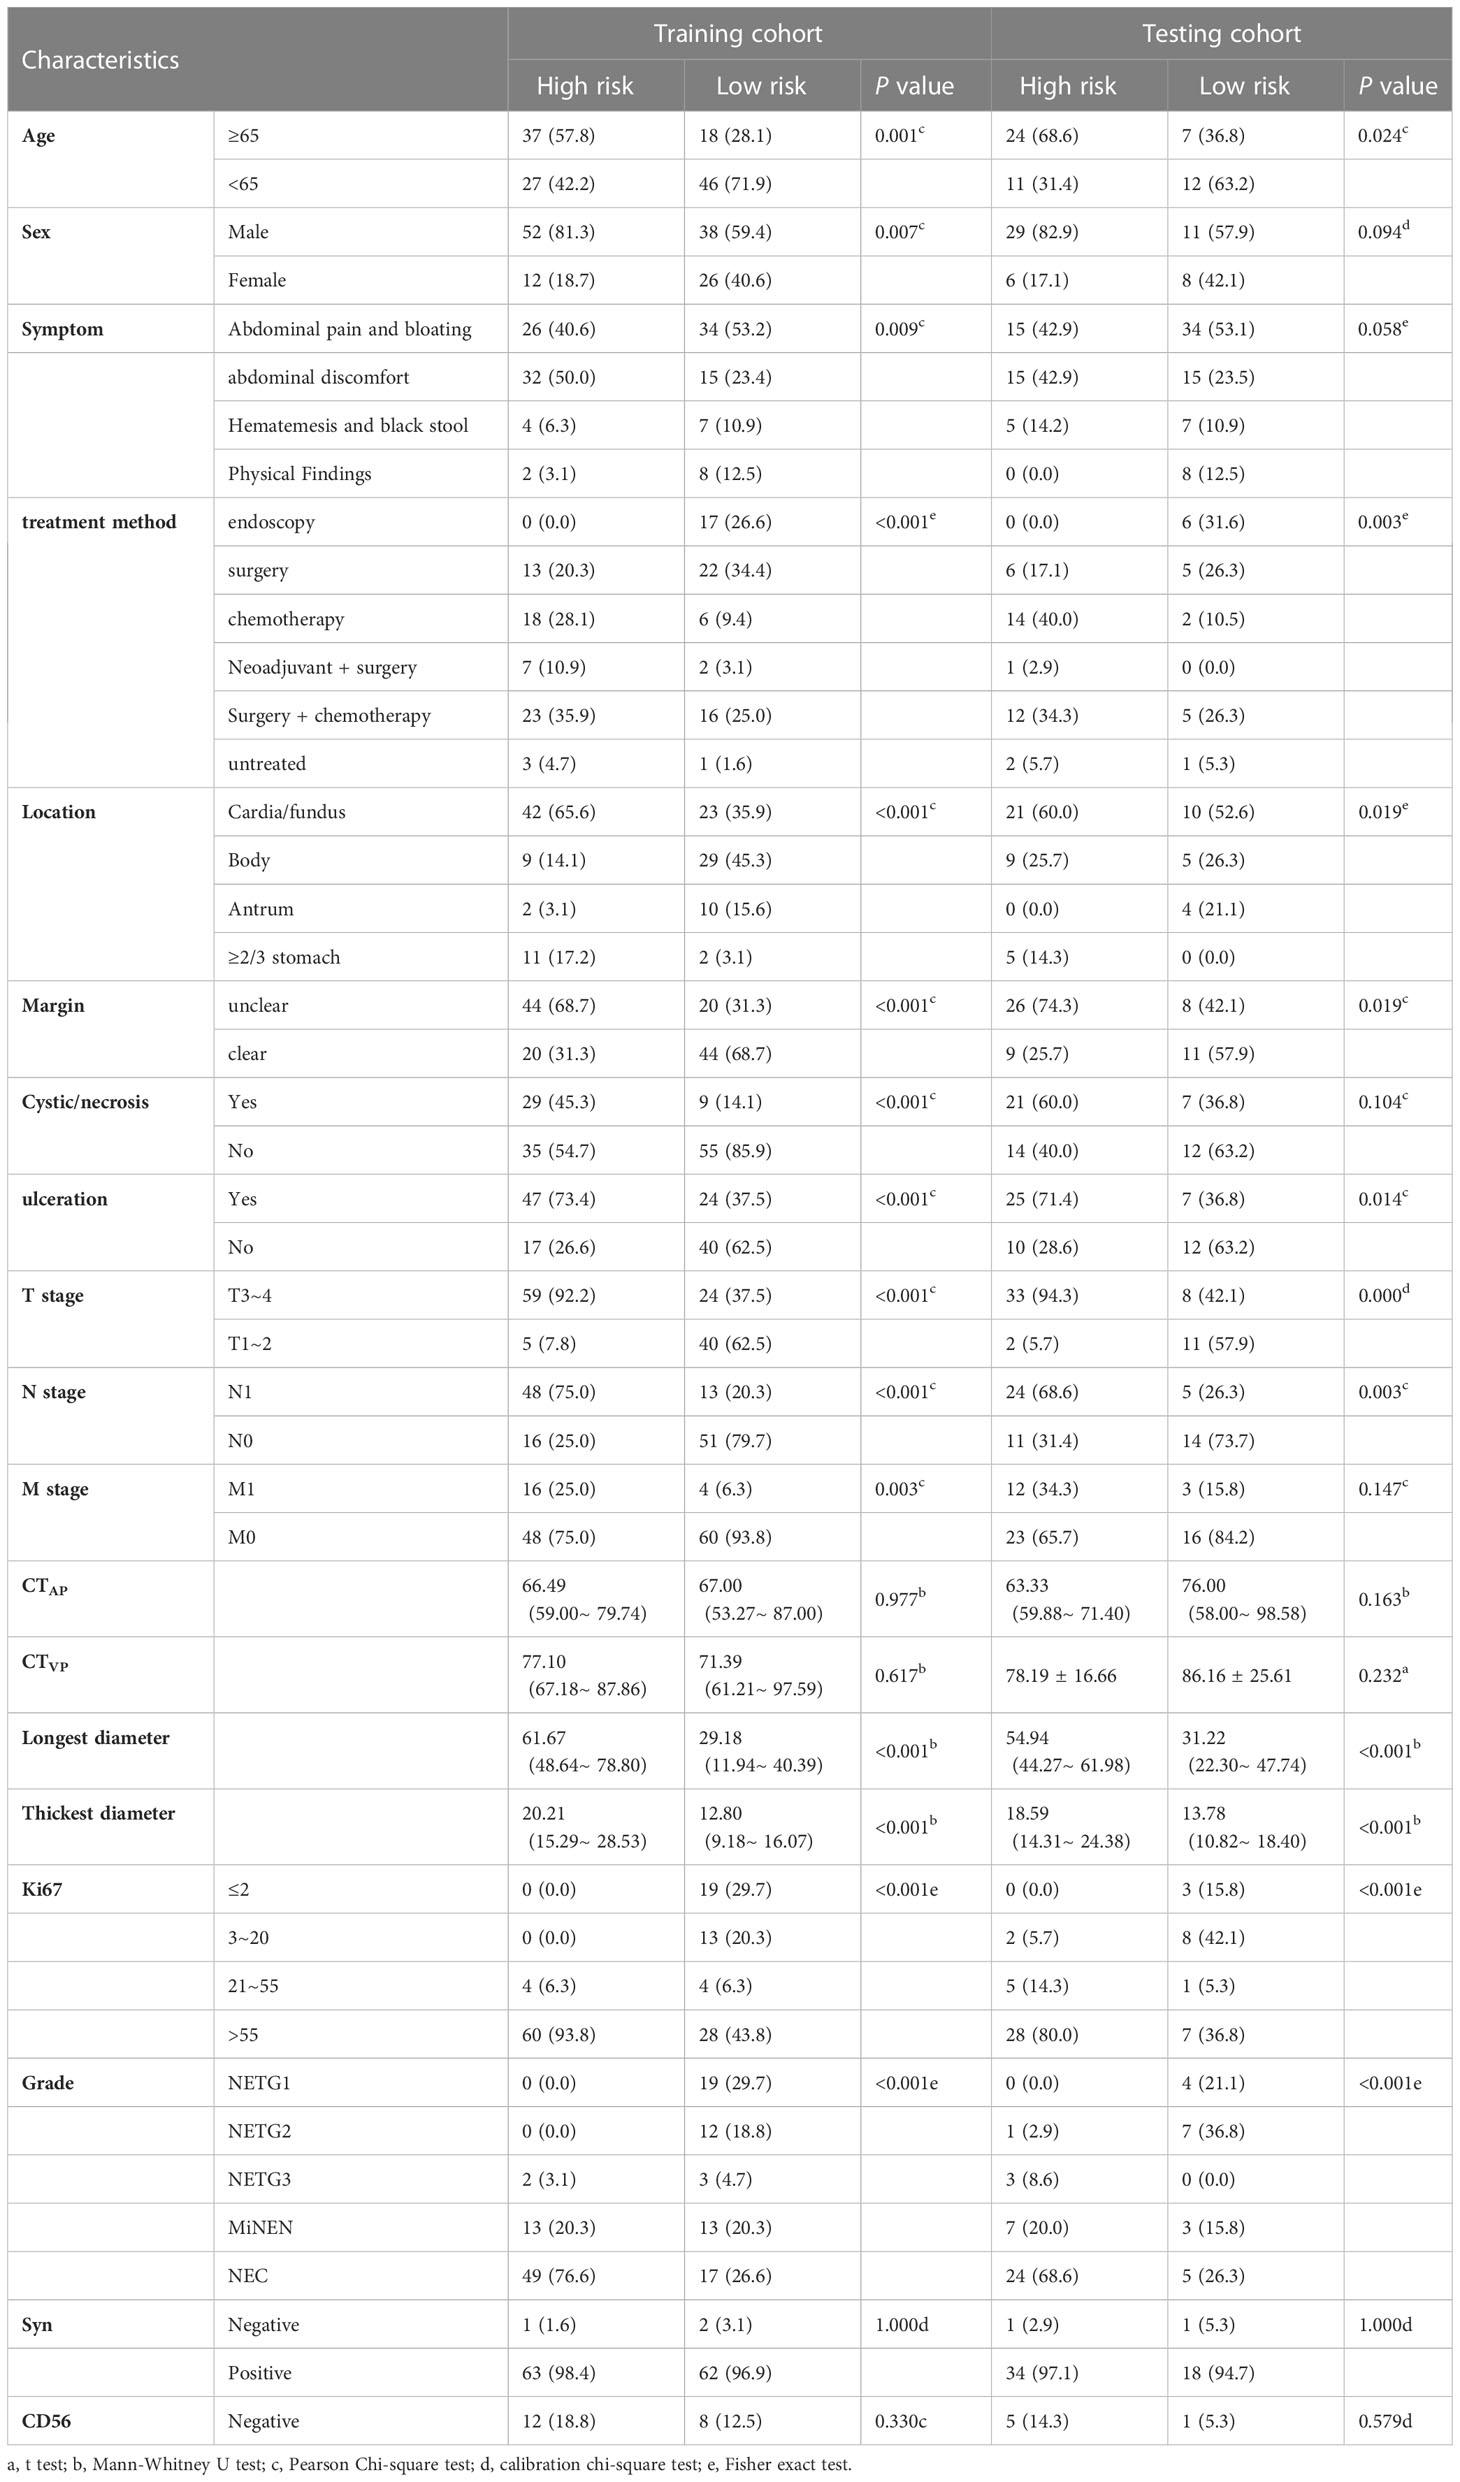
Table 1 Clinical features between high - and low-risk groups in training and validation groups.
Repeatable and stable radiomics features (inter class and intra class correlation coefficient>0.75) were retained. Through LASSO Cox dimension reduction screening for features of each phase(Figure S1A, B), 14 radiomics features were finally screened in arterial phase (Table S2), 10 radiomics features were screened in venous phase (Table S3), and 14 radiomics features were screened in the combined arteriovenous phase (Table S4). Based on the screened features of each phase, corresponding R-signature were constructed respectively, and the performance of OS prediction of each phase was compared by calculating the C-index values. The results showed that the R-signature of combined arteriovenous phase was better than that of arterial phase and venous phase(Table 2). Therefore, it was applied in the next analysis. The R-score of the optimal phase was then calculated according to the formula (Supplemental Material). The cut-off value of the R-score was −0.4939. Consequently, patients were stratified into high-risk group (R-score ≥ −0.4939) and low-risk group (R-score < −0.4939).

Table 2 C-index of the R-signature in each phase.
Kaplan-Meier survival analysis showed that R-signature based on multiple radiomics features were significantly correlated with OS in the training cohort [hazard ratio (HR) =5.015; 95%CI 3.602~5.982, P<0.001] (Figure 3A). The OS of the low-risk group was 95.3% at 12 months, 86.5% at 18 months, 82.8% at 24 months, and 80.6% at 30 months. The OS of the high-risk group was 76.5% at 12 months, 57.2% at 18 months, 41.0% at 24 months, and 28.0% at 30 months. The low-risk group has a better OS compared to a high-risk group (P < 0.001, log-rank test). Subsequently, similar results were observed in the validation cohort, where R-signature was also significantly correlated with OS (HR=6.829; 95% CI 2.661 to 17.527, P< 0.001) (Figure 3B). In the low-risk group, the OS was 93.8% at 12 months, 86.9% at 18 months, 86.9% at 24 months and 82.6% at 30 months. In the high-risk group, the OS was 63.6% at 12 months, 45.5% at 18 months, 39.0% at 24 months and 26.0% at 30 months. And the low-risk group was likewise associated with better OS (P < 0.001, log-rank test).
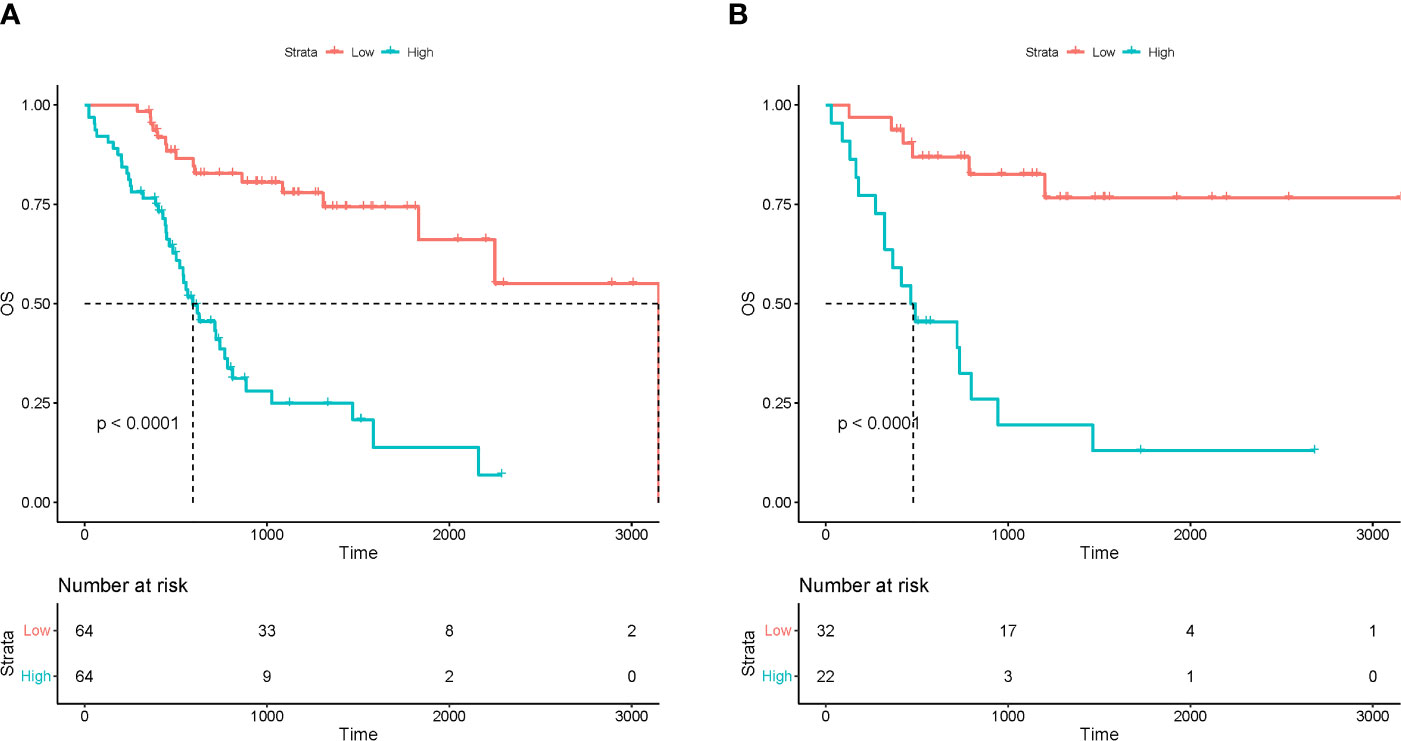
Figure 3 The Kaplan-Meier curves for patients in low-risk and high-risk groups in the training (A) and test (B) cohorts.
Time-dependent ROC analysis was used to evaluate the prognostic accuracy of the R-signature in both the training cohort and the validation cohort. The results showed that in the training cohort, the AUC values for 18-month OS, 24-month OS and 30-month were 0.829, 0.838 and 0.909 respectively (Figure 4A). In the validation cohort, the AUC values for 18-month OS, 24-month OS and 30-month OS were 0.835, 0.839 and 0.864, respectively (Figure 4B). The above data proved the discrimination accuracy of OS was reliable and robust when using R-score.
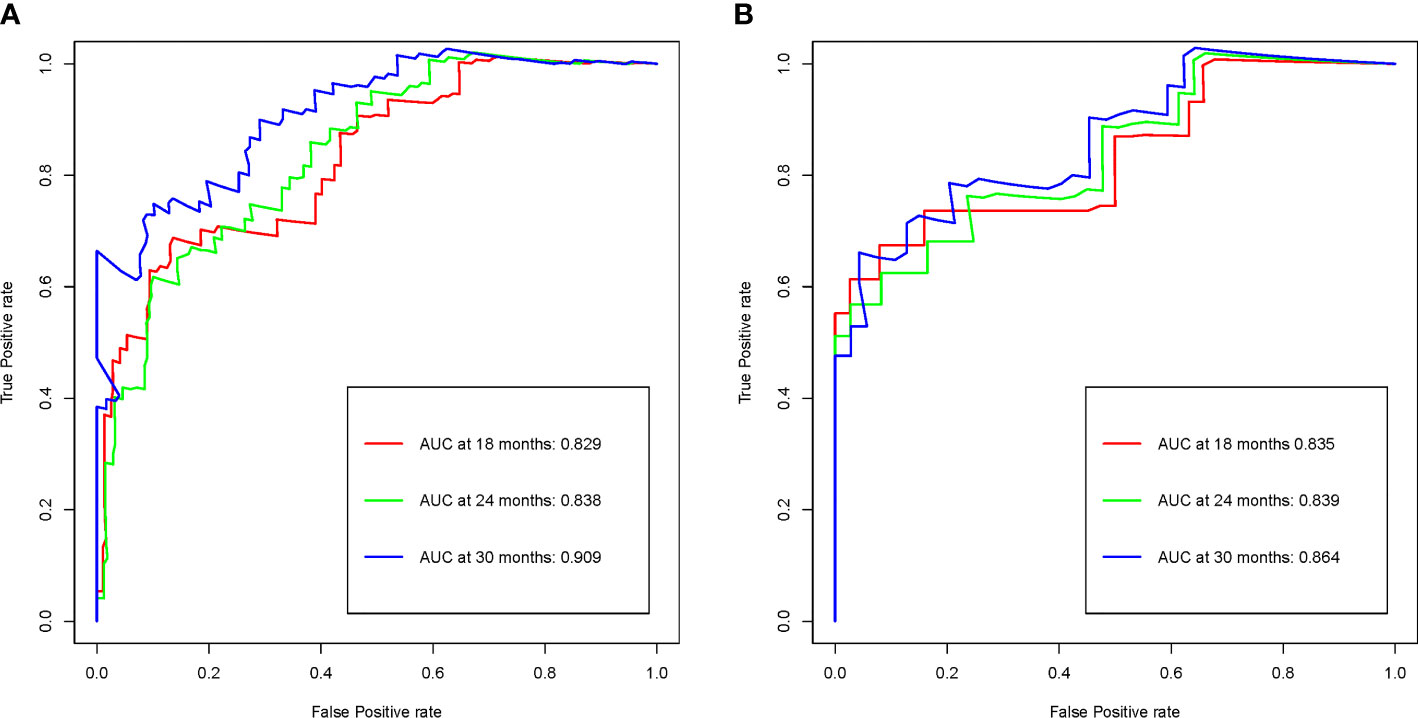
Figure 4 R-signature evaluated by time-dependent ROC curves in the training (A) and validation (B) cohorts.
Clinicopathological factors were selected by univariate Cox regression analysis (Table 3), and the factors with P<0.05 were again included in the multivariate Cox regression (Table 4). By stepwise backward regression, we found that R-score was a strong independent prognostic factor for OS, and gender, age, treatment methods, T stage, N stage, M stage, tumor boundary, Ki67, CD56 were also independent risk factors affecting prognosis (P<0.05). Combined with R-score and clinicopathological factors, the combined radiomics-clinical model was constructed, and the individualized prediction model of OS was further visualized as nomogram (Figure 5). In addition, clinical model were independently constructed using clinicopathological risk factors, which was also shown in the form of nomogram (Figure 6). Figure S2A, B depicted the calibration curves of the combined radiomics-clinical model for predicting OS at 18 months, 24 months and 30 months. In the training cohort and the validation cohort, the estimated values predicted by the model were in good agreement with the actual observed values. Figures S3A, B depicted the calibration curves of 18, 24 and 30 months OS predicted by the clinical model. In the training and validation cohorts, the estimated values predicted by the model were also very consistent with the actual observed values. By calculating the C-index value of each model, we found that compared with TNM staging system or clinical nomogram and R-signature, the combined radiomics-clinical nomogram showed better discrimination ability in the training and validation cohorts, and the prediction ability of the model was improved (C-index=0.882; 95% CI 0.848~0.916) (Table 5). Decision curve analysis showed that the overall net benefit of the combined radiomics-clinical nomogram was higher than that of the clinical nomogram, R-signature and the TNM staging system in most reasonable threshold probability ranges (Figure 7).
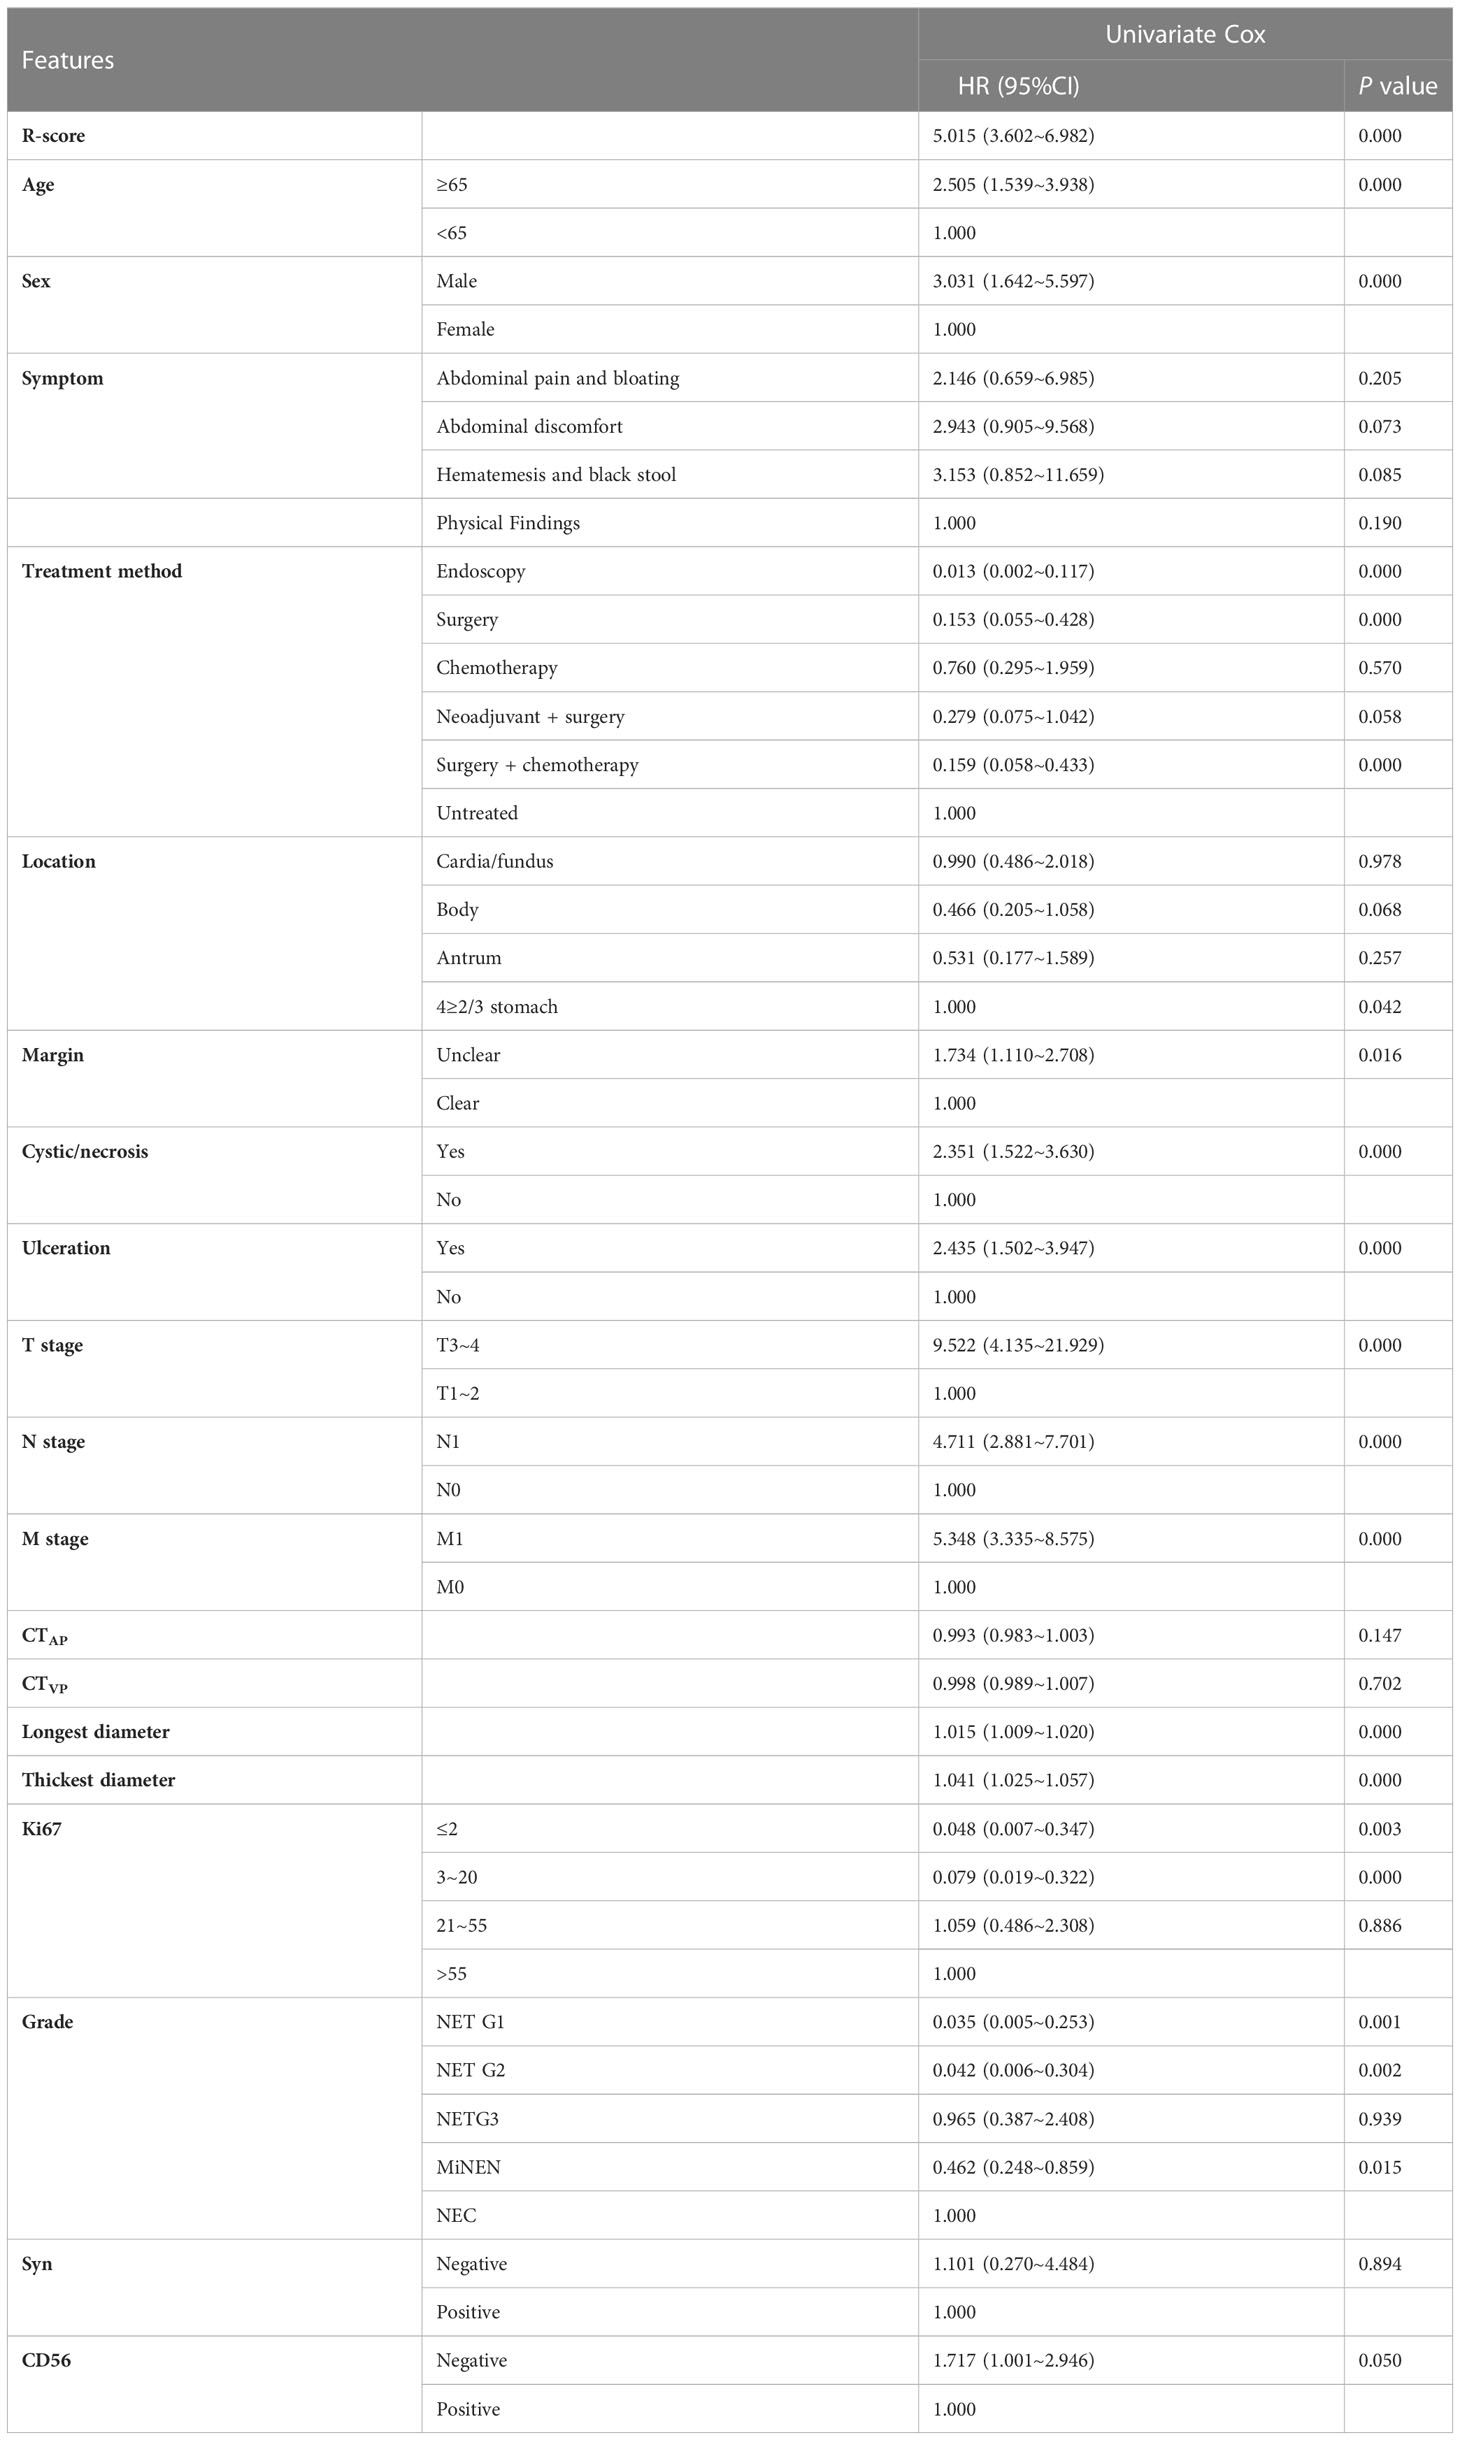
Table 3 Univariate Cox regression analysis.
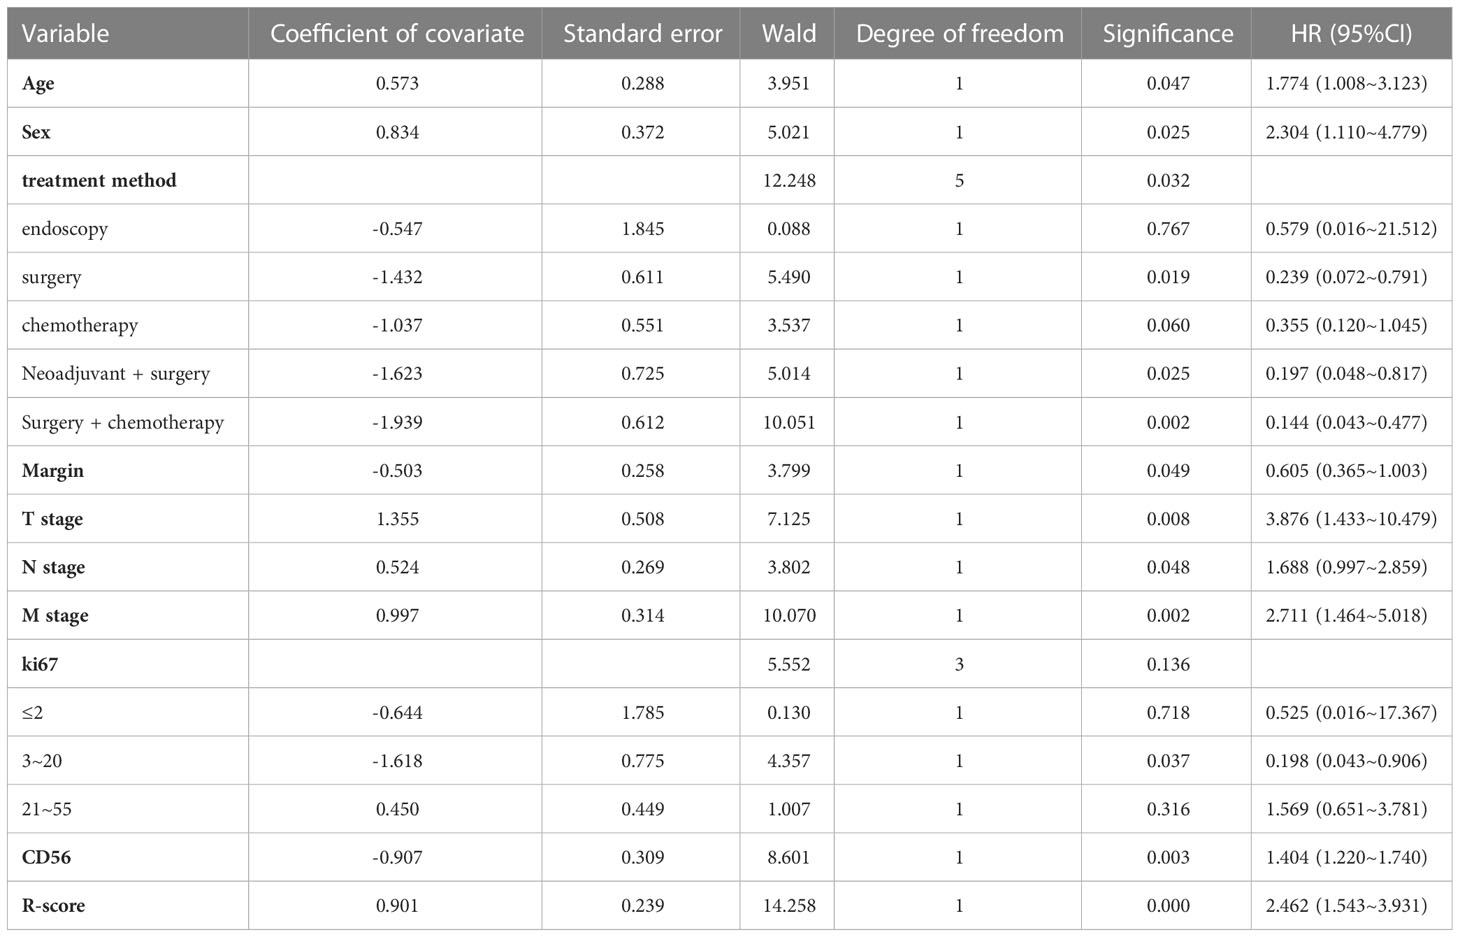
Table 4 Multivariate Cox regression analysis.
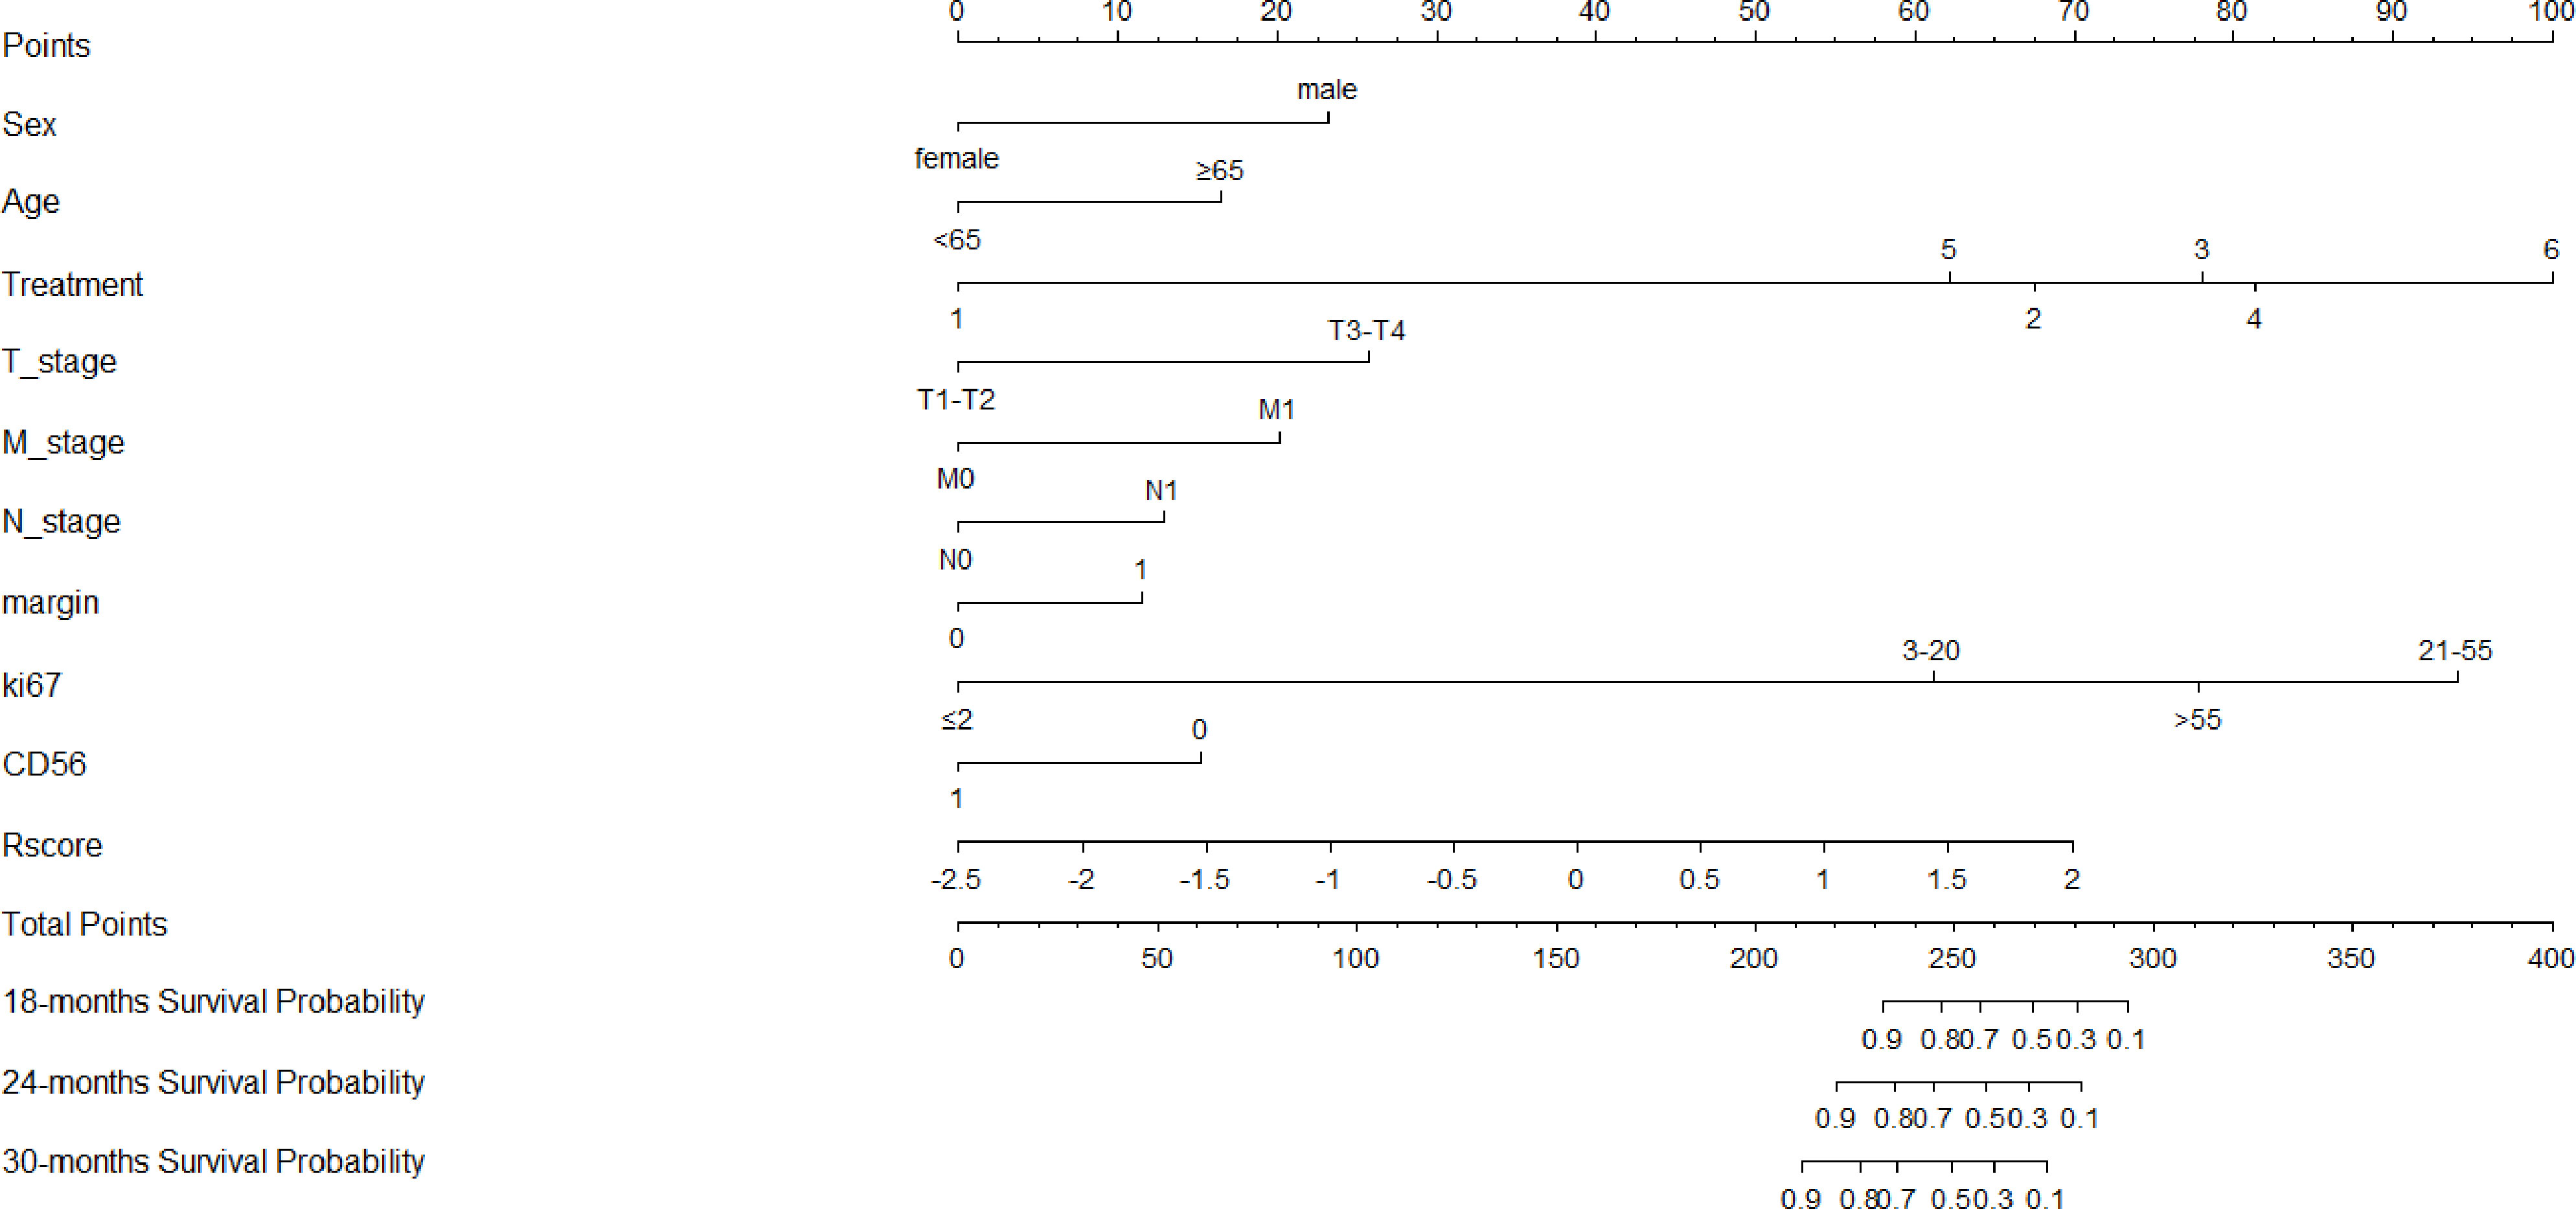
Figure 5 Nomogram of the combined radiomics-clinical model for predicting OS, which showed the weight of each variable when Rscore and clinicopathological risk factors were included.
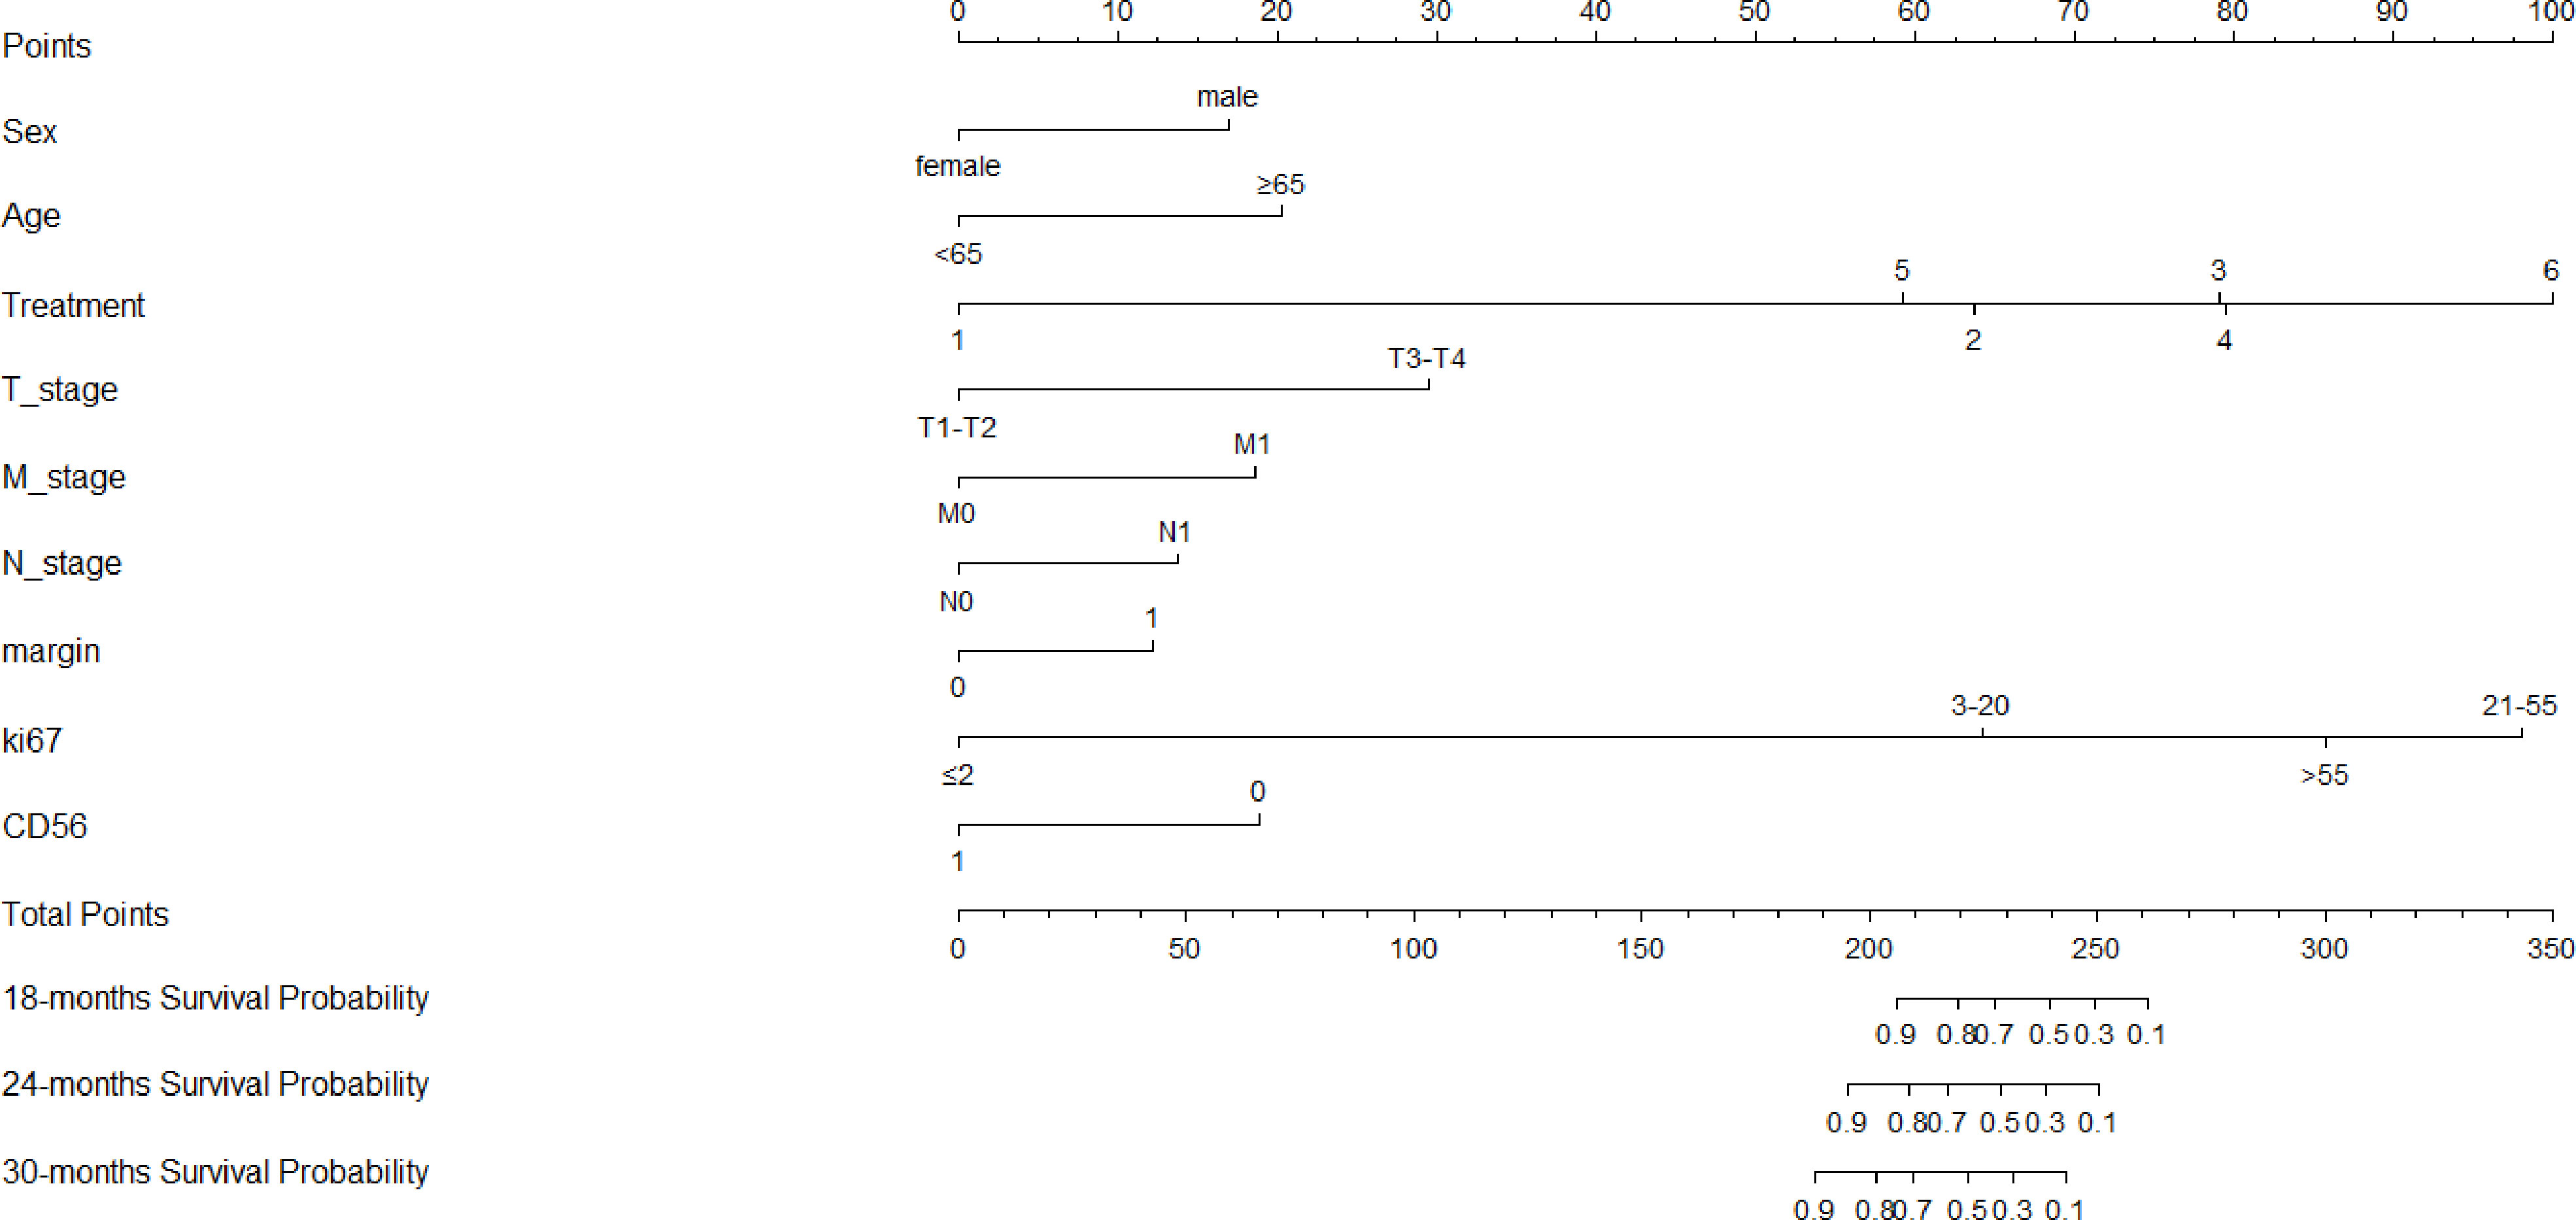
Figure 6 Nomogram of the clinical model for predicting OS, which showed the weight of included clinicopathological risk factors.
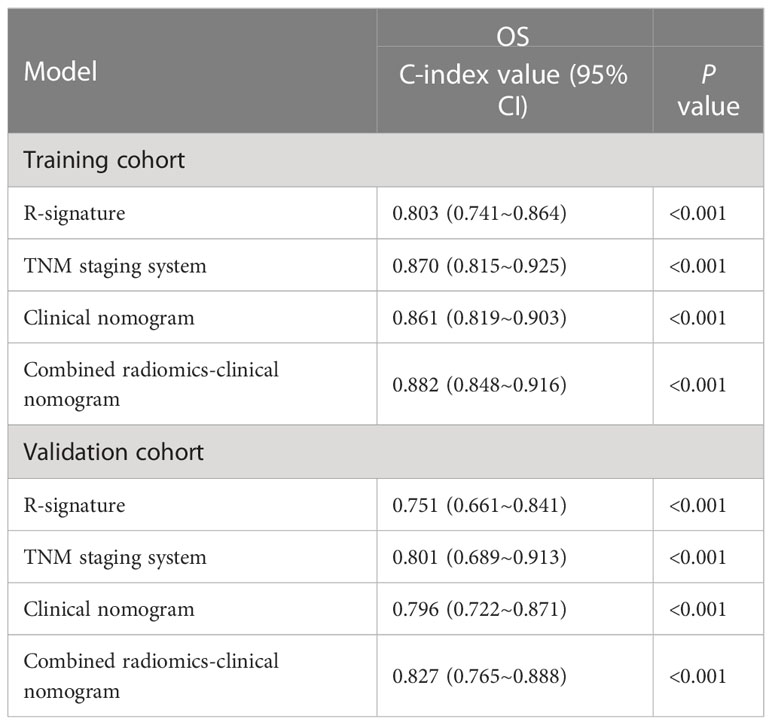
Table 5 C-index values of different models.
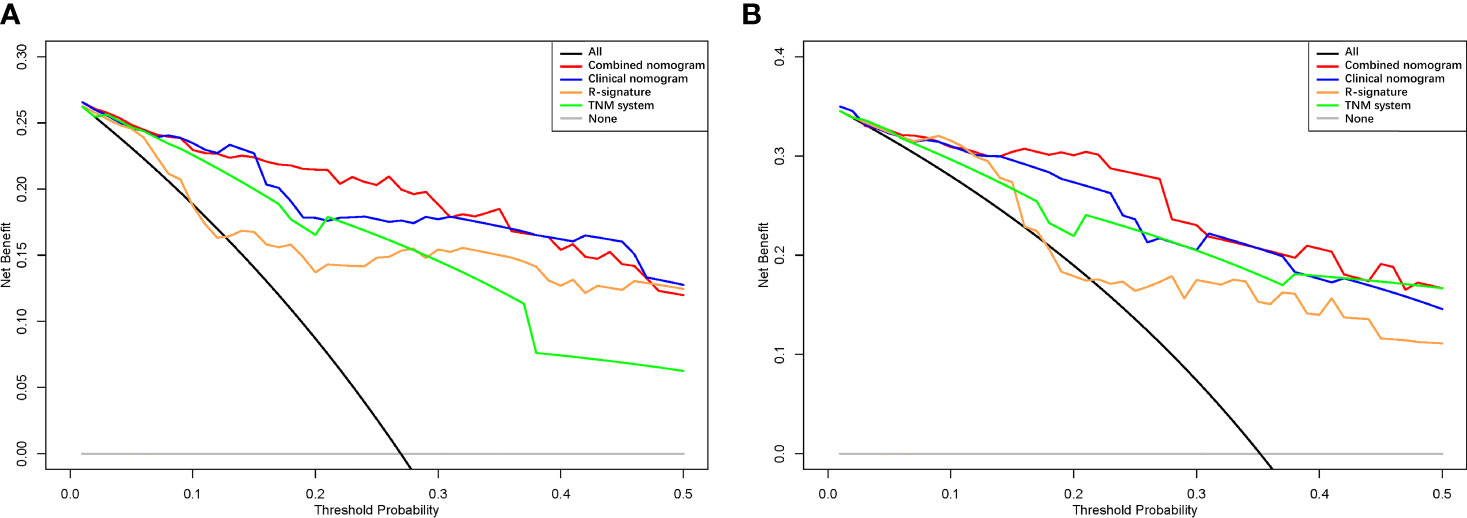
Figure 7 Decision curve analysis of each model in the training (A) and validation (B) cohorts.
GNEN is a group of rare, heterogeneous tumors with diverse clinical behavior, histomorphology, and genomic features that have steadily increased in incidence and prevalence over the past few decades (2). Dasari A et al. evaluated the prognosis of 64971 NEN patients from the SEER database, and the results showed that G1 grade undifferentiated tumors had the highest median OS (16.2 years), G2 grade differentiated tumors had poor OS (8.3 years), and G3 grade poorly differentiated tumors had the worst OS (10 months) (2). Therefore, it is critical to accurately predict the prognosis of GNEN due to the heterogeneous prognosis of patients. However, in actual clinical work, there are two different TNM staging systems for GNET and GNEC, which have become a major problem plaguing clinicians, and there are still a large number of defects in personalized evaluation of GNEN prognosis.
In recent years, some researchers have established nomogram models to predict the prognosis of gastrointestinal and pancreatic NEN (GEP NEN) and GNEC patients, and have achieved good predictive effect (22, 23). They were based on TNM staging system and some clinical factors. However, TNM staging based on tumor anatomical characteristics could not reflect the innate biological heterogeneity of tumors, and was not sufficient to provide complete and accurate prognostic information. Fortunately, the radiomics approach provides a robust and non-invasive method for characterizing intratumor heterogeneity by non-invasive extraction of whole-tumor characterization (24). Previous studies have reported that proteomic and phenotypic information can be inferred from radiological images of tumors, which were often associated with tumor recurrence and metastasis and thus may be key prognostic biomarkers (25, 26). Our team’s previous research found that radiomics nomograms had important clinical significance for preoperative detection of gastric malignancies, and radiomics analysis had shown good performance in distinguishing GNEC from gastric adenocarcinoma (27). However, current radiomics studies on the prognosis of GNEN patients are still lacking. Therefore, this study aimed to develop and validate a novel CT-based prognostic R-signature for use in conjunction with the TNM staging system to improve the prediction of OS.
In this study, we found that the combination of R-signature and clinicopathology data showed a higher predictive value than the clinical nomogram or R-signature alone, thus suggesting that it may be used to predict OS in patients with GNEN. The study took into account valuable clinical factors. According to our nomogram, male patients over 65 years old may had a higher disease specific death prediction than young female patients. This was basically consistent with the clinical nomogram established by Fang et al. suggesting that patients over 50 years old had a higher probability of disease-related mortality than younger patients (22). For female patients, high hormone level fluctuations lead to a low degree of physical discomfort, so timely intervention may be associated with a better prognosis.
We also found that whether the margin was clear or not had an effect on prognosis (p = 0.016), this was different from Yan’s results [15]. In their study, no significant difference was found in OS between the group with clear margin and the group with unclear margin. This may be due to the differences in sample size and the proportion of samples with unclear margin. In our study, 182 cases were included, more than twice as many of them, and 53.8% (98/182) of our cases had unclear margin. In contrast, only 14.5% (11/76) cases had unclear margin in their study. This disparity in sample size, as well as differences in the proportion of subgroups, may lead to the difference between our results. What’s more, the symptom was proved not a significant factor for OS. This phenomenon has not been found in other studies.
Due to GEP-NEN’s rarity, complexity and poor understanding of the disease, there is still a lack of a unified treatment approach, and GEP-NEN treatment should be highly personalized. Endoscopic mucosal dissection is recommended for GEP-NEN limited to mucosa or submucosa with a length of no more than 1 cm G1 grade and no lymph node metastasis or distant metastasis, with a lesion resection rate of more than 85% and a good prognosis. Furthermore, AJCC guidelines recommend palliative chemotherapy for patients with poor histological differentiation because their life expectancy is very low. Patients with good histological differentiation have a better prognosis, so surgical resection of the lesion may be considered (28). Surgical operations are divided into radical resection and palliative resection. Many scholars recommend radical resection for patients with GNEC to prolong survival time, because the 5-year and 3-year OS of the former were higher than those of the latter (6, 29). ENETS guidelines recommend adjuvant chemotherapy for patients with advanced GNEC, and some studies have also shown that postoperative adjuvant chemotherapy can improve the survival of patients with NEC (30–32). In line with this, our nomogram intuitively reflected that postoperative adjuvant chemotherapy had a lower score than surgery alone, and therefore a higher predicted survival rate. Moreover, we found that active treatment was a protective factor for the prognosis of patients through multivariate Cox regression analysis. As for the comparison of prognostic differences among various treatments, further studies should be conducted after further unification of baseline data and enlargement of sample size.
Ki⁃67 index is an important indicator of tumor proliferation activity (33). Sorby et al. reported that patients with Ki67 index>55% had better response to platinum based chemotherapy, but shorter survival period (10). Boo et al. found that high Ki67 proliferation index (>60%) was related to tumor recurrence and tissue differentiation, which can be used as a prognostic indicator of GNEC (34). Xie et al. showed that when the Ki67 proliferation index increased, the survival rate of patients decreased significantly (6). However, the Ki67 index alone does not seem to be the most important parameter in determining the potential for metastasis, as gastric tumor property was also closely related to tumor size and the depth of gastric wall tumor invasion (35). This study analyzed the impact of Ki67 proliferation index on the prognosis of patients. According to the recommendations of previous literature, patients were divided into four categories: Ki67<2%, 3% - 20%, 20% - 55%, and>55%, corresponding to NET G1, NET G2, NET G3 and some NEC, and highly malignant NEC patients with poor differentiation (3). After univariate and multivariate Cox regression analysis, it was confirmed that Ki67 index was an independent risk factor affecting the prognosis.
Synaptophysin (Syn), Chrogranin A (CgA), and CD56 are three neuroendocrine markers widely used in the diagnosis of NEN (36). In patients included in this study, Syn and CgA were missing more data, and only CD56 with complete data was discussed. In this study, the positive expression of CD56 accounted for 85.7%. After multivariate regression analysis, it was found that negative CD56 was a risk factor for prognosis.
In addition, our study showed that patients with lymph node metastasis and distant metastasis were more likely to die than patients without metastasis. The nomogram also illustrated that the prognosis of patients with T3-4 was worse than that of patients with T1-2. The above findings have also been reported in previous literature. A Chinese study involving 419 patients with rectal NEN showed that lymph node metastasis was an important risk factor for the prognosis of rectal NEN (37). Two other studies have also shown that lymph node metastasis and distant metastasis are independent covariates associated with OS in GNEN and GEP-NEN, respectively (22, 38). Yan et al. proposed that serous infiltration and lymph node metastasis were independent risk factors for disease free survival (DFS) and OS in GNEN patients, respectively (15).
In this study, although tumor boundary was an independent risk factor affecting prognosis, it had a weak influence on prognosis, with a covariate coefficient of only -0.503. Accordingly, it also accounted for a small assigned score in nomogram. Similarly, it has been reported that boundary blurring was associated with high recurrence rate and poor survival rate in pancreatic neuroendocrine tumor (39).
The prognosis of patients with GNEN depends on a complex multi-factor interaction, and a single but powerful independent risk factor is not sufficient to accurately predict the prognosis. In addition, the single factor only applies at the population level, not the individual level. While synthetic nomogram provides an accurate and objective prognosis and facilitates personalized treatment based on the patient’s specific situation. Previous studies have shown that nomogram shows better performance in predicting survival in NEN patients compared to the traditional TNM staging system (23, 28). In this study, the predictive performance of the arterial phase radiomics model was superior to that of the venous phase radiomics model, while the performance of the arteriovenous phase combined radiomics model was superior to any single phase imaging model. Similar findings were also found in previous studies, which may be due to the fact that the combined phase provided more abundant radiomics features than the independent phase (40, 41). In addition, GNEN is characterized by significant enhancement in the arterial phase, which reflects the characteristics of tumor blood supply and functional capillaries. Meanwhile, angiogenesis is closely related to the occurrence, development and prognosis of tumors. We further combined the arteriovenous phase combined R- signature with independent clinicopathological risk factors to develop a combined radiomics-clinical nomogram to predict OS probability at 18, 24, and 30 months for individual patients. Decision curve analysis showed that, in most reasonable threshold probability ranges, the combined radiomics-clinical nomogram was superior to the clinical nomogram and TNM staging system, indicating that the R-signature provided supplementary prognostic information, improved the prognostic performance of the TNM staging system, and provided incremental value for individualized prognostic evaluation.
There were several limitations to this study. First of all, this study was a retrospective study, and the disease was relatively rare, so the sample size included was small. Secondly, the clinical efficacy of our nomogram needs to be validated through prospective, multi-center collection of external data to improve the generalization ability. Finally, this study only focused on the prognostic outcome of OS, and did not discuss the clinical value of radiomics signature for progression-free survival (PFS), which is the direction of further research.
In summary, our findings demonstrated that R-signature could be used to stratify GNEN patients into high and low risk groups. Moreover, the newly developed combined radiomics-clinical nomogram is a powerful predictor of OS for GNEN patients, which demonstrated incremental value of the R-signature to the traditional staging system for individualized survival estimation.
The original contributions presented in the study are included in the article/Supplementary Material. Further inquiries can be directed to the corresponding author.
Z-HY: design the research. Y-JH: performed the research. Y-JH, RW and JL: collected the data. MC and H-PZ: analyzed the data. Z-HY and Y-JH: analyzed the data and wrote the paper. MC and J-BG: reviewed the paper. All authors contributed to the article and approved the submitted version.
This work was supported by the Key Project of Science and Technology Research of Henan Province (No. 212102310664), the National Natural and Science Fund of China (No. 81971615).
This is a short text to acknowledge the contributions of specific colleagues, institutions, or agencies that aided the efforts of the authors.
The authors declare that the research was conducted in the absence of any commercial or financial relationships that could be construed as a potential conflict of interest.
All claims expressed in this article are solely those of the authors and do not necessarily represent those of their affiliated organizations, or those of the publisher, the editors and the reviewers. Any product that may be evaluated in this article, or claim that may be made by its manufacturer, is not guaranteed or endorsed by the publisher.
The Supplementary Material for this article can be found online at: https://www.frontiersin.org/articles/10.3389/fonc.2023.1143291/full#supplementary-material
1. Maggard MA, O'Connell JB, Ko CY. Updated population-based review of carcinoid tumors. Ann Surg (2004) 240(1):117–22. doi: 10.1097/01.sla.0000129342.67174.67
2. Dasari A, Shen C, Halperin D, Zhao B, Zhou S, Xu Y, et al. Trends in the incidence, prevalence, and survival outcomes in patients with neuroendocrine tumors in the united states. JAMA Oncol (2017) 3(10):1335–42. doi: 10.1001/jamaoncol.2017.0589
3. Nagtegaal ID, Odze RD, Klimstra D, Paradis V, Rugge M, Schirmacher P, et al. WHO classification of tumours editorial board. the 2019 WHO classification of tumours of the digestive system. Histopathology (2020) 76(2):182–8. doi: 10.1111/his.13975
4. Lin J, Zhao Y, Zhou Y, Tian Y, He Q, Lin J, et al. Comparison of survival and patterns of recurrence in gastric neuroendocrine carcinoma, mixed adenoneuroendocrine carcinoma, and adenocarcinoma. JAMA Netw Open (2021) 4(7):e2114180. doi: 10.1001/jamanetworkopen.2021.14180
5. Rindi G, Klöppel G, Alhman H, Caplin M, Couvelard A, de Herder WW, et al. All other frascati consensus conference participants; European neuroendocrine tumor society (ENETS). TNM staging of foregut (neuro)endocrine tumors: a consensus proposal including a grading system. Virchows Arch (2006) 449(4):395–401. doi: 10.1007/s00428-006-0250-1
6. Xie JW, Sun YQ, Feng CY, Zheng CH, Li P, Wang JB, et al. Evaluation of clinicopathological factors related to the prognosis of gastric neuroendocrine carcinoma. Eur J Surg Oncol (2016) 42(10):1464–70. doi: 10.1016/j.ejso.2016.08.004
7. Yao JC, Hassan M, Phan A, Dagohoy C, Leary C, Mares JE, et al. One hundred years after "carcinoid": epidemiology of and prognostic factors for neuroendocrine tumors in 35,825 cases in the united states. J Clin Oncol (2008) 26(18):3063–72. doi: 10.1200/JCO.2007.15.4377
8. Vélayoudom-Céphise FL, Duvillard P, Foucan L, Hadoux J, Chougnet CN, Leboulleux S, et al. Are G3 ENETS neuroendocrine neoplasms heterogeneous? Endocr Relat Cancer (2013) 20(5):649–57. doi: 10.1530/ERC-13-0027
9. Heetfeld M, Chougnet CN, Olsen IH, Rinke A, Borbath I, Crespo G, et al. Other knowledge network members. characteristics and treatment of patients with G3 gastroenteropancreatic neuroendocrine neoplasms. Endocr Relat Cancer (2015) 22(4):657–64. doi: 10.1530/ERC-15-0119
10. Sorbye H, Welin S, Langer SW, Vestermark LW, Holt N, Osterlund P, et al. Predictive and prognostic factors for treatment and survival in 305 patients with advanced gastrointestinal neuroendocrine carcinoma (WHO G3): the NORDIC NEC study. Ann Oncol (2013) 24(1):152–60. doi: 10.1093/annonc/mds276
11. Basturk O, Yang Z, Tang LH, Hruban RH, Adsay V, McCall CM, et al. The high-grade (WHO G3) pancreatic neuroendocrine tumor category is morphologically and biologically heterogenous and includes both well differentiated and poorly differentiated neoplasms. Am J Surg Pathol (2015) 39(5):683–90. doi: 10.1097/PAS.0000000000000408
12. O'Sullivan B, Brierley J, Byrd D, Bosman F, Kehoe S, Kossary C, et al. The TNM classification of malignant tumours-towards common understanding and reasonable expectations. Lancet Oncol (2017) 18(7):849–51. doi: 10.1016/S1470-2045(17)30438-2
13. Klöppel G, Rindi G, Perren A, Komminoth P, Klimstra DS. The ENETS and AJCC/UICC TNM classifications of the neuroendocrine tumors of the gastrointestinal tract and the pancreas: a statement. Virchows Arch (2010) 456(6):595–7. doi: 10.1007/s00428-010-0924-6
14. Komori M, Asayama Y, Fujita N, Hiraka K, Tsurumaru D, Kakeji Y, et al. Extent of arterial tumor enhancement measured with preoperative MDCT gastrography is a prognostic factor in advanced gastric cancer after curative resection. AJR Am J Roentgenol (2013) 201(2):W253–61. doi: 10.2214/AJR.12.9206
15. Yan S, Liu T, Li Y, Zhu Y, Jiang J, Jiang L, et al. Value of computed tomography evaluation in pathologic classification and prognosis prediction of gastric neuroendocrine tumors. Ann Transl Med (2019) 7(20):545. doi: 10.21037/atm.2019.09.114
16. Verma V, Simone CB2, Krishnan S, Lin SH, Yang J, Hahn SM. The rise of radiomics and implications for oncologic management. J Natl Cancer Inst (2017) 109(7). doi: 10.1093/jnci/djx055
17. Chen Q, Zhang L, Liu S, You J, Chen L, Jin Z, et al. Radiomics in precision medicine for gastric cancer: opportunities and challenges. Eur Radiol (2022) 32(9):5852–68. doi: 10.1007/s00330-022-08704-8
18. Liang C, Huang Y, He L, Chen X, Ma Z, Dong D, et al. The development and validation of a CT-based radiomics signature for the preoperative discrimination of stage I-II and stage III-IV colorectal cancer. Oncotarget (2016) 7(21):31401–12. doi: 10.18632/oncotarget.8919
19. Li H, Zhu Y, Burnside ES, Huang E, Drukker K, Hoadley KA, et al. Quantitative MRI radiomics in the prediction of molecular classifications of breast cancer subtypes in the TCGA/TCIA data set. NPJ Breast Cancer (2016) 2:16012. doi: 10.1038/npjbcancer.2016.12
20. Vallieres M, Freeman CR, Skamene SR, El Naqa I. A radiomics model from joint FDG-PET and MRI texture features for the prediction of lung metastases in soft-tissue sarcomas of the extremities. Phys Med Biol (2015) 60(14):5471–96. doi: 10.1088/0031-9155/60/14/5471
21. Yan L, Yang G, Cui J, Miao W, Wang Y, Zhao Y, et al. Radiomics analysis of contrast-enhanced CT predicts survival in clear cell renal cell carcinoma. Front Oncol (2021) 11:671420. doi: 10.3389/fonc.2021.671420
22. Fang C, Wang W, Feng X, Sun J, Zhang Y, Zeng Y, et al. Nomogram individually predicts the overall survival of patients with gastroenteropancreatic neuroendocrine neoplasms. Br J Cancer (2017) 117(10):1544–50. doi: 10.1038/bjc.2017.315
23. Zheng H, Zhao Y, He Q, Hao H, Tian Y, Zou B, et al. Multi-institutional development and validation of a nomogram to predict recurrence after curative resection of gastric neuroendocrine/mixed adenoneuroendocrine carcinoma. Gastric Cancer (2021) 24(2):503–14. doi: 10.1007/s10120-020-01119-8
24. Sala E, Mema E, Himoto Y, Veeraraghavan H, Brenton JD, Snyder A, et al. Unravelling tumour heterogeneity using next-generation imaging: radiomics, radiogenomics, and habitat imaging. Clin Radiol (2017) 72(1):3–10. doi: 10.1016/j.crad.2016.09.013
25. Zhang J, Fujimoto J, Zhang J, Wedge DC, Song X, Zhang J, et al. Intratumor heterogeneity in localized lung adenocarcinomas delineated by multiregion sequencing. Science (2014) 346(6206):256–9. doi: 10.1126/science.1256930
26. Rutman AM, Kuo MD. Radiogenomics: creating a link between molecular diagnostics and diagnostic imaging. Eur J Radiol (2009) 70(2):232–41. doi: 10.1016/j.ejrad.2009.01.050
27. Wang R, Liu H, Liang P, Zhao H, Li L, Gao J. Radiomics analysis of CT imaging for differentiating gastric neuroendocrine carcinomas from gastric adenocarcinomas. Eur J Radiol (2021) 138:109662. doi: 10.1016/j.ejrad.2021.109662
28. Liao T, Su T, Huang L, Li B, Feng LH. Development and validation of a novel nomogram for predicting survival rate in pancreatic neuroendocrine neoplasms. Scand J Gastroenterol (2022) 57(1):85–90. doi: 10.1080/00365521.2021.1984571
29. Ishida M, Sekine S, Fukagawa T, Ohashi M, Morita S, Taniguchi H, et al. Neuroendocrine carcinoma of the stomach: morphologic and immunohistochemical characteristics and prognosis. Am J Surg Pathol (2013) 37(7):949–59. doi: 10.1097/PAS.0b013e31828ff59d
30. Liu DJ, Fu XL, Liu W, Zheng LY, Zhang JF, Huo YM, et al. Clinicopathological, treatment, and prognosis study of 43 gastric neuroendocrine carcinomas. World J Gastroenterol (2017) 23(3):516–24. doi: 10.3748/wjg.v23.i3.516
31. Garcia-Carbonero R, Sorbye H, Baudin E, Raymond E, Wiedenmann B, Niederle B, et al. Vienna Consensus conference participants. ENETS consensus guidelines for high-grade gastroenteropancreatic neuroendocrine tumors and neuroendocrine carcinomas. Neuroendocrinology (2016) 103(2):186–94. doi: 10.1159/000443172
32. Sorbye H, Strosberg J, Baudin E, Klimstra DS, Yao JC. Gastroenteropancreatic high-grade neuroendocrine carcinoma. Cancer (2014) 120(18):2814–23. doi: 10.1002/cncr.28721
33. Klöppel G, La Rosa S. Ki67 labeling index: assessment and prognostic role in gastroenteropancreatic neuroendocrine neoplasms. Virchows Arch (2018) 472(3):341–9. doi: 10.1007/s00428-017-2258-0
34. Boo YJ, Park SS, Kim JH, Mok YJ, Kim SJ, Kim CS. Gastric neuroendocrine carcinoma: clinicopathologic review and immunohistochemical study of e-cadherin and ki-67 as prognostic markers. J Surg Oncol (2007) 95(2):110–7. doi: 10.1002/jso.20616
35. Grozinsky-Glasberg S, Thomas D, Strosberg JR, Pape UF, Felder S, Tsolakis AV, et al. Metastatic type 1 gastric carcinoid: a real threat or just a myth? World J Gastroenterol (2013) 19(46):8687–95. doi: 10.3748/wjg.v19.i46.8687
36. Mastracci L, Rindi G, Grillo F, Solcia E, Campora M, Fassan M, et al. Neuroendocrine neoplasms of the esophagus and stomach. Pathologica (2021) 113(1):5–11. doi: 10.32074/1591-951X-229
37. Wei G, Feng X, Wang W, Zhang Y, Zeng Y, Chen M, et al. Analysis of risk factors of lymph node metastasis in rectal neuroendocrine neoplasms using multicenter data. Future Oncol (2018) 14(18):1817–23. doi: 10.2217/fon-2018-0059
38. Hanna A, Kim-Kiselak C, Tang R, Metz DC, Yang Z, DeMatteo R, et al. Gastric neuroendocrine tumors: reappraisal of type in predicting outcome. Ann Surg Oncol (2021) 28(13):8838–46. doi: 10.1245/s10434-021-10293-7
39. Choi TW, Kim JH, Yu MH, Park SJ, Han JK. Pancreatic neuroendocrine tumor: prediction of the tumor grade using CT findings and computerized texture analysis. Acta Radiol (2018) 59(4):383–92. doi: 10.1177/0284185117725367
40. Huang WP, Liu SY, Han YJ, Li LM, Liang P, Gao JB. Development of CT-based imaging signature for preoperative prediction of invasive behavior in pancreatic solid pseudopapillary neoplasm. Front Oncol (2021) 11:677814. doi: 10.3389/fonc.2021.677814
Keywords: gastric neuroendocrine neoplasm, tomography, x-ray computed, radiomics, prognosis
Citation: Yang Z-h, Han Y-j, Cheng M, Wang R, Li J, Zhao H-p and Gao J-b (2023) Prognostic value of computed tomography radiomics features in patients with gastric neuroendocrine neoplasm. Front. Oncol. 13:1143291. doi: 10.3389/fonc.2023.1143291
Received: 13 January 2023; Accepted: 05 June 2023;
Published: 20 June 2023.
Edited by:
Luca Volterrani, University of Siena, ItalyReviewed by:
Le Lu, Alibaba DAMO Academy USA, United StatesCopyright © 2023 Yang, Han, Cheng, Wang, Li, Zhao and Gao. This is an open-access article distributed under the terms of the Creative Commons Attribution License (CC BY). The use, distribution or reproduction in other forums is permitted, provided the original author(s) and the copyright owner(s) are credited and that the original publication in this journal is cited, in accordance with accepted academic practice. No use, distribution or reproduction is permitted which does not comply with these terms.
*Correspondence: Zhi-hao Yang, emhpaGFveWFuZ2NoaW5hQDE2My5jb20=
†These authors have contributed equally to this work and share first authorship
Disclaimer: All claims expressed in this article are solely those of the authors and do not necessarily represent those of their affiliated organizations, or those of the publisher, the editors and the reviewers. Any product that may be evaluated in this article or claim that may be made by its manufacturer is not guaranteed or endorsed by the publisher.
Research integrity at Frontiers
Learn more about the work of our research integrity team to safeguard the quality of each article we publish.