
95% of researchers rate our articles as excellent or good
Learn more about the work of our research integrity team to safeguard the quality of each article we publish.
Find out more
ORIGINAL RESEARCH article
Front. Oncol. , 08 May 2023
Sec. Cancer Molecular Targets and Therapeutics
Volume 13 - 2023 | https://doi.org/10.3389/fonc.2023.1142275
This article is part of the Research Topic Molecular Drivers of Prostate Cancer Pathogenesis and Therapy Resistance View all 5 articles
 Gelareh Vahabzadeh1
 Solmaz Khalighfard2
 Ali Mohammad Alizadeh3*Mahsa Yaghobinejad4Mahta Mardani3Tayebeh Rastegar4
 Mahmood Barati5Morad Roudbaraki6Ebrahim Esmati7Mohammad Babaei7Ali Kazemian7
Introduction: The present study aimed to investigate the interaction of the common lncRNA-miRNA-mRNA network involved in signaling pathways in different stages of prostate cancer (PCa) by using bioinformatics and experimental methods.
Methods: Seventy subjects included sixty PCa patients in Local, Locally Advanced, Biochemical Relapse, Metastatic, and Benign stages, and ten healthy subjects were entered into the current study. The mRNAs with significant expression differences were first found using the GEO database. The candidate hub genes were then identified by analyzing Cytohubba and MCODE software. Cytoscape, GO Term, and KEGG software determined hub genes and critical pathways. The expression of candidate lncRNAs, miRNAs, and mRNAs was then assessed using Real-Time PCR and ELISA techniques.
Results: 4 lncRNAs, 5 miRNAs, and 15 common target genes were detected in PCa patients compared with the healthy group. Unlike the tumor suppressors, the expression levels of common onco-lncRNAs, oncomiRNAs, and oncogenes showed a considerable increase in patients with advanced stages; Biochemical Relapse and Metastatic, in comparison to the primary stages; Local and Locally Advanced. Additionally, their expression levels significantly increased with a higher Gleason score than a lower one.
Conclusion: Identifying a common lncRNA-miRNA-mRNA network associated with prostate cancer may be clinically valuable as potential predictive biomarkers. They can also serve as novel therapeutic targets for PCa patients.
Prostate cancer (PCa) is the second most diagnosed cancer in males worldwide and causes more than 350,000 deaths annually (1). Rectal examinations and prostate-specific antigen (PSA) levels are the first steps to check for PCa. PSA evaluation is beneficial for early diagnosis, but insufficient for disease grouping. Because a high value might be present in a person without cancer, and a low value can be present in someone with cancer, PSA values are difficult to interpret (2, 3). Prostate biopsies can also cause considerable infectious complications, psychological damage, and financial costs. So, the development of novel molecular biomarkers for PCa detection has allowed for better therapeutic target evaluations and prognostic assessments (4). Indeed, it is essential to explore molecular mechanisms, such as non-coding RNAs (lncRNA and miRNA), and identify novel targets for developing predictive, prognostic, and therapeutic goals for PCa.
Non-coding RNAs are specific, accurate, and accessible noninvasively, which makes them appealing for use as biomarkers for identifying tumor presence and subtypes. They control numerous biological processes, including cell proliferation, differentiation, and apoptosis (5). They are also recognized as critical regulators in various networks as both tumor repressors and oncogenic. In this case, lncRNA and miRNA interaction by integrating mRNA can provide opportunities for further experimental studies and improved biomarker predictions for developing novel diagnostic approaches. For example, miR-21 is increased in PCa (6, 7), and its overexpression can activate TGF-β and Hedgehog signaling pathways, promoting invasion and metastasis (8). Therefore, detecting non-coding RNAs, actively released from tumor cells into body fluids, makes them suitable as diagnostic and therapeutic biomarkers (9). Herein, we aim to investigate the interactions between common lncRNA-miRNA-mRNA networks in patients with prostate cancer. We hypothesize that a better understanding of the underlying mechanisms involved in this network and identifying commonly expressed biomarkers at different stages of PCa can lead to developing predictive, prognostic, and therapeutic goals.
Expression profiles of mRNAs (GSE16120, GSE119195, GSE62872, GSE30994, GSE69223, GSE55945, GSE68555, GSE51066, GSE134499, GSE36135, GSE3325, GSE116918, GSE70770, and GSE35988) from PCa with different tumor stages (local, locally-advanced, biochemical relapse, and metastatic), normal samples, and benign tumor samples were extracted from the Gene Expression Omnibus (GEO) (https://www.ncbi.nlm.nih.gov/geo/) database. Gene expression information for Agilent-012097 Human 1A Microarray, Affymetrix Human Gene 1.0 ST Array, Agilent-014850 Whole Human Genome Microarray, Affymetrix Human Genome U133 Plus 2.0 Array, Affymetrix Human Genome U95A Array, Affymetrix Genome-Wide Human SNP 6.0 Array, Almac Diagnostics Prostate Disease-Specific Array, Agilent-039494 SurePrint G3 Human Gene Expression v2 8x60K Microarray, and Agilent-014698 Human Genome CGH Microarray 105A were obtained from prostate cancer patients with different tumor stages. GEPIA2 and cBioPortal analyze differentially expressed genes (DEGs) from the TCGA (10). The expression profile pattern of PCa patients was compared to that of healthy individuals to identify DEGs. The GSEs’ data were downloaded using the GEOquery R package. We analyzed the selected lncRNAs, miRNAs, and genes with P-value < 0.05 and |LogFC| > 1 in the datasets as differentially expressed genes (DEGs), differentially expressed miRNAs (DEMs), and differentially expressed lncRNAs (DELs) (11).
MiRNAs of candidate genes were identified in the miRWalk2, miRmap, OncomiR, miRGator 3.0, and miRCancerdb databases of the TCGA dataset (10). Moreover, LncRNA2target, TANRIC, LncRNADisease, Lnc2Cancer v3.0, and LncBase of the TCGA dataset were collected to identify candidate lncRNAs (11). Figure 1 shows the bioinformatics analyses.
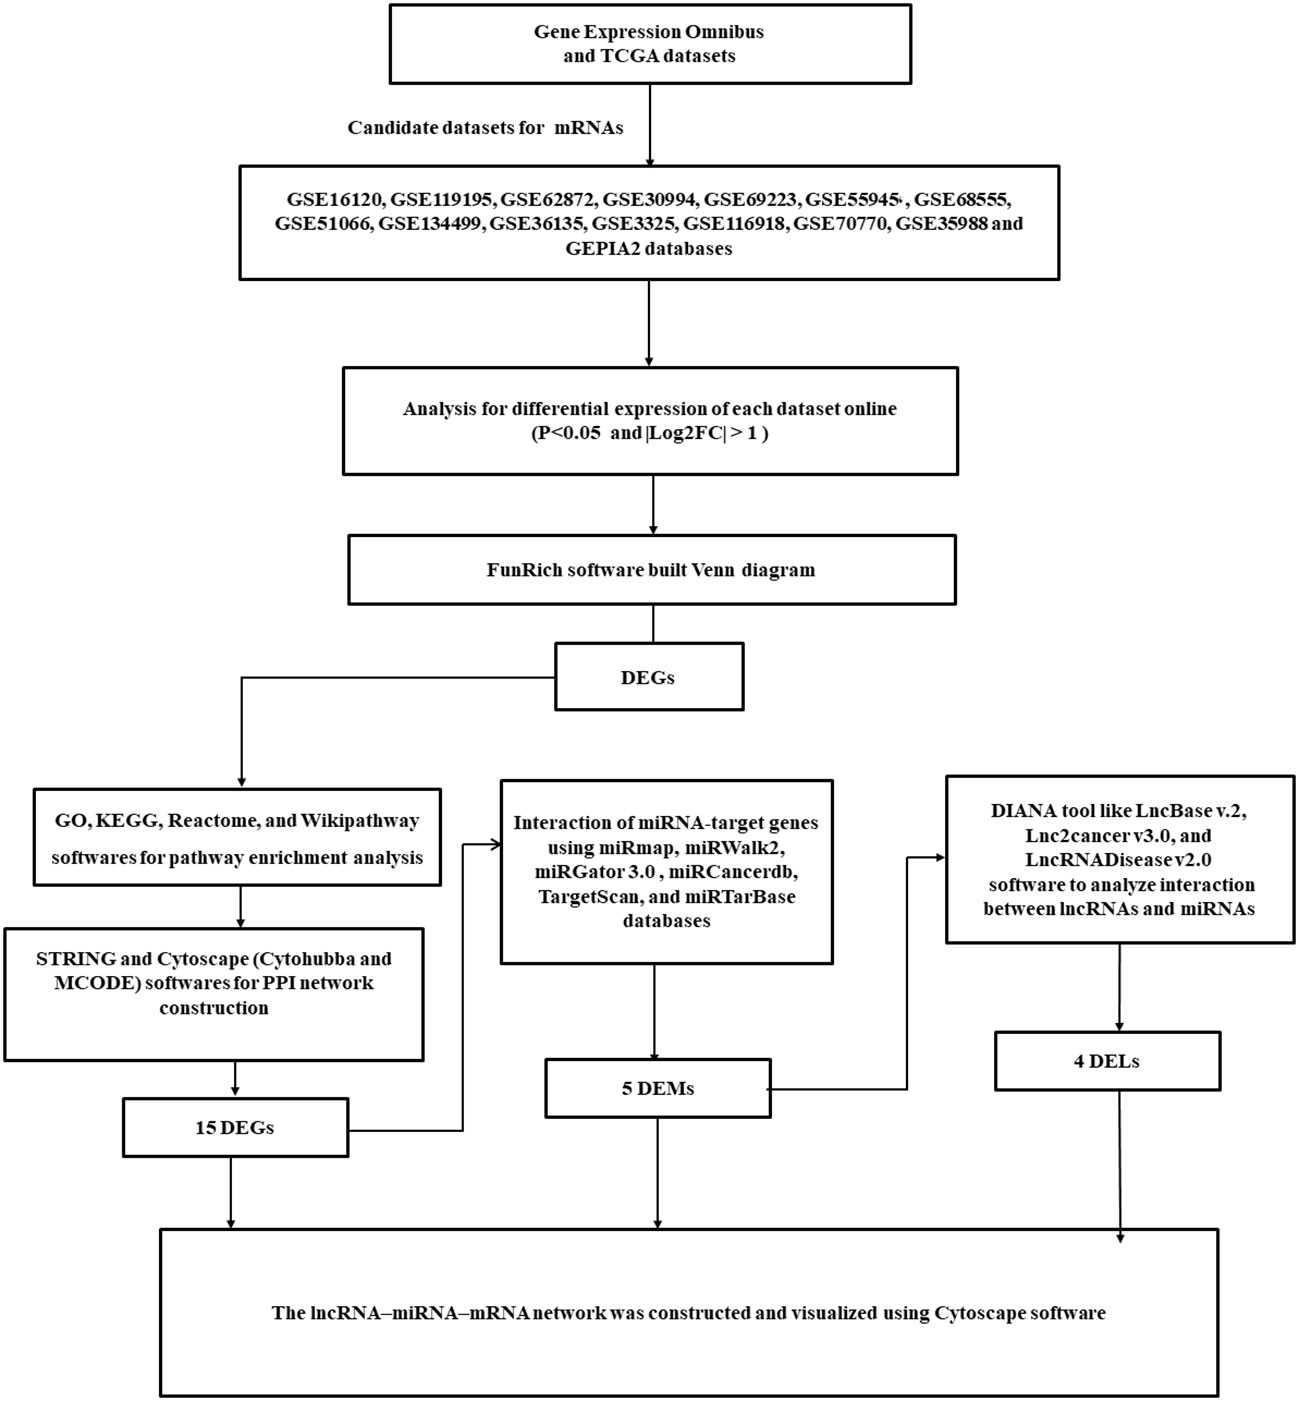
Figure 1 A flowchart diagram for analyzing bioinformatics data.
Cytoscape software uses the ClueGo tool to identify gene ontologies (11). It is accepted that p < 0.05 is statistically significant in GO analysis. Moreover, the Reactome and WikiPathway databases were used to identify signaling pathways (10). The Enrichr software performed pathway enrichment analyses of the DEGs.
STRING software predicted PPI network information. Candidate hub genes were identified by Cytohubba (Degree = 15) and MCODE (Degree Cutoff = 2, Node score cutoff = 2, and K-score = 2) tools on Cytoscape software. A ceRNA network between lncRNAs, miRNAs, and mRNAs was constructed using Cytoscape 3.7.1 software (10, 11).
Eighty PCa patients and ten healthy subjects were entered into the current study from September 2019 to September 2020. The eligible cases were categorized into six groups: Local (L, N = 22); those whose tumor has not spread outside the prostate capsule, Locally Advanced (LA, N = 9); those whose tumor has invaded the seminal vesicles and other pelvic organs, Biochemical Relapse (BR, N = 11); those in which PSA increased again after the treatment period, Metastatic (MET, N = 8); those whose cancer tissue has spread in secondary areas such as lungs and bones, and Benign Prostate Hypertrophy (BPH, N = 10) patients, and healthy samples based on pathologic reports.
1. Voluntary participation
2. Age 50−80 years
3. PCa patients (L, LA, BR, MET, and BPH)
4. Gleason degree 3-10
5. No family history of cancer
1. Voluntary participation
2. Age 50−80 years
3. No family history of cancer
4. Normal PSA
1. A history of other cancers
2. A history of diabetes
3. A hypertension history
4. Autoimmune diseases
Approximately 10 mL of blood samples were taken from all participants and centrifuged. The total RNA was then extracted by adding 1 mL TRIzol (Beijing Tian-166 Gen Biotech Co., Ltd.) to each sample according to the manufacturer’s instructions. The miRcute miRNA First-Strand cDNA Synthesis kit (Beijing Tiangen Biotech Co., Ltd.) and the cDNA Synthesis Kit Manual (TAKARA BIO INC. Cat. 6 30 v.0708) were utilized. The miRcute miRNA qPCR Detection Kit (Tiangen Biotech Co., Ltd.) was used for the qRT-PCR assays, and the SYBR Green method (AccuPower Green Star qPCR Master Mix; Bioneer, Korea) was used for mRNAs and lncRNAs using the ABI StepOne Plus System (Applied Biosystems; Thermo Fisher Scientific, Inc.) (10). For normalization, U6 and B-actin were used as internal controls. The fold changes of candidate lncRNAs, miRNAs, and mRNAs were calculated by the equation −ΔCT (11). The Supplementary File (S1) shows the primers’ list.
The statistical tests were conducted with GraphPad Prism 7.04 (San Diego, CA). The K-S test estimates data normality. ANOVA and t-tests were applied to analyze multiple and two groups. The Mann-Whitney U test evaluated nonparametric data. REST analyzed the PCR data. Regression analysis was performed to avoid bias in confounding variables. P < 0.05 was considered as a level of significance.
A total of 23 genes (9 up-regulation and 14 down-regulation) in the local group, 30 genes (17 up-regulation and 13 down-regulation) in the locally-advanced group, 68 genes (17 up-regulation and 51 down-regulation) in the metastatic group, 44 genes (9 up-regulation and 35 down-regulation) in the biochemical relapse group, and 228 genes (53 up-regulation and 175 down-regulation) in the BPH group (Figures 2A, B) were analyzed from GEO and TCGA datasets to identify differentially expressed genes in prostate cancer and healthy samples (Supplementary S2). A Venn diagram and Upset plot of DEGs at different stages of the disease were drawn by calculating and drawing custom Venn diagrams using the online tools and FunRich_3.1.3 software and upset plot using Up Set R package (Figure 2). Furthermore, differentially expressed miRNAs (Table 1) and lncRNAs (Table 2) were determined at various stages of prostate cancer.
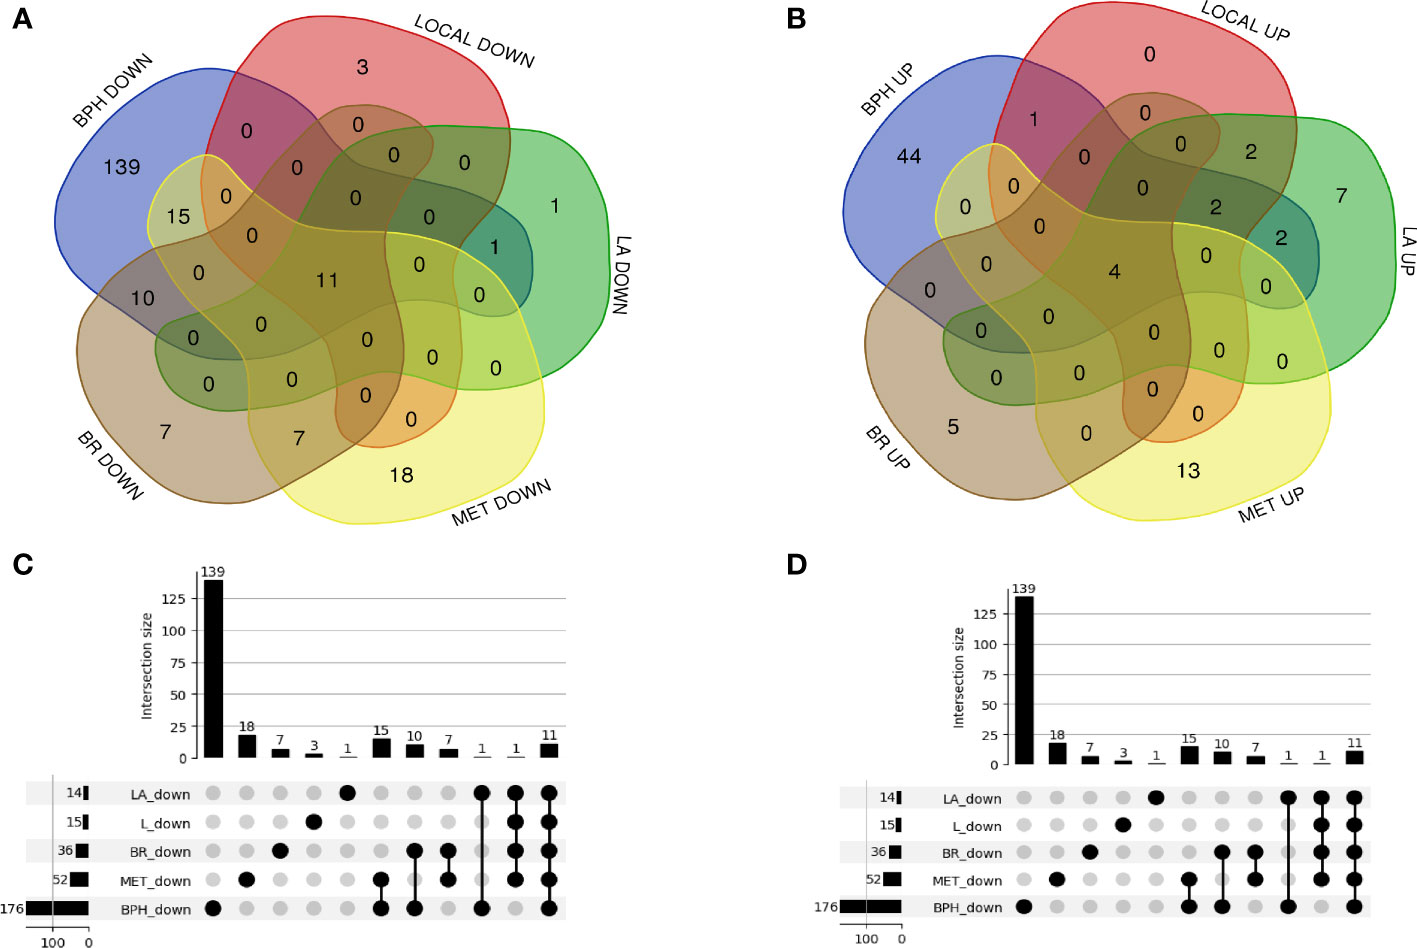
Figure 2 A Venn diagram and UpSet plot of the differently expressed mRNAs between the GEO and TCGA datasets (A, B) 23 genes (9 up-regulation and 14 down-regulation) in the local group, 30 genes (17 up-regulation and 13 down-regulation) in the locally advanced group, 68 genes (17 up-regulation and 51 down-regulation) in the metastatic group, 44 genes (9 up-regulation and 35 down-regulation) in the biochemical relapse group, and 228 genes (53 up-regulation and 175 down-regulation) in the BPH group were differentially expressed compared to healthy samples. (C, D) the UpSet plot of overlapped differential expression genes among candidate groups.
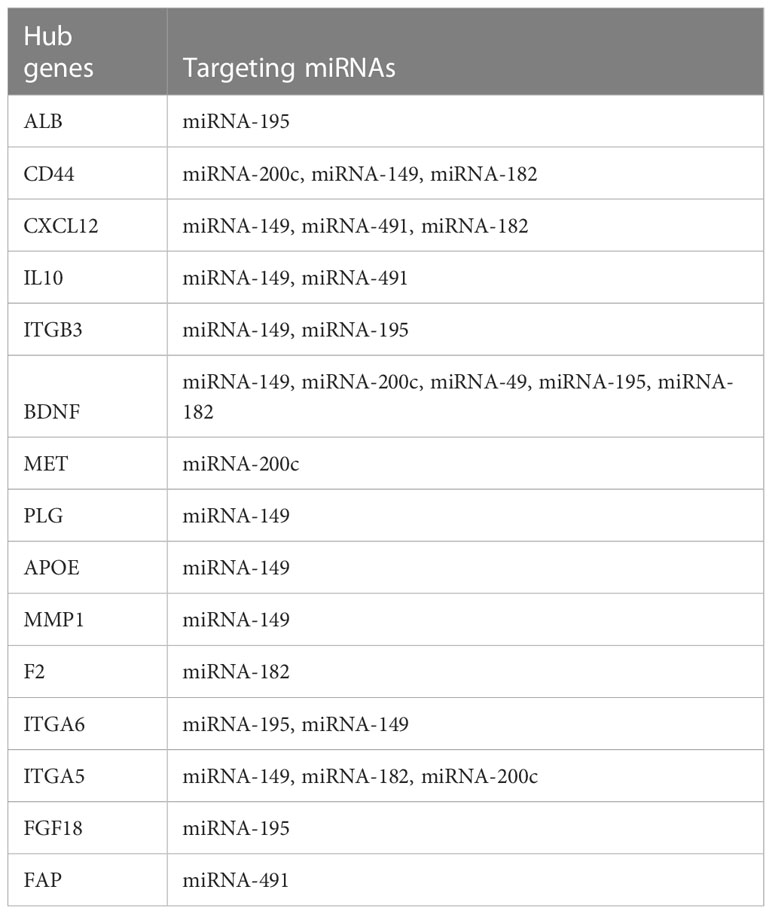
Table 1 Interaction between candidate mRNAs and target miRNAs in PCa.
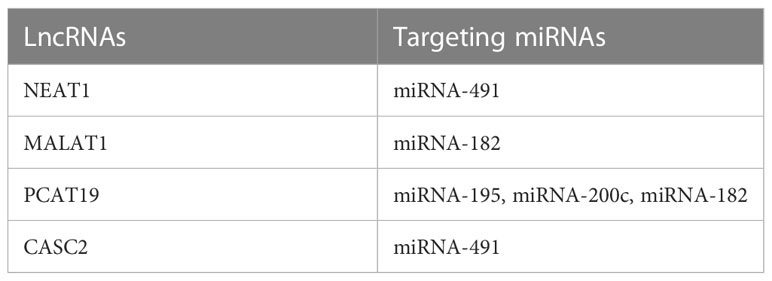
Table 2 Interaction between candidate miRNAs and target lncRNAs in PCa.
The GO analysis revealed the enriched pathways identified in the DEGs (Figure 3). Moreover, the signaling pathways involved in the hub genes from the Reactome, KEGG, and Wikipathway databases were listed in Figure 4. Databases’ common pathways involve focal adhesion and cell proliferation, such as PI3K/AKT/mTOR (Figure 4).
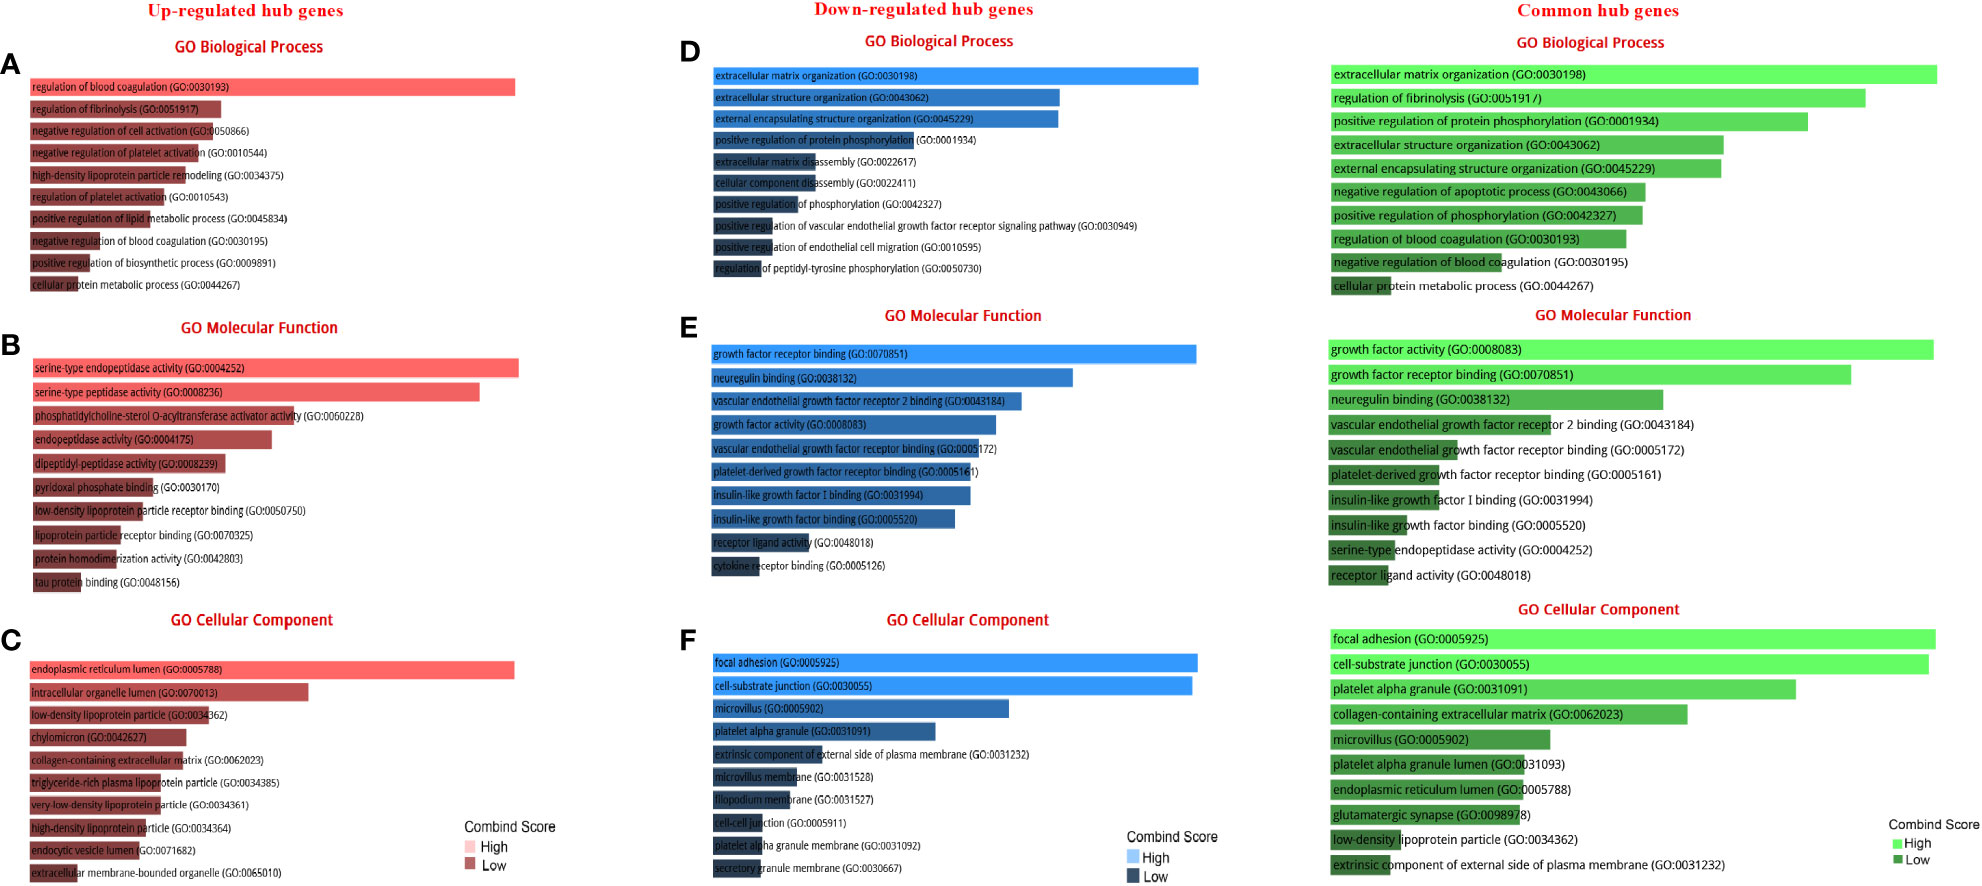
Figure 3 GO terms of DEGs between up- and down-regulated hub genes. (A) GO analysis of up-regulated DEGs related to biological processes. (B) GO analysis of up-regulated DEGs related to molecular functions. (C) GO analysis of up-regulated DEGs linked to cellular components. (D) GO analysis of down-regulated DEGs related to biological processes. (E) GO analysis of down-regulated DEGs linked to molecular functions. (F) GO analysis of down-regulated DEGs linked to cellular components.
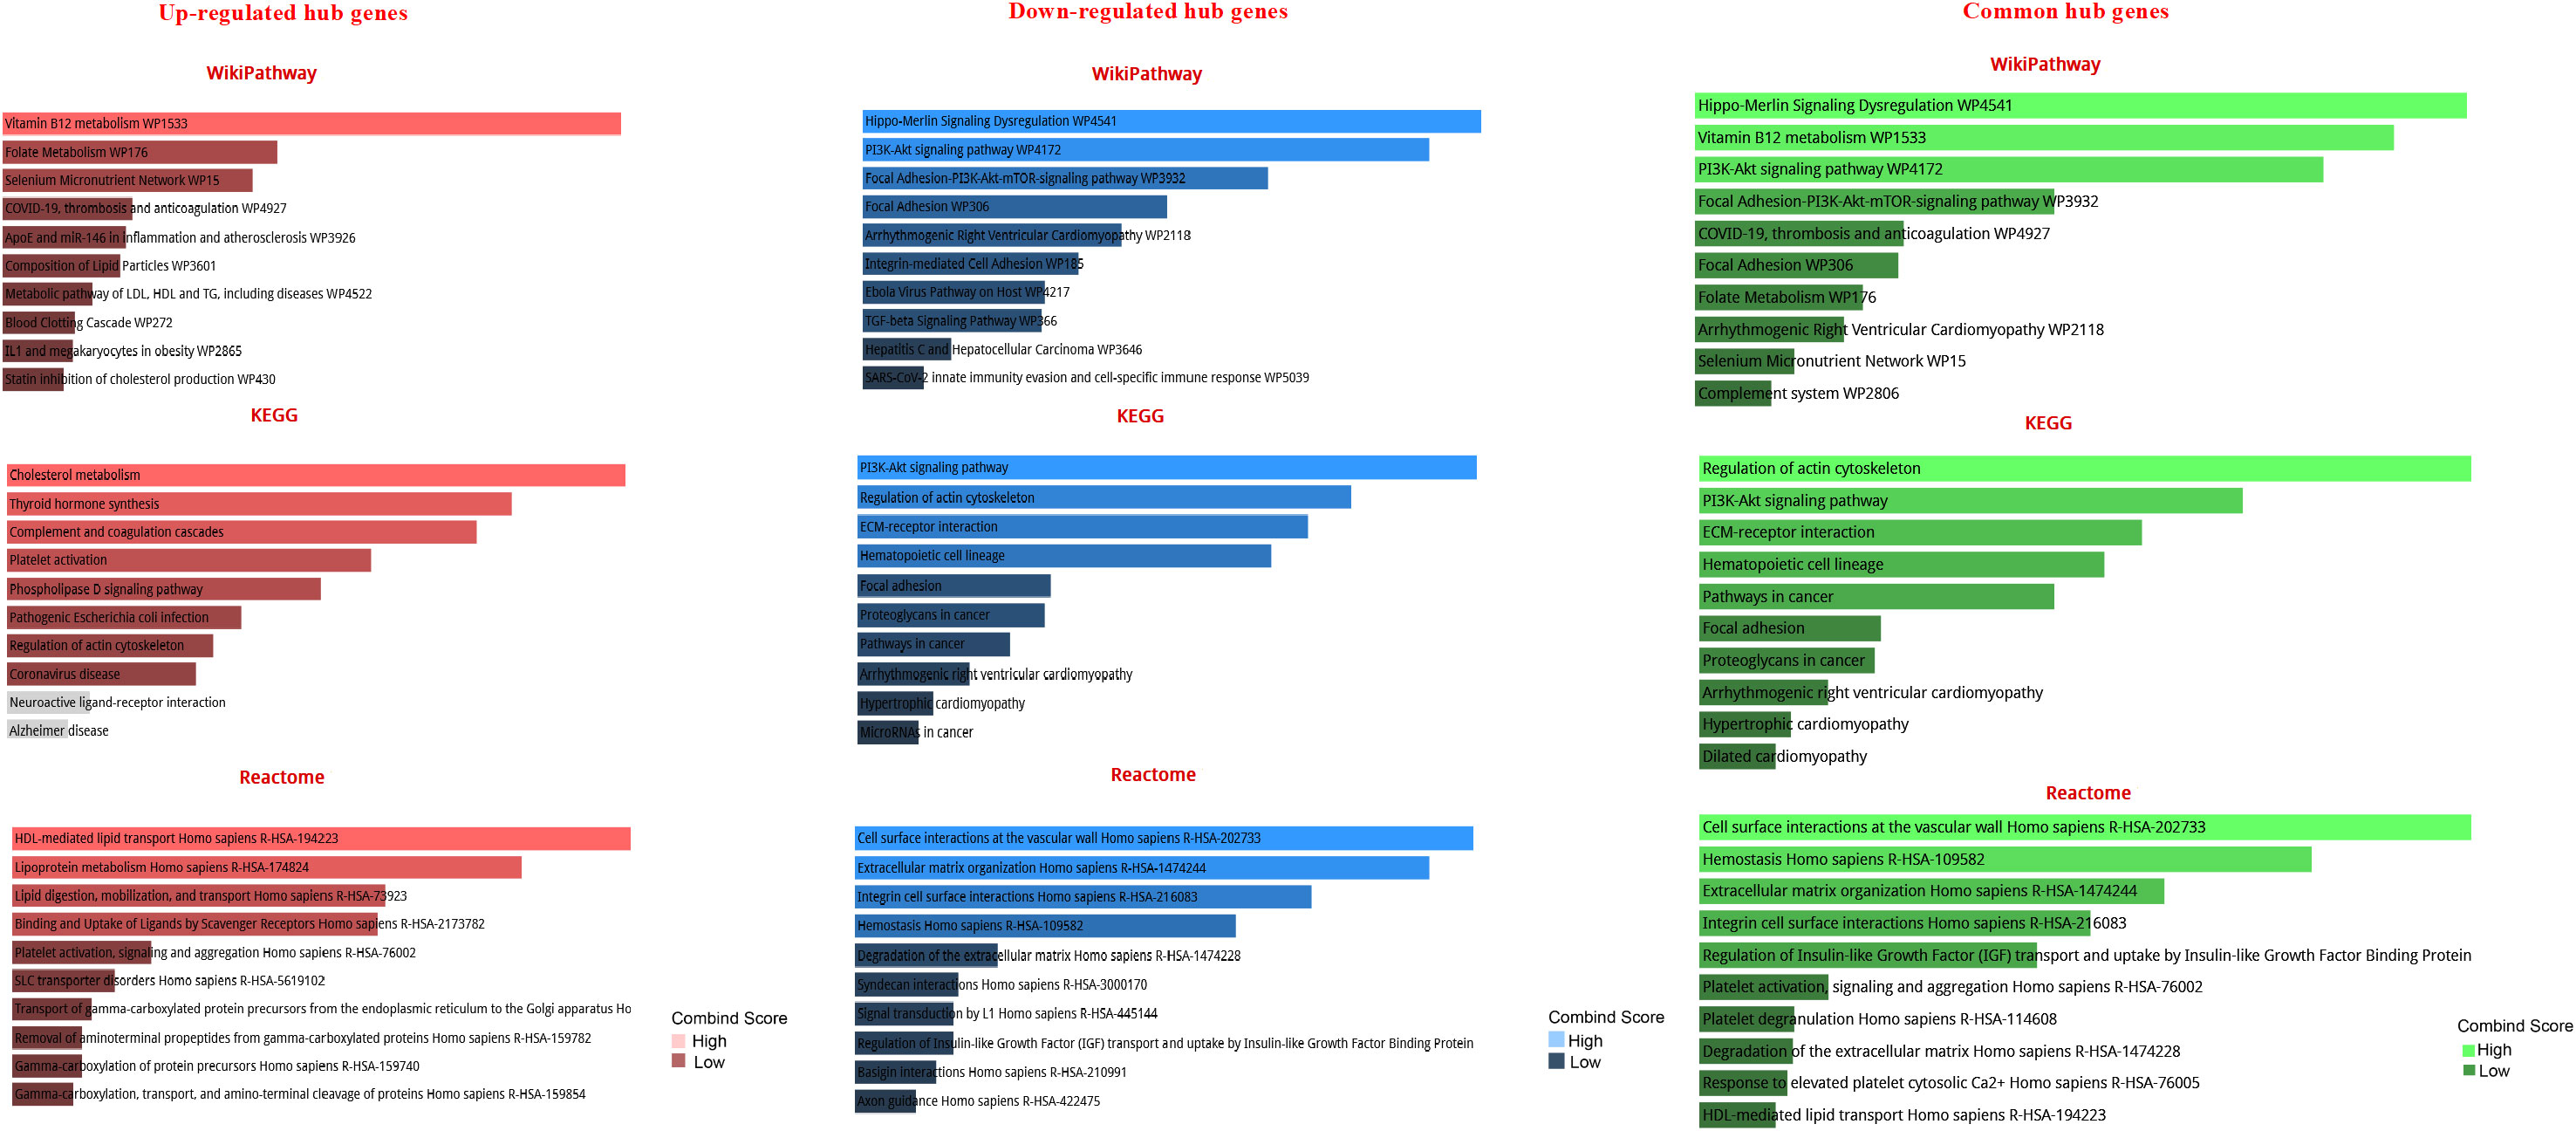
Figure 4 Pathway-based enrichment analysis of high-expressed hub genes and low-expressed hub genes at different stages of prostate cancer The top 10 functional pathways were associated with DEGs through WikiPathway, Reactome, and KEGG analyses with a p-value of less than 0.05.
STRING software was used to construct and predict PPI network information (Figure 5A). Candidate hub genes were identified by analyzing Cytohubba and MCODE software (Figure 5B). Our results showed 4 lncRNAs, 5 miRNAs, and 15 mRNAs from a regulatory lncRNA-miRNA-mRNA network in PCa patients (Figure 5B). Besides, a heatmap map of candidate lncRNAs’, miRNAs’, and mRNAs’ expressions was drawn by CIMminer software (Figure 6).
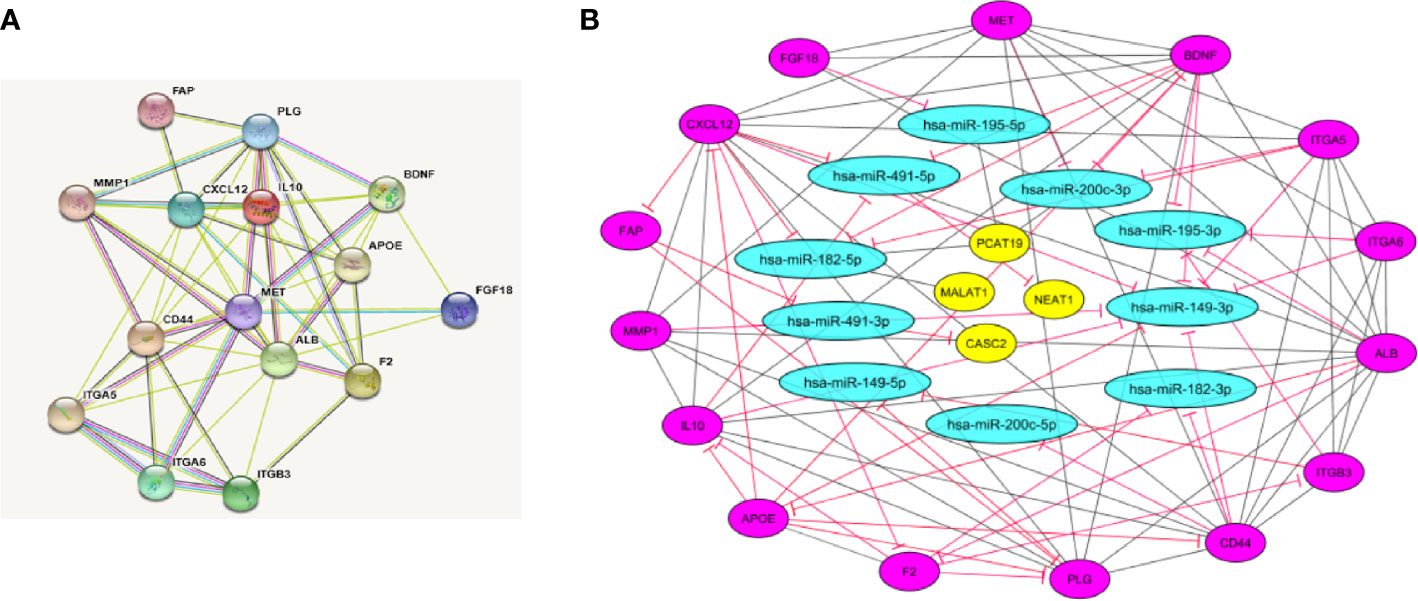
Figure 5 Protein-protein interaction (PPI) network construction. (A) PPI network was constructed with DEGs from GEO and TCGA datasets that show the interaction between hub genes by STRING software. (B) LncRNA-miRNA-mRNA network by Cytoscape software. The network includes 29 nodes and 88 edges. The yellow ellipse, blue ellipse, and purple ellipse oval represent lncRNAs, miRNAs, and mRNAs, respectively.
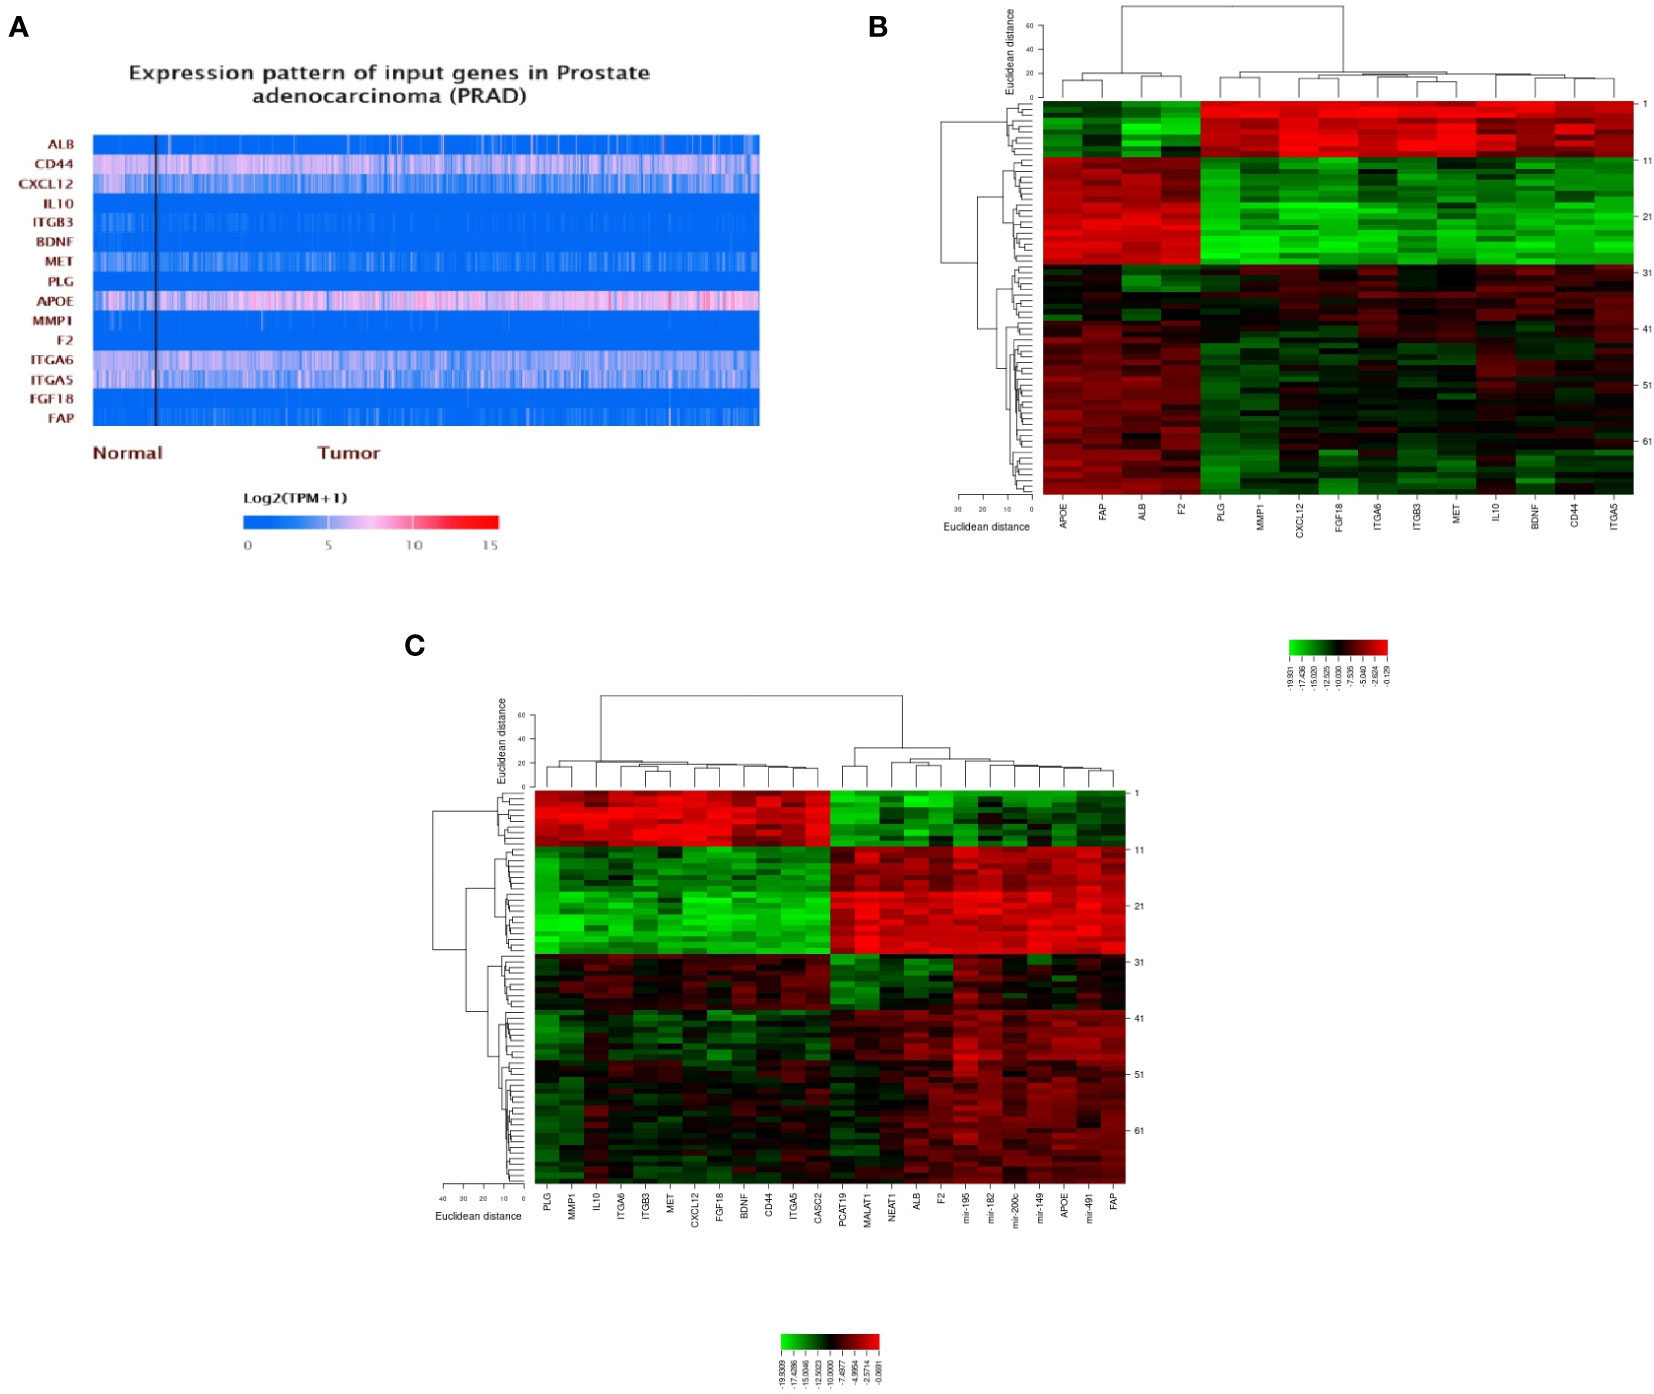
Figure 6 A plot heatmap showing the gene expression profile of DEGs in both bioinformatics (A) and experiment data (-ΔCT) (B, C) in PCa patients. The green color indicates down-regulated genes, and the red color indicates up-regulated genes between tumor and healthy samples.
The clinicopathological characteristics of the participants are summarized in Table 3. There were no significant differences in age, BMI, and prostate volume in the different groups. The most considerable tumor volume (cm3) belonged to the metastatic group (58.3 ± 7.7), and most prostate cancer patients had adenocarcinoma in pathology assessment. Except for the biochemical relapse group (due to surgery and complete prostate resection), serum PSA levels increased significantly with disease progression in other groups. All patients in the biochemical relapse group were given hormone therapy and a radical prostatectomy. All metastatic patients received hormone therapy and palliative radiotherapy. In the other groups, most received hormone therapy alone.
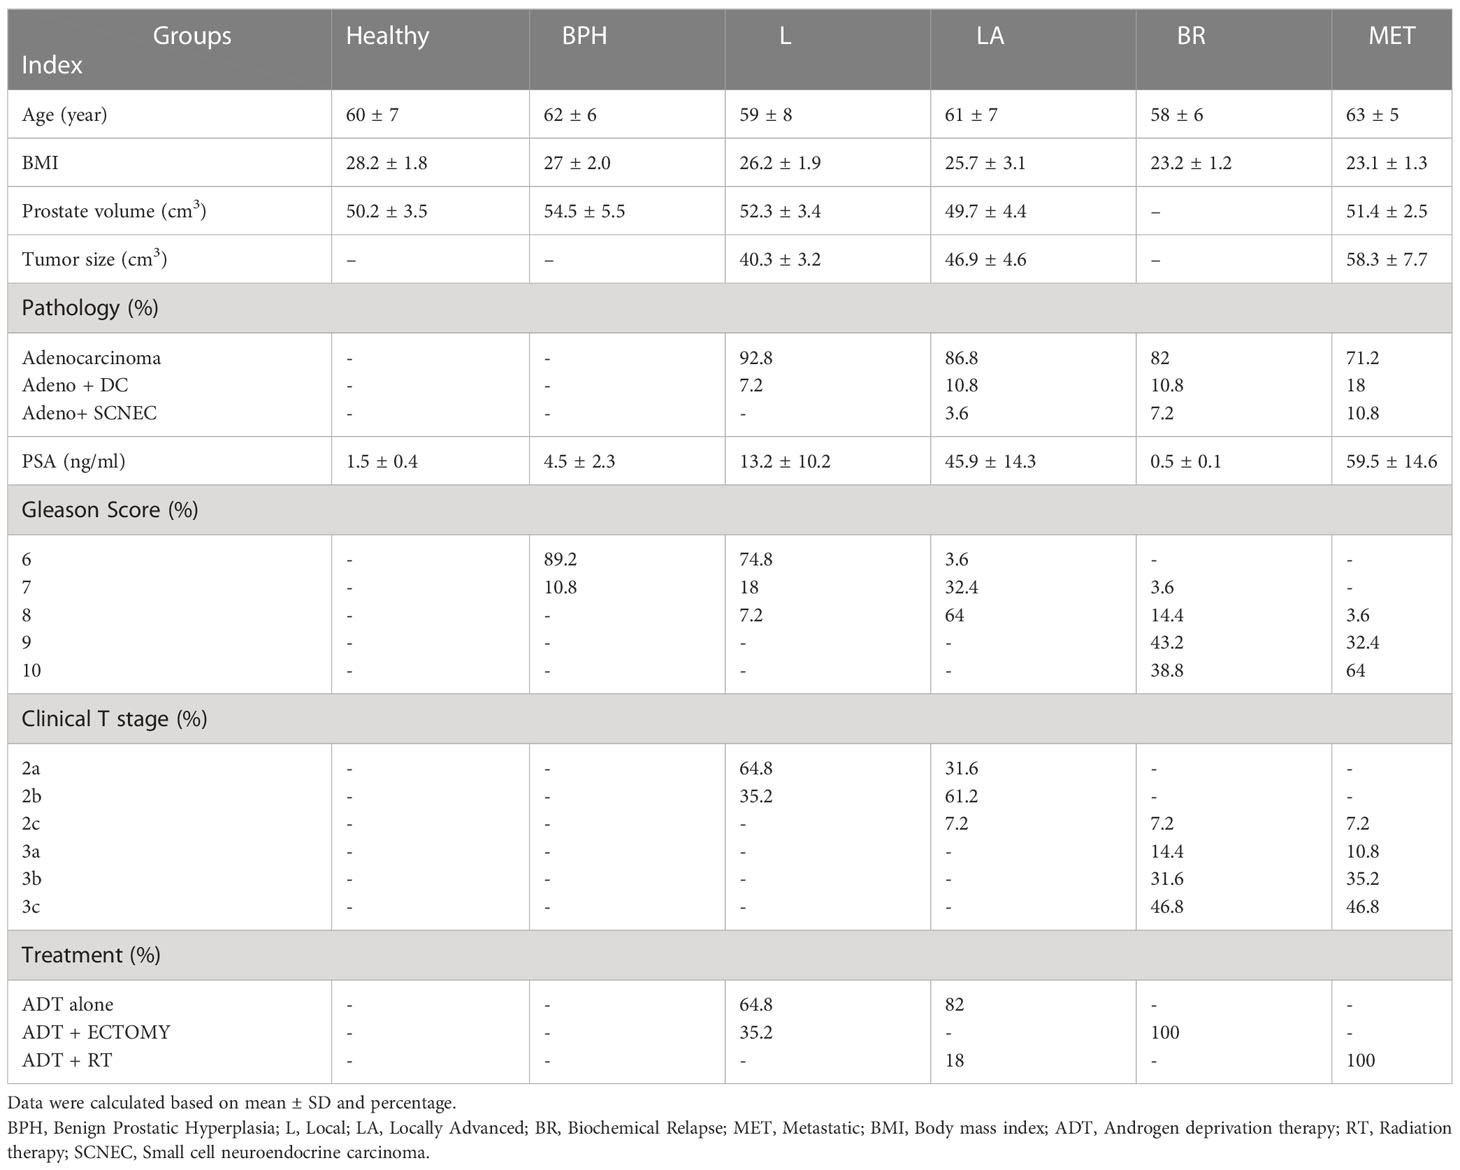
Table 3 Demographic data of PCa patients. .
The expression level of onco-lncRNAs, including PCAT19, MALAT1, and NEAT1, and the tumor suppressor lncRNA, CASC2, was increased and decreased, respectively, in PCa patients compared to the healthy group (P < 0.05) (Table 4). Interestingly, the altered expression levels of lncRNAs were significantly associated with increased tumor stages (Table 4) and Gleason score (Table 5).
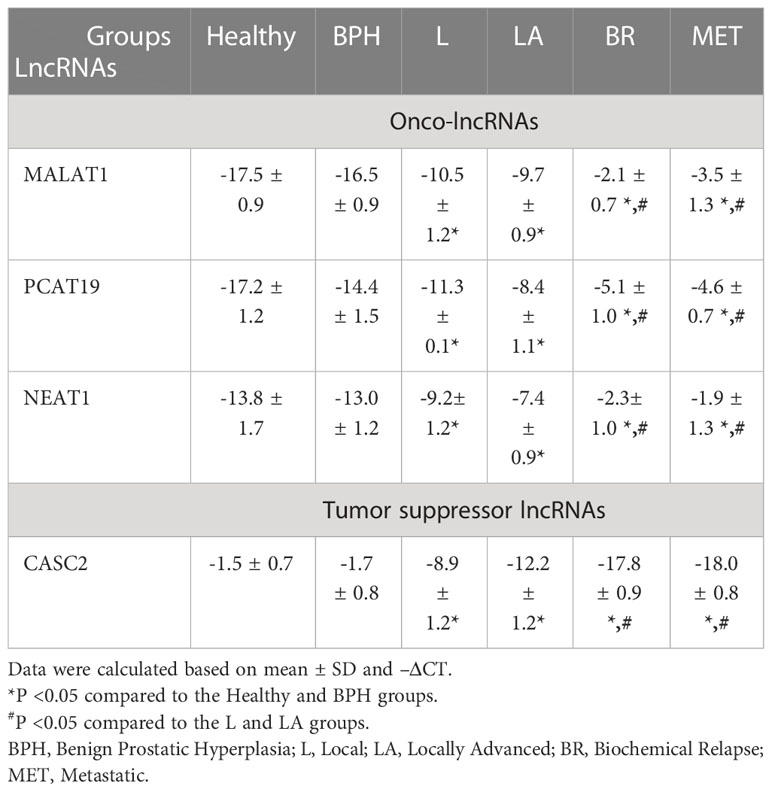
Table 4 The expression levels of candidate lncRNAs at different stages of PCa patients.
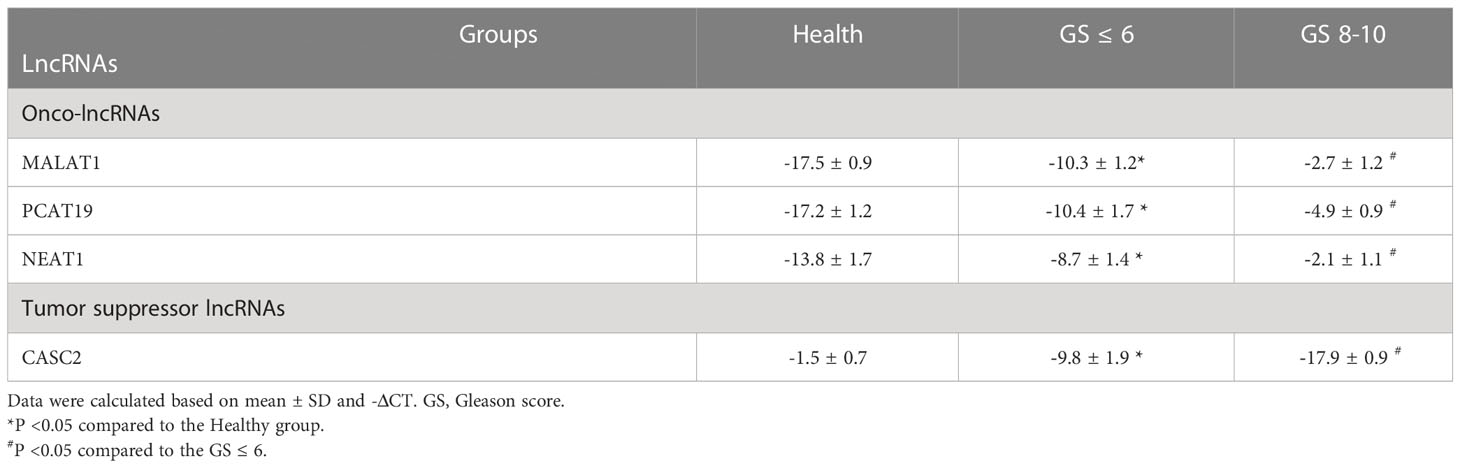
Table 5 The expression levels of candidate lncRNAs with Gleason degree in PCa patients.
Except for miRNA-195, the expression levels of the oncomiRs, including miRNA-491, miRNA-182, miRNA-149, and miRNA-200c, showed a significant increase in PCa patients compared to the healthy group (P < 0.05) (Table 6). Interestingly, except for miRNA-195, the expression levels of the mentioned other miRNAs were significantly associated with increased tumor stages (Table 6) and Gleason score (Table 7).
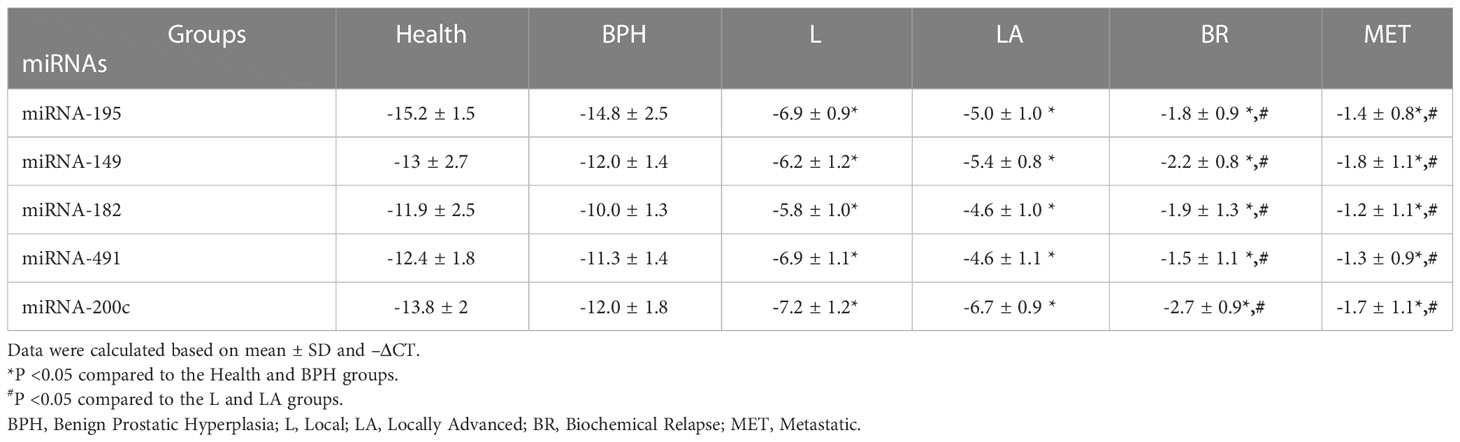
Table 6 The expression levels of candidate miRNAs in different stages of PCa patients.
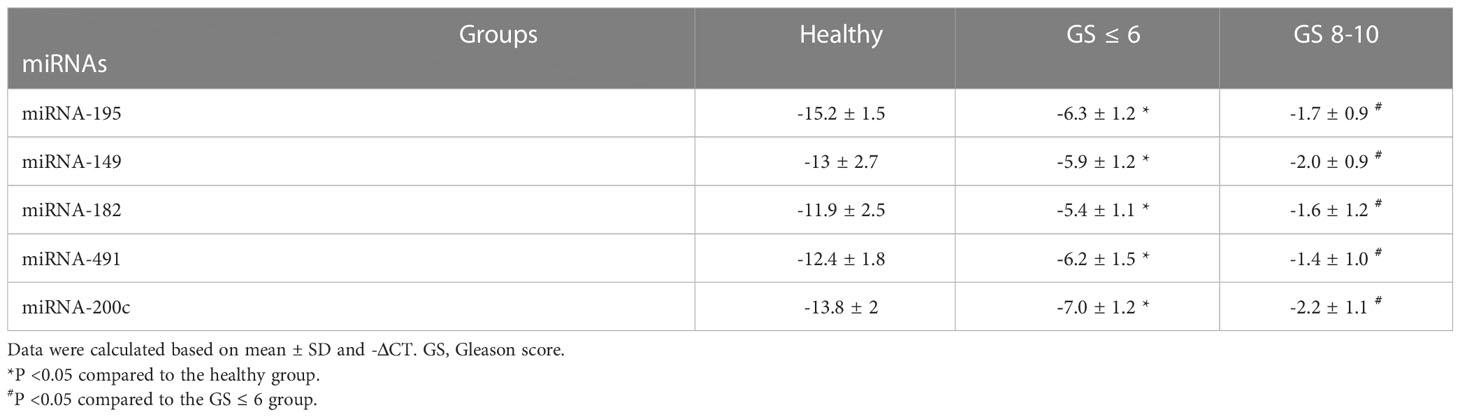
Table 7 The expression levels of candidate miRNAs with Gleason degree in PCa patients.
The expression levels of the oncogenes, including ALB, APOE, F2, and FAP, and the tumor suppressor genes, including BDNF, MET, PLG, MMP1, ITGA6, ITGA5, FGF18, CD44, CXCL12, IL10, and ITGB3, were significantly increased and decreased, respectively, in PCa patients compared to the healthy group (P < 0.05) (Table 8). A significant correlation was also found between altered expression levels and increased tumor stages (Table 8) and Gleason scores (Table 9).

Table 8 The expression levels of candidate mRNAs in different stages of PCa patients.
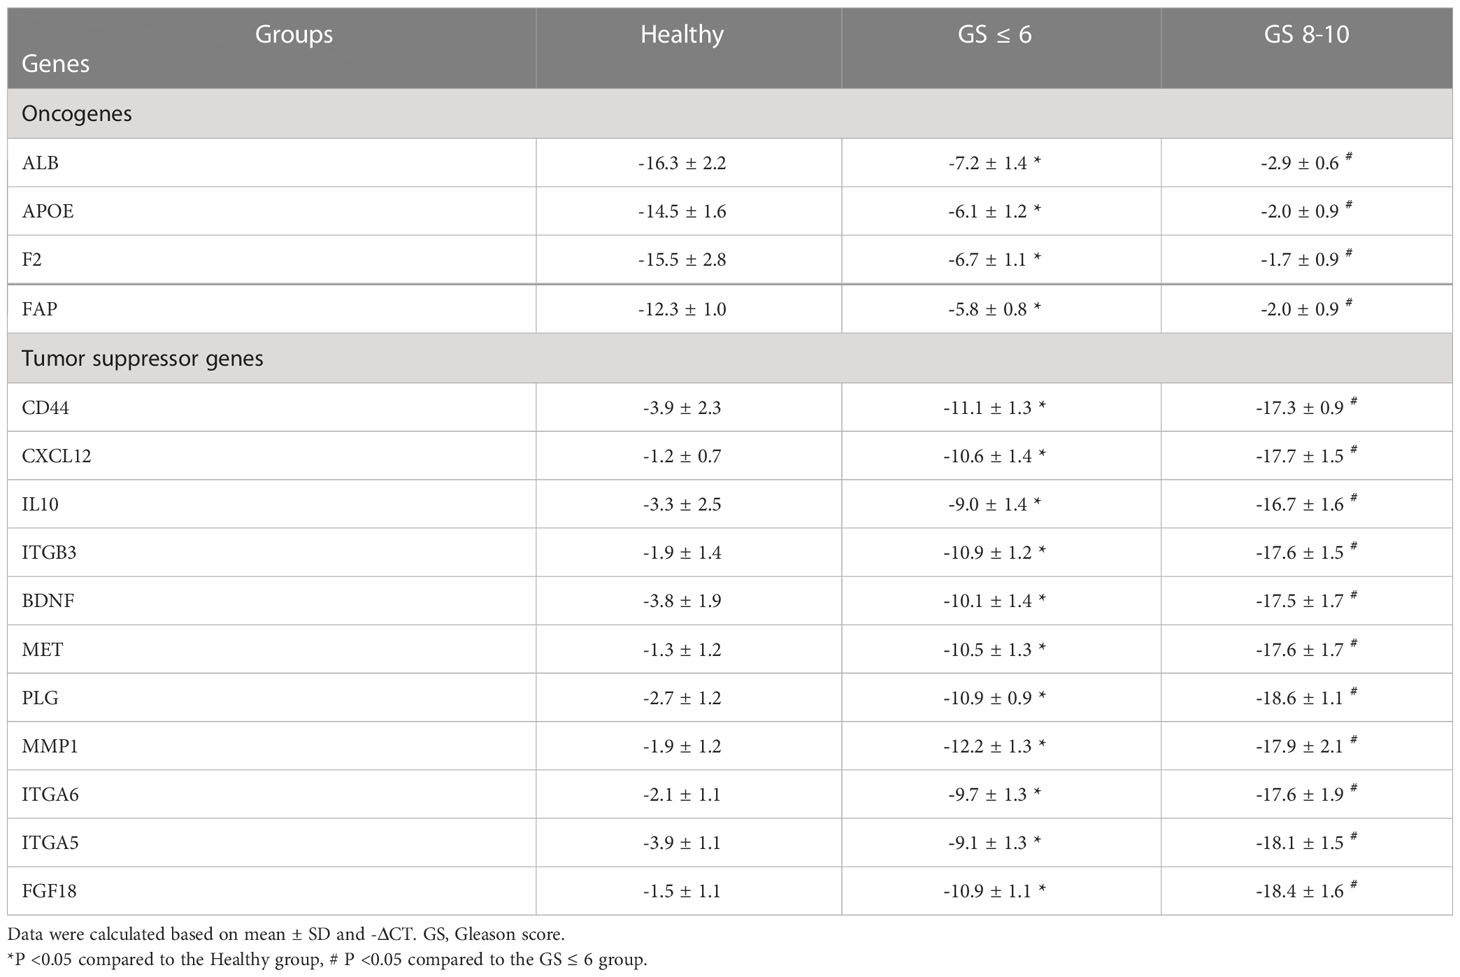
Table 9 The expression levels of candidate mRNAs with Gleason degree in PCa patients.
A heatmap of the expression of candidate lncRNAs, miRNAs, and mRNAs with clinicopathological Gleason scores was also generated by CIMminer. We showed that the high expression of the onco-lncRNAs, oncomiRNAs, and oncogenes, and the low expression of the tumor suppressors have led to increases in Gleason scores (Figure 7).
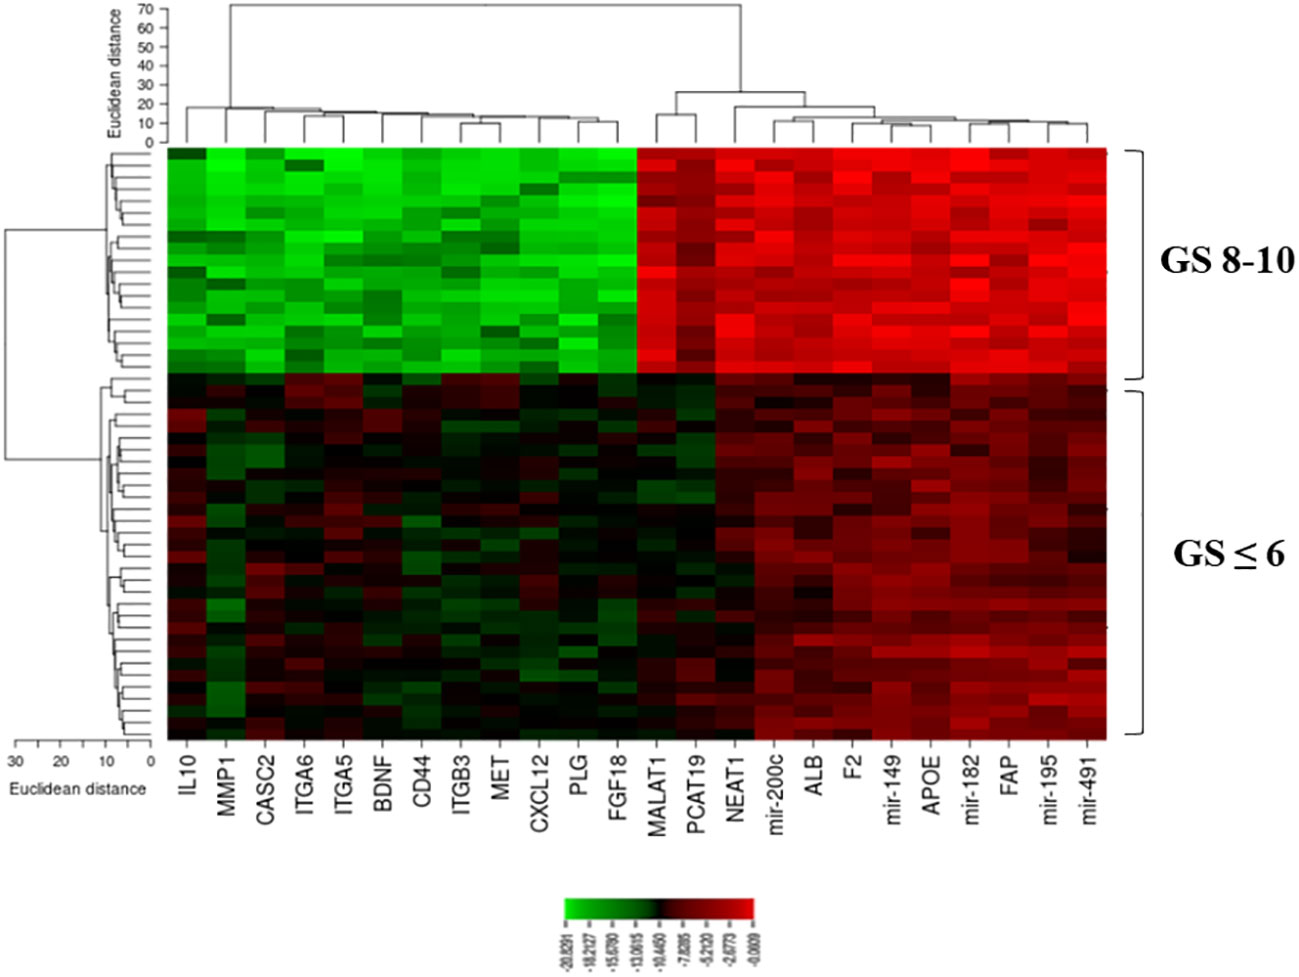
Figure 7 A plot heatmap showing the lncRNA-miRNA-mRNA network with Gleason score (≤ 6 and 8-10) in PCa patients. The green color indicates down-regulated lncRNA-miRNA-mRNA and the red color indicates up-regulated lncRNA-miRNA-mRNA.
Moreover, we compared candidate biomarkers’ profiles according to age. Our analysis showed no significant difference between lncRNA, miRNA, and mRNA expression with participants’ age.
The present study aimed to investigate the underlying pathophysiological pathways involved in different stages of prostate cancer tumors. Our results revealed a significant reduction in tumor suppressor lncRNAs, miRNAs, and mRNAs alongside a considerable increase in onco-lncRNAs, oncomiRNAs, and oncogenes at different stages of prostate cancer. Likewise, these biomarkers with a higher Gleason score were significantly increased compared to tumors with lower Gleason scores. Furthermore, increased PSA levels were associated with advanced disease stages in prostate cancer. Thus, the interactions between lncRNAs, miRNAs, and mRNAs could contribute to finding novel biomarkers for assessing treatment response in PCa patients. Therefore, a better understanding of miRNA-lncRNA-mRNA signaling pathways may identify novel therapeutic targets for PCa patients.
Many patients suffering from advanced PCa will ultimately relapse after initial chemotherapy and hormone therapy-based regimens (12). Numerous genetic alterations concerning cell death and survival signaling processes may be responsible for PCa induction in this setting. Over the past decade, several investigations have been conducted concerning prostate cancer-related protein-encoding genes (13). However, only 2% of human transcriptomes are protein-coding RNAs (14). In order to better understand the underlying mechanisms of PCa initiation and progression, non-coding RNAs should be investigated (15, 16). Previous studies demonstrated that ceRNAs play pivotal roles in Pca progression and metastasis and even resistance to treatment (17). Recently, Liu et al. (18) showed that some miRNAs, such as miRNA-141, could reduce cancer growth and metastasis through several mechanisms (18). They also reported that miRNA-34a could directly prevent Pca regeneration and metastasis by suppressing the CD44 gene (19). Scheffer et al. (20) indicated that miRNAs -96, -149, -181b, -182, -205, and -375 were differentially expressed in prostate tumor tissues, while miRNAs -31, -96, and -205 exhibited a significant correlation with Gleason score (20). Furthermore, Borkowetz et al. (21) revealed that PSA’s diagnostic potential will significantly increase in combination with miRNA-16 and miRNA-195 as diagnostic biomarkers (21). Similarly, our results showed that the expression levels of miRNAs -491, -182, -149, and -200c were significantly increased in PCa patients compared to the healthy group which was significantly associated with advanced tumor stages.
Moreover, Aiello et al. (22) demonstrated that lncRNAs, such as HOTAIR and MALAT1, were associated with both ERα/ERβ steroid receptors in prostate cancer patients. Inhibition of MALAT1 led to better treatment response (22). Another study indicated that MALAT1 overexpression was associated with poor prognostic markers, including high Gleason score, metastasis stage, and serum PSA > 20 ng/ml. In concordance with our results, its expression was significantly increased in patients who experienced disease relapse (23). Ramnarine et al. (2018) revealed that several lncRNAs were involved in developing PCa (24). Zhang et al. (25) indicated that cell proliferation in hormone-refractory PCa was stimulated by lncRNAs (25). Similarly, our results demonstrated a significant increase in onco-lncRNAs, such as PCAT19, MALAT1, and NEAT1, and a decreased expression level of CASC2 in PCa patients.
Additionally, several studies investigated the interactions between lncRNAs, miRNAs, and mRNAs in various malignancies. A study indicated that elevated miRNA-182-5p was associated with cancer cells’ mitotic arrest through MALAT1 expression (26). Wang et al. (27) revealed an inverse correlation of expression between miRNA-195-5p and FGF in human cancer tissues (27). Regarding the ceRNA hypothesis in PCa, Xu et al. (28) revealed a ceRNA network of 63 prostate cancer-specific lncRNAs, 13 miRNAs, and 18 mRNAs. They also established a predictive model for overall survival using HOXB5, GPC2, PGA5, and AMBN (28). Besides, Jiang et al. (29) constructed a ceRNA network that included 23 lncRNAs, 6 miRNAs, and 2 mRNAs differentially expressed in PCa. However, only 3 lncRNAs were significantly associated with overall survival (29).
Basically, androgen/androgen receptor (AR) signaling is crucial for both normal prostate development and tumorigenesis which regulates a series of cancer biological processes including cell proliferation and metastasis (30, 31). Interestingly, several studies confirmed that AR-bound ceRNAs are required for AR interaction (32, 33). AR could directly target miRNAs and lncRNAs in PCa cells, which were recognized by microarray or RNA sequencing (34, 35). These studies strongly suggested that several ceRNAs containing specific sequences could bind to AR and other steroid receptors to stop their transcriptional activities (36). In this case, androgen deprivation therapy (ADT) is the standard management for patients with recurrences after primary treatment (37). Moreover, most primary cancers acquire ADT resistance and progress to castration-resistant PCa (38). Therefore, there is a critical need to clarify the molecular mechanisms contributing to the development of AR-dependent patients for emerging substitute therapeutic opportunities in advanced PCa. AR’s role and interaction with the network are poorly described. However, recent studies provide substantial evidence for this crosstalk in PCa. Several lncRNA-miRNA-mRNA networks are aberrantly expressed with significant contributions to PCa cell initiation and progression (39, 40). Application of their inhibitors can limit off-target or non-specific effects by avoiding targeting ceRNA complexes. Ostling et al. (2011) showed 78 ceRNA inhibitors to significantly modulate AR reporter activity (41). Some of them may activate or repress mRNA translations (42, 43). Further studies are required to disentangle these conflicting outcomes.
Herein, we investigated commonly expressed lncRNA, miRNA, and target genes at different stages of prostate cancer. We hypothesized that a better understanding of the lncRNA-miRNA-mRNA network might develop novel therapeutic options for PCa patients. Finding therapeutic targets expressed at all prostate cancer stages has several advantages. However, there are some advantages and disadvantages. We used a large number of data from different sources to minimize off-target findings. Our patient-derived data showed network overlap. Cancer patients at any stage of the disease will benefit from their medicinal properties. While there is an association between disease stage and biomarker expression levels, these may be considered predictive biomarkers for treatment response. Since we demonstrated a significant difference in the expression levels of indicated lncRNAs and miRNAs in normal tissue and benign prostate hyperplasia, these biomarkers can act as a potential diagnostic biomarker in combination with PSA to increase diagnostic accuracy. Taken together, we introduced several promising diagnostic biomarkers. Further studies should identify this issue as a second-level test for patients. Some limitations merit consideration. First, due to the limited sample size, we could not evaluate the diagnostic accuracy of indicated lncRNAs and miRNAs as predictive tools. Therefore, future studies are warranted in this regard. Second, bioinformatic analysis predicted an interaction between lncRNAs and miRNAs. In vitro assessments directly evaluate the potential interactions between each lncRNA and its associated miRNA. Third, assessing the prognostic significance of the indicated lncRNAs and miRNAs regarding other clinical outcomes of patients and survival is warranted.
We have identified a common lncRNA-miRNA-mRNA network associated with prostate cancer, which may be clinically valuable as potential predictive biomarkers. These biomarkers might also serve as novel therapeutic targets or potential prognostic indicators for PCa patients.
The data analyzed in this study is subject to the following licenses/restrictions: The data supporting this study’s findings are available from the corresponding author, AA, upon reasonable request. Requests to access these datasets should be directed to AA,YWFsaXphZGVoQHNpbmEudHVtcy5hYy5pcg==.
The studies involving human participants were reviewed and approved by Iran University of Medical Sciences (NO: IR.IUMS.REC.1399.1348). The patients/participants provided their written informed consent to participate in this study.
GV: study concept and design and manuscript revision. SK: sample processing, data analysis, and manuscript preparation. AMA: study concept and design, data analysis, and manuscript revision. MY: sample collection. MM: manuscript preparation. TR and MaB: sample processing. MR: manuscript preparation. EE, MoB, and AK: sample collection. All authors contributed to the article and approved the submitted version.
Elite Researcher Grant Committee supported the research reported in this publication under award number (Grant Number: 995719) from the National Institute for Medical Research and Development (NIMAD), Tehran, Iran. This study was also funded by the Iran University of Medical Sciences (Grant Number: 19375). None of the funding sources had any role in the study design, data collection, analysis, interpretation, or the decision to submit the article for publication.
The authors declare that the research was conducted in the absence of any commercial or financial relationships that could be construed as a potential conflict of interest.
All claims expressed in this article are solely those of the authors and do not necessarily represent those of their affiliated organizations, or those of the publisher, the editors and the reviewers. Any product that may be evaluated in this article, or claim that may be made by its manufacturer, is not guaranteed or endorsed by the publisher.
The Supplementary Material for this article can be found online at: https://www.frontiersin.org/articles/10.3389/fonc.2023.1142275/full#supplementary-material
1. Bray F, Ferlay J, Soerjomataram I, Siegel RL, Torre LA, Jemal A. Global cancer statistics 2018: GLOBOCAN estimates of incidence and mortality worldwide for 36 cancers in 185 countries. CA: Cancer J Clin (2018) 68(6):394–424. doi: 10.3322/caac.21492
2. Schröder FH, Hugosson J, Roobol MJ, Tammela TL, Zappa M, Nelen V, et al. Screening and prostate cancer mortality: results of the European randomised study of screening for prostate cancer (ERSPC) at 13 years of follow-up. Lancet (2014) 384(9959):2027–35. doi: 10.1016/S0140-6736(14)60525-0
3. Ralston SH, Penman ID, Strachan MW, Hobson R, editors. Davidson's Principles and Practice of Medicine E-Book. Elsevier Health Sciences. (2018).
4. Loeb S, van den Heuvel S, Zhu X, Bangma CH, Schröder FH, Roobol MJ. Infectious complications and hospital admissions after prostate biopsy in a European randomized trial. Eur Urol (2012) 61(6):1110–4. doi: 10.1016/j.eururo.2011.12.058
5. Avgeris M, Stravodimos K, Fragoulis E, Scorilas A. The loss of the tumour-suppressor miR-145 results in the shorter disease-free survival of prostate cancer patients. Br J Cancer (2013) 108(12):2573–81. doi: 10.1038/bjc.2013.250
6. Ribas J, Ni X, Haffner M, Wentzel EA, Salmasi AH, Chowdhury WH, et al. miR-21: an androgen receptor–regulated microRNA that promotes hormone-dependent and hormone-independent prostate cancer growth. Cancer Res (2009) 69(18):7165–9. doi: 10.1158/0008-5472.CAN-09-1448
7. Folini M, Gandellini P, Longoni N, Profumo V, Callari M, Pennati M, et al. miR-21: an oncomir on strike in prostate cancer. Mol Cancer (2010) 9:12. doi: 10.1186/1476-4598-9-12
8. Bonci D, Coppola V, Patrizii M, Addario A, Cannistraci A, Francescangeli F, et al. A microRNA code for prostate cancer metastasis. Oncogene (2016) 35(9):1180–92. doi: 10.1038/onc.2015.176
9. Taylor DD, Gercel-Taylor C. MicroRNA signatures of tumor-derived exosomes as diagnostic biomarkers of ovarian cancer. Gynecol Oncol (2008) 110(1):13–21. doi: 10.1016/j.ygyno.2008.04.033
10. Mohsenikia M, Khalighfard S, Alizadeh AM, Khori V, Ghandian Zanjan M, Zare M, et al. An innovative systematic approach introduced the involved lncRNA-miR-mRNA network in cell cycle and proliferation after conventional treatments in breast cancer patients. Cell Cycle (2022) 21(16):1753–74. doi: 10.1080/15384101.2022.2070104
11. Khalighfard S, Kalhori MR, Amiriani T, Poorkhani A, Khori V, Esmati E, et al. A systematic approach introduced novel targets in rectal cancer by considering miRNA/mRNA interactions in response to radiotherapy. Cancer biomark (2022) 33(1):97–110. doi: 10.3233/CBM-210079
12. Siegel RL, Miller KD, Jemal A. Cancer statistics 16. CA Cancer J Clin (2016) 66(1):7–30. doi: 10.3322/caac.21332
13. Edwards DR, Moroz K, Zhang H, Mulholland D, Abdel-Mageed AB, Mondal D. PRL−3 increases the aggressive phenotype of prostate cancer cells in vitro and its expression correlates with high-grade prostate tumors in patients. Int J Oncol (2018) 52(2):402–12. doi: 10.3892/ijo.2017.4208
14. Consortium EP. Identification and analysis of functional elements in 1% of the human genome by the ENCODE pilot project. Nature (2007) 447(7146):799–816. doi: 10.1038/nature05874
15. Xiao H, Zhang F, Zou Y, Li J, Liu Y, Huang W. The function and mechanism of long non-coding RNA-ATB in cancers. Front Physiol (2018) 9:321. doi: 10.3389/fphys.2018.00321
16. Ebert MS, Neilson JR, Sharp PA. MicroRNA sponges: competitive inhibitors of small RNAs in mammalian cells. Nat Methods (2007) 4(9):721–6. doi: 10.1038/nmeth1079
17. Liu X, Tong Y, Xia D, Peng E, Yang X, Liu H, et al. Circular RNAs in prostate cancer: biogenesis, biological functions, and clinical significance. Mol Ther Nucleic Acids (2021) 26:1130–47. doi: 10.1016/j.omtn.2021.10.017
18. Liu C, Liu R, Zhang D, Deng Q, Liu B, Chao H-P, et al. MicroRNA-141 suppresses prostate cancer stem cells and metastasis by targeting a cohort of pro-metastasis genes. Nat Commun (2017) 8:14270. doi: 10.1038/ncomms14270
19. Liu C, Kelnar K, Liu B, Chen X, Calhoun-Davis T, Li H, et al. The microRNA miR-34a inhibits prostate cancer stem cells and metastasis by directly repressing CD44. Nat Med (2011) 17(2):211–5. doi: 10.1038/nm.2284
20. Schaefer A, Jung M, Mollenkopf HJ, Wagner I, Stephan C, Jentzmik F, et al. Diagnostic and prognostic implications of microRNA profiling in prostate carcinoma. Int J Cancer (2010) 126(5):1166–76. doi: 10.1002/ijc.24827
21. Borkowetz A, Lohse-Fischer A, Scholze J, Lotzkat U, Thomas C, Wirth MP, et al. Evaluation of MicroRNAs as non-invasive diagnostic markers in urinary cells from patients with suspected prostate cancer. Diagnostics (Basel) (2020) 10(8):578. doi: 10.3390/diagnostics10080578
22. Aiello A, Bacci L, Re A, Ripoli C, Pierconti F, Pinto F, et al. MALAT1 and HOTAIR long non-coding RNAs play opposite role in estrogen-mediated transcriptional regulation in prostate cancer cells. Sci Rep (2016) 6:38414. doi: 10.1038/srep38414
23. Helsmoortel H, Everaert C, Lumen N, Ost P, Vandesompele J. Detecting long non-coding RNA biomarkers in prostate cancer liquid biopsies: hype or hope? Noncoding RNA Res (2018) 3(2):64–74. doi: 10.1016/j.ncrna.2018.05.001
24. Ramnarine VR, Alshalalfa M, Mo F, Nabavi N, Erho N, Takhar M, et al. The long noncoding RNA landscape of neuroendocrine prostate cancer and its clinical implications. Gigascience (2018) 7(6):giy050. doi: 10.1093/gigascience/giy050
25. Zhang Q, Zheng J, Liu L. The long noncoding RNA PCGEM1 promotes cell proliferation, migration and invasion via targeting the miR-182/FBXW11 axis in cervical cancer. Cancer Cell Int (2019) 19:304. doi: 10.1186/s12935-019-1030-8
26. Kulkarni P, Dasgupta P, Bhat NS, Shahryari V, Shiina M, Hashimoto Y, et al. Elevated miR-182-5p associates with renal cancer cell mitotic arrest through diminished MALAT-1 expression. Mol Cancer Res (2018) 16(11):1750–60. doi: 10.1158/1541-7786.MCR-17-0762
27. Wang J, Li L, Jiang M, Li Y. MicroRNA-195 inhibits human gastric cancer by directly targeting basic fibroblast growth factor. Clin Transl Oncol (2017) 19(11):1320–8. doi: 10.1007/s12094-017-1668-4
28. Xu N, Wu Y-P, Yin H-B, Xue X-Y, Gou X. Molecular network-based identification of competing endogenous RNAs and mRNA signatures that predict survival in prostate cancer. J Transl Med (2018) 16(1):274. doi: 10.1186/s12967-018-1637-x
29. Jiang T, Guo J, Hu Z, Zhao M, Gu Z, Miao S. Identification of potential prostate cancer-related pseudogenes based on competitive endogenous RNA network hypothesis. Med Sci Monit (2018) 24:4213–39. doi: 10.12659/MSM.910886
30. Lamb AD, Massie CE, Neal DE. The transcriptional programme of the androgen receptor (AR) in prostate cancer. BJU Int (2014) 113(3):358–66. doi: 10.1111/bju.12415
31. Yang Y, Liu KY, Liu Q, Cao Q. Androgen receptor-related non-coding RNAs in prostate cancer. Front Cell Dev Biol (2021) 9:660853. doi: 10.3389/fcell.2021.660853
32. Zhang A, Zhao JC, Kim J, Fong K-W, Yang YA, Chakravarti D, et al. LncRNA HOTAIR enhances the androgen-receptor-mediated transcriptional program and drives castration-resistant prostate cancer. Cell Rep (2015) 13(1):209–21. doi: 10.1016/j.celrep.2015.08.069
33. Schmidt K, Weidmann CA, Hilimire TA, Yee E, Hatfield BM, Schneekloth JS, et al. Targeting the oncogenic long non-coding RNA SLNCR1 by blocking its sequence-specific binding to the androgen receptor. Cell Rep (2020) 30(2):541–554.e5. doi: 10.1016/j.celrep.2019.12.011
34. Takayama K, Tsutsumi S, Katayama S, Okayama T, Horie-Inoue K, Ikeda K, et al. Integration of cap analysis of gene expression and chromatin immunoprecipitation analysis on array reveals genome-wide androgen receptor signaling in prostate cancer cells. Oncogene (2011) 30(5):619–30. doi: 10.1038/onc.2010.436
35. Takayama K-I, Fujimura T, Suzuki Y, Inoue S. Identification of long non-coding RNAs in advanced prostate cancer associated with androgen receptor splicing factors. Commun Biol (2020) 3(1):393. doi: 10.1038/s42003-020-01120-y
36. DaSilva LF, Beckedorff FC, Ayupe AC, Amaral MS, Mesel V, Videira A, et al. Chromatin landscape distinguishes the genomic loci of hundreds of androgen-receptor-associated LincRNAs from the loci of non-associated LincRNAs. Front Genet (2018) 9:132. doi: 10.3389/fgene.2018.00132
37. Feldman BJ, Feldman D. The development of androgen-independent prostate cancer. Nat Rev Cancer (2001) 1(1):34–45. doi: 10.1038/35094009
38. Kirby M, Hirst C, Crawford E. Characterising the castration-resistant prostate cancer population: a systematic review. Int J Clin Pract (2011) 65(11):1180–92. doi: 10.1111/j.1742-1241.2011.02799.x
39. Fredsøe J, Rasmussen AK, Thomsen AR, Mouritzen P, Høyer S, Borre M, et al. Diagnostic and prognostic microRNA biomarkers for prostate cancer in cell-free urine. Eur Urol Focus (2018) 4(6):825–33. doi: 10.1016/j.euf.2017.02.018
40. Chen Z, Song X, Li Q, Xie L, Guo T, Su T, et al. Androgen receptor-activated enhancers simultaneously regulate oncogene TMPRSS2 and lncRNA PRCAT38 in prostate cancer. Cells (2019) 8(8):864. doi: 10.3390/cells8080864
41. Östling P, Leivonen S-K, Aakula A, Kohonen P, Mäkelä R, Hagman Z, et al. Systematic analysis of MicroRNAs targeting the androgen receptor in prostate cancer CellsmicroRNAs targeting AR. Cancer Res (2011) 71(5):1956–67. doi: 10.1158/0008-5472.CAN-10-2421
42. Vasudevan S, Tong Y, Steitz JA. Switching from repression to activation: microRNAs can up-regulate translation. Science (2007) 318(5858):1931–4. doi: 10.1126/science.1149460
Keywords: prostate cancer, biomarkers, Gleason, PSA, network
Citation: Vahabzadeh G, Khalighfard S, Alizadeh AM, Yaghobinejad M, Mardani M, Rastegar T, Barati M, Roudbaraki M, Esmati E, Babaei M and Kazemian A (2023) A systematic method introduced a common lncRNA-miRNA-mRNA network in the different stages of prostate cancer. Front. Oncol. 13:1142275. doi: 10.3389/fonc.2023.1142275
Received: 11 January 2023; Accepted: 24 April 2023;
Published: 08 May 2023.
Edited by:
Girijesh K. Patel, Sanjay Gandhi Post Graduate Institute of Medical Sciences (SGPGI), IndiaReviewed by:
Eswar Shankar, The Ohio State University, United StatesCopyright © 2023 Vahabzadeh, Khalighfard, Alizadeh, Yaghobinejad, Mardani, Rastegar, Barati, Roudbaraki, Esmati, Babaei and Kazemian. This is an open-access article distributed under the terms of the Creative Commons Attribution License (CC BY). The use, distribution or reproduction in other forums is permitted, provided the original author(s) and the copyright owner(s) are credited and that the original publication in this journal is cited, in accordance with accepted academic practice. No use, distribution or reproduction is permitted which does not comply with these terms.
*Correspondence: Ali Mohammad Alizadeh, YWFsaXphZGVoQHNpbmEudHVtcy5hYy5pcg==
Disclaimer: All claims expressed in this article are solely those of the authors and do not necessarily represent those of their affiliated organizations, or those of the publisher, the editors and the reviewers. Any product that may be evaluated in this article or claim that may be made by its manufacturer is not guaranteed or endorsed by the publisher.
Research integrity at Frontiers
Learn more about the work of our research integrity team to safeguard the quality of each article we publish.