 Ganbin Qiu1,2
 Yue Zhao
95% of researchers rate our articles as excellent or good
Learn more about the work of our research integrity team to safeguard the quality of each article we publish.
Find out more
ORIGINAL RESEARCH article
Front. Oncol. , 30 June 2023
Sec. Cancer Imaging and Image-directed Interventions
Volume 13 - 2023 | https://doi.org/10.3389/fonc.2023.1134646
This article is part of the Research Topic Editor's Challenge: Abhishek Mahajan - How Can Precision Oncology be Advanced with Validated Imaging-Based Nomograms? View all 8 articles
Objectives: To explore the predictive value of gadoxetic acid-enhanced magnetic resonance imaging (MRI) combined with T1 mapping and clinical factors for Ki-67 expression in hepatocellular carcinoma (HCC).
Methods: A retrospective study was conducted on 185 patients with pathologically confirmed solitary HCC from two institutions. All patients underwent preoperative T1 mapping on gadoxetic acid-enhanced MRI. Patients from institution I (n = 124) and institution II (n = 61) were respectively assigned to the training and validation sets. Univariable and multivariable analyses were performed to assess the correlation of clinico-radiological factors with Ki-67 labeling index (LI). Based on the significant factors, a predictive nomogram was developed and validated for Ki-67 LI. The performance of the nomogram was evaluated on the basis of its calibration, discrimination, and clinical utility.
Results: Multivariable analysis showed that alpha-fetoprotein (AFP) levels > 20ng/mL, neutrophils to lymphocyte ratio > 2.25, non-smooth margin, tumor-to-liver signal intensity ratio in the hepatobiliary phase ≤ 0.6, and post-contrast T1 relaxation time > 705 msec were the independent predictors of Ki-67 LI. The nomogram based on these variables showed the best predictive performance with area under the receiver operator characteristic curve (AUROC) 0.899, area under the precision-recall curve (AUPRC) 0.946 and F1 score of 0.912; the respective values were 0.823, 0.879 and 0.857 in the validation set. The Kaplan–Meier curves illustrated that the cumulative recurrence probability at 2 years was significantly higher in patients with high Ki-67 LI than in those with low Ki-67 LI (39.6% [53/134] vs. 19.6% [10/51], p = 0.011).
Conclusions: Gadoxetic acid-enhanced MRI combined with T1 mapping and several clinical factors can preoperatively predict Ki-67 LI with high accuracy, and thus enable risk stratification and personalized treatment of HCC patients.
Hepatocellular carcinoma (HCC) is the third leading cause of cancer-related deaths worldwide (1). Although the prognosis of HCC patients has improved with advances in imaging and surgical techniques, the high rates of intrahepatic recurrence after surgical resection still remain a major challenge, and two thirds of the patients experience recurrence within 5 years (2, 3). Various factors affect intrahepatic recurrence, including microvascular invasion, degree of differentiation, satellite focus and related gene expression, and tumor cell proliferation (4).
The Ki-67 labeling index (LI) is an indicator of cell proliferation, which correlates to the biological behavior of tumors, treatment efficacy and prognosis (5, 6). Previous studies have shown that high Ki-67 LI is associated with poor overall survival (7–9) and recurrence-free survival (RFS) (9, 10). Currently, the Ki-67 LI of tumors is evaluated on the basis of postoperative immunohistochemical examination. Non-invasive estimation of the preoperative Ki-67 LI of HCC tissues may help predict patient prognosis and guide treatment decision-making. There are reports that texture analysis based on gadoxetic acid-enhanced magnetic resonance imaging (MRI) can preoperatively predict Ki-67 LI in HCC patients, and is superior to subjective MRI characteristics (11–13). In addition, radiomic score is also a reliable imaging biomarker of Ki-67 expression (14–18). However, both texture analysis and radiomics are not conducive to clinical application due to the complexity of the process, and the poor generalization and resolvability of the model (19, 20). T1 mapping is a non-invasive method for the quantification of T1 value in tissues. Moreover, it is directly proportional to the concentration of gadolinium contrast agent in tissues, and can reflect the uptake of gadoxetic acid more accurately (21). Some recent studies have shown that T1 mapping can be used to evaluate the degree of HCC differentiation (22, 23), histological grade of liver fibrosis (24, 25) and microvascular invasion (26). However, to our knowledge, the quantitative evaluation of Ki-67 LI in HCC using T1 mapping has not been well established.
Notably, the previous studies focused more on the image characteristics without identifying the importance of clinical characteristics on predictive performance. As we know, clinical characteristics such as biochemical and tumor biomarkers also played an important role in HCC diagnosis and prognosis (27–31). In addition, neutrophil-lymphocyte-ratio (NLR), platelet-lymphocyte-ratio (PLR), γ-glutamyl transpeptidase-lymphocyte ratio and other lab test data were found related to poor prognosis and had indications of therapeutic effects in HCCs (27, 29, 31). Accordingly, whether clinical characteristics can identify the Ki-67 LI in HCC remains unclear. The aim of this study was to investigate the predictive value of gadoxetic acid-enhanced MRI combined with T1 mapping and clinical indicators for preoperative Ki-67 LI in HCC.
A retrospective study was conducted following approval by the hospital ethics committee, and patients were exempted from signing informed consent. The flow chart of data collection and research design is shown in Figure 1. The data of patients was retrieved from the First People’s Hospital of Zhaoqing (Institution I) and Central People’s Hospital of Zhanjiang (Institution II). The inclusion criteria for the patients were as follows (1): pathologically confirmed solitary HCC, (2) underwent gadoxetic acid-enhanced MRI within 2 weeks before surgery, including T1 mapping in the pre-enhanced and 20-minute hepatobiliary phase (HBP) after gadoxetic acid injection, and (3) availability of complete clinical and pathological data. The exclusion criteria were as follows: (1) alternative treatments such as radiofrequency ablation or transcatheter arterial chemoembolization (TACE) instead of resection surgery, (2) presence of more than one tumor or satellite nodules, (3) presence of macrovascular invasion or extrahepatic spreading, and (4) suboptimal MR image quality. The MR images of 124 patients from institution I were used as the training set to establish the predictive model for Ki-67 LI. The predictive performance of the model was evaluated on the 61 cases from institution II (validation set).
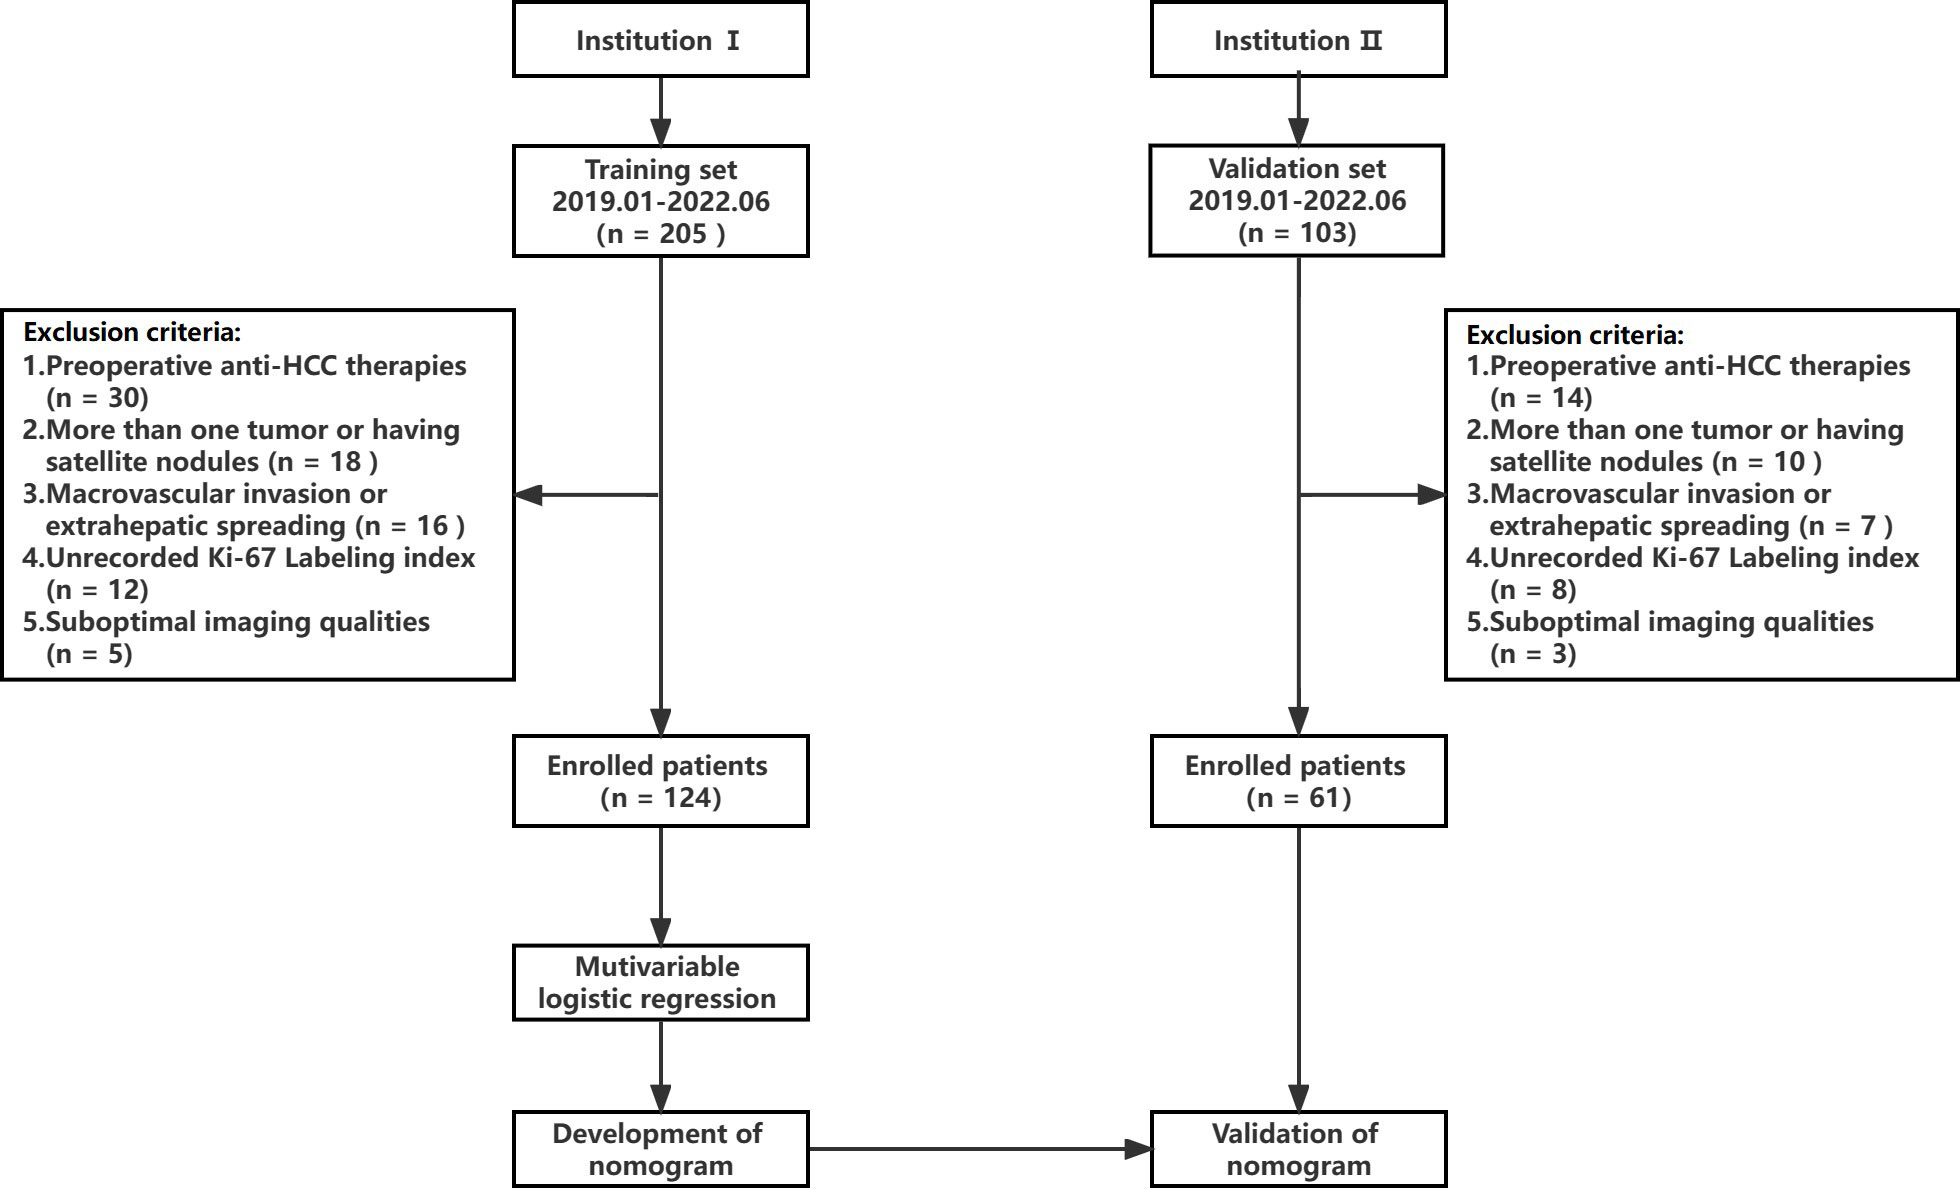
Figure 1 Study flowchart. HCC, hepatocellular carcinoma.
Preoperative laboratory indicators included alpha-fetoprotein (AFP), alanine aminotransferase, aspartate aminotransferase, glutamyl transpeptidase, alkaline phosphatase, albumin, direct bilirubin, total bilirubin, serum creatinine, prothrombin time and international normalized ratio, neutrophil count, and platelet count. HCC was diagnosed on the basis of morphological criteria defined by the World Health Organization. The tumor tissue sections were immuno-stained using monoclonal mouse anti-human Ki-67 antibody (Beijing Zhongshan Golden Bridge Biotechnology Company, Beijing, China), and the Ki-67 LI was evaluated by calculating the frequency of Ki-67-positive cells. The samples with ≤10% positively stained cells were classified as Ki-67 LIlow, and those with >10% positive cells as Ki-67 LIhigh according to previous studies (11, 13, 32).
MRI was performed at institution I and institution II using 3.0T (Magnetom Aera; Siemens Healthcare) and 3.0T (Magnetom Trio A Tim; Siemens Healthcare) MR scanners respectively. The scanning range covered the region from the top to the lower edge of the liver with an 8-channel phased-array coil as the receiver coil. Gadoxetic acid-enhanced MR images, including the pre-enhanced, enhanced arterial phase (AP, 20–40s), portal phase (PVP, 50–70s), transitional phase (TP, 100–120s), and 20 min HBP images were obtained. Gadoxetic acid (Primovist; Bayer Schering Pharma, Berlin, Germany) was injected into the cubital vein at the flow rate of 1 ml/s and the dose of 0.025 mmol/kg, and then flushed using 20 ml normal saline. A more detailed description of the MRI methods and specific sequences and parameters of MRI scans are shown in Supplementary Materials 1.1 and Table S1.
Preoperative MRI images were retrospectively analyzed on the Picture Archiving and Communication System (PACS). The semantic and quantitative MRI features were evaluated by two abdominal radiologists independently (both with 8 years of experience in liver imaging, respectively) who were blinded to the clinical and pathological information. Discrepancies were resolved by consensus after reevaluating the images. Quantitative characteristics were obtained by averaging the two estimates. MRI features included tumor size, tumor margin, hemorrhage, necrosis, fat component, target sign, washout, rim arterial phase hyperenhancement, corona enhancement, intratumor arteries, radiologic capsule, and peritumoral hypointensity on HBP. All quantitative measurements were performed manually on the PACS. The region of interest (ROI) was placed as far as possible in the area with obvious enhancement of lesion to avoid necrosis, hemorrhage, fat, and artifacts. The area of ROI was about 1.0~1.5 cm2. The same lesion was measured three times with the same ROI, and the average was calculated. The signal intensity (SI) of the tumor and surrounding normal liver parenchyma were measured in the Pre, AP, PVP, EP and HBP images, and the tumor-to-liver contrast ratio (TLR), tumor enhancement index (TEI), relative tumor enhancement (RTE) and relative enhancement ratio (RER) were calculated. The pre-contrast and post-contrast T1 relaxation time were measured before and 20 minutes after the administration of the contrast medium (recorded as T1Pre and T1HBP respectively), and reduction rate of T1 relaxation time (ΔT1%) was calculated. The detailed description of semantic and quantitative MRI features is in the Supplemental Materials 1.2.
All patients were regularly followed up with imaging evaluation once every three months for the first two years after surgery. The recurrence was noted as new intrahepatic lesions and/or extrahepatic metastasis, with the following detailed criteria: 1) new intrahepatic lesions with typical imaging features of HCC, or confirmed by histopathology or with tumor staining during postoperative TACE; 2) extrahepatic metastasis confirmed by typical imaging features or histopathological analysis.
Student’s t-test was used to compare normally distributed continuous variables, while the Mann-Whitney U test was used for the non-normally distributed variables. The Chi-square test was used to compare binary categorical variables. The interclass correlation coefficient (ICC) of quantitative data between the two observers was calculated. To identify the independent predictors for high Ki-67 LI without multicollinearity (variance inflation factor, VIF < 5), multivariate backward logistic regression analysis was performed. Receiver operating characteristic (ROC) curves were plotted to determine the cut-off values of the continuous variables for predicting Ki-67 LI by calculating the maximum Youden index. The area under the ROC curve (AUROC) was calculated to evaluate the predictive performance, and DeLong’s test was used to compare the AUROC values between two models. Due to the imbalance between the data of Ki-67 LIlow and Ki-67 LIhigh patients, the F1 score and the area under the precision-recall curve (AUPRC) were also calculated to compare the predictive performances. The discriminatory abilities of the models were quantified by net reclassification index (NRI), where NRI > 0 indicates positive improvement of the new model over the old one. The calibration curves of the nomogram were assessed by the Hosmer-Lemeshow test for consistency. Decision curve analysis (DCA) was performed to evaluate the clinical utility of the nomogram by quantifying the net benefit under different threshold probabilities. All statistical analyses were performed using the SPSS software (version 23.0, IBM Corp.) and R software (version 4.1.3, http://www.r-project.org). A p-value < 0.05 was considered statistically significant.
A total of 124 patients from institution I were included in this study, of which 35 had low Ki-67 LI and 89 had high Ki-67 LI. Furthermore, 61 patients were included from institution II, and the Ki-67 LI was respectively low and high in 16 and 45 patients. The clinicopathological features of the training and validation sets were similar (Table 1). Univariate analysis of clinical factors in the training set showed that ALT (p=0.043), NLR (p=0.036), PLR (p=0.045) and AFP (p=0.024) were significantly associated with Ki-67 LI (Supplementary Table S2), and thus incorporated into the logistic regression model. The results indicated that AFP >20 ng/mL (p<0.001, OR=6.764, 95% CI: 2.225-23.792) and NLR >2.25 (p=0.038, OR=3.527, 95% CI: 1.023-16.274) were independent factors of high Ki-67 LI.
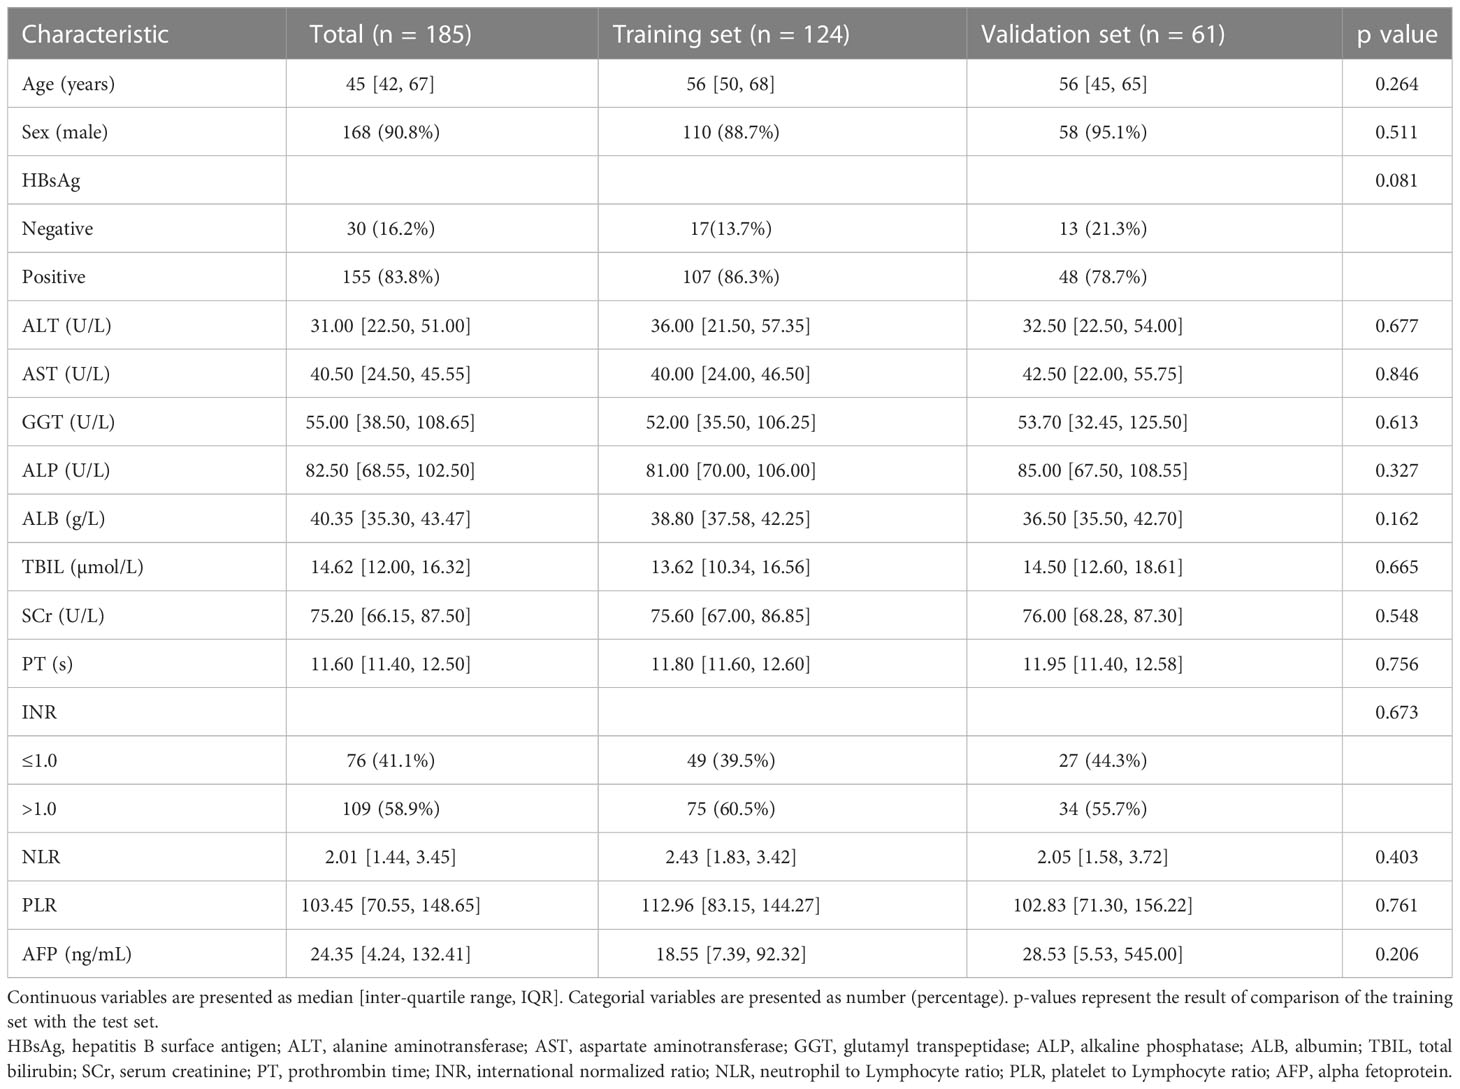
Table 1 Baseline clinical characteristics of the training and validation sets.
Univariable analysis of semantic features in the training set showed that non-smooth tumor margin (p<0.001), hemorrhage (p=0.031) and necrosis (p=0.035) were more frequent in the Ki-67 LIhigh group compared to the Ki-67 LIlow group (Supplementary Table S3). Furthermore, the tumor size, TLRTP, TLRHBP, TEIHBP, T1Pre and T1HBP were also significantly different between the two groups (Table 2), of which T1HBP showed the best predictive performance for high Ki-67 LI, with an AUROC of 0.726, and sensitivity and specificity of 73.25% and 71.69% respectively (Supplementary Table S4). Furthermore, the ICC values of quantitative features in the training and validation sets were all above 0.75 (0.76 ~ 0.89; (Supplementary Table S5), indicating that the two radiologists were consistent in their analysis.
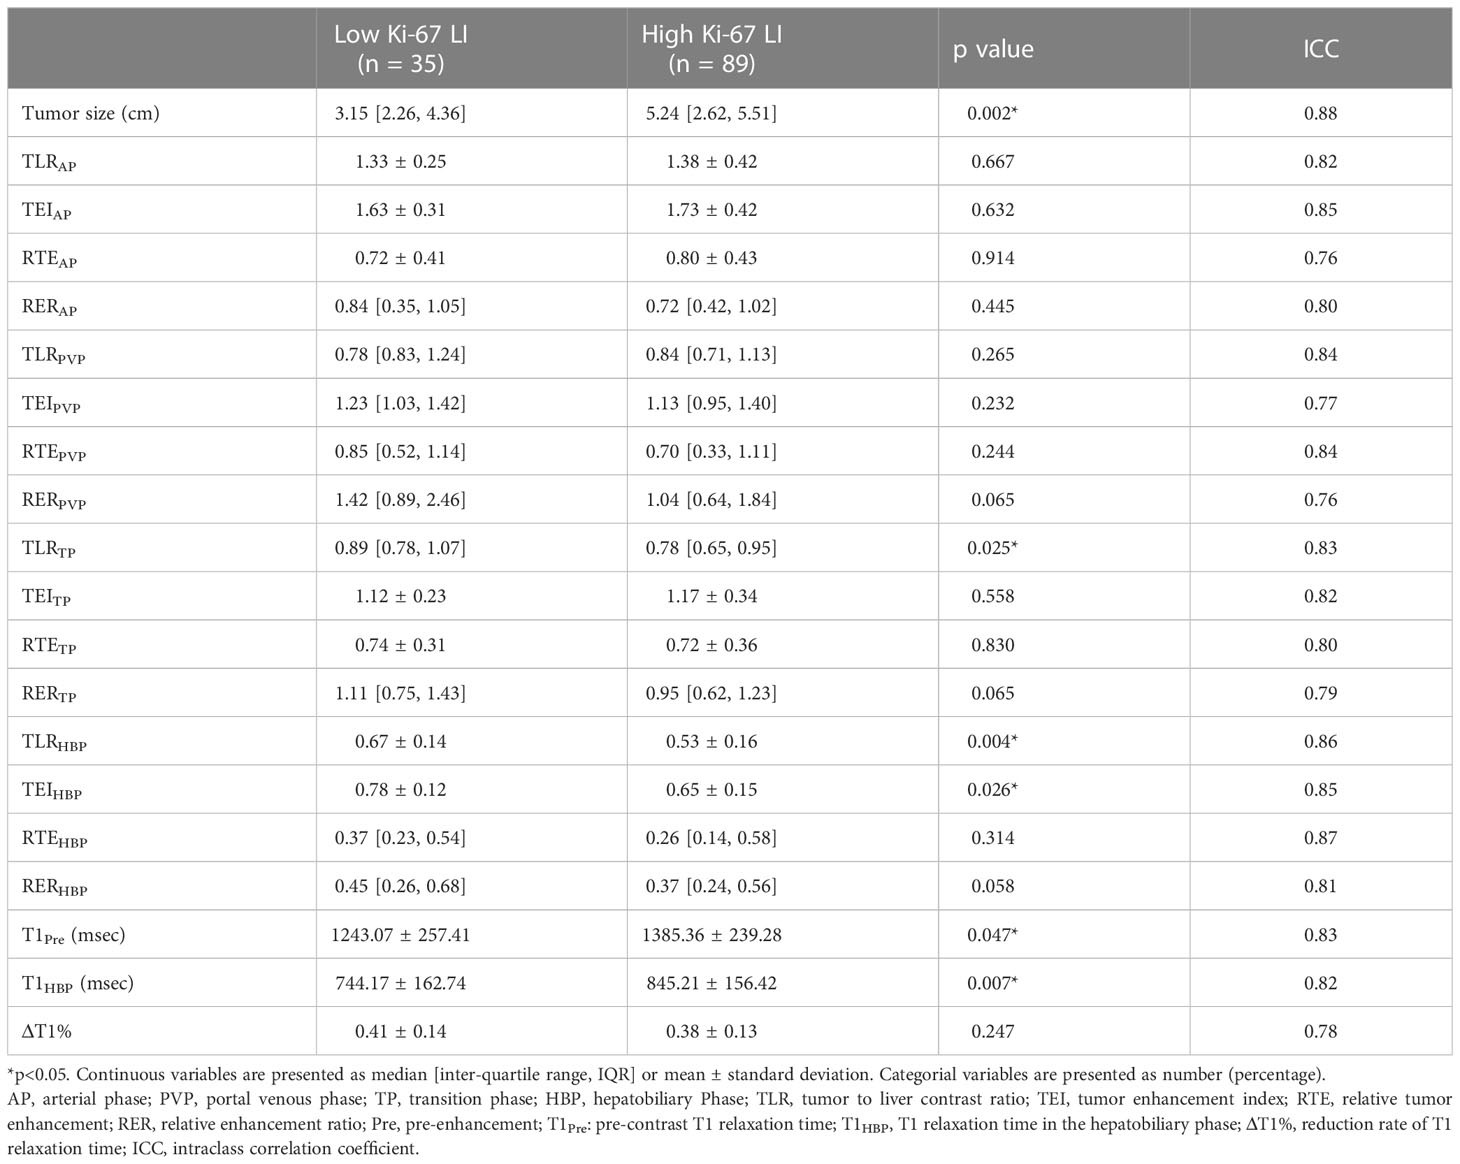
Table 2 Comparison of quantitative MRI parameters between Ki-67 LIlow and Ki-67 LIhigh groups in the training set.
After excluding SI-based quantitative parameters with high collinearity (VIF > 5), TLRHBP with the highest Youden index was selected for constructing the predictive model. Multivariable logistic regression showed that AFP > 20ng/mL (p=0.022, OR=3.863, 95%CI: 1.218 ~12.245), NLR > 2.25 (p=0.005, OR=9.159, 95%CI: 1.962 ~ 42.753), non-smooth tumor margin (p=0.013, OR=4.776, 95%CI: 1.393 ~ 16.374), TLRHBP ≤ 0.6 (p=0.003, OR=6.993, 95%CI: 1.962 ~ 24.927) and T1HBP >705 msec (p<0.001, OR=10.673, 95%CI: 2.614 ~ 43.583) were independent predictors of high Ki-67 LI in HCC tumors (Table 3, Figure 2).
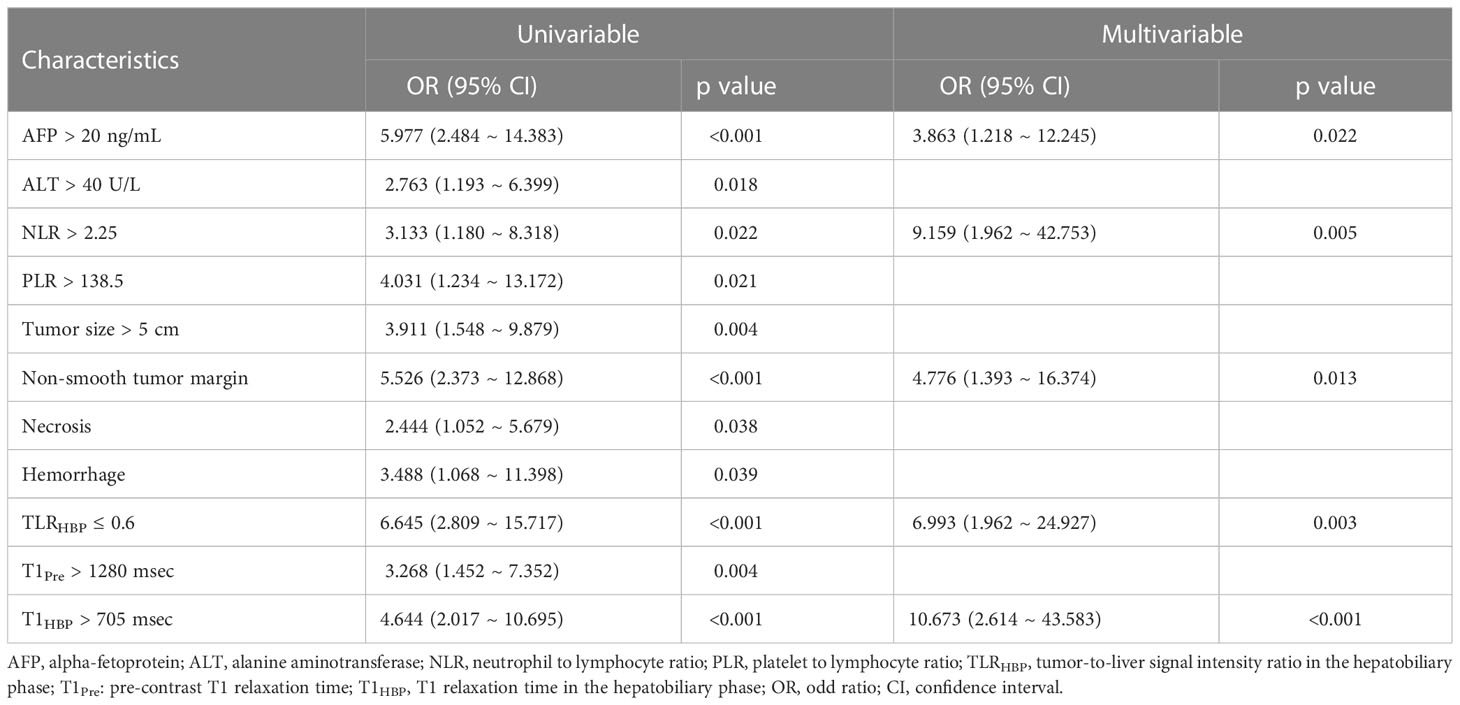
Table 3 Univariable and multivariable logistic regression analysis for predictors of Ki-67 LI in the training set.
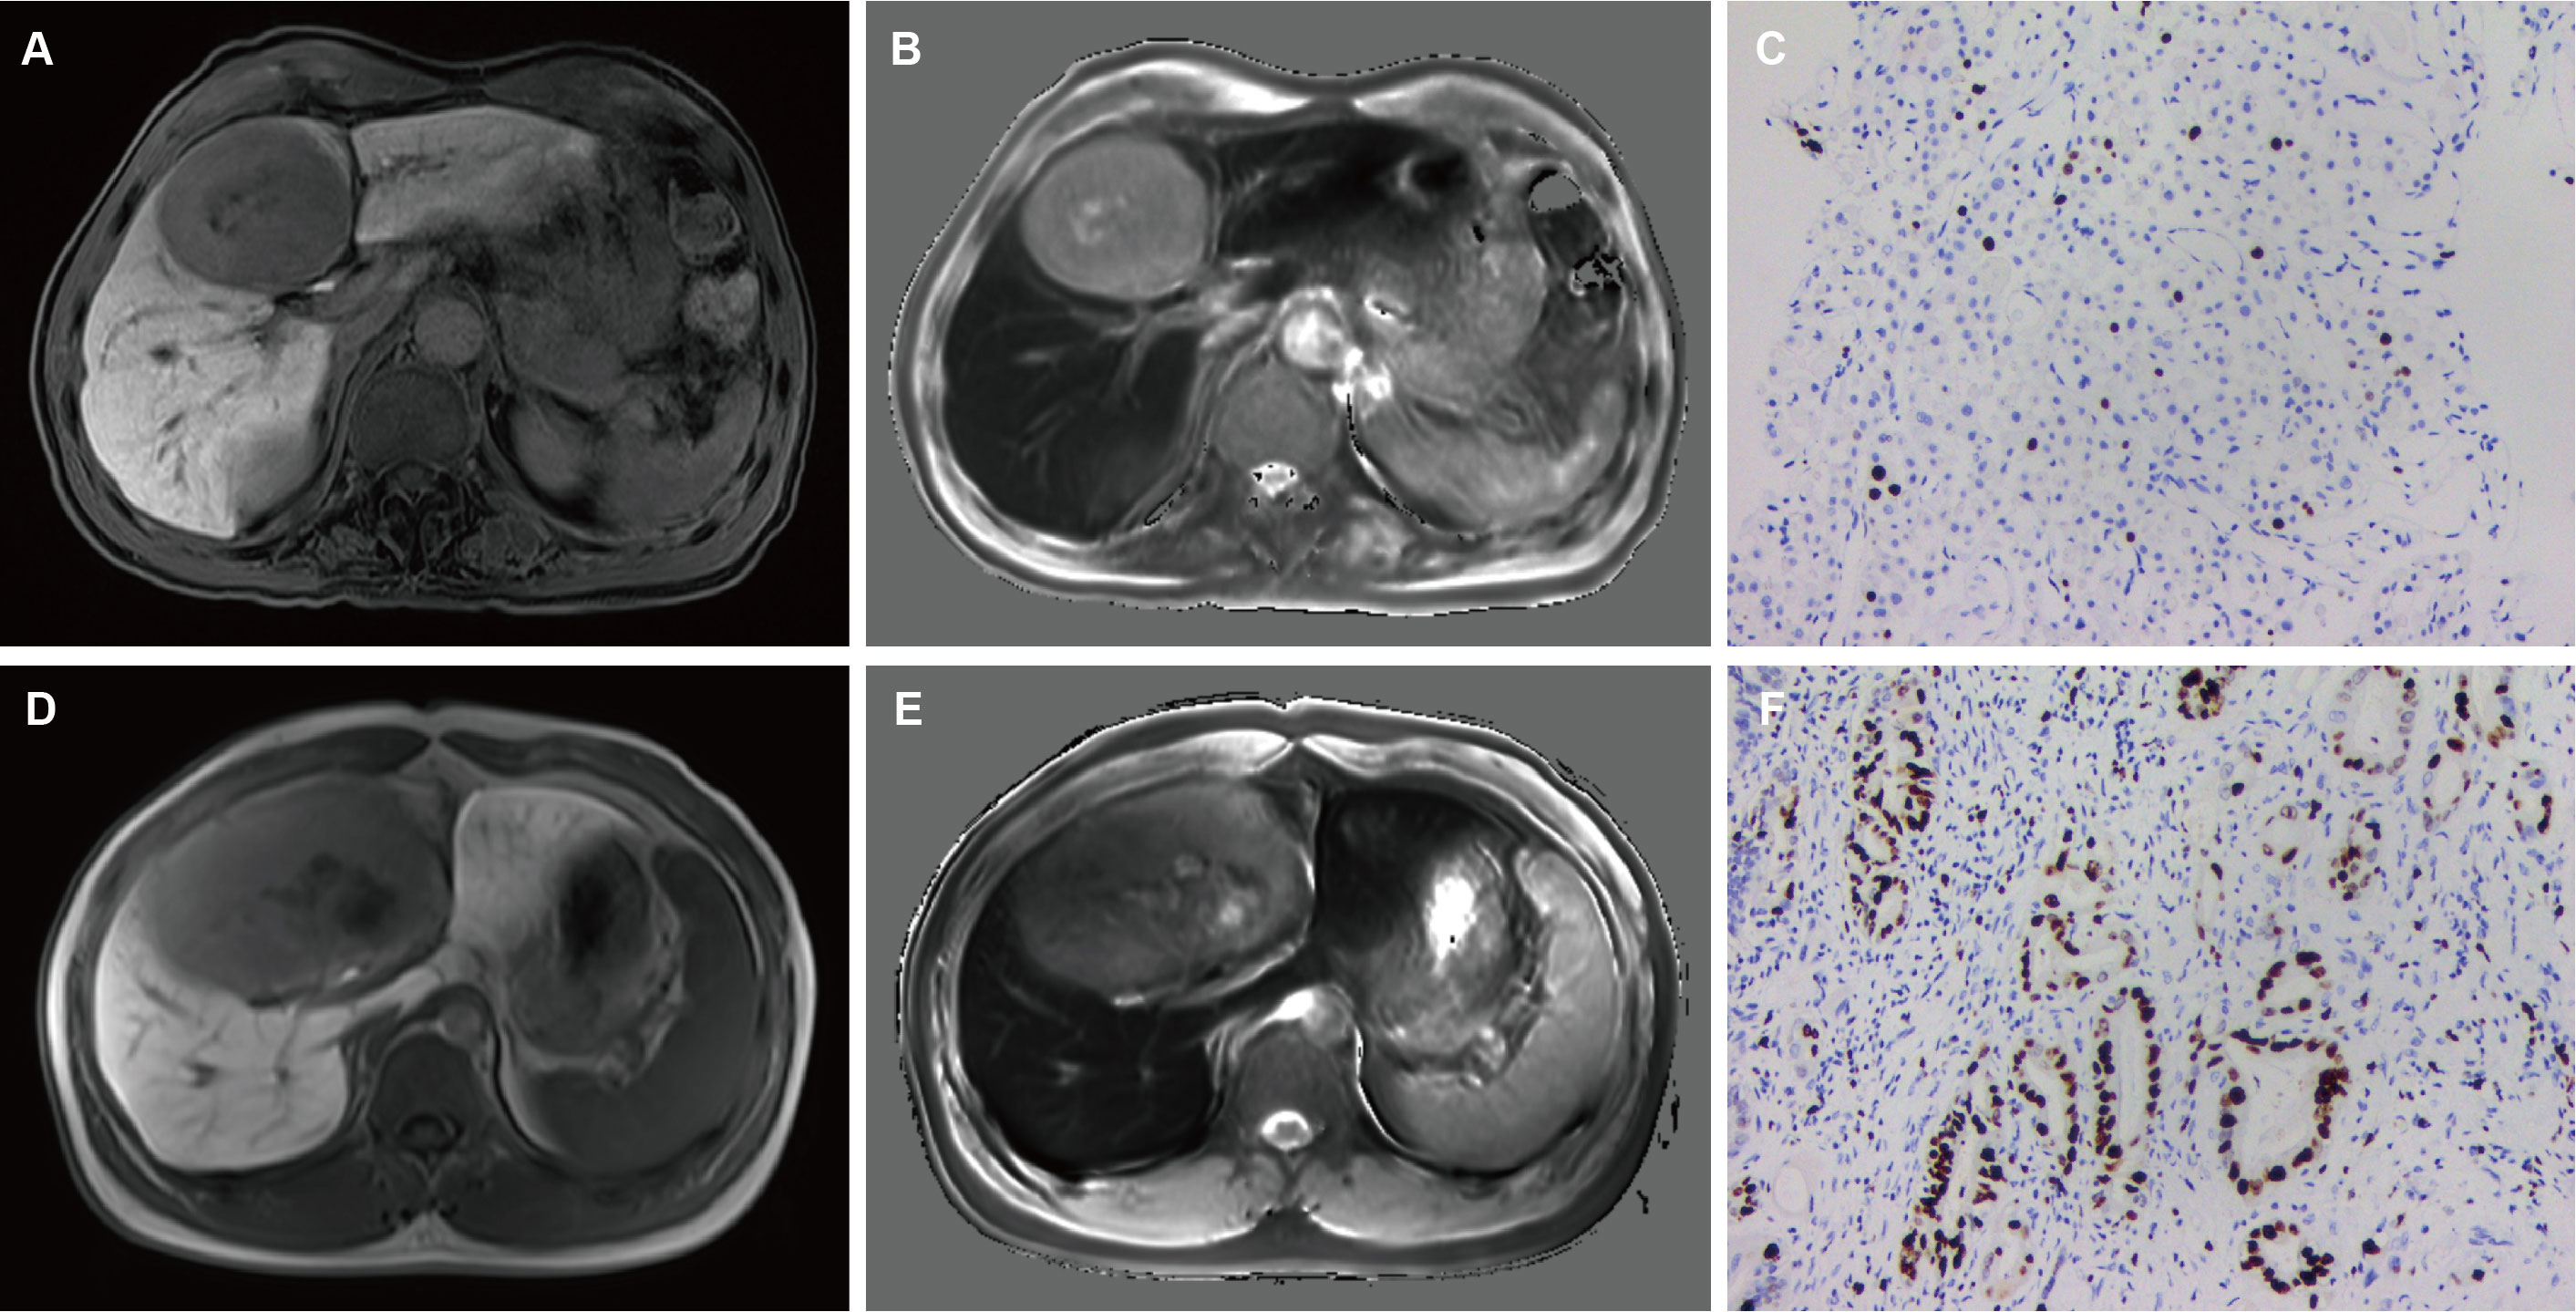
Figure 2 A 49-year-old male with mildly elevated AFP (36 ng/mL) and NLR 1.87. Smooth tumor margin and TLRHBP was 0.68 (A). T1HBP was 682 ms (B). The tumor had low Ki-67 LI (10%, IHC ×400) (C). A 65-year-old male with elevated AFP (124 ng/mL) and NLR 2.35. Non-smooth tumor margin and TLRHBP was 0.55 (A). T1HBP was 786 ms (B). The tumor had high Ki-67 LI (40%, IHC ×400) (C). AFP, alpha-fetoprotein; NLR, neutrophils to lymphocyte ratio; TLRHBP, tumor-to-liver contrast ratio in the hepatobiliary phase; T1HBP, T1 relaxation time on the hepatobiliary phase; LI, labeling index; IHC, immunohistochemistry.
We constructed models based on clinical data, imaging data and combined data. The combination model showed better diagnostic performance compared to the clinical and imaging models in both training and validation sets. The AUROC of the combined model in the training and validation sets was 0.899 and 0.823 respectively, compared to 0.792 and 0.748 for the imaging model, and 0.765 and 0.711 for the clinical model (Table 4, Figure 3). The diagnostic performance of the combined model had significantly improved relative to the clinical model (p=0.008) and the imaging model (p=0.035) according to DeLong’s tests, whereas the imaging model had no significant difference compared to the clinical model (p=0.714). Precision-recall curve also showed that the combination model had the largest AUPRC (0.946) and F1 score (0.912) in the training set, and the respective values in the external validation set were 0.879 and 0.857. Compared to the clinical model and imaging model, the NRIs of the combined model were 21% (p=0.023) and 13% (p=0.038) in the training set, and 27% (p=0.018) and 11% (p=0.046) in the validation set respectively, indicating that the combined model had better efficacy.
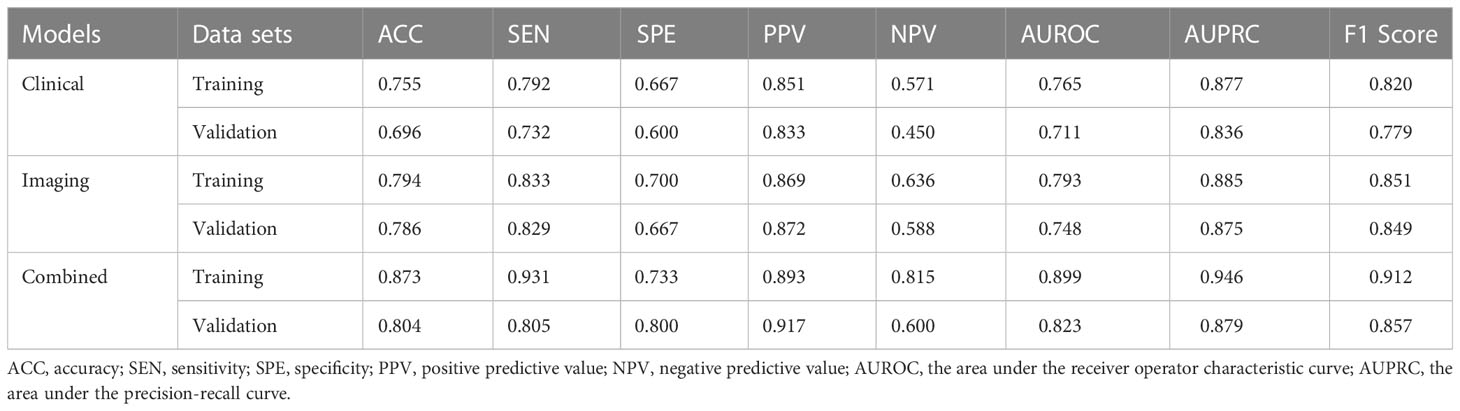
Table 4 Comparison of the imaging, clinical and combined models.
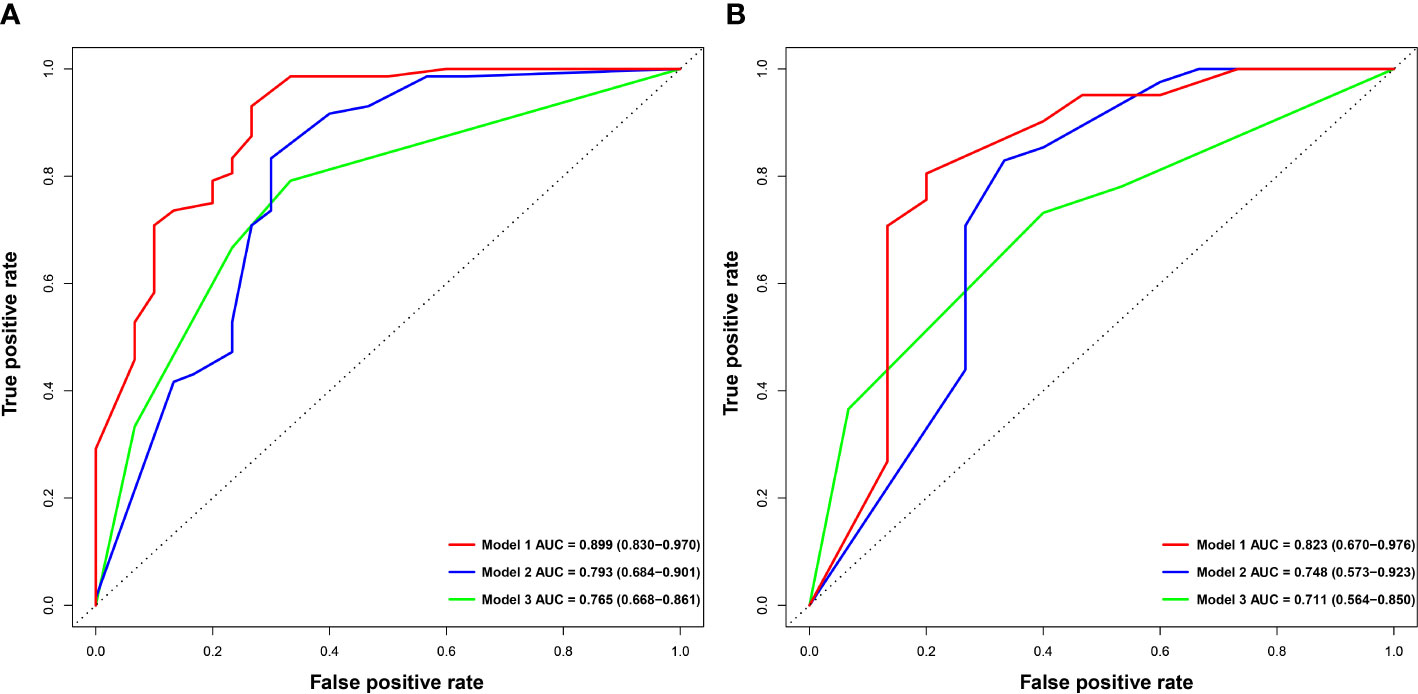
Figure 3 Comparison of ROC curves for predicting Ki-67 LI in HCC. ROC curves of combination model (Model 1), imaging model (Model 2) and clinical model (Model 3) in the training (A) and validation (B) sets. ROC, receive operating characteristics.
The nomogram and decision curves revealed substantial clinical benefit of the combined model in predicting HCC with high Ki-67 LI (Figure 4). The DCAs for the clinical, imaging, and combined models in the training set are shown in Supplementary Figure S1. The calibration curves showed good agreement between predicted and observed probabilities of HCC with high Ki-67 LI in both the training (p=0.582) and validation (p=0.265) sets (Figure 5).
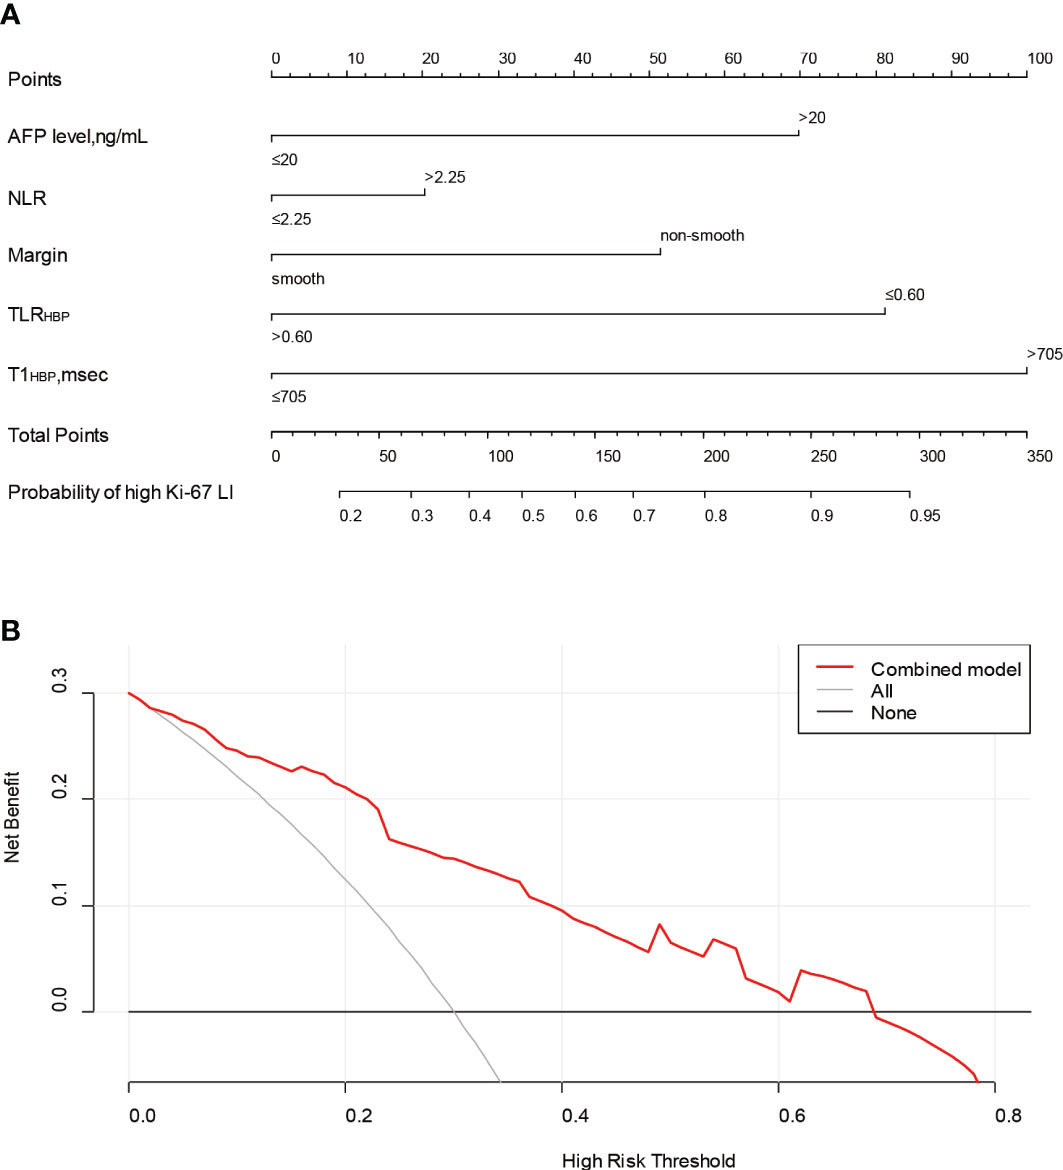
Figure 4 The nomogram and decision curve to predict Ki-67 LI in HCC. The nomogram (A) was developed based on the combination model. Predictor points are shown on the uppermost point scale that corresponds to each variable. The points for all variables are added in the bottom scale and translated into the probability of high Ki-67 LI. Decision curve (B) analysis of the prediction model for external validation set. The X-axis is the probability threshold. Y-axis represents the net benefit, which is calculated by gaining true positives and deleting false positives. AFP, alpha-fetoprotein; NLR, neutrophils to lymphocyte ratio; TLRHBP, tumor-to-liver contrast ratio in the hepatobiliary phase; T1HBP, T1 relaxation time on the hepatobiliary phase; LI, labeling index.
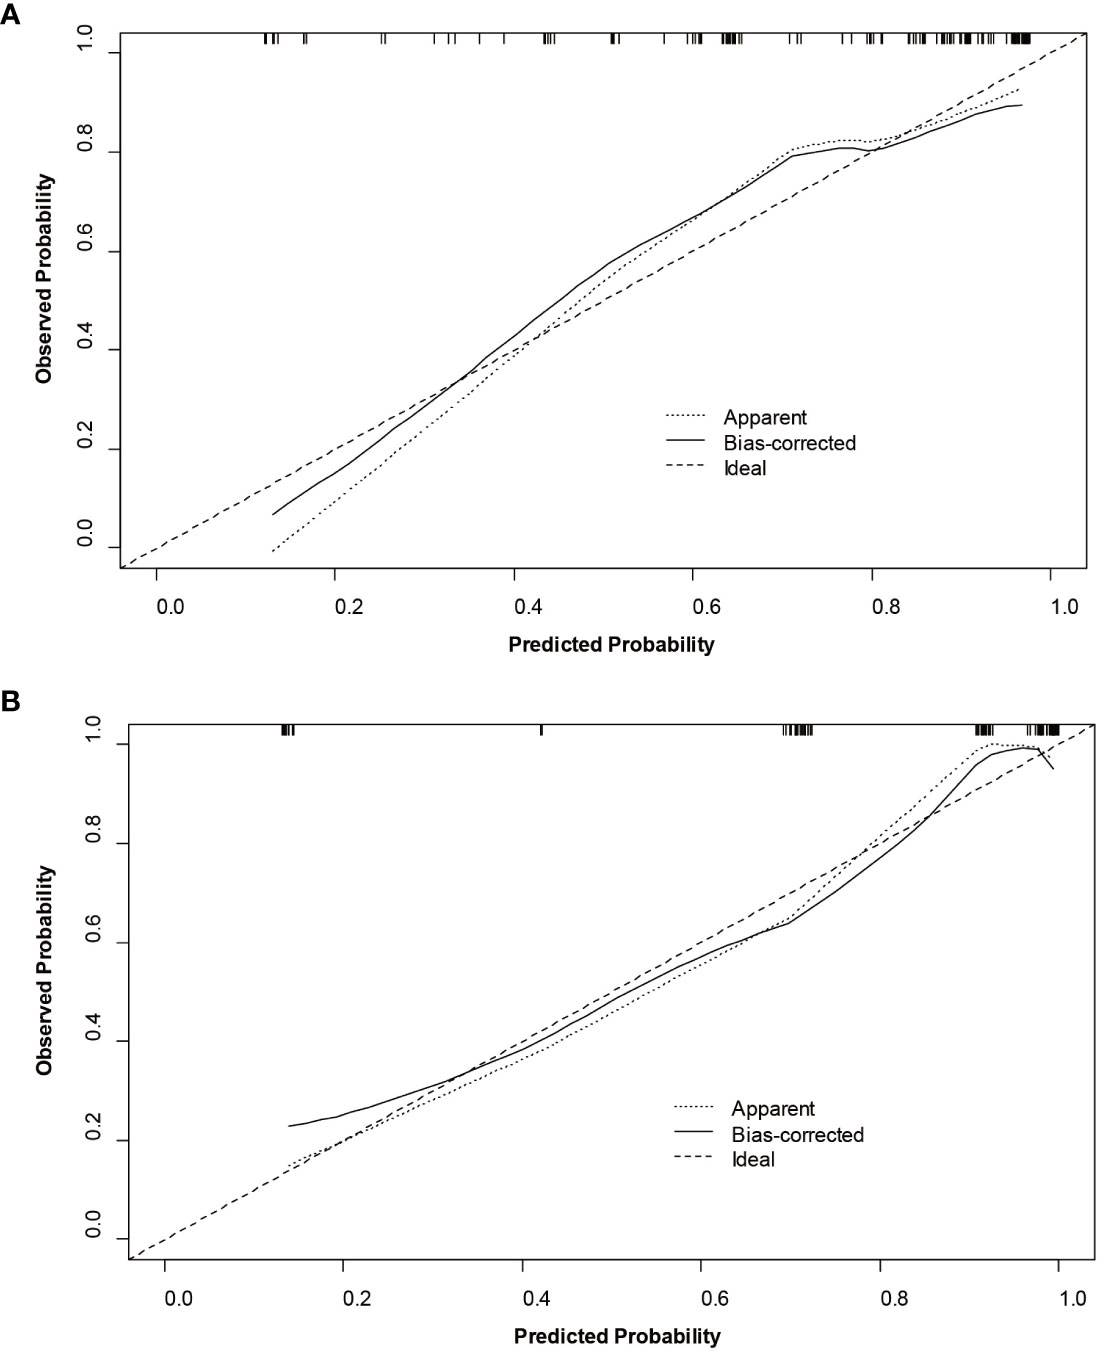
Figure 5 Calibration curves of the nomogram for the training (A) and validation (B) sets to predict Ki-67 LI in HCC.
All patients had completed the early recurrence follow-up, and recurrence data was available for 63 patients within two years after hepatectomy. The Kaplan–Meier curves illustrated that the cumulative recurrence probability at 2 years was significantly higher in patients with high Ki-67 LI than in those with low Ki-67 LI (39.6% [53/134] vs. 19.6% [10/51], p = 0.011; Figure 6).
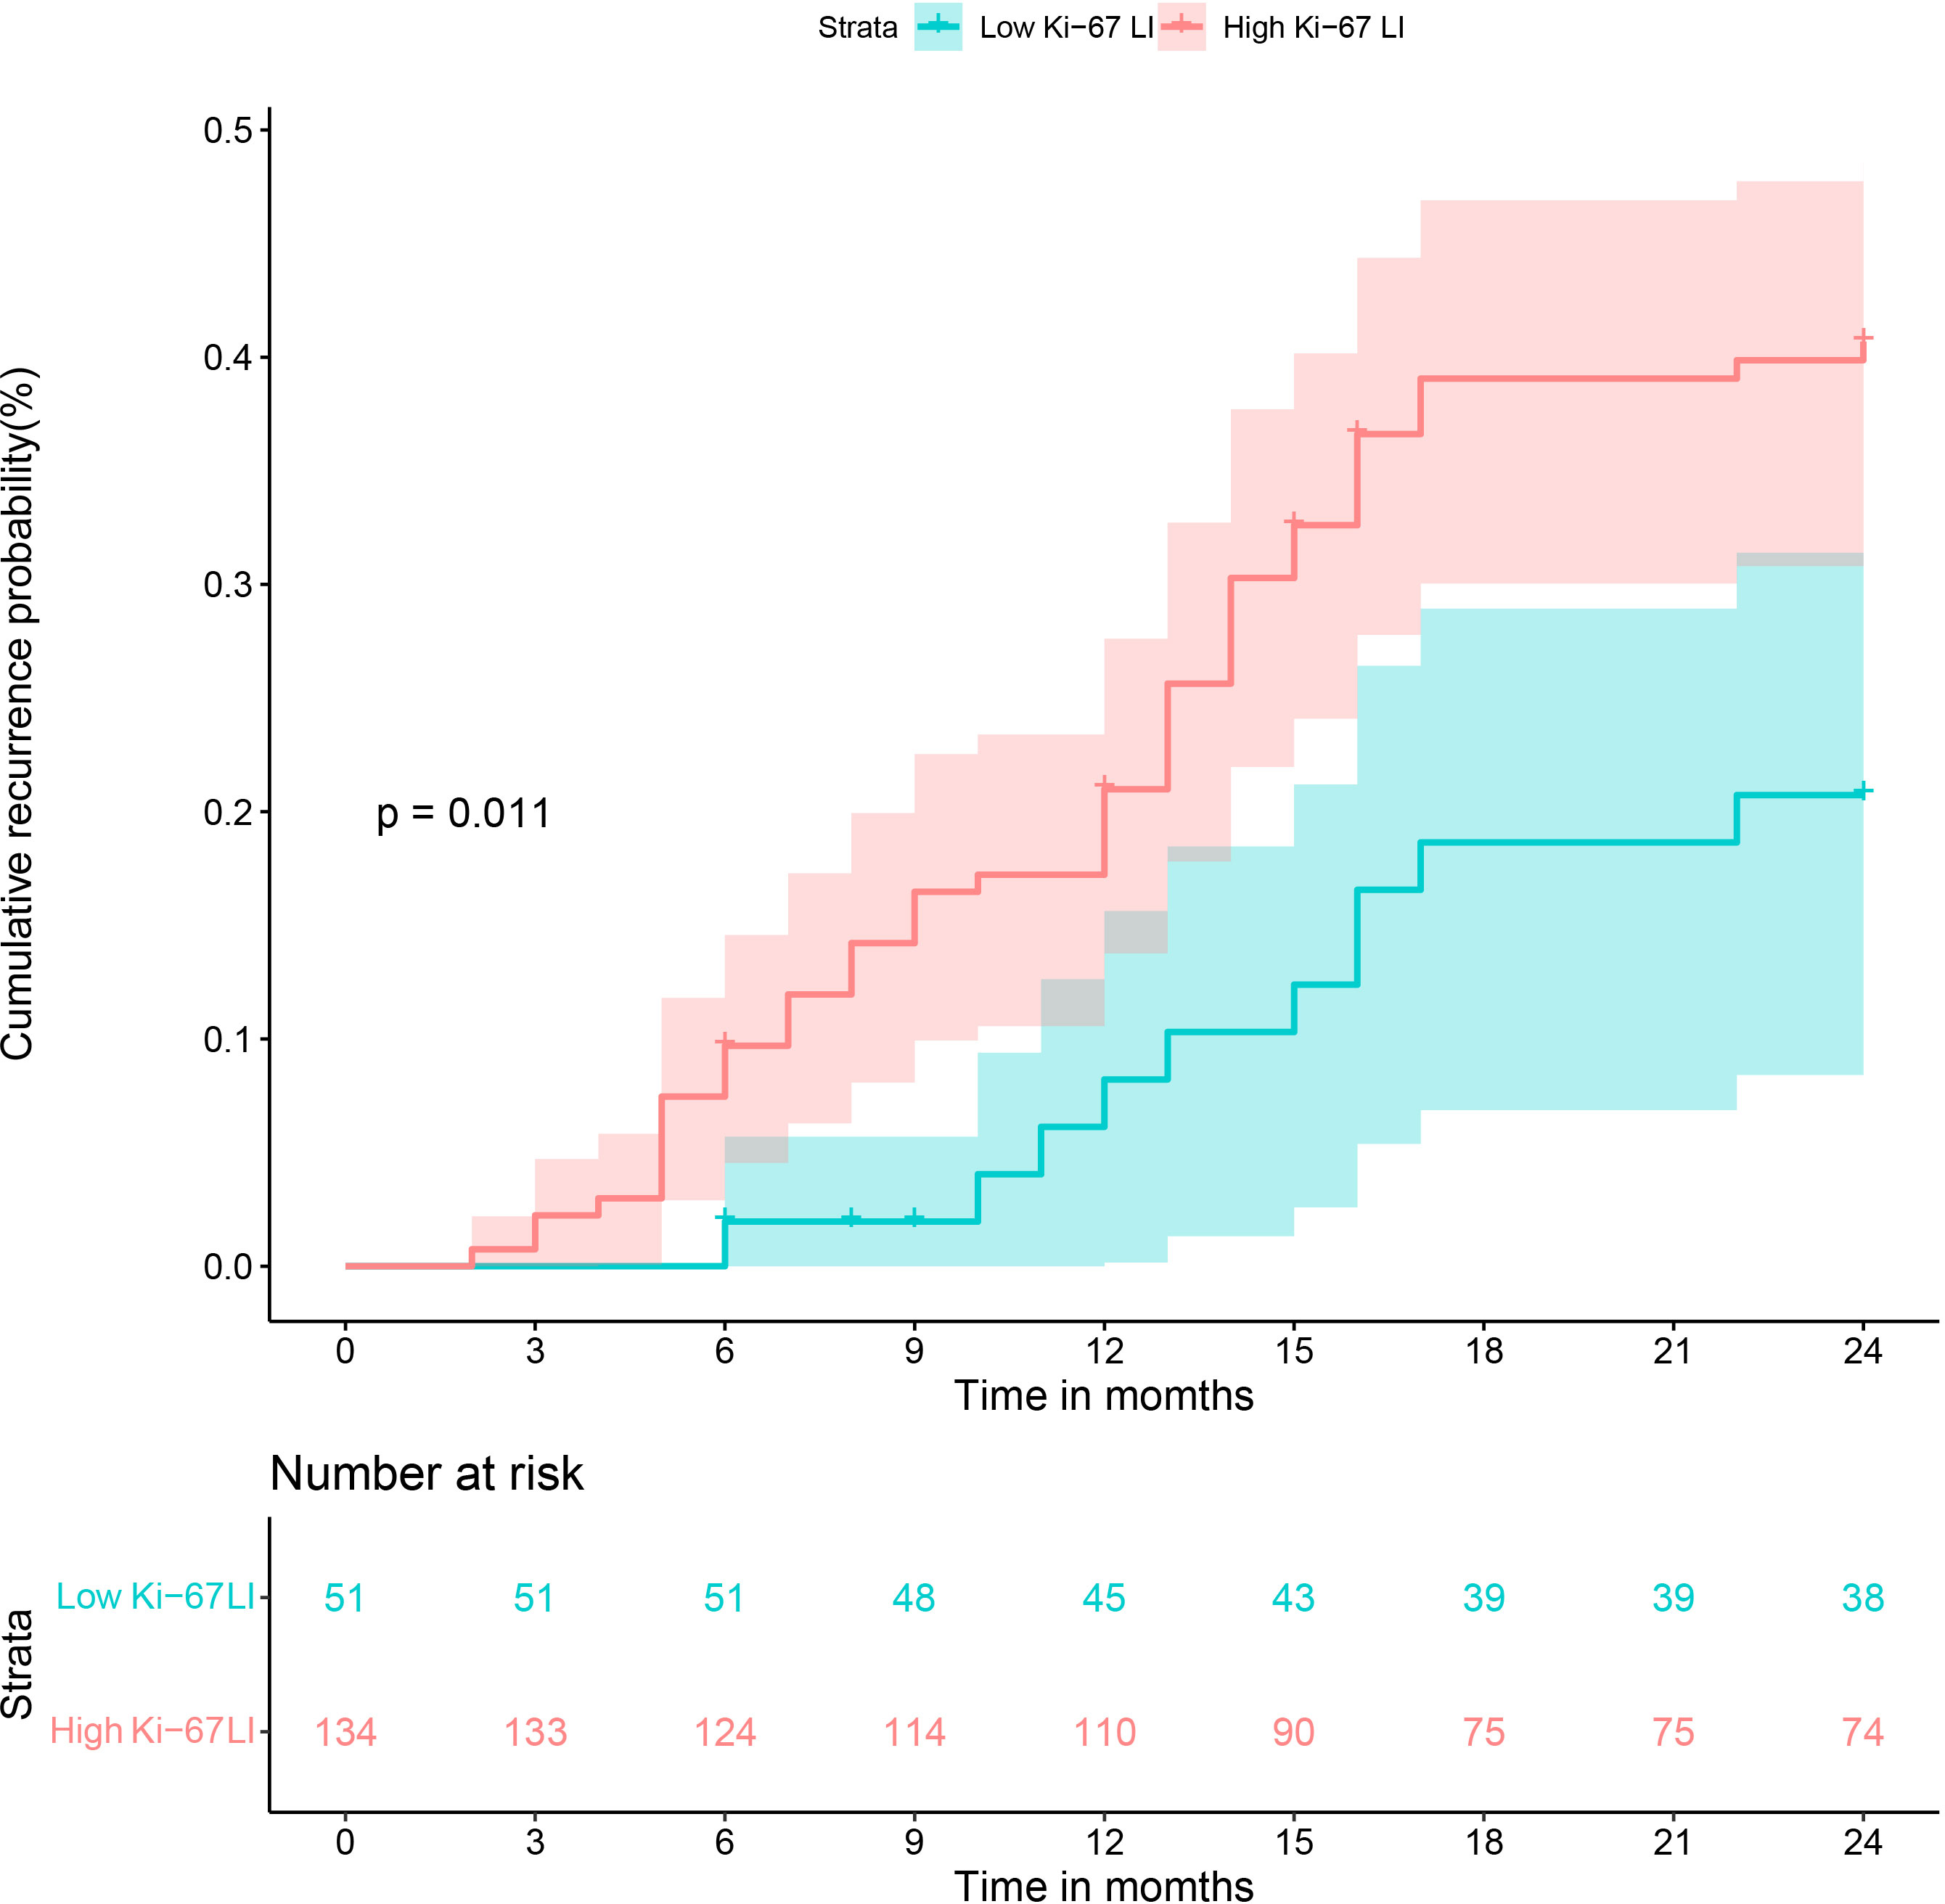
Figure 6 Cumulative recurrence curves of HCC patients with low and high Ki-67 LI after curative resection.
We successfully developed and validated a nomogram to predict Ki-67 LI in HCC based on gadoxetic acid-enhanced MRI combined with T1 mapping and clinical indicators. The model demonstrated good predictive efficiency and clinical utility, and can facilitate personalized risk stratification and treatment decision-making for patients with HCC.
TLRHBP was identified as an independent factor of high Ki-67 expression in HCC, which is consistent with previous studies (32, 33). The quantitative parameters, including TLRHBP, TEIHBP and TLRTP, were based on the SI from either HBP or TP, which may better represent the Ki-67 LI of HCC given the rationale of gadoxetic acid (32). Among these quantitative parameters derived from either HBP or TP, TLRHBP had the highest diagnostic performance for Ki-67 LI. The reason why HCCs with higher Ki-67 LI tend to demonstrate lower relative tumoral SI probably is that normal hepatocytes gradually turn into actively proliferated and uncontrolled malignant tumor cells with higher Ki-67 LI during multistep hepatocarcinogenesis, while at the same time, the expression of organic anion transporting polypeptide (OATP) usually decreased, hence resulting in less uptake of gadoxetic acid (34, 35). However, the correlation between Ki-67 LI and OATP may need to be investigated further. T1HBP derived from T1 mapping showed the best diagnostic performance among all quantitative parameters, possibly due to the fact that T1 relaxation time is inversely proportional to the concentration of gadolinium contrast agent. As more gadolinium enters the tumor tissue in the HBP, it effectively shortens the T1 relaxation time. Furthermore, T1 relaxation time is an absolute value, which is not affected by scanning sequence parameters (26). However, SI is a relative value that is affected by technical factors and does not have a linear relationship with the concentration of the contrast agent. Thus, T1 relaxation time is more accurate and reliable than SI.
In addition to TLRHBP and T1HBP, other independent predictors of high Ki-67 LI included serum AFP levels, NLR, and non-smooth margin. AFP is a marker of HCC and is associated with Ki-67 LI. Elevated serum AFP in HCC patients is correlated to poor differentiation, microvascular invasion and tumor recurrence (34, 36), which is consistent with the biological behavior of HCCs with high Ki-67 LI. Furthermore, Besides, our study found that NLR was an independent factor of high Ki-67 expression in HCC. The possible resolution is that changes in NLR affect the levels of some proinflammatory mediators associated with oncogenic effects, thus accelerating tumor cell proliferation and invasion (37). Although there is epidemiological evidence that inflammation is a risk factor for many human cancers (36, 37), the underlying mechanisms are unclear. Finally, non-smooth tumor margins, necrosis, and hemorrhage were more common in the Ki-67 LIhigh group, which is consistent with previous studies (12, 13, 38).
We constructed predictive models for Ki-67 LI based on clinical, imaging and combined data, and found that the combined model had the best predictive performance. This suggests that combining clinical information and imaging features can provide complementary information and improve predictive performance. Some studies have established models based on texture analysis (11–13) or radiomics (14–16), which have also achieved good results in predicting Ki-67 LI in HCC. However, obscure algorithms and complicated operations limit their clinical applications. In addition, most of these studies were conducted on single-center data without an independent external validation set, thus limiting the generalizability of the results. An external dataset is necessary to ensure clinical translatability of such models. In our study, the combination model showed robust performance in the external validation set with different MRI scanners and parameter settings.
There are some limitations in our study that ought to be considered. First, the retrospective design of the study may have introduced selection bias. We focused on single resectable HCC tumors due to the difficulty in obtaining surgical specimens of multiple lesions and those with macrovascular invasion, which limits the extrapolation of our results to different populations. Thus, future studies should explore the correlation between MRI features and Ki-67 expression in multiple tumors. Second, the small sample size may affect the robustness of this model, which will have to be further optimized through large-scale and multicenter studies. Third, we did not calculate the T1 relaxation time ratio of tumor to liver parenchyma since the presence of liver cirrhosis might have influenced the results.
Gadoxetic acid-enhanced MRI combined with T1 mapping and several clinical factors can preoperatively predict the Ki-67 LI of HCC, and therefore guide treatment and prognostic assessment. Nevertheless, the clinical utility of our prediction model in combination with clinico-radiological features will have to be validated in future randomized trials to guide individualized therapy.
The raw data supporting the conclusions of this article will be made available by the authors, without undue reservation.
The studies involving human participants were reviewed and approved by The hospital ethics committee of the first people’s hospital of Zhaoqing. Written informed consent for participation was not required for this study in accordance with the national legislation and the institutional requirements.
GQ, JC, and WL conducted the literature search. GQ, WL, YL, and YZ designed the study. GQ, JC, WL, and YL collected the data. GQ, JC, WL, YL, and YZ analyzed the data. All authors verified the data. GQ, JC, WL, YL, and YZ edited the manuscript. WL, YL, and YZ reviewed the manuscript. All authors contributed to the article and approved the submitted version.
This study was funded by the Science and Technology innovation of Zhaoqing City, Guangdong Province, China under Grant (No. 2019N008). This work was supported by Medical Scientific Research Foundation of Guangdong Province, China under Grant (No. B2020225).
The authors declare that the research was conducted in the absence of any commercial or financial relationships that could be construed as a potential conflict of interest.
All claims expressed in this article are solely those of the authors and do not necessarily represent those of their affiliated organizations, or those of the publisher, the editors and the reviewers. Any product that may be evaluated in this article, or claim that may be made by its manufacturer, is not guaranteed or endorsed by the publisher.
The Supplementary Material for this article can be found online at: https://www.frontiersin.org/articles/10.3389/fonc.2023.1134646/full#supplementary-material
1. Sung H, Ferlay J, Siegel RL, Laversanne M, Soerjomataram I, Jemal A, et al. Global cancer statistics 2020: GLOBOCAN estimates of incidence and mortality worldwide for 36 cancers in 185 countries. CA A Cancer J Clin (2021) 71:209–49. doi: 10.3322/caac.21660
2. Marrero JA, Kulik LM, Sirlin CB, Zhu AX, Finn RS, Abecassis MM, et al. Diagnosis, staging, and management of hepatocellular carcinoma: 2018 practice guidance by the American association for the study of liver diseases. Hepatology (2018) 68:723–50. doi: 10.1002/hep.29913
3. Galle PR, Forner A, Llovet JM, Mazzaferro V, Piscaglia F, Raoul J-L, et al. EASL clinical practice guidelines: management of hepatocellular carcinoma. J Hepatol (2018) 69:182–236. doi: 10.1016/j.jhep.2018.03.019
4. Calderaro J, Ziol M, Paradis V, Zucman-Rossi J. Molecular and histological correlations in liver cancer. J Hepatol (2019) 71:616–30. doi: 10.1016/j.jhep.2019.06.001
5. Scholzen T, Gerdes J. The Ki-67 protein: from the known and the unknown. J Cell Phys (2000) 182:311–22. doi: 10.1002/(SICI)1097-4652(200003)182:3<311::AID-JCP1>3.0.CO;2-9
6. Yang C, Zhang J, Ding M, Xu K, Li L, Mao L, et al. Ki67 targeted strategies for cancer therapy. Clin Transl Oncol (2018) 20:570–5. doi: 10.1007/s12094-017-1774-3
7. Murakami K, Kasajima A, Kawagishi N, Ohuchi N, Sasano H. Microvessel density in hepatocellular carcinoma: prognostic significance and review of the previous published work: MVD in HCC. Hepatol Res (2015) 45:1185–94. doi: 10.1111/hepr.12487
8. Sofocleous CT, Garg S, Petrovic LM, Gonen M, Petre EN, Klimstra DS, et al. Ki-67 is a prognostic biomarker of survival after radiofrequency ablation of liver malignancies. Ann Surg Oncol (2012) 19:4262–9. doi: 10.1245/s10434-012-2461-9
9. Yang C, Su H, Liao X, Han C, Yu T, Zhu G, et al. Marker of proliferation Ki-67 expression is associated with transforming growth factor beta 1 and can predict the prognosis of patients with hepatic b virus-related hepatocellular carcinoma. CMAR (2018) 10:679–96. doi: 10.2147/CMAR.S162595
10. Guzman G, Alagiozian-Angelova V, Layden-Almer JE, Layden TJ, Testa G, Benedetti E, et al. Ki-67, and serum alpha feto-protein as predictors of hepatocellular carcinoma recurrence in liver transplant patients. Modern Pathol (2005) 18:1498–503. doi: 10.1038/modpathol.3800458
11. Li Y, Yan C, Weng S, Shi Z, Sun H, Chen J, et al. Texture analysis of multi-phase MRI images to detect expression of Ki67 in hepatocellular carcinoma. Clin Radiol (2019) 74:813.e19–813.e27. doi: 10.1016/j.crad.2019.06.024
12. Ye Z, Jiang H, Chen J, Liu X, Wei Y, Xia C, et al. Texture analysis on gadoxetic acid enhanced-MRI for predicting Ki-67 status in hepatocellular carcinoma: a prospective study. Chin J Cancer Res (2019) 31:806–17. doi: 10.21147/j.issn.1000-9604.2019.05.10
13. Hu X-X, Yang Z-X, Liang H-Y, Ding Y, Grimm R, Fu C-X, et al. Whole-tumor MRI histogram analyses of hepatocellular carcinoma: correlations with Ki-67 labeling index. J Magn Reson Imaging (2017) 46:383–92. doi: 10.1002/jmri.25555
14. Wu H, Han X, Wang Z, Mo L, Liu W, Guo Y, et al. Prediction of the Ki-67 marker index in hepatocellular carcinoma based on CT radiomics features. Phys Med Biol (2020) 65:235048. doi: 10.1088/1361-6560/abac9c
15. Fan Y, Yu Y, Wang X, Hu M, Hu C. Radiomic analysis of gd-EOB-DTPA-enhanced MRI predicts Ki-67 expression in hepatocellular carcinoma. BMC Med Imaging (2021) 21:100. doi: 10.1186/s12880-021-00633-0
16. Hu X, Zhou J, Li Y, Wang Y, Guo J, Sack I, et al. Added value of viscoelasticity for MRI-based prediction of Ki-67 expression of hepatocellular carcinoma using a deep learning combined radiomics (DLCR) model. Cancers (2022) 14:2575. doi: 10.3390/cancers14112575
17. Wu C, Chen J, Fan Y, Zhao M, He X, Wei Y, et al. Nomogram based on CT radiomics features combined with clinical factors to predict Ki-67 expression in hepatocellular carcinoma. Front Oncol (2022) 12:943942. doi: 10.3389/fonc.2022.943942
18. Zhang L, Duan S, Qi Q, Li Q, Ren S, Liu S, et al. Noninvasive prediction of Ki-67 expression in hepatocellular carcinoma using machine learning-based ultrasomics: a multicenter study. J Ultrasound Med (2022) 12:22. doi: 10.1002/jum.16126
19. Hosny A, Parmar C, Quackenbush J, Schwartz LH, Aerts HJWL. Artificial intelligence in radiology. Nat Rev Cancer (2018) 18:500–10. doi: 10.1038/s41568-018-0016-5
20. Yasaka K, Akai H, Kunimatsu A, Kiryu S, Abe O. Deep learning with convolutional neural network in radiology. Jpn J Radiol (2018) 36:257–72. doi: 10.1007/s11604-018-0726-3
21. Haimerl M, Utpatel K, Verloh N, Zeman F, Fellner C, Nickel D, et al. Gd-EOB-DTPA-enhanced MR relaxometry for the detection and staging of liver fibrosis. Sci Rep (2017) 7:41429. doi: 10.1038/srep41429
22. Peng Z, Jiang M, Cai H, Chan T, Dong Z, Luo Y, et al. Gd-EOB-DTPA-enhanced magnetic resonance imaging combined with T1 mapping predicts the degree of differentiation in hepatocellular carcinoma. BMC Cancer (2016) 16:625. doi: 10.1186/s12885-016-2607-4
23. Qin X, Yang T, Huang Z, Long L, Zhou Z, Li W, et al. Hepatocellular carcinoma grading and recurrence prediction using T1 mapping on gadolinium−ethoxybenzyl diethylenetriamine pentaacetic acid−enhanced magnetic resonance imaging. Oncol Lett (2019) 18:2322–9. doi: 10.3892/ol.2019.10557
24. Li J, Liu H, Zhang C, Yang S, Wang Y, Chen W, et al. Native T1 mapping compared to ultrasound elastography for staging and monitoring liver fibrosis: an animal study of repeatability, reproducibility, and accuracy. Eur Radiol (2020) 30:337–45. doi: 10.1007/s00330-019-06335-0
25. Luetkens JA, Klein S, Träber F, Schmeel FC, Sprinkart AM, Kuetting DLR, et al. Quantification of liver fibrosis at T1 and T2 mapping with extracellular volume fraction MRI: preclinical results. Radiology (2018) 288:748–54. doi: 10.1148/radiol.2018180051
26. Rao C, Wang X, Li M, Zhou G, Gu H. Value of T1 mapping on gadoxetic acid-enhanced MRI for microvascular invasion of hepatocellular carcinoma: a retrospective study. BMC Med Imaging (2020) 20:43. doi: 10.1186/s12880-020-00433-y
27. Zheng J, Seier K, Gonen M, Balachandran VP, Kingham TP, D’Angelica MI, et al. Utility of serum inflammatory markers for predicting microvascular invasion and survival for patients with hepatocellular carcinoma. Ann Surg Oncol (2017) 24:3706–14. doi: 10.1245/s10434-017-6060-7
28. Zhang H, Zhou Y, Li Y, Qin W, Zi Y, Liu Y, et al. Predictive value of gamma-glutamyl transpeptidase to lymphocyte count ratio in hepatocellular carcinoma patients with microvascular invasion. BMC Cancer (2020) 20:132. doi: 10.1186/s12885-020-6628-7
29. Wang Q, Chen Q, Zhang X, Lu X-L, Du Q, Zhu T, et al. Diagnostic value of gamma-glutamyltransferase/aspartate aminotransferase ratio, protein induced by vitamin K absence or antagonist II, and alpha-fetoprotein in hepatitis b virus-related hepatocellular carcinoma. WJG (2019) 25:5515–29. doi: 10.3748/wjg.v25.i36.5515
30. Tzartzeva K, Obi J, Rich NE, Parikh ND, Marrero JA, Yopp A, et al. Surveillance imaging and alpha fetoprotein for early detection of hepatocellular carcinoma in patients with cirrhosis: a meta-analysis. Gastroenterology (2018) 154:1706–1718.e1. doi: 10.1053/j.gastro.2018.01.064
31. Johnson PJ, Berhane S, Kagebayashi C, Satomura S, Teng M, Reeves HL, et al. Assessment of liver function in patients with hepatocellular carcinoma: a new evidence-based approach–the ALBI grade. JCO (2015) 33:550–8. doi: 10.1200/JCO.2014.57.9151
32. Ye Z, Cao L, Wei Y, Chen J, Zhang Z, Yao S, et al. Preoperative prediction of hepatocellular carcinoma with highly aggressive characteristics using quantitative parameters derived from hepatobiliary phase MR images. Ann Transl Med (2020) 8:85–5. doi: 10.21037/atm.2020.01.04
33. Liu Z, Yang S, Chen X, Luo C, Feng J, Chen H, et al. Nomogram development and validation to predict Ki-67 expression of hepatocellular carcinoma derived from gd-EOB-DTPA-enhanced MRI combined with T1 mapping. Front Oncol (2022) 12:954445. doi: 10.3389/fonc.2022.954445
34. Chen J, Chen C, Xia C, Huang Z, Zuo P, Stemmer A, et al. Quantitative free-breathing dynamic contrast-enhanced MRI in hepatocellular carcinoma using gadoxetic acid: correlations with Ki67 proliferation status, histological grades, and microvascular density. Abdom Radiol (2018) 43:1393–403. doi: 10.1007/s00261-017-1320-3
35. Fu X, Zhang W, Li S, Ling N, Yang Y, Dazhi Z. Identification of alanine aminotransferase 1 interaction network via iTRAQ-based proteomics in alternating migration, invasion, proliferation and apoptosis of HepG2 cells. Aging (2022) 14:7137–55. doi: 10.18632/aging.204286
36. Niu Z-S. Management of hepatocellular carcinoma: predictive value of immunohistochemical markers for postoperative survival. WJH (2015) 7:7–27. doi: 10.4254/wjh.v7.i1.7
37. Cao Y, Ke R, Wang S, Zhu X, Chen J, Huang C, et al. DNA Topoisomerase IIα and Ki67 are prognostic factors in patients with hepatocellular carcinoma. Oncol Lett (2017) 13:4109–16. doi: 10.3892/ol.2017.5999
Keywords: hepatocellular carcinoma, Ki-67, magnetic resonance imaging, T1 mapping, nomogram
Citation: Qiu G, Chen J, Liao W, Liu Y, Wen Z and Zhao Y (2023) Gadoxetic acid-enhanced MRI combined with T1 mapping and clinical factors to predict Ki-67 expression of hepatocellular carcinoma. Front. Oncol. 13:1134646. doi: 10.3389/fonc.2023.1134646
Received: 30 December 2022; Accepted: 19 June 2023;
Published: 30 June 2023.
Edited by:
Manish Devendra Mair, University Hospitals of Leicester NHS Trust, United KingdomCopyright © 2023 Qiu, Chen, Liao, Liu, Wen and Zhao. This is an open-access article distributed under the terms of the Creative Commons Attribution License (CC BY). The use, distribution or reproduction in other forums is permitted, provided the original author(s) and the copyright owner(s) are credited and that the original publication in this journal is cited, in accordance with accepted academic practice. No use, distribution or reproduction is permitted which does not comply with these terms.
*Correspondence: Yue Zhao, Y2hhb3l1ZXpqQGhvdG1haWwuY29t
Disclaimer: All claims expressed in this article are solely those of the authors and do not necessarily represent those of their affiliated organizations, or those of the publisher, the editors and the reviewers. Any product that may be evaluated in this article or claim that may be made by its manufacturer is not guaranteed or endorsed by the publisher.
Research integrity at Frontiers
Learn more about the work of our research integrity team to safeguard the quality of each article we publish.