 Nathalie Babl1†
 Joshua Hofbauer1†
 Carina Matos1Florian Voll1,2Ayse Nur Menevse2Michael Rechenmacher1Ruth Mair1Philipp Beckhove1,2Wolfgang Herr1
 Peter J. Siska1
 Kathrin Renner1
 Marina Kreutz1,2
 Annette Schnell1*
- 1Department of Internal Medicine III, University Hospital Regensburg, Regensburg, Germany
- 2Division of Interventional Immunology, Leibniz Institute for Immunotherapy (LIT), Regensburg, Germany
Introduction: The discovery of immune checkpoints and the development of their specific inhibitors was acclaimed as a major breakthrough in cancer therapy. However, only a limited patient cohort shows sufficient response to therapy. Hence, there is a need for identifying new checkpoints and predictive biomarkers with the objective of overcoming immune escape and resistance to treatment. Having been associated with both, treatment response and failure, LDL seems to be a double-edged sword in anti-PD1 immunotherapy. Being embedded into complex metabolic conditions, the impact of LDL on distinct immune cells has not been sufficiently addressed. Revealing the effects of LDL on T cell performance in tumor immunity may enable individual treatment adjustments in order to enhance the response to routinely administered immunotherapies in different patient populations. The object of this work was to investigate the effect of LDL on T cell activation and tumor immunity in-vitro.
Methods: Experiments were performed with different LDL dosages (LDLlow = 50 μg/ml and LDLhigh = 200 μg/ml) referring to medium control. T cell phenotype, cytokines and metabolism were analyzed. The functional relevance of our findings was studied in a HCT116 spheroid model in the context of anti-PD-1 blockade.
Results: The key points of our findings showed that LDLhigh skewed the CD4+ T cell subset into a central memory-like phenotype, enhanced the expression of the co-stimulatory marker CD154 (CD40L) and significantly reduced secretion of IL-10. The exhaustion markers PD-1 and LAG-3 were downregulated on both T cell subsets and phenotypical changes were associated with a balanced T cell metabolism, in particular with a significant decrease of reactive oxygen species (ROS). T cell transfer into a HCT116 spheroid model resulted in a significant reduction of the spheroid viability in presence of an anti-PD-1 antibody combined with LDLhigh.
Discussion: Further research needs to be conducted to fully understand the impact of LDL on T cells in tumor immunity and moreover, to also unravel LDL effects on other lymphocytes and myeloid cells for improving anti-PD-1 immunotherapy. The reason for improved response might be a resilient, less exhausted phenotype with balanced ROS levels.
1 Introduction
The discovery of immune checkpoints and development of their specific inhibitors was acclaimed as a major breakthrough in cancer therapy. Especially blocking the inhibitory receptor PD-1 on immune cells and its ligand PD-L1 on immune and tumor cells has been shown to be associated with an enhanced overall survival in metastatic disease of various tumor entities. However, only a limited patient cohort shows sufficient response to therapy (1). Hitherto, numerous biomarkers have been described, predicting response to checkpoint inhibition (2). Recently, cholesterol has been newly identified as a biomarker for the efficacy of PD-1 inhibition (3–5). Consistent with our own results, Perrone et al., Galli et al. and Tong et al. retrospectively showed, that baseline hypercholesterolemia was associated with better outcomes in patients treated with anti-PD-1 checkpoint therapy. In our preliminary exploratory approach (6), we also prospectively demonstrated a positive association.
However, cholesterol seems to be a double-edged sword in tumor immunity, and it`s role in the tumor environment is not fully understood, as other authors have discussed opposing effects. Ma et al. reported a cholesterol induced exhaustion of CD8+ T Cells in the tumor microenvironment and furthermore, Khojandi et al. observed a promoted resistance to cancer immunotherapy by oxidized lipoproteins, amongst others mediated by suppression of T cell immunity (7, 8). The reason for these seemingly paradox findings may be due to the embedment of cholesterol in different complex metabolic conditions. Cholesterol has been identified as a biomarker in cachexia and the metabolic syndrome (9, 10). Furthermore, hypercholesterolemia has been associated with atherosclerosis, Alzheimer`s disease, cancer and may exacerbate autoimmune diseases by inducing hyper-activated T cells (11–15).
Up to date, mainly macrophages have been perceived as a link between cholesterol and different diseases, however there is growing evidence for T cells also playing a crucial role (16). Although the details of cholesterol homeostasis have been investigated mainly in hepatocytes and macrophages, the mechanisms of cholesterol biosynthesis, uptake, esterification, and efflux also apply to T cells (11, 12). Furthermore, it has been acknowledged that T cells express the LDL receptor, however it is not clear, if cholesterol uptake is conducted exclusively via the LDL receptor (17). Cholesterol maintains quiescence in naïve T cells and also paradoxically regulates exit from quiescence by modulating TCR nanocluster formation besides effecting signaling molecules (18–20). T cell activation induces an increase of intracellular cholesterol for proliferation, however self-regulation is secured by negative feedback pathways (21–24). Moreover, cholesterol is also involved in the differentiation and stabilization of the different T cell subsets. While Th1, Th17, γδT, and cytotoxic T cells require high cholesterol levels, Th2 cells do not (25–28). Paradoxical effects have also been observed in Tregs and memory T cells (29, 30). There are indications that CD8 memory T cells might require suppression of the cholesterol pathway, while contrarily CD4 memory T cells depend upon enhanced cholesterol levels (11, 31, 32).
So, being confronted with very paradox findings in complex environments, we aimed to straightforwardly investigate the effects of cholesterol on T cell subsets. We focused on LDL, since LDL emerged as the most significant serum lipid associated with response to immunotherapy in our and another preceding study (6, 33).
The LDL dosages for treatment referring to medium control were chosen according to LDL serum levels and their estimated tissue levels in responders (LDLhigh) and non-responders (LDLlow) to anti-PD-1 checkpoint therapy (6, 34).
We analyzed the T cell phenotype, considering checkpoint markers, activation markers, co-stimulatory markers und effector versus memory markers. Furthermore, we investigated T cell metabolism including mitochondrial metabolism, cholesterol uptake, ROS accumulation, cell respiration and acidification. In order to further explore the functional relevance of our findings in the context of tumor immunity and PD-1 blockade, we established a co-culture model with T cells migrating into colorectal cancer HCT116 tumor spheroids.
2 Material and methods
2.1 Cell culture
Buffy coats from healthy donors were obtained from the Department of Transfusion Medicine (University Hospital Regensburg) in form of remnants from routine platelet donations. The donations were approved by the Institutional Ethics Committee of the University of Regensburg (vote number 13-101-0240; 13-101-0238) and are in accordance with the Declaration of Helsinki.
CD4+ and CD8+ T-cells were isolated using MACS cell separation kits (Miltenyi Biotec, 130-096-533 (CD4), 130-096-495 (CD8)). After isolation, cells were stored over night at 37°C at a concentration of 107 cells per ml in RPMI 1640 medium supplemented with 2% human AB Serum, 1% stabilized glutamine and 0,5% Penicillin/Streptomycin. Cells were washed, counted (CASY System) and the cell concentration was adjusted to 5x10⁵ cells per ml using the aforementioned medium plus 100 IU recombinant human (rh) IL-2 (PeproTech, 200-02) per ml. Either PBS (control) or LDL (Kalen Biomedical LLC, 770200-1) was added at the indicated concentrations and cells were seeded in 96 well U-Bottom plates. For some of the experiments as indicated, an anti-human PD-1 blocking antibody (InVivoMAb anti-human PD-1, Bio X Cell, BE0188) was added at a concentration of 10 µg/ml. T cells were stimulated using CD3/28 Dynabeads (ThermoFisher Scientific, cell to bead ratio 1:1, 25 µl bead suspension per 106 cells), incubating at 37°C for 96h. The T cells were harvested after 48h and 96h, Dynabeads were removed and the cells were counted using the CASY System.
2.2 Co-culture of T cells withtumor spheroids
Spheroids were generated for 4 days on ultra-low attaching plates, which were coated with a solution of 12 mg/ml Poly-(methacrylsäure-2-hydroxyethylester) (poly-HEMA; Sigma Aldrich) dissolved in 95% ethanol. 50 µl of sterile poly-HEMA solution per well was allowed to evaporate in a sterile biosafety cabinet and dried plates were stored at 4°C before use. Sub-confluent cultures of the highly microsatellite instable colon carcinoma cell line HCT116 (35) were dissociated into single-cell suspensions and subsequently, 10,000 cells in 100 µl RPMI 1640 (GIBCO, 31870-025) with 10% fetal calf serum (Sigma, F7524) and 2 mM glutamine (PAN Biotech, P04-80100)) were seeded per well and incubated in a humidified atmosphere (5% CO2, 95% air) at 37°C (Heraeus Incubator). For co-culture, peripheral blood mononuclear cells were isolated by density gradient centrifugation over Ficoll/Hypaque as described before (Andreesen et al., 1990 (36)). T cells were isolated by magnetic bead separation (human Pan T Cell Isolation Kit, Miltenyi Biotec, 130-096-535). T cells were cultured in RPMI 1640 (GIBCO, 31870-025), supplemented with 10% human AB serum (BRK, Bavarian Red Cross), 2 mM L-glutamine (PAN-Biotech, P04-80100), essential vitamins (GIBCO, 1112037) and non-essential amino acids (GIBCO, 11140035), 1 mM pyruvate (GIBCO, 11360039), b-mercapthoethanol (GIBCO, 31350010), 0.5% penicillin and streptomycin (both GIBCO, 15140122) and 25 IU/mL rhIL-2 (PeproTech, 200-02) in a humidified atmosphere (5% CO2, 95% air) at 37°C in a Heraeus incubator. 1x10⁶ cells T cells were seeded in 24-well plates with indicated treatments and stimulated with anti-CD3/CD28 Dynabeads (Thermo Fisher Scientific, 11132D) at a cell to bead ratio of 1:1. For co-culture with tumor spheroids, beads were removed after 48h of stimulation, T cells were washed and 0.1x10⁶ T cells in 100 µl tumor medium supplemented with 25 IU/mL Il-2 were added to each spheroid with indicated treatments. After 24h co-culture, they were washed and seeded with fresh medium for live cell imaging.
2.3 Flow cytometry
After 48h and 96h, T cells subsets were harvested, Dynabeads were removed and the cell suspensions were partitioned into FACS tubes. Cells were stained with Zombie Aqua Fixable Viability Kit (BioLegend, 423102) or Zombie NIR™ Fixable Viability Kit (BioLegend, 423106) and different surface antibodies PE anti-CD45RO (BD, 555493), PE anti-CD154 (BD 555700), PE anti-CD226 (BioLegend, 337106), PE anti-CD154 (BioLegend, 310806), PE anti-BTLA (BioLegend, 344505), APC anti-TIGIT (BioLegend, 372706), APC anti-CD25 (BD, 340907), APC anti-CD69 (BD, 555533), APC anti-CD62L (BD, 559772), APC anti-CD279 (PD-1) Antibody (BioLegend, 329908), APC anti-GITR (BioLegend, 371206), V450 anti-CD27 (BD, 561408), FITC anti-CD28 (BD, 555728), PE anti-CD39 (BD, 555464), FITC anti-CD44 (BioLegend, 397518), FITC anti-CD95 (BD, 561975), FITC anti-CD134 (OX40) (BioLegend, 350006), BV421 anti-CD137 (BioLegend, 309820), PE-Cy7 anti-CD223 (LAG-3) (eBioscience, 25-2239-42), PerCP-Cy5.5 anti-CD244 (BioLegend, 329515), PE-Cy7 anti-PD-L1 (BioLegend, 329717), PE-Cy7 anti-ICOS (BioLegend, 313519), PE-Cy7 anti-CD366 (Tim-3) (BioLegend, 345013), PE-Cy7 anti-Granzyme B (BioLegend, 396410), BV421 anti-CTLA-4 (Biolegend, 369606), BV421 anti-Perforin (BioLegend, 353307), APC anti-LDLR (R&D Systems, FAB2148A), APC anti-FOXP3 (eBioscience, 17-4776-42), Pacific Blue anti-CD8 (BD, 558207), BV510 anti-PD-1 (BioLegend, 329932), BV510 anti-CD3 (BioLegend, 317332), BV605 anti-CD3 (BioLegend, 317322), BV711 anti-CD4 (BD, 563028) following the manufacturer instructions. Flow cytometry data were acquired using the Fortessa System (BD) or Celesta System (BD). Data were analyzed using FlowJo (v10.8.1).
2.4 Single-cell metabolic assays
Cytosolic reactive oxygen species (ROS) were determined after surface marker staining by applying 10 µM 2′,7′-dichlorofluorescin diacetate (Sigma Aldrich, D6883) for 20 minutes in a cell culture incubator at 38°C in FACS wash buffer in air tight tubes. Cells were washed with 3 ml cold PBS, resuspended in FACS wash buffer and measured immediately.
Mitochondrial content was assessed by staining with MitoTracker Green FM (Thermo Fisher Scientific, M7514). Cells were incubated with 15 nM MitoTracker and 1.3 µM cyclosporine A in RPMI1640 supplemented with 2 mM L-Glutamine for 1 hour at 37°C in a cell culture incubator. Surface staining was performed afterwards.
Tetramethylrhodamine methyl ester (TMRM) (Thermo Fisher Scientific, T668) is a membrane-permeable, cationic, red-orange fluorescent dye that is enriched in active mitochondria. Cells were incubated with 10 µM TMRM and 1.3 µM cyclosporine A in RPMI1640 supplemented with 2 mM L-Glutamine for 30 minutes at 37°C in a cell culture incubator. Surface staining was performed afterwards.
Cholesterol was determined by Filipin staining after surface marker staining by adding 50 µg/ml Filipin in 500 µl PBS for 45 minutes at room temperature. Cells were washed with FACS wash buffer, resuspended, and measured immediately.
2.5 ELISA
After 48 hours and 96 hours, cell cultures were harvested, centrifuged (7 min, 1300 PRM (300g) at 4°C) and the supernatants were stored at -20°C. Supernatants were thawed and subsequently TNFα, INFg, IL-4, IL-7, IL-10, IL-15 and IL-17 concentrations were analyzed using the equivalent ELISA-kits (Human DuoSet ELISA R&D Systems, IFNg DY285B, TNF-alpha DY210, IL-4 DY204, IL-7 DY207, IL-10 DY217B, IL-15 DY247, IL-17 DY317). ELISAs were performed following the manufacturer instructions.
2.6 Monitoring of oxygen consumption and pH in-vitro
Cellular oxygen consumption and pH levels in culture medium were determined non-invasively by the PreSens technology (PreSens Precision Sensing GmbH). 0.8x10⁶ T cells with anti-CD3/CD28 Dynabeads (with a cell to bead ratio of 1:1, Thermo Fisher Scientific) were seeded in 24-well OxoDish® OD24 plates without fixation in 1 mL medium under cell culture conditions for the indicated period of time. Data were analyzed using PreSens SDR_v38 software.
2.7 Real-time live cell imaging
After 24h co-culture with pre-activated T cells, spheroids were washed and transferred to a fresh 96-Well Poly-HEMA plate with 200 µl RPMI 1640 (GIBCO, 31870-025), 10% fetal calf serum (Sigma, F7524), 2 mM glutamine (PAN Biotech, P04-80100)) and 25 IU/ml IL-2, and labelled with 20 µl/ml Cyto3D™ Live-Dead Assay Kit dye (TheWell Bioscience, BM01). Plates were incubated in the Incucyte ZOOM live-cell imager (Essen Bioscience, Welwyn Garden City, UK) at 37°C and 5% CO2 and images were acquired (4x or 10x objective) at the indicated time points. Data were analyzed with the Incucyte ZOOM 2020B software (Essen Bioscience) by creating a threshold-based mask for the calculation of the green object total area (GOTA) of viable cells (green = viable, red = dead).
2.8 Statistical analysis
Depending on normal or non-normal distribution, RM one-way ANOVA with Geisser-Greenhouse correction and Dunnett`s multiple comparison test or Friedman test with Dunn`s multiple comparison test was performed. Significance was indicated as p < 0.05 *, p < 0.01 **, p < 0.001 *** referring to control. Data were corrected for multiple testing according to Benjamini and Hochberg as indicated (retrieved from https://statistikguru.de/rechner/adjustierung-des-alphaniveaus.html).
3 Results
3.1 Presence of LDLhigh balances the metabolic activity in CD4+ and CD8+ T cells
Kishton et al. acknowledged effector T cells to exhibit an enhanced metabolic activity in-vitro, characterized by a high glycolytic activity and reactive oxygen species (ROS) production, resulting in a strong proliferation and cytokine production during expansion. However, upon in-vivo transfer, these cells showed a poor persistence and anti-tumor activity.
On the contrary, T cells exhibiting a balanced metabolic activity and a memory phenotype in-vitro were associated with a high anti-tumor activity and increased persistence in-vivo (37, 38). Furthermore, Gicobi et al. recently demonstrated that resilient T cells, which were resistant in a harsh tumor microenvironment and responsive to immunotherapy, compensated for excessive ROS to maintain metabolic fitness and preserve high cytotoxic capacity (39).
Therefore, we were intrigued to see, if the presence of LDLhigh was linked to a balanced T cell metabolism.
T cells were freshly isolated and stimulated with anti-CD3/CD28 beads, IL-2 and treated with different LDL dosages (LDLlow = 50 µg/ml and LDLhigh = 200 µg/ml) versus medium control. We analyzed T cell proliferation, mitochondrial metabolism, intracellular cholesterol, acid production, respiration, and ROS accumulation (Figure 1, Supplemental Data S3, 6, 8, 9 statistics and data points).
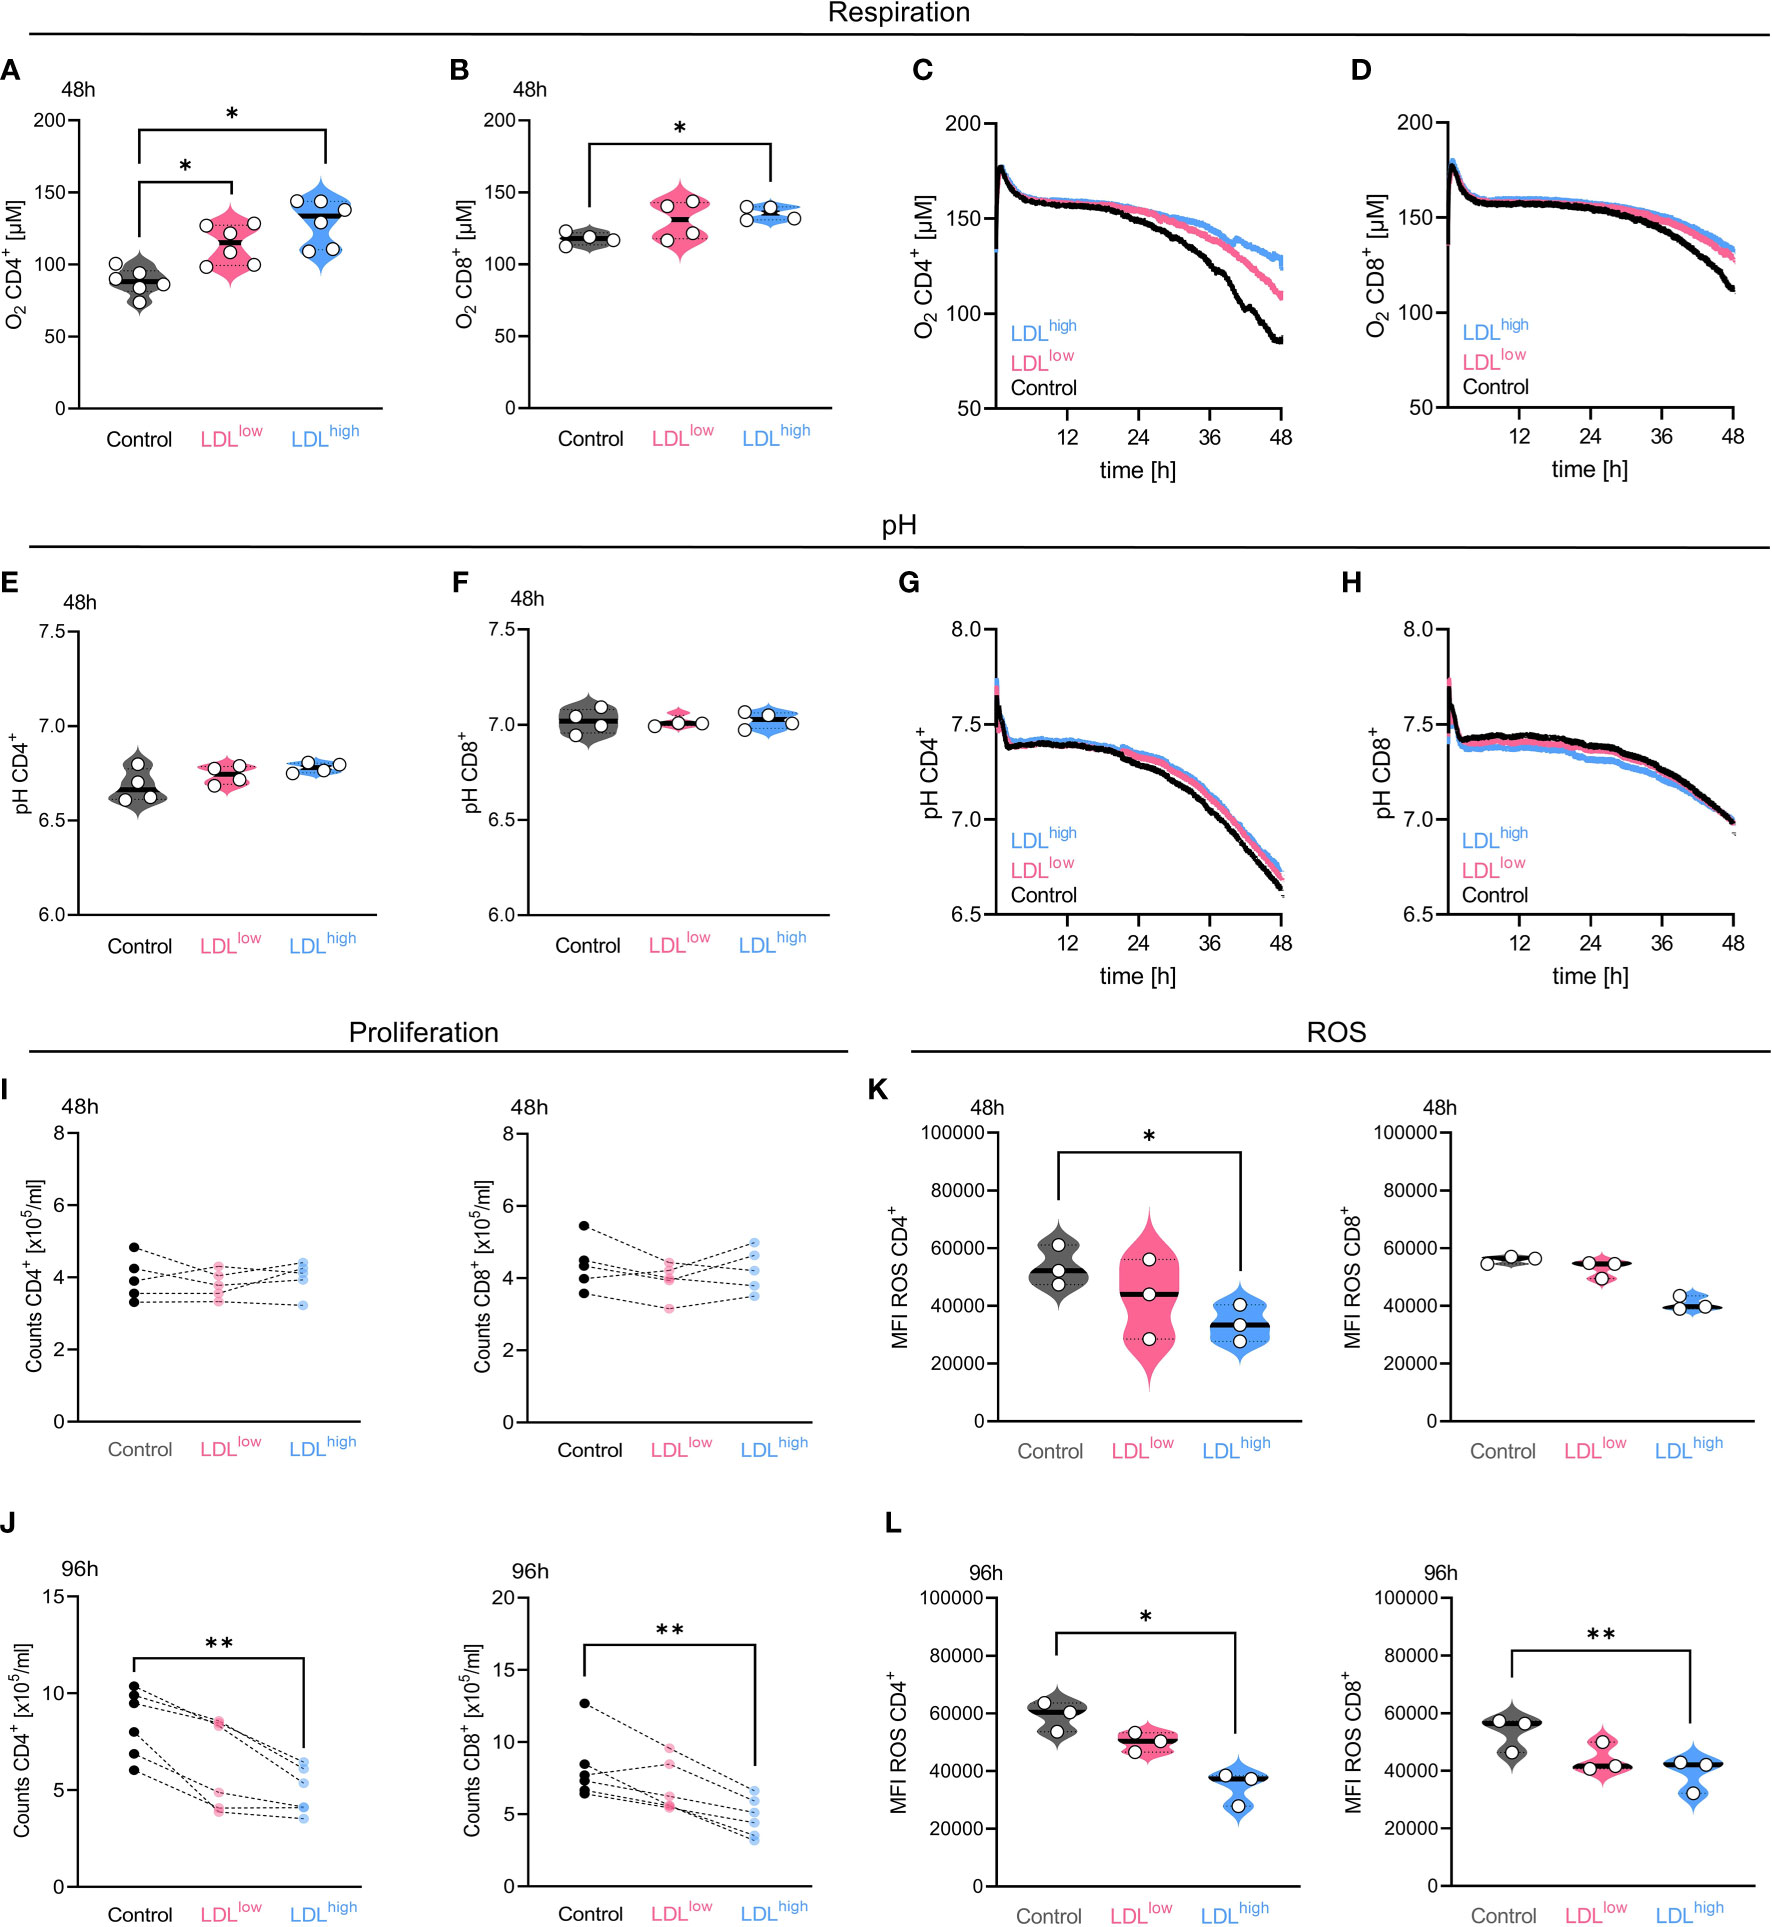
Figure 1 In the presence of LDLhigh, oxygen consumption, cell proliferation and reactive oxygen species (ROS) accumulation were significantly reduced in both T cell subsets. T cells were freshly isolated and stimulated with anti-CD3/CD28 beads, IL-2 and treated with different LDL dosages (LDLlow = 50 µg/ml and LDLhigh = 200 µg/ml) versus medium control. Respiration: [(A) CD4+, (B) CD8+] LDL significantly down-regulated oxygen consumption after 48 h (CD4+ n = 6, CD8+ n = 4) in both T cell subsets. [(C) CD4+, (D) CD8+] Representative illustration of the detection of oxygen concentration over 48 h in both T cell subsets by PreSens technology. pH: [(E) CD4+, (F) CD8+] The CD4 subset showed a reduced acidification in the presence of LDLhigh by trend, however no significance. [(G) CD4+, (H) CD8+] Representative illustration of the pH detection over 48 h in both T cell subsets by PreSens technology Proliferation: [(I) 48 h, (J) 96 h] Proliferation, shown as counts x 105/ml, was significantly restrained in both T cell subsets by LDLhigh after 96 h. ROS: [(K) 48 h, (L) 96 h]. Accumulation of ROS was significantly reduced after 48 h and 96 h by LDLhigh in both T cell subsets (CD8+ 48 h not significant). Depending on normal or non-normal distribution, RM one-way ANOVA with Geisser-Greenhouse correction and Dunnett`s multiple comparison test or Friedman test with Dunn`s multiple comparison test was performed. Significance was indicated as p < 0.05 *, p < 0.01 **, p < 0.001 *** referring to control. Data were corrected for multiple testing according to Benjamini and Hochberg.
T cell oxygen consumption was significantly reduced in the presence of LDLhigh, indicating a reduced turnover by oxidative phosphorylation. Furthermore, the CD4+ T cell subset showed less acidification by trend, however glycolytic activity was preserved (Figures 1A–H).
T cell proliferation was strongly impaired by LDLhigh after 96 h, cell counts x 105/ml hardly differed from pre-proliferation cell counts after 48 h (Figures 1I, J).
ROS accumulation was significantly reduced at both time points in both subsets (Figures 1K, L). However, we did not find any significant differences in the entire CD4+ and CD8+ T cell subset, respectively, concerning the mitochondrial mass, the mitochondrial membrane potential and intracellular cholesterol after 48 h and 96 h (Supplemental Data 3 and 6).
The synopsis of the findings provided strong indications for a balanced metabolism in the presence of LDLhigh in both T cell subsets. As a balanced metabolic activity has been associated with a central memory phenotype, we investigated for a phenotypical shift in the T cell subsets (37).
3.2 LDLhigh induces a central memory phenotype in the CD4+ T cell subset
Central memory T cells (TCM) have been shown to exhibit a superior persistence and anti-tumor immunity compared to effector memory T cells (TEM) (40). TCM were associated with a favorable prognosis in oral squamous cell carcinoma and gastric cancer. Furthermore, a predominance of TCM predicted response to checkpoint therapy in Merkel cell carcinoma (41–43).
CD4+ and CD8+ T cells were stimulated with activating beads and IL-2 in the presence of medium control, LDL 50µg/ml (LDLlow) or LDL 200µg/ml (LDLhigh), respectively. Memory markers were analyzed after 48 h and 96 h.
CD4+ T cells shifted toward CD45RO+ CD62L+ central memory phenotype in the presence of LDLhigh after 96 h (Figure 2A).
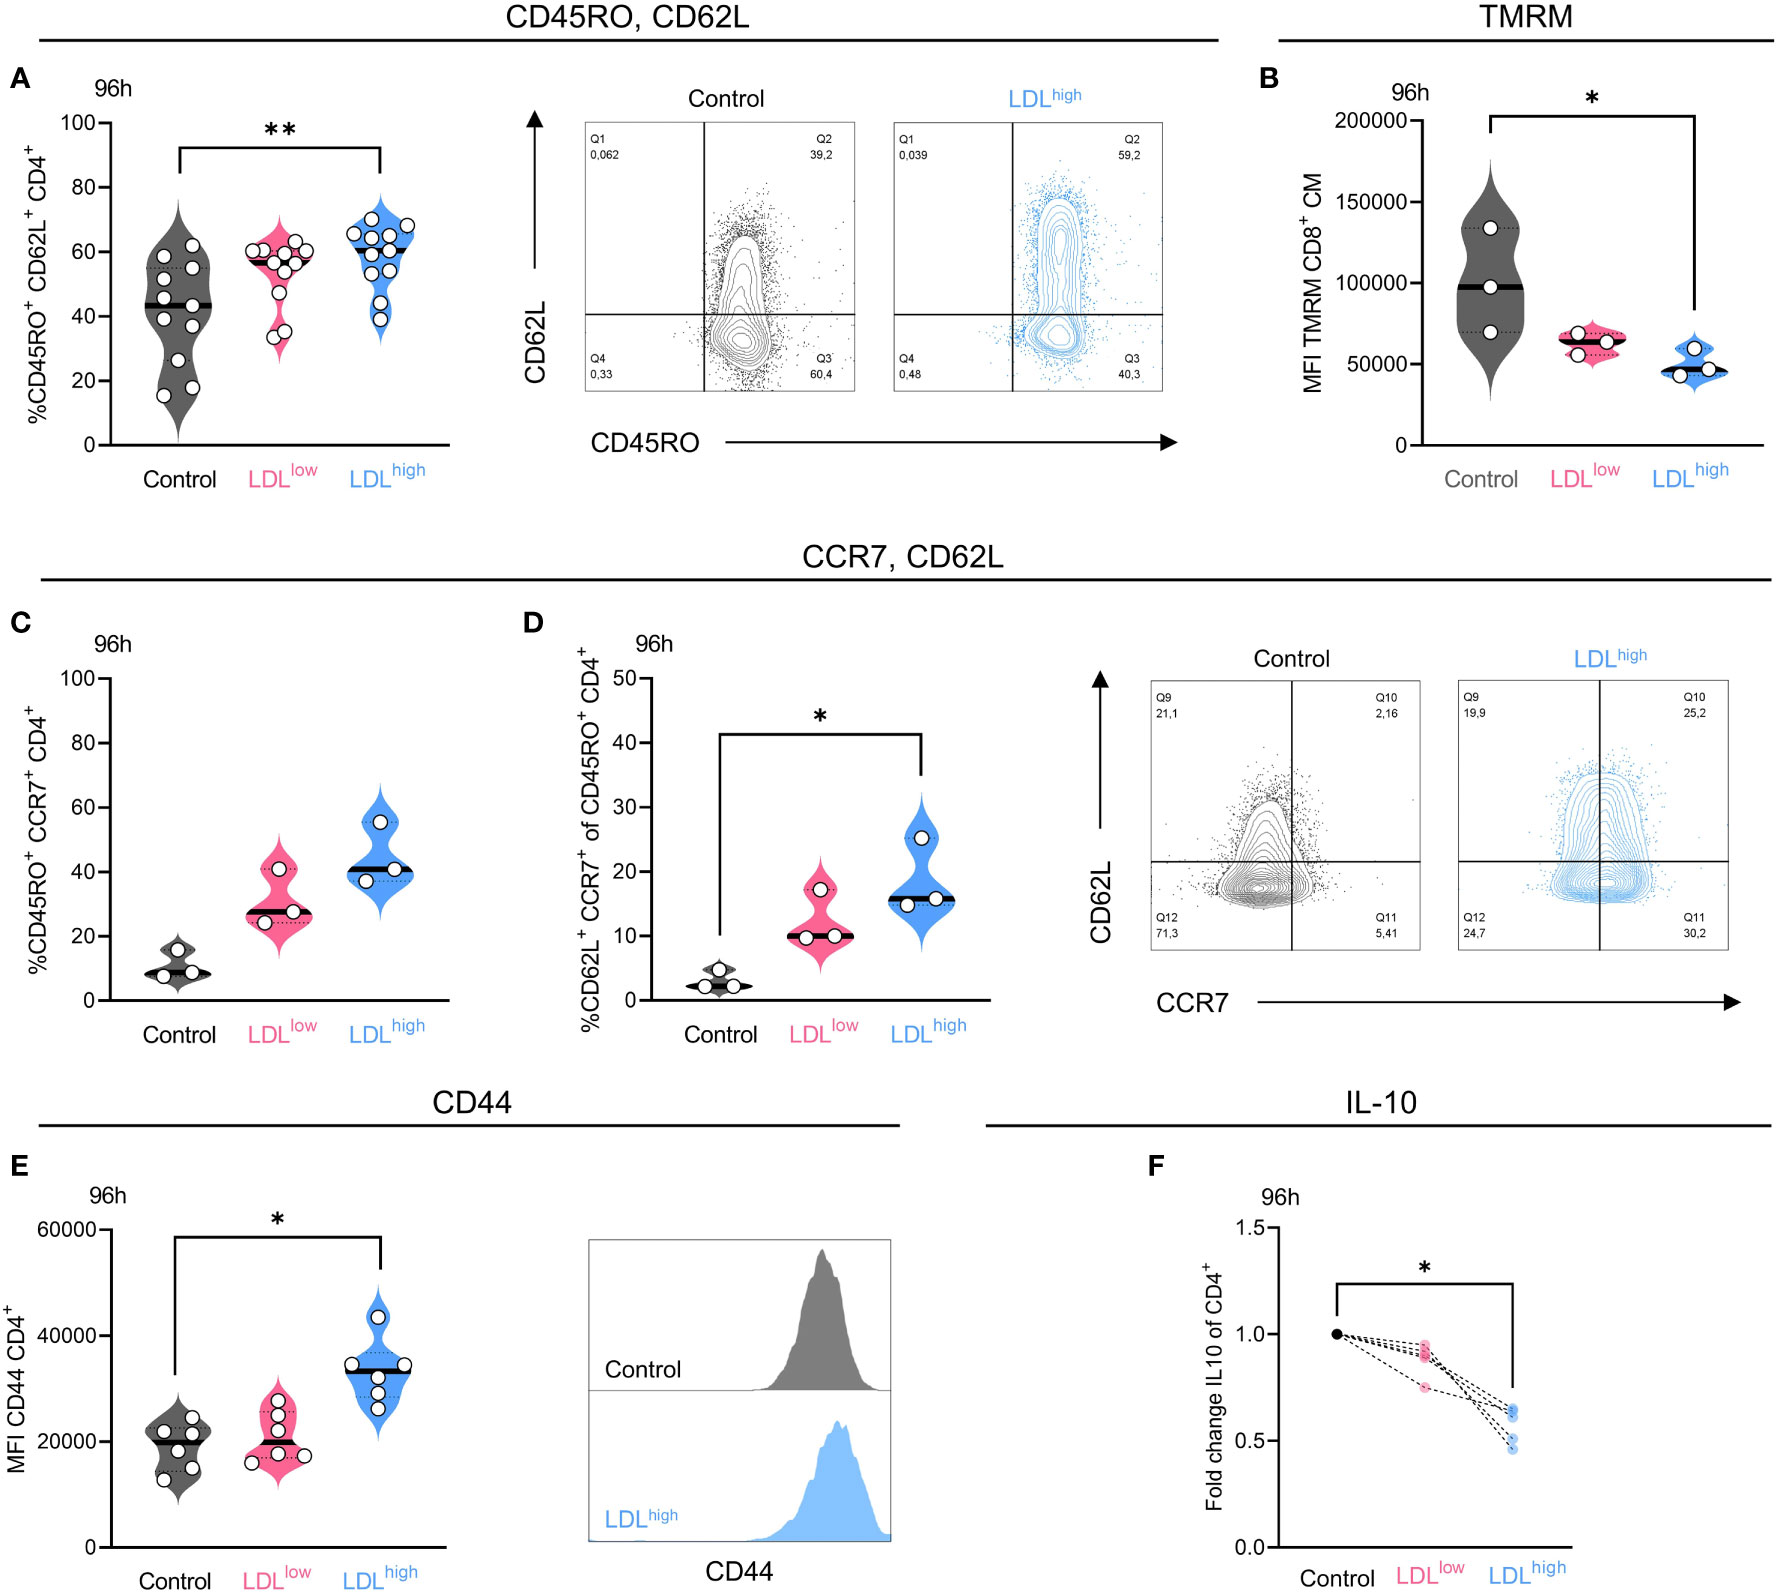
Figure 2 LDLhigh significantly enhanced the fraction of CD4+ T cells with a central memory (TCM) phenotype after 96 h. CD4+ T cells were freshly isolated and stimulated with anti-CD3/CD28 beads, IL-2 and treated with different LDL dosages (LDLlow = 50 µg/ml and LDLhigh = 200 µg/ml) versus medium control. (A) LDLhigh significantly enhanced the fraction of CD45RO+/CD62L+ cells in the CD4+ T cell subset after 96 h. Representative FACS plots present the percentage of CD45RO+ and CD62L+ cells in the presence of medium control versus LDLhigh. (B) TMRM was reduced in CD8+ T cells with a central memory-like phenotype in the presence of LDLhigh. (C,D) Additional, preliminary experiment, demonstrating the upregulation of CCR7 (C) and the fraction of CCR7/CD62L double positive cells (D) in the presence of LDL 150 µg/ml in the CD4+/CD45RO+ subset. Representative FACS plots present the percentage of CCR7+ and CD62L+ cells in the presence of medium control versus LDL 150 µg/ml. (E) The expression of CD44 was significantly enhanced in the presence of LDLhigh. A representative FACS histogram illustrates the Mean Fluorescence Intensity (MFI) for CD44. (F) The secretion of IL-10 was significantly reduced in the presence of LDLhigh. ELISA data (pg/ml) normalized to control. Depending on normal or non-normal distribution, RM on-way ANOVA with Geisser-Greenhouse correction and Dunnett`s multiple comparison test or Friedman test with Dunn`s multiple comparison test was performed. Significance was indicated as p < 0.05 *, p < 0.01 ** referring to control. Data were corrected for multiple testing according to Benjamini and Hochberg if indicated..
We also observed a trend towards a TCM phenotype in the CD8+ subset after 96 h, however the data were not significant. No effects were seen after 48 h.
A preliminary experiment also revealed the up-regulation of CD45RO+ CCR7+ cells in the CD4+ T cell subset by LDL (Figure 2C), however there was only a limited fraction of CD62L/CCR7 double positive cells (Figure 2D), which may be traced back to a mixed memory phenotype and alternatively shedding of CD62L (44, 45).
Furthermore, completing the phenotype, the expression of CD44 was significantly enhanced by LDLhigh in the CD4+ subset after 96 h (Figure 2E). Besides its function as an activation marker and high expression on memory cells, CD44 can promote survival and memory cell development in Th1 cells (46). No effects were seen regarding the expression of CD27, CD28 and FOXP3. T cells were mostly positive for CD27 and CD28, and FOXP3 was barely expressed under all conditions (Supplemental Data S1–5: FACS gating, statistics and data points).
In a further step, we investigated the impact of LDL on memory cell-modulating cytokines. IL-21 has been associated with the induction of a central memory phenotype (47, 48) and IL-7 and IL-15 have been linked to maintenance of a long-term memory survival (49). Autocrine production of IL-7 and IL-15 has been reported (50, 51). Moreover, IL-10 has been linked to suppression of memory development and memory cell responses (52, 53). We could not find any evidence for memory cell induction and maintenance by IL-21, IL-7 and IL-15. Secretion of IL-21 was downregulated and IL-7 and IL-15 could not be detected in the presence of LDLhigh.
However, secretion of IL-10 was significantly impaired by LDLhigh, possibly thereby enabling memory formation (Figure 2F, Supplemental Data S6, 7).
Besides downregulation of ROS and shift towards of a central memory phenotype, the mitochondrial membrane potential has been acknowledged to identify cells with a balanced metabolism and an enhanced stemness for cellular therapy (54). Subtyping for TCM phenotype after 96 h revealed a significant reduction of the mitochondrial membrane potential in the CD8+ subset (Figure 2B), perhaps indicating resilient T cells with a high cytotoxic capacity (39).
In a further step we also investigated phenotypical changes concerning exhaustion, activation, and co-stimulatory surface markers (Table 1).
Table 1 Summary of all surface markers analyzed on CD4+ and CD8+ T cells after stimulation for 48 h and 96 h.
3.3 Presence of LDLhigh is associated with a less exhausted phenotype in CD4+ and CD8+ T cells besides upregulation of the co-stimulatory marker CD154 (CD40L) in the CD4+ T cell subset
CD4+ and CD8+ T cells were stimulated with activating beads and IL-2 in the presence of medium control, LDL 50µg/ml (LDLlow) or LDL 200 µg/ml (LDLhigh), respectively. Surface checkpoint markers, costimulatory markers and activation markers were analyzed after 48 h and 96 h.
In the group of checkpoint markers, LDLhigh induced a significant down-regulation of the fraction (%) of PD-1 positive cells in both T cell subsets after 48 h and in the CD4+ subset also after 96 h (Figure 3A).
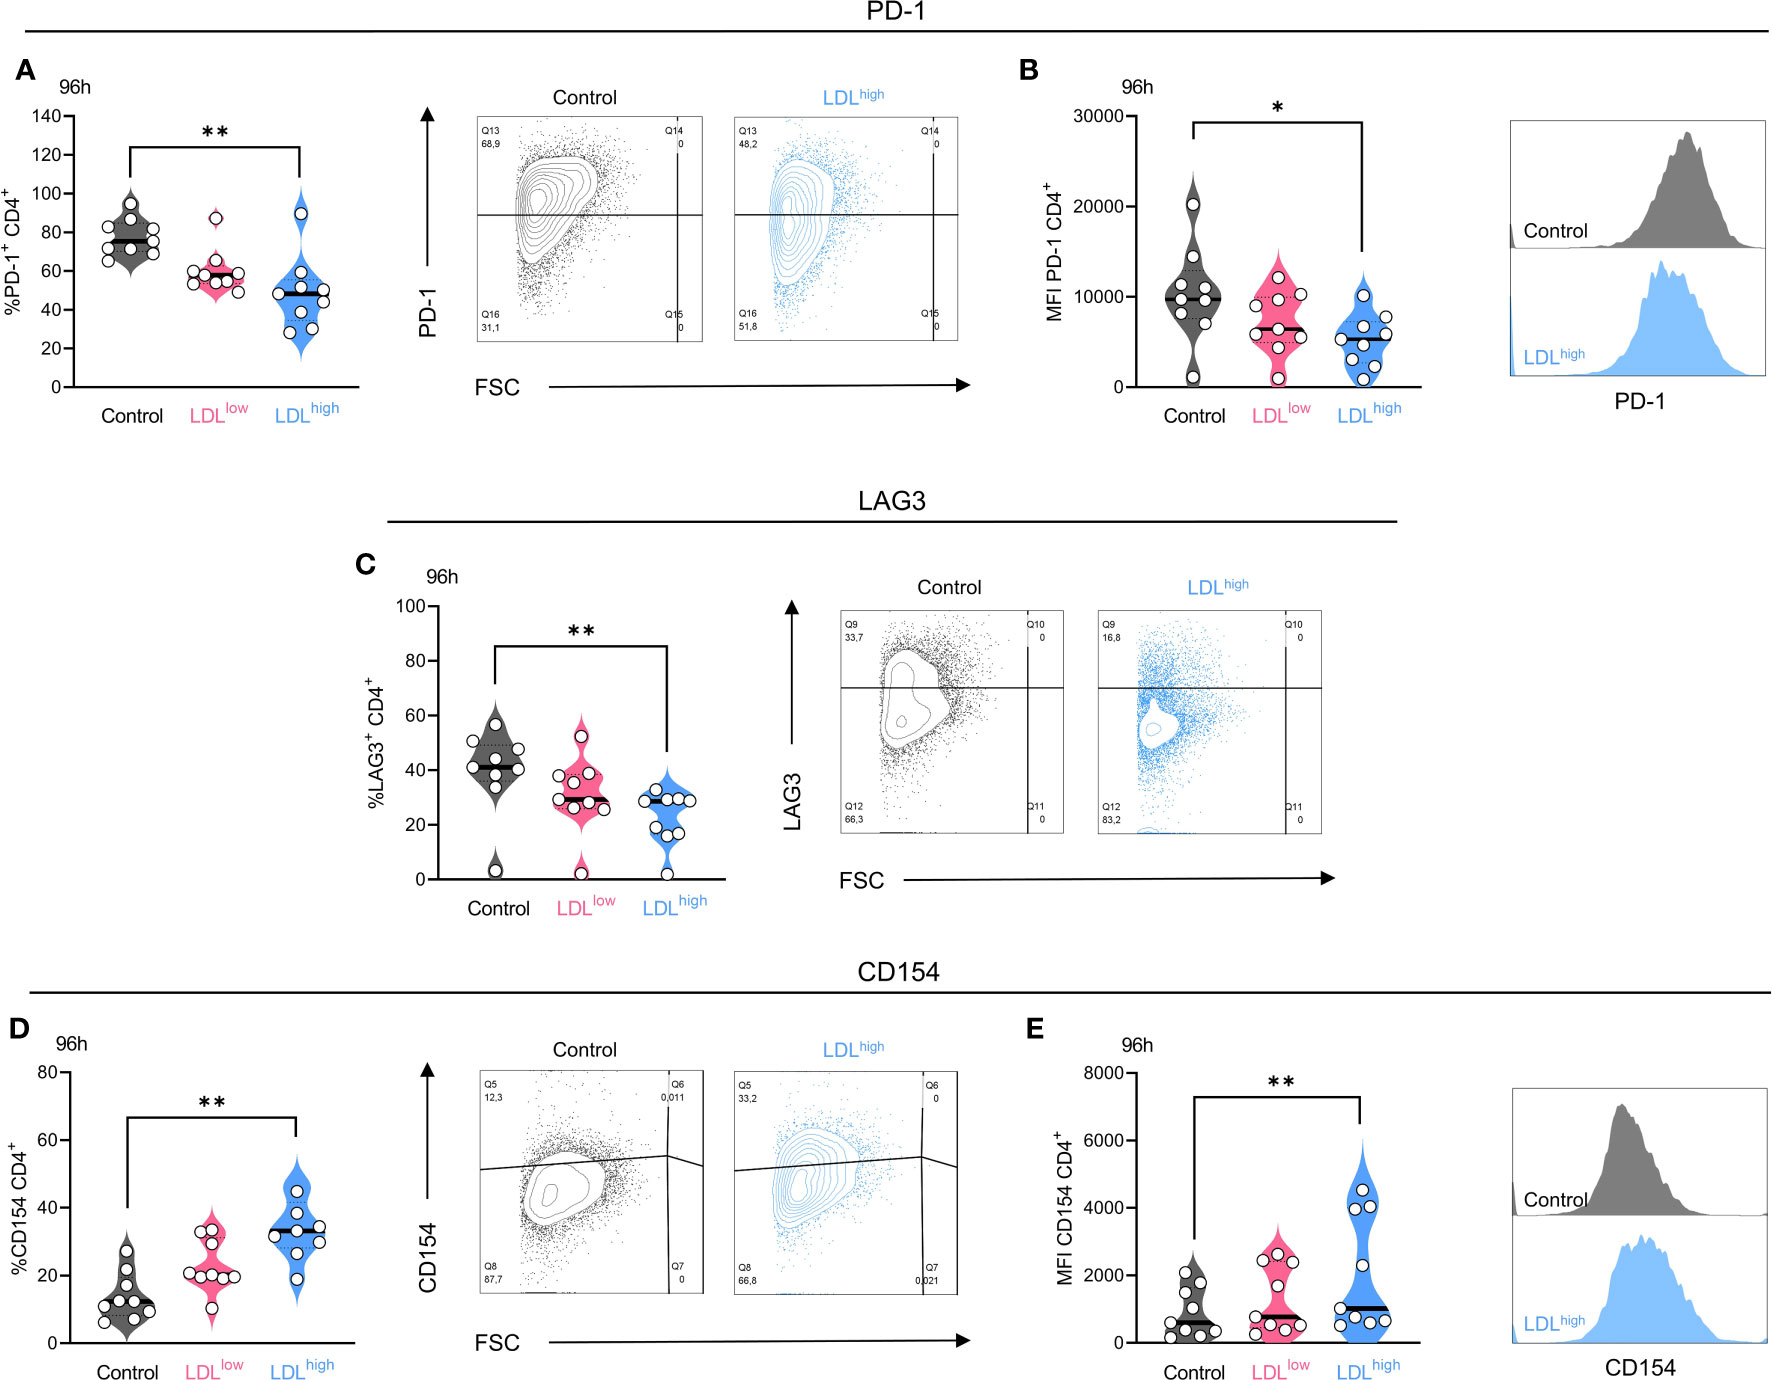
Figure 3 The exhaustion markers PD-1 and LAG-3 were down-regulated in the presence of LDLhigh (here shown for the CD4+ subset after 96 h) and the costimulatory marker CD154 (CD40L) was upregulated in the CD4+ T cell subset. T cells were freshly isolated and stimulated with anti-CD3/CD28 beads, IL-2 and treated with different LDL dosages (LDLlow = 50 µg/ml and LDLhigh = 200 µg/ml) versus medium control. PD-1: LDLhigh significantly reduced the fraction (A) of PD-1+ cells and the expression (B) of PD-1 on the CD4+ T cell subset after 96 h. Representative FACS plots and histograms are presented (A,B). LAG-3: LDLhigh significantly reduced the fraction of LAG-3+ cells in the CD4+ T cell subset after 96 h. Representative FACS plots are presented (C). CD154: The fraction of CD154 (CD40L) positive cells (D) and the expression (E) of CD154 was significantly enhanced in the presence of LDLhigh in the CD4+ subset. Representative FACS plots and histograms are presented (D,E). Depending on normal or non-normal distribution, RM one-way ANOVA with Geisser-Greenhouse correction and Dunnett`s multiple comparison test or Friedman test with Dunn`s multiple comparison test was performed. Significance was indicated as p < 0.05 *, p < 0.01 ** referring to control. All data were corrected for multiple testing according to Benjamini and Hochberg.
The expression (MFI) of PD-1 was significantly reduced in the CD4+ subset after 48 h and in both subsets after 96 h (Figure 3B). The fraction (%) of LAG-3+ T cells was significantly reduced in both T cell subsets after 96 h (Figure 3C), the expression (MFI) of LAG-3 was reduced temporarily in the CD4+ subset after 48h. High expression of PD-1 and LAG-3 have been shown to be associated with a loss of T cell function (55–58). Downregulation of these exhaustion and suppression markers, especially LAG-3, may enhance the efficacy of PD-1 blockade (59–61).
Intriguingly, in the presence of LDLlow, but not LDLhigh, PD-L1 was significantly up-regulated in the CD4+ subset after 48 h and 96 h. Although the expression of PD-L1 on CD4+ T cells was associated with an improved PFS in NSCLC patients (62), PD-L1 signaling on human memory CD4+ T cells induced a regulatory phenotype (63). The expression of all other checkpoint markers was not significantly affected by LDL (Supplemental Data S1–5).
In the group of co-stimulatory markers the fraction and expression of CD154 (CD40L) was significantly up-regulated in the CD4+ T cell subset after 96 h (Figures 3D, E). Interaction of CD154 with CD40 has been demonstrated to mediate anti-tumoral immune responses by enhancing the immunogenic cell death of tumor cells, activation of antigen presenting cells, production of proinflammatory factors, co-stimulation of CD4+ and CD8+ T cells, and the tumor cell susceptibility to T cell lysis (64, 65).
After 48 h, OX40+ T cells were temporarily reduced in the CD4+ subset under both conditions containing LDL, however no differences were seen after 96 h. The expression of all other co-stimulatory markers was not significantly affected by LDL. Furthermore, in the group of activation markers and other markers, expression of CD25 and the LDL receptor were temporarily impaired and CD95 temporarily up-regulated under both conditions containing LDL referring to control after 48 h. No differences were seen after 96 h (Supplemental Data S1–5).
As the T cells exhibited a less exhausted phenotype, we were also intrigued to investigate cytokine secretion. In monoculture, we could not reveal any significant differences for IFNg, TNFa, granzyme B, IL-17 and IL-4, however the production of perforin was enhanced in both T cell subsets by trend (Supplemental Data S3, 6, 7).
To complete our understanding of the phenotypical und functional alterations induced by LDL, we investigated in a further step functional properties in a spheroid model.
3.4 LDLhigh augments checkpoint blockade in a tumor spheroid co-culture model
Spheroids were generated for 4 days. In parallel, T cells were pre-activated with anti-CD3/CD28 beads and IL-2. After 2 days of stimulation with anti-PD-1, LDLhigh or LDLhigh + anti-PD-1 versus medium control, T cells were added to the spheroids and allowed to infiltrate for 24 h. Subsequently, the co-cultured spheroids were stained with a viability dye (red = dead, green = viable). Fluorescence was monitored for further 48 h (Figure 4, Supplemental Data S10, Video S1).
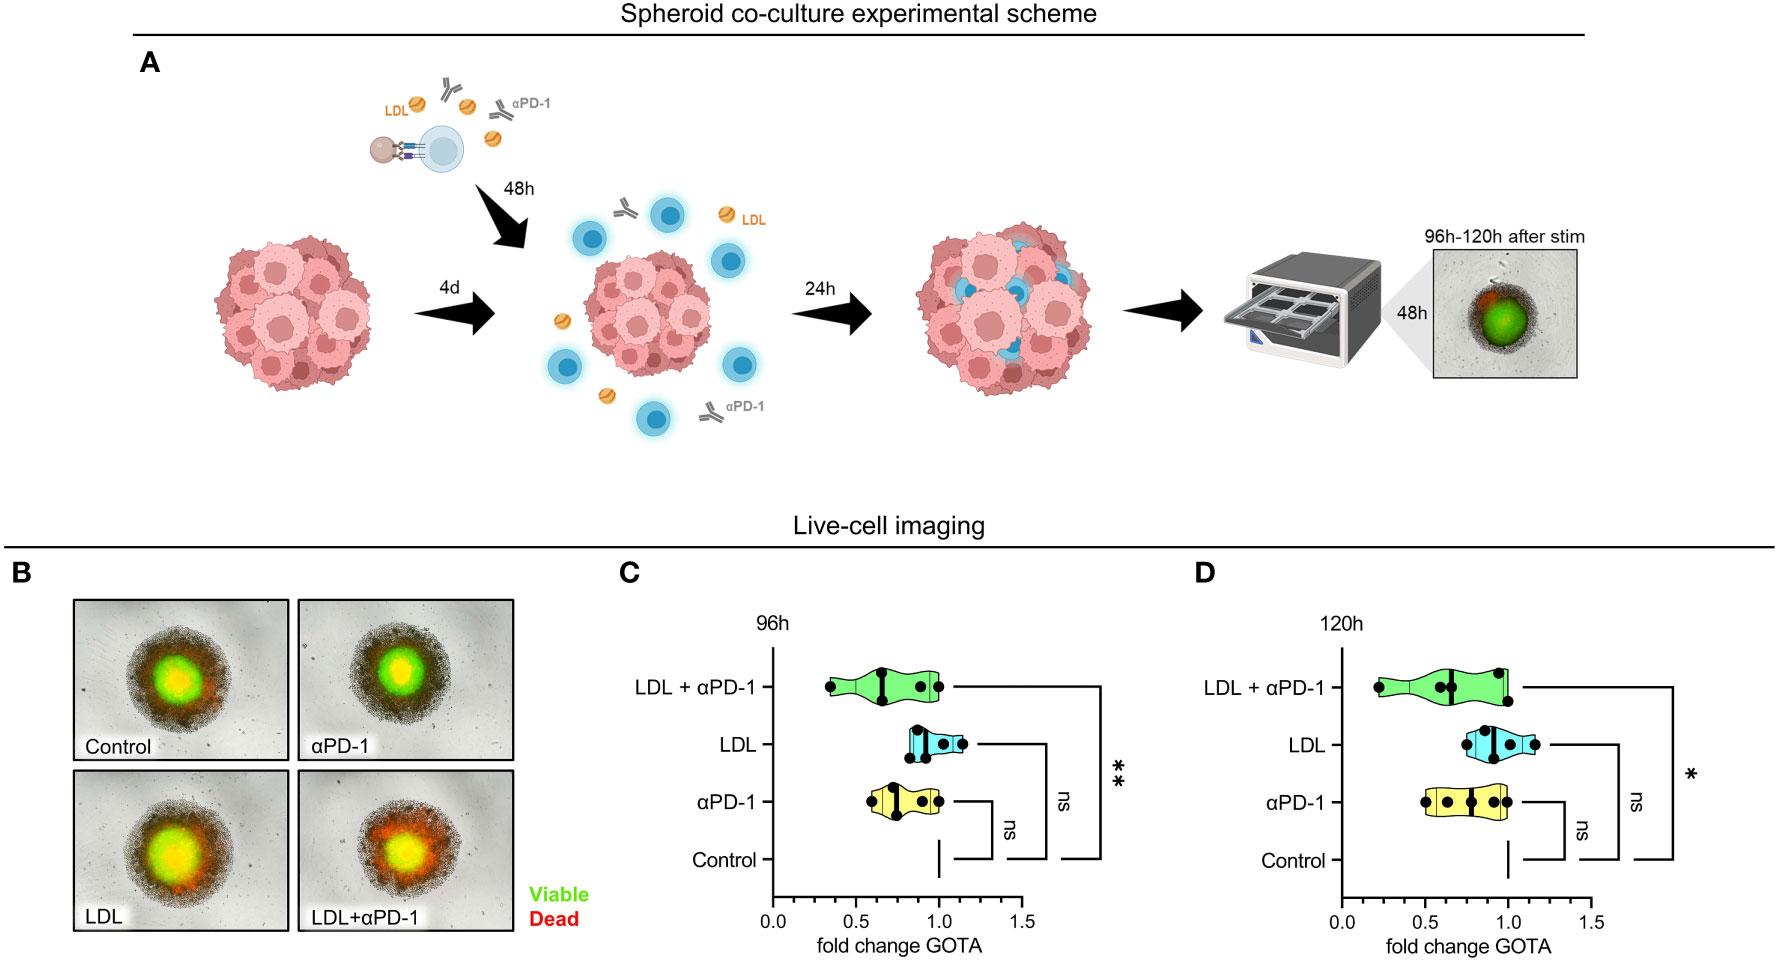
Figure 4 Referring to control, viable cells were significantly reduced in the HCT116 spheroid tumor model in the presence of LDLhigh in combination with an anti-PD-1 antibody. Tumor spheroids were generated for 4 days with HCT116 colon carcinoma cells. T cells were freshly isolated and stimulated with anti-CD3/CD28 beads, IL-2 and treated with anti-PD-1, LDLhigh or LDLhigh + anti-PD-1 versus medium control. After 48 h, T cells were added to the tumor spheroid and co-cultured for further 24 h. For Incucyte life cell imaging system, spheroids were washed, stained with a viability dye and fluorescence was then monitored under culture conditions for further 24 h – 48 h (cumulative T cell stimulation time 96 h – 120 h). (A) Spheroid co-culture experimental scheme. Created with BioRender.com. (B) Representative picture of spheroids after 24 h live cell imaging. Red = dead, green = viable. (C, D) Quantification of the green object total area (GOTA), which determines viable cells after 24 h (C) and 48 h live cell imaging (D). Depending on normal or non-normal distribution, RM one-way ANOVA with Geisser-Greenhouse correction and Dunnett`s multiple comparison test or Friedman test with Dunn`s multiple comparison test was performed. Significance was indicated as p < 0.05 *, p < 0.01 ** referring to control. ns, not significant.
We did not find any significant differences concerning viability subsequently to the sole addition of an anti-PD-1 antibody or LDLhigh in comparison to medium control. However, combination of LDL200µg/ml with an anti-PD-1 antibody induced a significant reduction of the normalized spheroid green object total area (GOTA, representing viable cells) compared to medium control after 24 h and 48 h (Figures 4C, D; n = 5).
4 Discussion
Recently, a debate has been launched on the impact of cholesterol in anti-PD-1 immunotherapy. As the tumor environment is mostly acidic, hypoxic, and glucose-deficient, lipids remain as an important source of energy for tumor cells and immune cells. However, lipid metabolism is exhibiting contradictory roles in tumor immune response and besides other lipids, cholesterol emerges as a double-edged sword in tumor immunity (66). In the context of cholesterol and immunotherapy, an association with response (3–6) to therapy versus treatment failure (7, 8) was delineated. Other authors interpreted the chain of causation differently and discussed chronic inflammation in first place, inducing T cell exhaustion, thus leading to cancer and hypercholesteremia as part of the metabolic syndrome, the latter again enhancing T cell exhaustion in the sense of a vicious circle (67).
So, being confronted with very paradox findings in complex environments, we aimed to straightforwardly investigate the effects of LDL on T cell subsets. We focused on LDL, since LDL emerged as the most significant serum lipid associated with response to immunotherapy in our and another preceding study (6, 33).
The LDL dosages for treatment referring to medium control were chosen based on LDL serum levels and their estimated tissue levels in responders (LDLhigh) and non-responders (LDLlow) to anti-PD-1 checkpoint therapy (6, 34). In-vitro, we observed the enhancement of a central memory phenotype, downregulation of IL-10 secretion and up-regulation of CD40L in the CD4+ T cell subset. A balanced metabolism, indicated by lowered ROS levels, a preserved glycolytic flux, and a less exhausted phenotype under T cell activation were acknowledged in both T cell subsets, however a significant downregulation of the fraction of both, PD-1 and LAG-3 after 96 h, was only observed in the CD4+ subset. All potentially beneficial effects were merely significant (or more pronounced) in presence of LDLhigh. T cell transfer into a colorectal cancer HCT116 spheroid model revealed a significant reduction of the spheroid viability in presence of LDLhigh plus anti-PD-1.
Zuzao et al. have shown that functioning CD4 immunity is essential for response to anti-PD-1 checkpoint therapy. Patients with a high proportion of CD4+ T cells with a central memory phenotype and a low PD-1/LAG-3 co-expression, were responsive to immunotherapy and moreover, a functional CD4 immunity supported the recovery of CD8 immunity, by, amongst others, secreting IFNg and priming dendritic cells via CD40L (59, 68). These findings have been confirmed by further studies, also considering tumor infiltrating TCM and TCM related genes (41–43). The phenotype described by Zuzao et al. is nearly identical to the effects we have seen, however under our conditions (presence of LDL and stimulation) the T cells were mostly positive for CD27 and CD28 as also described by Liu et al. (40). Furthermore, Zuzao et al. did not describe the expression of CCR7 or CD44.
Besides IL-7 and IL-21, IL-15 is one of the commonly known memory inducing cytokines. Interestingly, during CAR T cell development, addition of merely IL-15 enhanced similar beneficial effects, amongst others reduction of exhaustion, the preservation of a less differentiated memory cell phenotype and a superior anti-tumor response in-vivo (69). Analysis of memory inducing cytokines was negative in our experimental setting, however further investigation of the LDL induced signaling cascade might be expedient and moreover, the strongly impaired secretion of IL-10 may enable memory phenotype formation.
Moderate levels of ROS, generated from mitochondria and NADPH oxidases were shown to be crucial for T cell signaling, however excess amounts of ROS resulted in mutation and cell damage and were furthermore associated with T cell exhaustion and immunosuppression in the tumor milieu. Cellular anti-oxidants have been reported to be essential for maintaining anti-tumor immunity. TCM express higher anti-oxidant levels than TEM, enabling an enhanced control of tumor growth (70–72). In presence of LDLhigh we observed significantly reduced ROS levels, however maybe also due to the moderated oxygen consumption and presumably decreased oxidative phosphorylation (OXPHOS). A more resilient, less exhausted phenotype and cytotoxic capacity of T cells have been shown to be determined by balancing ROS (39).
However, observing further metabolic features of central memory induction, we were not able to detect a significantly enhanced mitochondrial mass or a lower mitochondrial membrane potential in the treated T cell populations, maybe due to incubation time or alternatively to culture conditions. Merely subtyping CD8+ T cells for a CM-like phenotype revealed a significantly reduced mitochondrial membrane potential after 96 h. Further research should be conducted, to define the spare respiratory capacity and the role of OXPHOS and fatty acid oxidation (FAO) in LDL treated T cells (37, 73). Nevertheless, the state of the LDLhigh treated T cells induced a superior anti-tumor effect in the HCT116 spheroid model.
Mechanisms, how CD4+ T cells can contribute to anti-tumor immunity have been described. Growth arrest of cancer cells can be achieved by inducing senescence through cytokines like IFNg. Furthermore, CD4+ T cells can induce direct cytotoxicity in MHC II expressing tumor cells (74). Similarly, CD40L can develop cytotoxic effects via CD40 (75). Cytotoxicity via CD40 could be an imaginable mechanism in this model, as HCT116 has been shown to express CD40 (76) and the CD4+ subset significantly up-regulated CD40L.
Upregulation of CD154 has already been acknowledged on platelets in hypercholesteremia (77). Familiar functions associated with CD154 are of anti-tumorigenic nature, ranging from stimulation of antigen presenting cells, activation of immune effector cells, favorable modulation of the tumor environment, enhancement of the immunogenicity of malignant cells, besides the already mentioned direct action against tumor cells by inducing their apoptosis. Furthermore, the CD40-CD40 ligand pathway plays a critical role during rescue of exhausted CD8 T cells (78). Stimulation of this pathway is under consideration for immunotherapy (79). However, as a ligand to newly identified integrins, CD154 may also play a role in cancer pathogenesis, which may be one of the reasons for paradox effects seen with high cholesterol levels in immunotherapy (80).
Furthermore, concerning the paradox effects of cholesterol in literature, LDL also induces potentially inhibitory markers on the T cell subsets and depending upon ligand or receptor expression in the tumor milieu they may have an immunosuppressive effect, or be of no consequence. A significant up-regulation of PD-L1 was identified on the CD4+ subset under the LDLlow condition, however also by trend in the presence of LDLhigh. As already mentioned, PD-L1 signaling on CD4+ memory cells by cross-linking was demonstrated to evoke highly suppressive cells (63), however the expression of PD-L1 on immune cells can on the other hand be predictive of response in some tumor entities (81). For instance, patients with a higher proportion of PD-L1+ T cells at baseline had an improved objective response to PD-1 inhibitor therapy in melanoma and lung cancer (82).
Also, TIGIT was up-regulated in both T cell subsets in the presence of LDLhigh by trend. Although the upregulation of TIGIT can exert immunosuppressive features in tumor immunity (83, 84), literature revealed TIGIT+ CD8+ subsets with cytotoxic properties (85).
5 Conclusions
In this study we showed that LDL skewed human CD4+ T cells into a memory phenotype, balanced T cell metabolism and reduced exhaustion marker expression in both subsets besides inducing the up-regulation of the co-stimulatory marker CD40L in the CD4+ subset. The changes resulted in an enhanced anti-tumor response in a HCT116 spheroid model under combination therapy with LDLhigh and an anti-PD-1 antibody.
Further research should be conducted to achieve more understanding regarding changes in T cell metabolism and cell signaling by LDL. Moreover, also the effect of LDL on other lymphocyte populations and myeloid cells needs to be unraveled, in order to sufficiently optimize immunotherapy and adoptive cell transfer. Finally, also the effect of HDL on T cell function and metabolism in immunotherapy has not been understood and needs to be investigated.
Institutional Review Board Statement
Buffy coats from healthy donors were obtained from the Department of Transfusion Medicine (University Hospital Regensburg) in form of remnants from routine platelet donations. The donations were approved by the Institutional Ethics Committee of the University of Regensburg (vote number 13-101-0240; 13-101-0238) and are in accordance with the Declaration of Helsinki.
Data availability statement
The original contributions presented in the study are included in the article/Supplementary Material. Further inquiries can be directed to the corresponding author.
Author contributions
Conceptualization: AS and MK. Formal analysis: AS, NB, JH, AM, RM, MR. Investigation: JH, NB, AS, CM, FV, PS, KR. Resources: MK, WH, PB. writing—original draft preparation: AS. writing—review and editing: all authors. All authors contributed to the article and approved the submitted version.
Acknowledgments
We thank all the members of the lab, especially Alice Peuker.
Conflict of interest
The authors declare that the research was conducted in the absence of any commercial or financial relationships that could be construed as a potential conflict of interest.
Publisher’s note
All claims expressed in this article are solely those of the authors and do not necessarily represent those of their affiliated organizations, or those of the publisher, the editors and the reviewers. Any product that may be evaluated in this article, or claim that may be made by its manufacturer, is not guaranteed or endorsed by the publisher.
Supplementary material
The Supplementary Material for this article can be found online at: https://www.frontiersin.org/articles/10.3389/fonc.2023.1107484/full#supplementary-material
Supplementary Data Sheet 1 | FACS gating MACS isolated CD4+ or CD8+ T cells
Supplementary Data Sheet 2 | Original Surface Marker Statistics (not corrected)
Supplementary Data Sheet 3 | Corrected Statistics Benjamini Hochberg
Supplementary Data Sheet 4 | T cell Data Points 48h
Supplementary Data Sheet 5 | T cell Data Points 96 h
Supplementary Data Sheet 6 | ELISA graphs, Perforin, Granzym B, PRESENS Statistics and Metabolic Statistics (not corrected)
Supplementary Data Sheet 7 | ELISA DATA
Supplementary Data Sheet 8 | PRESENS Data Points
Supplementary Data Sheet 9 | Original Viability and Proliferation Statistics (not corrected)
Supplementary Data Sheet 10 | Spheroid Statistics Green Object Total Area
Supplementary Video 1 | Incucyte Live Cell Imaging over 48 h.
References
1. Zang X. 2018 Nobel Prize in medicine awarded to cancer immunotherapy: Immune checkpoint blockade - a personal account. Genes Dis (2018) 5:302–3. doi: 10.1016/j.gendis.2018.10.003
2. Kambayashi Y, Fujimura T, Hidaka T, Aiba S. Biomarkers for predicting efficacies of anti-PD1 antibodies. Front Med (Lausanne) (2019) 6:174. doi: 10.3389/fmed.2019.00174
3. Perrone F, Minari R, Bersanelli M, Bordi P, Tiseo M, Favari E, et al. The prognostic role of high blood cholesterol in advanced cancer patients treated with immune checkpoint inhibitors. J Immunother (2020) 43:196–203. doi: 10.1097/CJI.0000000000000321
4. Tong J, Mao Y, Yang Z, Xu Q, Zheng Z, Zhang H, et al. Baseline serum cholesterol levels predict the response of patients with advanced non-small cell lung cancer to immune checkpoint inhibitor-based treatment. Cancer Manag Res (2021) 13:4041–53. doi: 10.2147/CMAR.S304022
5. Galli G, Corsetto P, Ferrara R, Prelaj A, Proto C, Signorelli D, et al. Impact of cholesterolemia and body mass index on outcome of metastatic non small cell lung cancer treated with immunotherapy. JCO (2019) 37:e20691–1. doi: 10.1200/JCO.2019.37.15_suppl.e20691
6. Hofbauer J, Hauck A, Matos C, Babl N, Decking S-M, Rechenmacher M, et al. Immunometabolic markers in a small patient cohort undergoing immunotherapy. Biomolecules (2022) 12(5):716. doi: 10.3390/biom12050716
7. Ma X, Bi E, Lu Y, Su P, Huang C, Liu L, et al. Cholesterol induces CD8+ T cell exhaustion in the tumor microenvironment. Cell Metab (2019) 30:143–156.e5. doi: 10.1016/j.cmet.2019.04.002
8. Khojandi N, Kuehm LM, Piening A, Donlin MJ, Hsueh EC, Schwartz TL, et al. Oxidized lipoproteins promote resistance to cancer immunotherapy independent of patient obesity. Cancer Immunol Res (2021) 9:214–26. doi: 10.1158/2326-6066.CIR-20-0358
9. Zwickl H, Hackner K, Köfeler H, Krzizek E-C, Muqaku B, Pils D, et al. Reduced LDL-cholesterol and reduced total cholesterol as potential indicators of early cancer in Male treatment-naïve cancer patients with pre-cachexia and cachexia. Front Oncol (2020) 10:1262. doi: 10.3389/fonc.2020.01262
10. Ittermann T, Dörr M, Markus MRP, Nauck M, Jürgens C, Schipf S, et al. Variability of biomarkers used for the classification of metabolic syndrome: A repeated measurements study. Nutr Metab Cardiovasc Dis (2022) 32:1693–702. doi: 10.1016/j.numecd.2022.03.022
11. Kool W. Cholesterol metabolism in T cells in health and disease. Utrecht University (2022). Available at: https://studenttheses.uu.nl/handle/20.500.12932/349.
12. Aguilar-Ballester M, Herrero-Cervera A, Vinué Á, Martínez-Hervás S, González-Navarro H. Impact of cholesterol metabolism in immune cell function and atherosclerosis. Nutrients (2020) 12(7):2021. doi: 10.3390/nu12072021
13. Gamba P, Testa G, Sottero B, Gargiulo S, Poli G, Leonarduzzi G. The link between altered cholesterol metabolism and alzheimer's disease. Ann New York Acad Sci (2012) 1259:54–64. doi: 10.1111/j.1749-6632.2012.06513.x
14. Luo J, Yang H, Song B-L. Mechanisms and regulation of cholesterol homeostasis. Nat Rev Mol Cell Biol (2020) 21:225–45. doi: 10.1038/s41580-019-0190-7
15. Ryu H, Kim J, Kim D, Lee J-E, Chung Y. Cellular and molecular links between autoimmunity and lipid metabolism. Molecules Cells (2019) 42:747–54. doi: 10.14348/molcells.2019.0196
16. Saigusa R, Winkels H, Ley K. T Cell subsets and functions in atherosclerosis. Nat Rev Cardiol (2020) 17:387–401. doi: 10.1038/s41569-020-0352-5
17. Perucha E, Melchiotti R, Bibby JA, Wu W, Frederiksen KS, Roberts CA, et al. The cholesterol biosynthesis pathway regulates IL-10 expression in human Th1 cells. Nat Commun (2019) 10:498. doi: 10.1038/s41467-019-08332-9
18. Swamy M, Beck-Garcia K, Beck-Garcia E, Hartl FA, Morath A, Yousefi OS, et al. A cholesterol-based allostery model of T cell receptor phosphorylation. Immunity (2016) 44:1091–101. doi: 10.1016/j.immuni.2016.04.011
19. Cheng H-Y, Wu R, Gebre AK, Hanna RN, Smith DJ, Parks JS, et al. Increased cholesterol content in gammadelta (γδ) T lymphocytes differentially regulates their activation. PloS One (2013) 8:e63746. doi: 10.1371/journal.pone.0063746
20. Molnár E, Swamy M, Holzer M, Beck-García K, Worch R, Thiele C, et al. Cholesterol and sphingomyelin drive ligand-independent T-cell antigen receptor nanoclustering. J Biol Chem (2012) 287:42664–74. doi: 10.1074/jbc.M112.386045
21. Bietz A, Zhu H, Xue M, Xu C. Cholesterol metabolism in T cells. Front Immunol (2017) 8:1664. doi: 10.3389/fimmu.2017.01664
22. Bovenga F, Sabbà C, Moschetta A. Uncoupling nuclear receptor LXR and cholesterol metabolism in cancer. Cell Metab (2015) 21:517–26. doi: 10.1016/j.cmet.2015.03.002
23. Cai Z, Ishibashi T, Kozai M, Mita H, Wang S, Takada K, et al. ROR agonist hampers the proliferation and survival of postactivated CD8+ T cells through the downregulation of cholesterol synthesis-related genes. Immunol Cell Biol (2021) 99:288–98. doi: 10.1111/imcb.12406
24. Li M, Yang Y, Wei J, Cun X, Lu Z, Qiu Y, et al. Enhanced chemo-immunotherapy against melanoma by inhibition of cholesterol esterification in CD8+ T cells. Nanomedicine (2018) 14:2541–50. doi: 10.1016/j.nano.2018.08.008
25. Hu X, Wang Y, Hao L-Y, Liu X, Lesch CA, Sanchez BM, et al. Sterol metabolism controls T(H)17 differentiation by generating endogenous RORγ agonists. Nat Chem Biol (2015) 11:141–7. doi: 10.1038/nchembio.1714
26. Surls J, Nazarov-Stoica C, Kehl M, Olsen C, Casares S, Brumeanu T-D. Increased membrane cholesterol in lymphocytes diverts T-cells toward an inflammatory response. PloS One (2012) 7:e38733. doi: 10.1371/journal.pone.0038733
27. Yang W, Bai Y, Xiong Y, Zhang J, Chen S, Zheng X, et al. Potentiating the antitumour response of CD8(+) T cells by modulating cholesterol metabolism. Nature (2016) 531:651–5. doi: 10.1038/nature17412
28. Dunn SE, Youssef S, Goldstein MJ, Prod'homme T, Weber MS, Zamvil SS, et al. Isoprenoids determine Th1/Th2 fate in pathogenic T cells, providing a mechanism of modulation of autoimmunity by atorvastatin. J Exp Med (2006) 203:401–12. doi: 10.1084/jem.20051129
29. Cheng H-Y, Gaddis DE, Wu R, McSkimming C, Haynes LD, Taylor AM, et al. Loss of ABCG1 influences regulatory T cell differentiation and atherosclerosis. J Clin Invest (2016) 126:3236–46. doi: 10.1172/JCI83136
30. Timilshina M, You Z, Lacher SM, Acharya S, Jiang L, Kang Y, et al. Activation of mevalonate pathway via LKB1 is essential for stability of treg cells. Cell Rep (2019) 27:2948–2961.e7. doi: 10.1016/j.celrep.2019.05.020
31. Kidani Y, Elsaesser H, Hock MB, Vergnes L, Williams KJ, Argus JP, et al. Sterol regulatory element-binding proteins are essential for the metabolic programming of effector T cells and adaptive immunity. Nat Immunol (2013) 14:489–99. doi: 10.1038/ni.2570
32. Zhao Q, Duck LW, Huang F, Alexander KL, Maynard CL, Mannon PJ, et al. CD4+ T cell activation and concomitant mTOR metabolic inhibition can ablate microbiota-specific memory cells and prevent colitis. Sci Immunol (2020) 5(54):eabc6373. doi: 10.1126/sciimmunol.abc6373
33. Karayama M, Inui N, Inoue Y, Yoshimura K, Mori K, Hozumi H, et al. Increased serum cholesterol and long-chain fatty acid levels are associated with the efficacy of nivolumab in patients with non-small cell lung cancer. Cancer Immunol Immunother (2022) 71:203–17. doi: 10.1007/s00262-021-02979-4
34. Caspar-Bauguil S, Saadawi M, Negre-Salvayre A, Thomsen M, Salvayre R, Benoist H. Mildly oxidized low-density lipoproteins suppress the proliferation of activated CD4+ T-lymphocytes and their interleukin 2 receptor expression in vitro. Biochem J (1998) 330(Pt 2):659–66. doi: 10.1042/bj3300659
35. Vilar E, Scaltriti M, Saura C, Guzman M, Macarulla T, Arribas J, et al. Microsatellite instability (MSI) due to mutation or epigenetic silencing is associated with increased cytotoxicity to irinotecan (CPT-11) in human colorectal cancer (CRC) cell lines. JCO (2007) 25:10527. doi: 10.1200/jco.2007.25.18_suppl.10527
36. Andreesen R, Scheibenbogen C, Brugger W, Krause S, Meerpohl HG, Leser HG, et al. Adoptive transfer of tumor cytotoxic macrophages generated in vitro from circulating blood monocytes: A new approach to cancer immunotherapy. Cancer Res (1990) 50:7450–6.
37. Kishton RJ, Sukumar M, Restifo NP. Metabolic regulation of T cell longevity and function in tumor immunotherapy. Cell Metab (2017) 26:94–109. doi: 10.1016/j.cmet.2017.06.016
38. Sukumar M, Kishton RJ, Restifo NP. Metabolic reprograming of anti-tumor immunity. Curr Opin Immunol (2017) 46:14–22. doi: 10.1016/j.coi.2017.03.011
39. Gicobi JK, Mao Z, DeFranco G, Li Y, Liu X, Hirdler JB, et al. Resilient CD8 + T cells maintain a high cytotoxic capacity by balancing ROS via ME1 upregulation. bioRxiv (2022) 2022:11.25.517988. doi: 10.1101/2022.11.25.517988
40. Liu Q, Sun Z, Chen L. Memory T cells: strategies for optimizing tumor immunotherapy. Protein Cell (2020) 11:549–64. doi: 10.1007/s13238-020-00707-9
41. Spassova I, Ugurel S, Terheyden P, Sucker A, Hassel JC, Ritter C, et al. Predominance of central memory T cells with high T-cell receptor repertoire diversity is associated with response to PD-1/PD-L1 inhibition in merkel cell carcinoma. Clin Cancer Res (2020) 26:2257–67. doi: 10.1158/1078-0432.CCR-19-2244
42. Wu J, Zhang T, Xiong H, Zeng L, Wang Z, Peng Y, et al. Tumor-infiltrating CD4+ central memory T cells correlated with favorable prognosis in oral squamous cell carcinoma. J Inflamm Res (2022) 15:141–52. doi: 10.2147/JIR.S343432
43. Ning Z-K, Hu C-G, Huang C, Liu J, Zhou T-C, Zong Z. Molecular subtypes and CD4+ memory T cell-based signature associated with clinical outcomes in gastric cancer. Front Oncol (2020) 10:626912. doi: 10.3389/fonc.2020.626912
44. Unsoeld H, Pircher H. Complex memory T-cell phenotypes revealed by coexpression of CD62L and CCR7. J Virol (2005) 79:4510–3. doi: 10.1128/JVI.79.7.4510-4513.2005
45. Yang S, Liu F, Wang QJ, Rosenberg SA, Morgan RA. The shedding of CD62L (L-selectin) regulates the acquisition of lytic activity in human tumor reactive T lymphocytes. PloS One (2011) 6:e22560. doi: 10.1371/journal.pone.0022560
46. Baaten BJG, Li C-R, Deiro MF, Lin MM, Linton PJ, Bradley LM. CD44 regulates survival and memory development in Th1 cells. Immunity (2010) 32:104–15. doi: 10.1016/j.immuni.2009.10.011
47. Loschinski R, Böttcher M, Stoll A, Bruns H, Mackensen A, Mougiakakos D. IL-21 modulates memory and exhaustion phenotype of T-cells in a fatty acid oxidation-dependent manner. Oncotarget (2018) 9:13125–38. doi: 10.18632/oncotarget.24442
48. Yuan Y, Yang Y, Huang X. IL-21 is required for CD4 memory formation in response to viral infection. JCI Insight (2017) 2:e90652. doi: 10.1172/jci.insight.90652
49. Read KA, Powell MD, McDonald PW, Oestreich KJ. IL-2, IL-7, and IL-15: Multistage regulators of CD4(+) T helper cell differentiation. Exp Hematol (2016) 44:799–808. doi: 10.1016/j.exphem.2016.06.003
50. Buffière A, Uzan B, Aucagne R, Hermetet F, Mas M, Nassurdine S, et al. T-Cell acute lymphoblastic leukemia displays autocrine production of interleukin-7. Oncogene (2019) 38:7357–65. doi: 10.1038/s41388-019-0921-4
51. Miranda-Carús M-E, Benito-Miguel M, Llamas MA, Balsa A, Martín-Mola E. Human T cells constitutively express IL-15 that promotes ex vivo T cell homeostatic proliferation through autocrine/juxtacrine loops. J Immunol (2005) 175:3656–62. doi: 10.4049/jimmunol.175.6.3656
52. Brooks DG, Walsh KB, Elsaesser H, Oldstone MBA. IL-10 directly suppresses CD4 but not CD8 T cell effector and memory responses following acute viral infection. Proc Natl Acad Sci USA (2010) 107:3018–23. doi: 10.1073/pnas.0914500107
53. Tian Y, Mollo SB, Harrington LE, Zajac AJ. IL-10 regulates memory T cell development and the balance between Th1 and follicular Th cell responses during an acute viral infection. J Immunol (2016) 197:1308–21. doi: 10.4049/jimmunol.1502481
54. Sukumar M, Liu J, Mehta GU, Patel SJ, Roychoudhuri R, Crompton JG, et al. Mitochondrial membrane potential identifies cells with enhanced stemness for cellular therapy. Cell Metab (2016) 23:63–76. doi: 10.1016/j.cmet.2015.11.002
55. Dong Y, Li X, Zhang L, Zhu Q, Chen C, Bao J, et al. CD4+ T cell exhaustion revealed by high PD-1 and LAG-3 expression and the loss of helper T cell function in chronic hepatitis b. BMC Immunol (2019) 20:27. doi: 10.1186/s12865-019-0309-9
56. Ma J, Zheng B, Goswami S, Meng L, Zhang D, Cao C, et al. PD1Hi CD8+ T cells correlate with exhausted signature and poor clinical outcome in hepatocellular carcinoma. J Immunother Cancer (2019) 7:331. doi: 10.1186/s40425-019-0814-7
57. Yang Z-Z, Kim HJ, Villasboas JC, Chen Y-P, Price-Troska T, Jalali S, et al. Expression of LAG-3 defines exhaustion of intratumoral PD-1+ T cells and correlates with poor outcome in follicular lymphoma. Oncotarget (2017) 8:61425–39. doi: 10.18632/oncotarget.18251
58. Niu B, Zhou F, Su Y, Wang L, Xu Y, Yi Z, et al. Different expression characteristics of LAG3 and PD-1 in sepsis and their synergistic effect on T cell exhaustion: A new strategy for immune checkpoint blockade. Front Immunol (2019) 10:1888. doi: 10.3389/fimmu.2019.01888
59. Zuazo M, Arasanz H, Bocanegra A, Fernandez G, Chocarro L, Vera R, et al. Systemic CD4 immunity as a key contributor to PD-L1/PD-1 blockade immunotherapy efficacy. Front Immunol (2020) 11:586907. doi: 10.3389/fimmu.2020.586907
60. Ngiow SF, Young A, Jacquelot N, Yamazaki T, Enot D, Zitvogel L, et al. A threshold level of intratumor CD8+ T-cell PD1 expression dictates therapeutic response to anti-PD1. Cancer Res (2015) 75:3800–11. doi: 10.1158/0008-5472.CAN-15-1082
61. Shi A-P, Tang X-Y, Xiong Y-L, Zheng K-F, Liu Y-J, Shi X-G, et al. Immune checkpoint LAG3 and its ligand FGL1 in cancer. Front Immunol (2021) 12:785091. doi: 10.3389/fimmu.2021.785091
62. Vetsika KE, Aggouraki D, Lyristi Z, Koinis F, Georgoulias V, Kotsakis A. Prognostic value of PD-L1 + CD4 + T cells in non-small cell lung cancer (NSCLC) patients treated with a PD-1 inhibitor. JCO (2017) 35:58. doi: 10.1200/JCO.2017.35.7_suppl.58
63. Fanelli G, Romano M, Nova-Lamperti E, Werner Sunderland M, Nerviani A, Scottà C, et al. PD-L1 signaling on human memory CD4+ T cells induces a regulatory phenotype. PloS Biol (2021) 19:e3001199. doi: 10.1371/journal.pbio.3001199
64. Yan C, Richmond A. Hiding in the dark: pan-cancer characterization of expression and clinical relevance of CD40 to immune checkpoint blockade therapy. Mol Cancer (2021) 20:146. doi: 10.1186/s12943-021-01442-3
65. Singh M, Vianden C, Cantwell MJ, Dai Z, Xiao Z, Sharma M, et al. Intratumoral CD40 activation and checkpoint blockade induces T cell-mediated eradication of melanoma in the brain. Nat Commun (2017) 8:1447. doi: 10.1038/s41467-017-01572-7
66. Yu W, Lei Q, Yang L, Qin G, Liu S, Wang D, et al. Contradictory roles of lipid metabolism in immune response within the tumor microenvironment. J Hematol Oncol (2021) 14:187. doi: 10.1186/s13045-021-01200-4
67. Bersanelli M, Cortellini A, Buti S. The interplay between cholesterol (and other metabolic conditions) and immune-checkpoint immunotherapy: shifting the concept from the "inflamed tumor" to the "inflamed patient". Hum Vaccin Immunother (2021) 17:1930–4. doi: 10.1080/21645515.2020.1852872
68. Zuazo M, Arasanz H, Fernández-Hinojal G, García-Granda MJ, Gato M, Bocanegra A, et al. Functional systemic CD4 immunity is required for clinical responses to PD-L1/PD-1 blockade therapy. EMBO Mol Med (2019) 11:e10293. doi: 10.15252/emmm.201910293
69. Alizadeh D, Wong RA, Yang X, Wang D, Pecoraro JR, Kuo C-F, et al. IL15 enhances CAR-T cell antitumor activity by reducing mTORC1 activity and preserving their stem cell memory phenotype. Cancer Immunol Res (2019) 7:759–72. doi: 10.1158/2326-6066.CIR-18-0466
70. Yarosz EL, Chang C-H. The role of reactive oxygen species in regulating T cell-mediated immunity and disease. Immune Netw (2018) 18:e14. doi: 10.4110/in.2018.18.e14
71. Scharping NE, Rivadeneira DB, Menk AV, Vignali PDA, Ford BR, Rittenhouse NL, et al. Mitochondrial stress induced by continuous stimulation under hypoxia rapidly drives T cell exhaustion. Nat Immunol (2021) 22:205–15. doi: 10.1038/s41590-020-00834-9
72. Peng H-Y, Lucavs J, Ballard D, Das JK, Kumar A, Wang L, et al. Metabolic reprogramming and reactive oxygen species in T cell immunity. Front Immunol (2021) 12:652687. doi: 10.3389/fimmu.2021.652687
73. O'Sullivan D. The metabolic spectrum of memory T cells. Immunol Cell Biol (2019) 97:636–46. doi: 10.1111/imcb.12274
74. Poncette L, Bluhm J, Blankenstein T. The role of CD4 T cells in rejection of solid tumors. Curr Opin Immunol (2022) 74:18–24. doi: 10.1016/j.coi.2021.09.005
75. Elmetwali T, Searle PF, McNeish I, Young LS, Palmer DH. CD40 ligand induced cytotoxicity in carcinoma cells is enhanced by inhibition of metalloproteinase cleavage and delivery via a conditionally-replicating adenovirus. Mol Cancer (2010) 9:52. doi: 10.1186/1476-4598-9-52
76. Ibraheem K, Yhmed AMA, Qayyum T, Bryan NP, Georgopoulos NT. CD40 induces renal cell carcinoma-specific differential regulation of TRAF proteins, ASK1 activation and JNK/p38-mediated, ROS-dependent mitochondrial apoptosis. Cell Death Discov (2019) 5:148. doi: 10.1038/s41420-019-0229-8
77. Garlichs CD, John S, Schmeisser A, Eskafi S, Stumpf C, Karl M, et al. Upregulation of CD40 and CD40 ligand (CD154) in patients with moderate hypercholesterolemia. Circulation (2001) 104:2395–400. doi: 10.1161/hc4501.099312
78. Bhadra R, Gigley JP, Khan IA. Cutting edge: CD40-CD40 ligand pathway plays a critical CD8-intrinsic and -extrinsic role during rescue of exhausted CD8 T cells. J Immunol (2011) 187:4421–5. doi: 10.4049/jimmunol.1102319
79. Li D-K, Wang W. Characteristics and clinical trial results of agonistic anti-CD40 antibodies in the treatment of malignancies. Oncol Lett (2020) 20:176. doi: 10.3892/ol.2020.12037
80. Hassan GS, Stagg J, Mourad W. Role of CD154 in cancer pathogenesis and immunotherapy. Cancer Treat Rev (2015) 41:431–40. doi: 10.1016/j.ctrv.2015.03.007
81. Davis AA, Patel VG. The role of PD-L1 expression as a predictive biomarker: an analysis of all US food and drug administration (FDA) approvals of immune checkpoint inhibitors. J Immunother Cancer (2019) 7:278. doi: 10.1186/s40425-019-0768-9
82. Dart SJ, Cook AM, Millward MJ, McDonnell AM, Chin WL, Hakeem MU, et al. Changes in expression of PD-L1 on peripheral T cells in patients with melanoma and lung cancer treated with PD-1 inhibitors. Sci Rep (2021) 11:15312. doi: 10.1038/s41598-021-93479-z
83. Zhang C, Wang Y, Xun X, Wang S, Xiang X, Hu S, et al. TIGIT can exert immunosuppressive effects on CD8+ T cells by the CD155/TIGIT signaling pathway for hepatocellular carcinoma in vitro. J Immunother (2020) 43:236–43. doi: 10.1097/CJI.0000000000000330
84. Liu Z, Zhou Q, Wang Z, Zhang H, Zeng H, Huang Q, et al. Intratumoral TIGIT+ CD8+ T-cell infiltration determines poor prognosis and immune evasion in patients with muscle-invasive bladder cancer. J Immunother Cancer (2020) 8:e000978. doi: 10.1136/jitc-2020-000978
Keywords: cholesterol, LDL (low-density lipoprotein), immunotherapy, PD-1, reactive oxygen species, CD154 (CD40L), central memory (T) CM, spheroid model
Citation: Babl N, Hofbauer J, Matos C, Voll F, Menevse AN, Rechenmacher M, Mair R, Beckhove P, Herr W, Siska PJ, Renner K, Kreutz M and Schnell A (2023) Low-density lipoprotein balances T cell metabolism and enhances response to anti-PD-1 blockade in a HCT116 spheroid model. Front. Oncol. 13:1107484. doi: 10.3389/fonc.2023.1107484
Received: 25 November 2022; Accepted: 10 January 2023;
Published: 27 January 2023.
Edited by:
Jacques Pouyssegur, Université Côte d’Azur, FranceReviewed by:
Muhammad Khan, Guangzhou Medical University Cancer Hospital, ChinaTrupti Vardam-Kaur, Omeros Corporation, United States
Copyright © 2023 Babl, Hofbauer, Matos, Voll, Menevse, Rechenmacher, Mair, Beckhove, Herr, Siska, Renner, Kreutz and Schnell. This is an open-access article distributed under the terms of the Creative Commons Attribution License (CC BY). The use, distribution or reproduction in other forums is permitted, provided the original author(s) and the copyright owner(s) are credited and that the original publication in this journal is cited, in accordance with accepted academic practice. No use, distribution or reproduction is permitted which does not comply with these terms.
*Correspondence: Annette Schnell, YW5uZXR0ZS5zY2huZWxsQHVrci5kZQ==
†These authors have contributed equally to this work and share first authorship