
95% of researchers rate our articles as excellent or good
Learn more about the work of our research integrity team to safeguard the quality of each article we publish.
Find out more
ORIGINAL RESEARCH article
Front. Oncol. , 20 February 2023
Sec. Cancer Imaging and Image-directed Interventions
Volume 13 - 2023 | https://doi.org/10.3389/fonc.2023.1082564
This article is part of the Research Topic A New Perspective of Imaging Diagnosis of Prostate Cancer View all 5 articles
 Caterina Gaudiano1*
 Lorenzo Braccischi1*
 Makoto Taninokuchi Tomassoni1
 Alexandro Paccapelo1
 Lorenzo Bianchi2,3
 Beniamino Corcioni1Federica Ciccarese1Riccardo Schiavina2,3
 Matteo Droghetti2,3Francesca Giunchi4
 Michelangelo Fiorentino5
 Eugenio Brunocilla2,3Rita Golfieri1
Background: To evaluate multiparametric magnetic resonance imaging (mpMRI) parameters, such as TransPA (transverse prostate maximum sectional area), TransCGA (transverse central gland sectional area), TransPZA (transverse peripheral zone sectional area), and TransPAI (TransPZA/TransCGA ratio) in predicting prostate cancer (PCa) in prostate imaging reporting and data system (PI-RADS) 3 lesions.
Methods: Sensitivity, specificity, positive predictive value (PPV) and negative predictive value (NPV), the area under the receiver operating characteristic curve (AUC), and the best cut-off, were calculated. Univariate and multivariate analyses were carried out to evaluate the capability to predict PCa.
Results: Out of 120 PI-RADS 3 lesions, 54 (45.0%) were PCa with 34 (28.3%) csPCas. Median TransPA, TransCGA, TransPZA and TransPAI were 15.4cm2, 9.1cm2, 5.5cm2 and 0.57, respectively. At multivariate analysis, location in the transition zone (OR=7.92, 95% CI: 2.70-23.29, P<0.001) and TransPA (OR=0.83, 95% CI: 0.76-0.92, P<0.001) were independent predictors of PCa. The TransPA (OR=0.90, 95% CI: 0.082-0.99, P=0.022) was an independent predictor of csPCa. The best cut-off of TransPA for csPCa was 18 (Sensitivity 88.2%, Specificity 37.2%, PPV 35.7%, NPV 88.9%). The discrimination (AUC) of the multivariate model was 0.627 (95% CI: 0.519-0.734, P<0.031).
Conclusions: In PI-RADS 3 lesions, the TransPA could be useful in selecting patients requiring biopsy.
Proper management of patients with Prostate Imaging-Reporting and Data System (PI-RADS) 3 lesions on multiparametric Magnetic Resonance Imaging (mpMRI) represents one of the main unresolved problems in diagnosing prostate cancer (PCa).
The prevalence of PCa in PI-RADS category 3 lesions is highly variable, ranging from 7-15% (1, 2) to 25-46% (2) with a proportion of clinically significant PCa (csPCa) varying from 2 to 38%; this is the main factor limiting the choice between immediate biopsy and follow-up in this type of lesion.
In fact, the European Association of Urology (EAU) guidelines strongly suggest that patients having a PI-RADS score of 3 should undergo biopsy when the prostate-specific antigen (PSA) density is > 0.15 ng/ml/ml (3). The European Society of the Urogenital Radiology (ESUR) guidelines, together with PI-RADS version 2.1, suggest a more conservative approach for patients with a PI-RADS score of 3; these patients may undergo biopsy only if deemed appropriate according to clinical data and risk stratification (4). The aims of these approaches are to increase the detection rate of csPCas and, at the same time, to reduce the number of unnecessary biopsies and the exposure of patients with non-significant PCa to severe biopsy-related complications.
Recent studies (5–8) have demonstrated the effectiveness of using the mpMRI as a screening test before the first biopsy; however, some important issues should be defined, such as the correct selection of patients to undergo mpMRI or patients to undergo biopsy after performing an mpMRI. In particular, it is necessary to identify the most useful clinical data to make this selection and standardise their use in clinical practice.
Risk calculators have been introduced for this purpose; these are multivariable-based tools for the prediction of individual PCas and csPCa risk, based on population-based big data after histological verification which can suggest the need for biopsy. The risk calculators with the highest csPCa prediction are the European Randomized Study of Screening for Prostate Cancer (ERSPC) risk calculator, which was created from a European patient population, and the Prostate Cancer Prevention Trial (PCPT) risk calculator, which was created from a North American study, with the ERSPC risk calculator seemingly having greater PCa prediction capability (9, 10).
A recent study by Jiang S et al. (11) investigated new tools for predicting PCa in a cohort of patients who underwent mpMRI and biopsy, such as maximum sectional areas on transverse, coronal and sagittal T2-weighted (T2w) images of the entire prostate, and the peripheral and transition zones (PZ and TZ), separately. They found that prostate maximum sectional area (PA) is a good prostatic imaging parameter for predicting PCa, and the transverse sectional area of the central gland is significantly smaller in patients with PCa (p < 0.001) and has the greatest significant area under the receiver operating characteristic curve (AUC) (0.801) of all the predictors. The PA is manually segmented on the T2w scan and is related to prostate volume; however, it does not suffer from the limits of calculating the approximated prostate volume which is affected by the geometric distortion of the gland. Probably for this reason, the Authors demonstrated an outperformance of sectional areas compared to prostate volume and PSA density.
Starting from this experience, the aim of the present study was to evaluate the ability of new tools, such as TransPA (transverse prostate maximum sectional area), TransCGA (transverse central gland sectional area), TransPZA (transverse peripheral zone sectional area), and TransPAI (transverse prostate area index, i.e. TransPZA/TransCGA ratio) in predicting overall PCa and csPCa in a population of patients with PI-RADS 3 lesions at fusion-targeted biopsy (fusion-TB).
This study was an observational, retrospective, single centre study; it was approved by our local Institutional Review Board (IRB), which waived the need for informed consent, and conducted in accordance with institutional guidelines, including the Declaration of Helsinki (Ethics Committee code: 784/2021/Oss/AOUBo).
One hundred forty patients with at least one PI-RADS 3 lesion, according to the ESUR guidelines version 2.1 at mpMRI performed at our Radiology Unit from September 2019 to December 2021 were enrolled.
The inclusion criteria were the following: 1) having undergone fusion-TB of the index lesion at our Radiology Unit and 2) having a histopathological report from a dedicated pathologist of the Pathology Unit of our institution.
The exclusion criteria were the following: 1) no concomitant PI-RADS 4 or 5 lesions; 2) mpMRI protocol not completely adhering to the suggested imaging protocols described in PI-RADS version 2.1; 3) active surveillance and previous surgical treatment, such as open simple prostatectomy (OP) or transurethral resection of the prostate (TURP); 4) the presence of severe artifacts, not allowing the evaluation of one or more sequences of the mpMRI due to uni/bilateral hip prostheses or other causes.
After application of the exclusion criteria, 120 patients were included in the final analysis (Figure 1).

Figure 1 Flowchart for patient selection. PI-RADSv2.1, Prostate Imaging Reporting and Data System version 2.1; mpMRI, multiparametric Magnetic Resonance Imaging; OP, open simple prostatectomy; TURP, transurethral resection of the prostate.
For each patient enrolled, clinical data, such as PSA, prostate volume, and PSA density, were collected.
The mpMRI examinations were carried out using a 1.5T scanner (Signa HDxt; GE Healthcare, USA) and a pelvic phased-array surface coil combined with a disposable endorectal coil.
The multiparametric study of the prostate gland and seminal vesicles included Fast Relaxation Fast Spin Echo (FR-FSE) T2w, DWI (Diffusion Weighted Imaging) and Dynamic Contrast-Enhanced (DCE) sequences; the scan parameters have already been described in a previous study (9).
The DWI and DCE images were processed on an independent workstation with dedicated software (Functool, 4.5.5, GE Healthcare, USA) in order to obtain the ADC (Apparent Diffusion Coefficient) map and signal intensity-time (I-T) curve, respectively.
All the PI-RADS 3 lesions were catalogued according to location (peripheral or transition zone) and maximum diameter.
Subsequently, the following parameters were measured on axial FR-FSE T2w sequences as previously described (11): 1) TransPA, 2) TransCGA, 3) TransPZA, and 4) TransPAI (Figure 2).
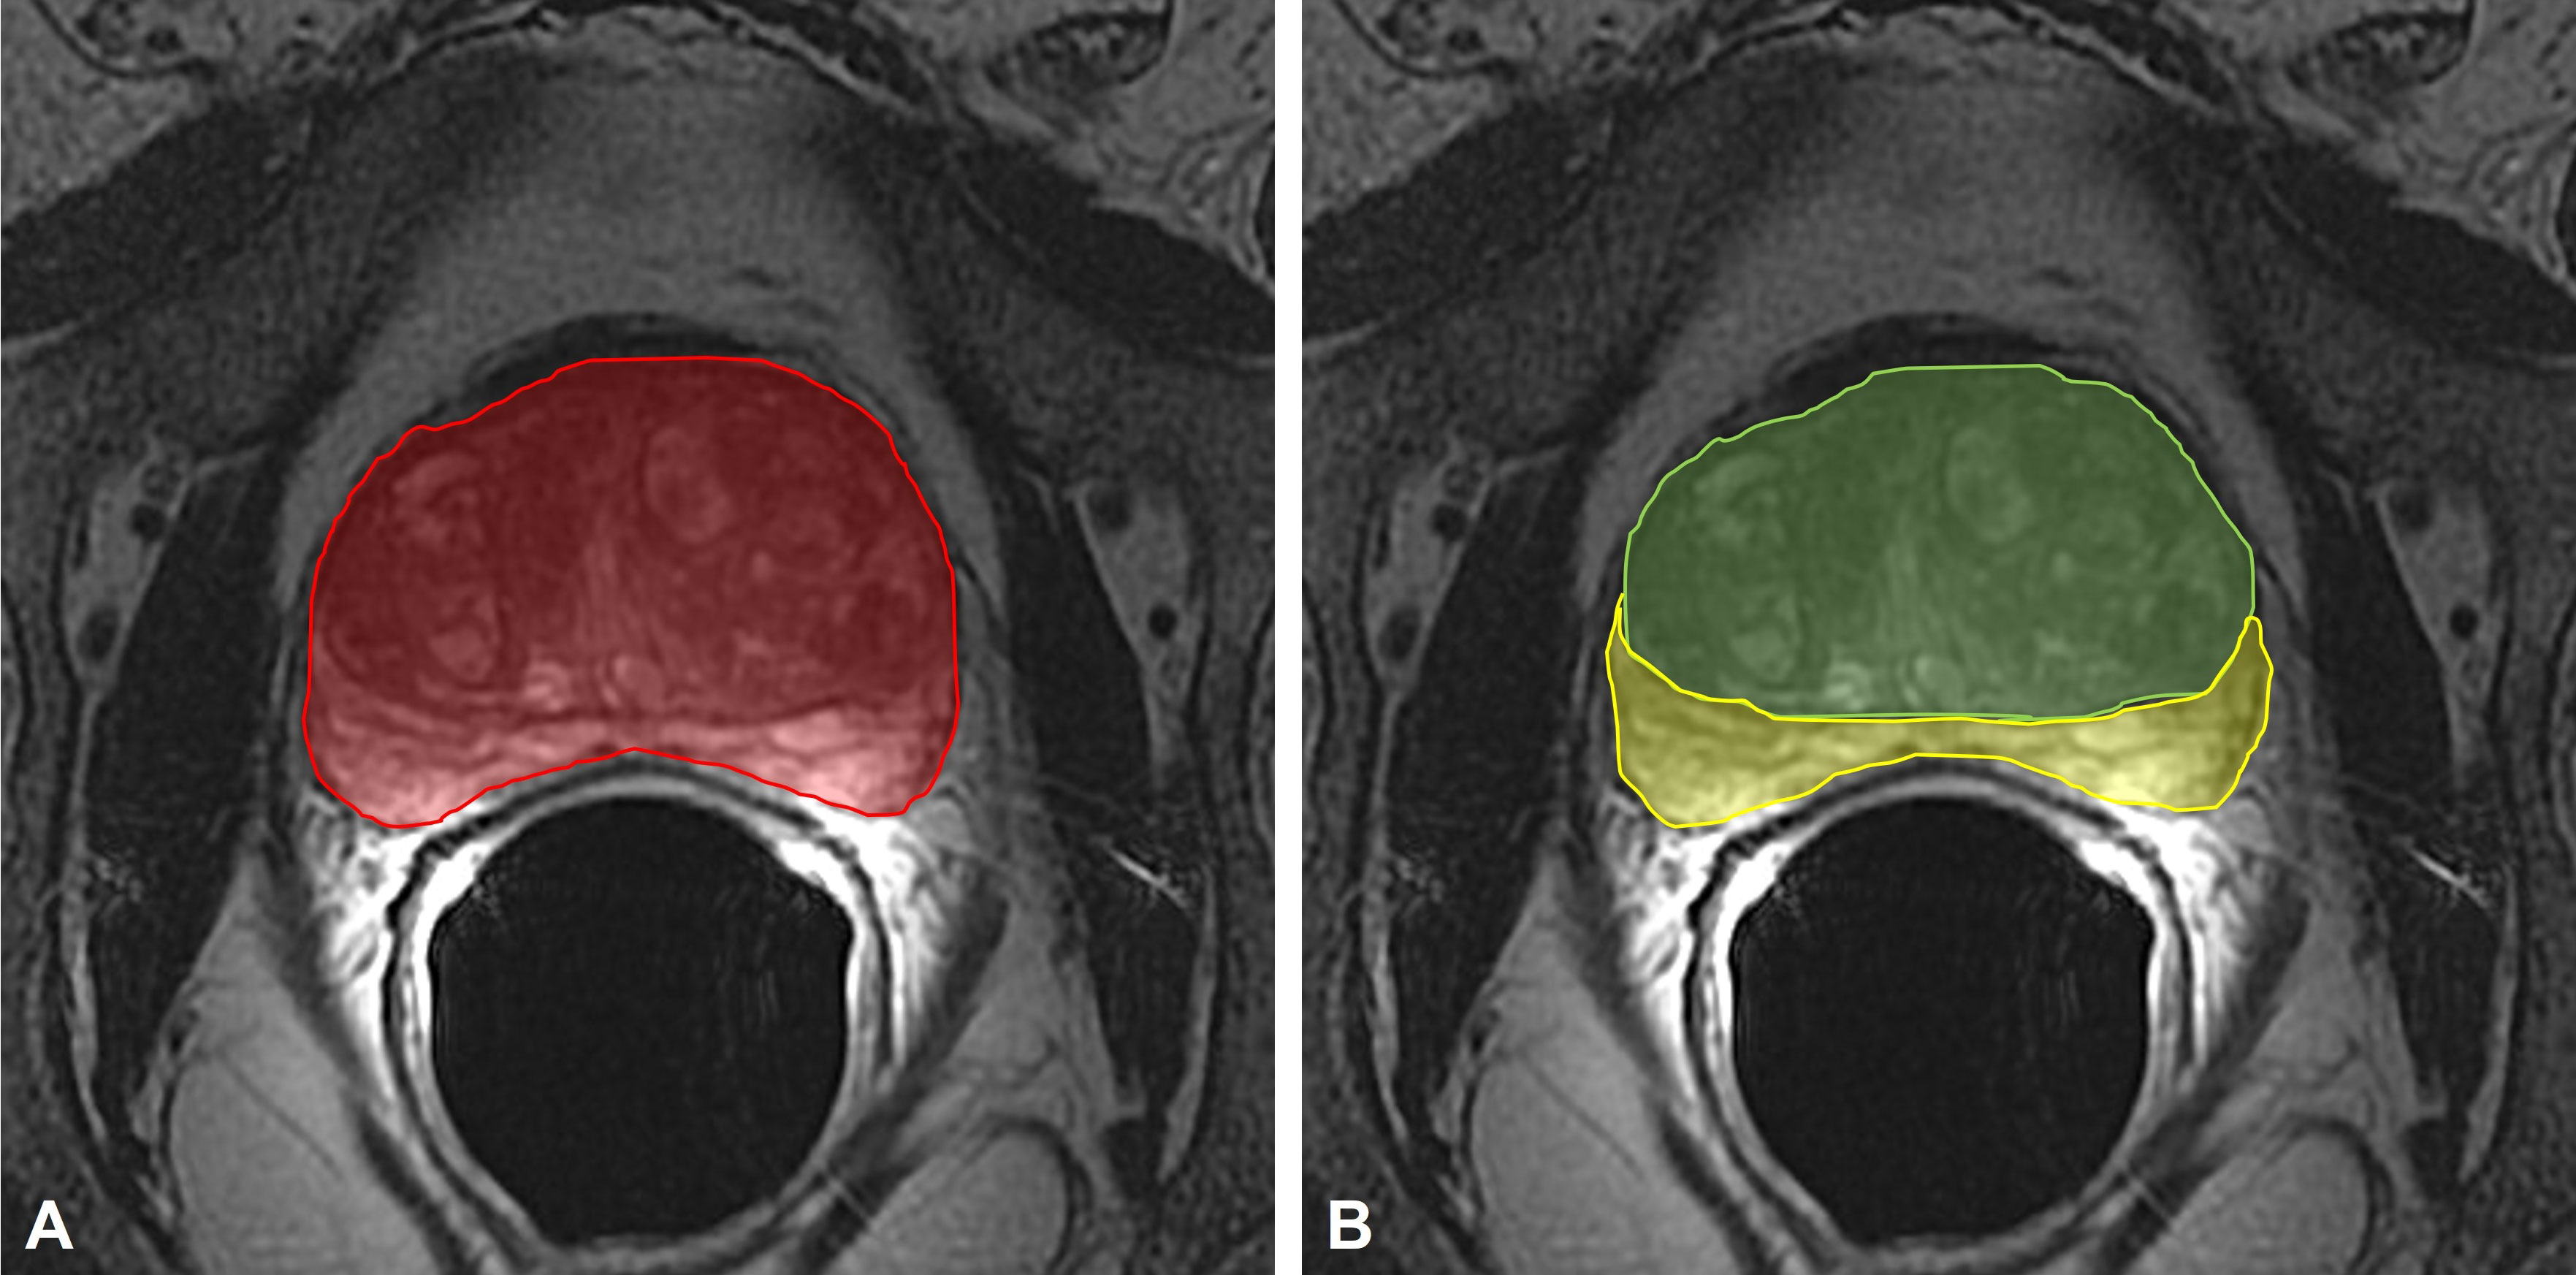
Figure 2 (A) measurement of the TransPA (red area) on the axial FR-FSE T2-weighted maximum sectional area of the prostate; (B) measurement of the TransCGA (green area) and TransPZA (yellow area) on the axial FR-FSE T2-weighted maximum sectional area of the prostate. TransPA, transverse prostate maximum sectional area; TransCGA, transverse central gland sectional area; TransPZA, transverse peripheral zone sectional area; FR-FSE, Fast Relaxation Fast Spin Echo.
The prostate maximum sectional areas on the axial FSE T2w sequences were selected as follows; when the bilateral prostate lobes were basically symmetrical, and the quasi-circular internal urethral sphincter could be seen in the middle of the prostate, the maximum section was that in which the sectional area became smaller when scanning upward or downward.
The contouring of the total prostate area (TransPA) and the central gland area (TransCGA) were manually defined on this selected image; the peripheral zone area (TransPZA) was subsequently calculated.
All the PI-RADS 3 lesions were biopsied transrectally by two experienced radiologists, who usually read at least 400 mpMRI per year, using the mpMRI-TRUS Fusion image guide feature of “Aplio™ 500 ultrasound system”, after antibiotic prophylaxis and a cleansing rectal enema, using a non-disposable biopsy gun (Medgun, Medax, Modena, Italy) with a disposable 18-gauge needle and a US platform (Canon-Toshiba Aplio 500™, Ōtawara, Kanto, Japan) with an end-fire TRUS probe as previously described (10).
The biopsy samples were analysed by two dedicated genitourinary pathologists who primarily identified the presence or absence of a neoplastic pathology on the samples. Each neoplastic lesion was graded from 1 to 5 according to the International Society of Urological Pathology (ISUP) Grade Group System (GGS) (12); lesions having a GGS ≥ 2 were considered to be clinically significant.
Data were reported as medians, interquartile ranges (IQRs) and frequencies. A correlation between PI-RADS 3 lesions on mpMRI and fusion-TB results as in a per-lesion analysis was made. The diagnostic performance was evaluated using sensitivity, specificity, positive predictive value (PPV) and negative predictive value (NPV). The Mann–Whitney U test was used. The AUC was computed together with the 95% confidence interval (95% CI) and the asymptotic test for null hypothesis: true area=0.5. The best cut-off was calculated using maximisation of the Youden Index. Univariate and multivariate analyses were carried out using logistic regression. Odd ratios (ORs) were calculated together with their 95% CIs. The forward stepwise likelihood ratio method was used for variable selection in the multivariate analysis. The AUC was computed to evaluate the predictive accuracy of the multivariate model. All the tests were 2-tailed, and a p value of <0.05 was considered statistically significant. All the statistical analyses were carried out using IBM SPSS 25.0 (SPSS Inc., Armonk, NY, USA).
Table 1 summarises the demographic and clinical characteristics of the patient population and the pathological characteristics of the PCa lesions identified. The patient population had median age of 65.5 years, a median PSA of 6.7 ng/ml and a median prostate volume of 47.5 ml; 47 (39.2%) patients had a PSA Density ≥ 0.15 ng/ml/ml.
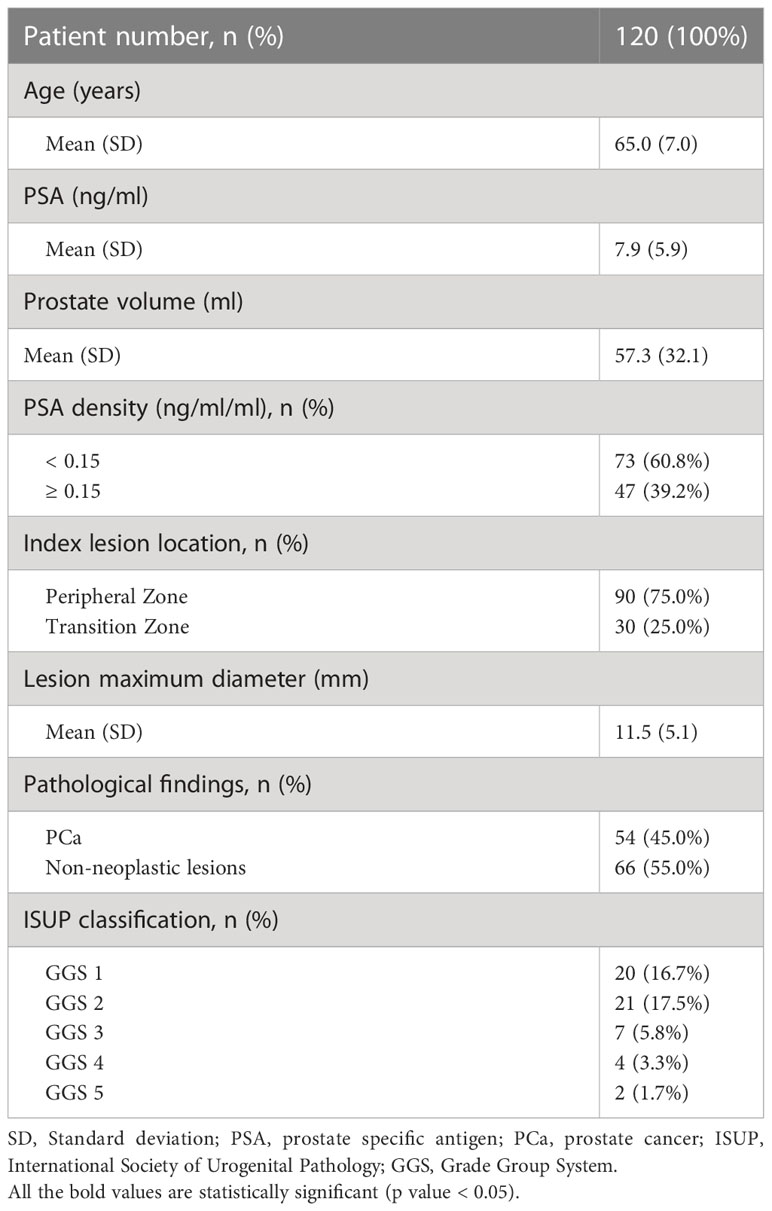
Table 1 Overall demographic and clinic characteristics of the patient population.
One hundred twenty lesions in 120 patients were correctly identified on mpMRI, corresponding to the lesions identified on pathological specimens, and 90 (75.0%) were located in the PZ. Overall, 54 (45.0%) lesions were PCa while the remaining 66 (55.0%) were non-neoplastic lesions at fusion-TB; there were 34 (28.3%) csPCas (GGS ≥ 2).
The mpMRI parameters calculated on the prostate maximum sectional area on the axial FSE T2w sequences of the overall lesions were the following: the median TransPA was 15.4 cm2, the median TransCGA was 9.1 cm2, the median TransPZA was 5.5 cm2, and the median TransPAI was 0.57. Table 2 shows the distribution of these parameters in the PCa and the non-neoplastic lesion groups; the median TransPA and the TransCGA of the PCa patients were significantly lower than those reported in the non-neoplastic patients (P<0.001 and P=0.001, respectively) while the TransPAI was significantly higher (P=0.022).
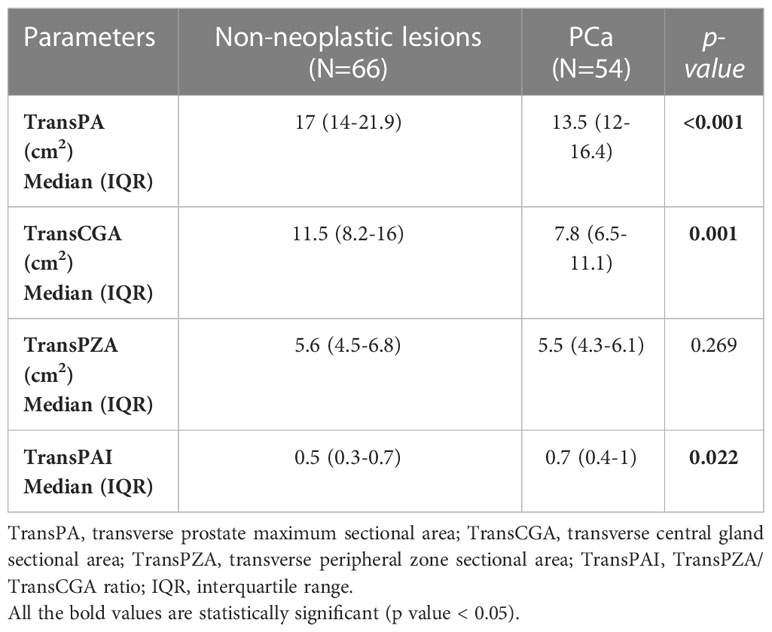
Table 2 Parameters measured on mpMRI.
Table 3 illustrates the univariate and multivariate analyses which predicted the presence of PCa in the total population of patients with PI-RADS 3 lesions at fusion-TB. The univariate analysis showed a significant correlation between PCa and the TZ location (P<0.001), prostate volume (P=0.002), PSA Density (P=0.004), TransPA (P<0.001), TransCGA (P=0.001), and TransPAI (P=0.022). At the multivariate analysis, only the TZ location (OR=7.92, 95% CI: 2.70-23.29, P<0.001) and TransPA (OR=0.83, 95% CI: 0.76-0.92, P<0.001) were independent predictors of PCa.
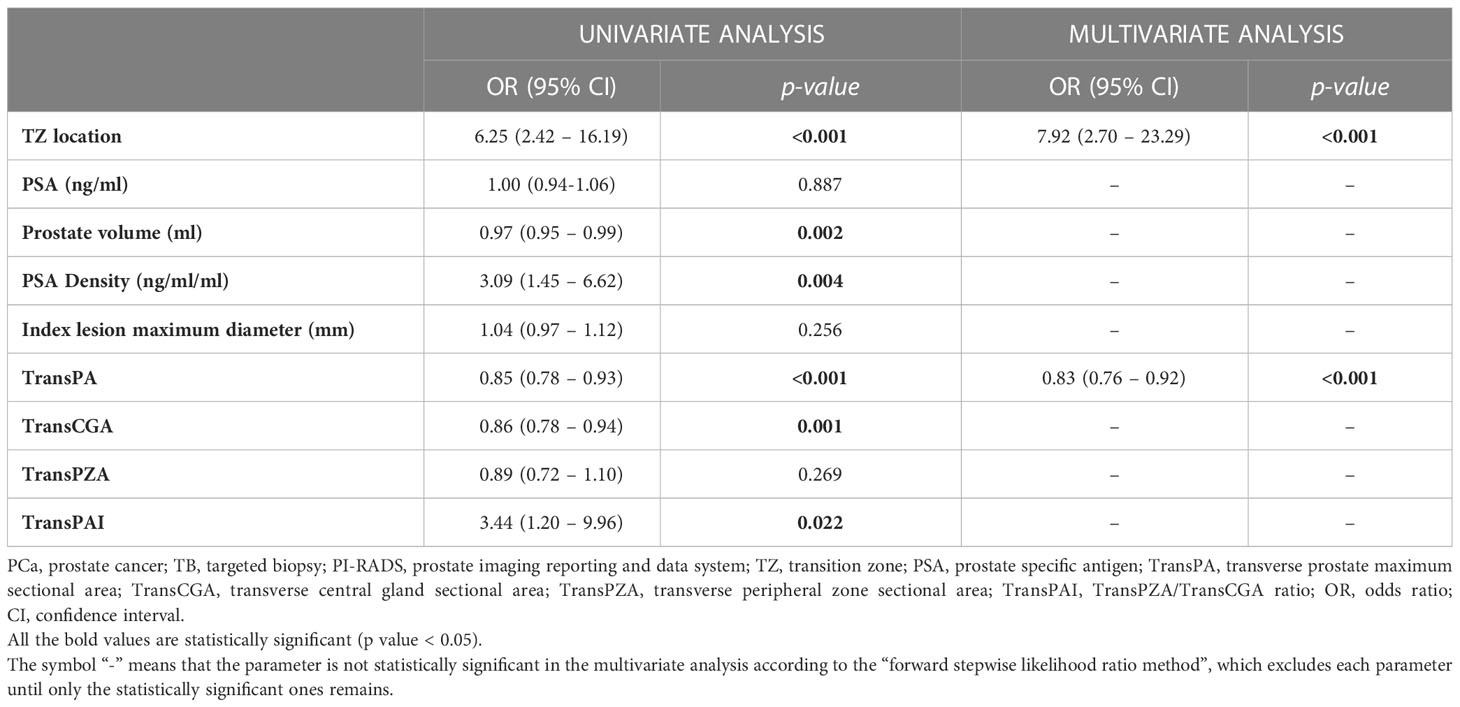
Table 3 Univariate and multivariate analyses to predict the presence of PCa at fusion-TB in the overall population of patients with PI-RADS 3 lesions.
Moreover, the univariate and multivariate analyses which predicted the presence of csPCa (GGS ≥ 2) in the overall population of patients with PIRADS 3 lesions at fusion-TB are reported in Table 4. Univariate analysis showed a significant correlation between csPCa and prostate volume (P=0.029), TransPA (P=0.022), and TransCGA (P=0.030). At multivariate analysis, only TransPA (OR=0.90, 95% CI: 0.082-0.99, P=0.022) was an independent predictor of csPCa.
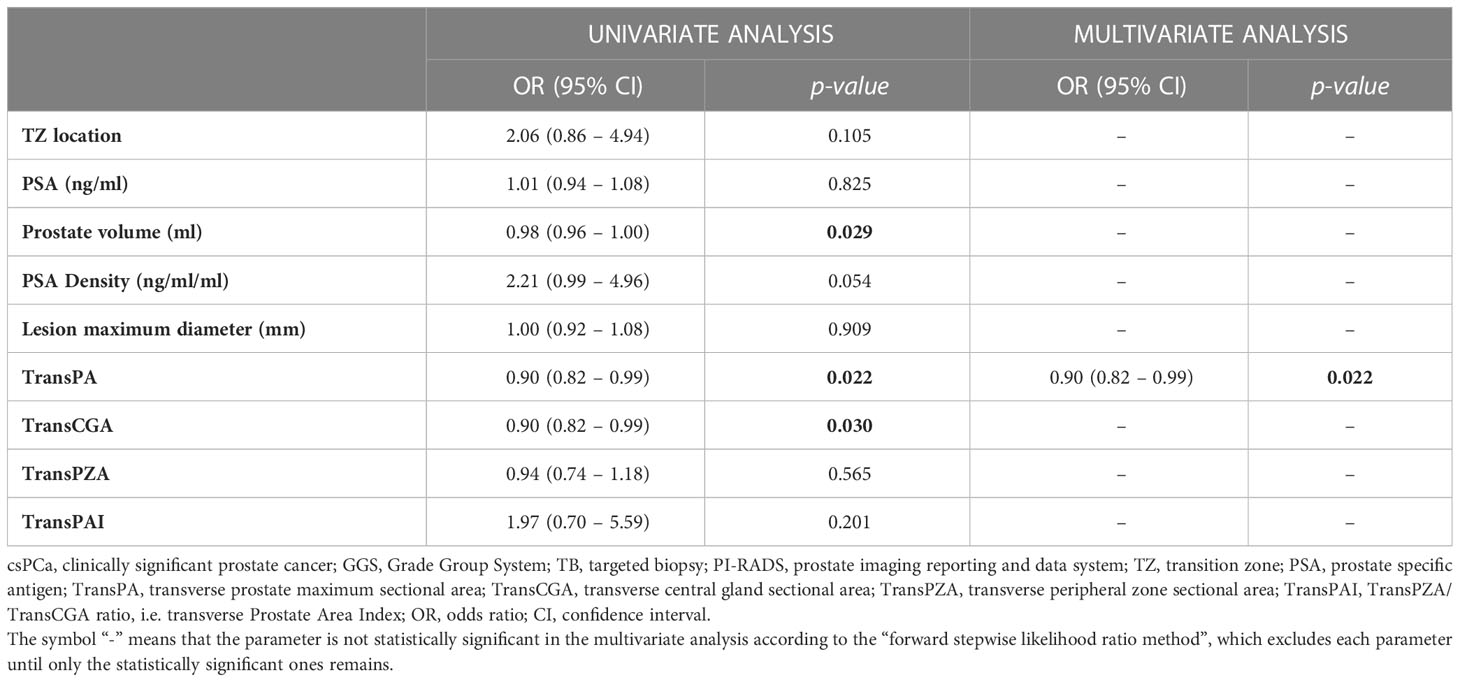
Table 4 Univariate and multivariate analyses to predict the presence of csPCa (GGS ≥ 2) at fusion-TB in the overall population of patients with PI-RADS 3 lesions.
The best cut-off of TransPA for csPCa was 18 (Sensitivity 88.2%, Specificity 37.2%, PPV 35.7%, NPV 88.9%). The discrimination (AUC) of the multivariate model was 0.627 (95% CI: 0.519-0.734, P<0.031).
Considerable variability in both the prevalence of PI-RADS 3 lesions and csPCa in the detection rate among studies has consistently affected the standardisation of the biopsy approach (i.e. when and how to proceed to biopsy).
In fact, PI-RADS 3 lesions comprise a wide range of benign (including acute or chronic prostatitis, post-atrophic hyperplasia and benign hyperplastic nodules) and malignant lesions, usually indistinguishable solely on the basis of mpMRI imaging features (13). However, in our series csPCas represent 28.3% of all PI-RADS 3 lesions; thus, a follow-up strategy could be considered safe and desirable as prostate biopsies are still affected by a non-negligible percentage of side effects, such as bleeding and infections (14).
Risk calculators, the most effective of which are the ERSPC and PCPT, can be utilised to predict the individual risk of csPCa before and after performing mpMRI in order to correctly select patients who require mpMRI in the first case and of biopsy in the second case. Artificial Intelligence (AI) can currently be applied to the use of risk calculations, allowing the processing of a large amount of data in a short time and providing predictive models useful in daily clinical practice, leading to the development of medication more and more tailored to the individual patient (15). Therefore, risk calculators can aid in selecting patients with PI-RADS 3 lesions at mpMRI who can benefit from follow-up or, alternatively, from immediate biopsy.
Of the clinical parameters, PSA density (with different cut-offs) represents the most investigated clinical predictor of PCa and a useful criterion in patient selection, especially in the grey area of PI-RADS 3 lesions (13, 16). To date, evidence has suggested that risk calculators and PSA density could be used in combination with risk stratification of patients with equivocal mpMRI results (15).
As regards the radiological features, in previous studies, lesion location (i.e. peripheral vs transition zone) has been correlated with an increased risk of PCa in which the peripheral location (17) or the transitional location (13) was an independent predictor of PCa. Other radiological features, such as T2w appearance, ADC value and/or DCE behaviour, do not allow a sufficient characterisation of benign vs. malignant lesions (13, 18, 19).
In the present study, at multivariate analyses, TransPA (OR=0.83, 95% CI: 0.76-0.92, P<0.001) was an independent predictor of all PCas together with lesion location (OR=7.92, 95% CI: 2.70-23.29, P<0.001). However, as regards only csPCas, the TransPA remains the only independent predictor (OR=0.90, 95% CI: 0.082-0.99, P=0.022) regardless of the lesion location, prostate volume, PSA and PSA density.
These results were in line with those reported by Jiang S et al. (11) who first proposed the introduction of these new tools. As suggested by the authors, the reason was possibly that the prostate is not a regular geometric solid and, therefore, any distortion, especially due to the growth mode of the tumor, could affect the calculation of the prostate volume. Moreover, prostate volume is usually estimated by an elliptical sphere formula (prostate volume=0.52 x length x width x height); any error regarding these measurements could be magnified by the multiplication (11).
The TransPA is a manual segmentation of the entire area of the prostate gland on axial T2w scans and is also very simple to define on any workstation for routine activity. However, with the advent of Computed Assisted Diagnosis (CAD) systems, it is much simpler to obtain this value as part of the standardised evaluation of the mpMRI exam and this parameter is integrated into the final report. Furthermore, a new generation of CAD has been implemented with the use of artificial intelligence (AI); it can support the diagnosis with the delineation of a probabilistic map of PCa for each lesion identified in the entire prostate gland (15). Artificial intelligence could be trained to obtain new tools, such as the TransPA, and integrate them into a predictive model of csPCa for each individual patient.
The present study has some limitations. First, the results were obtained only at a single high-volume tertiary care centre, with significant experience in prostate mpMRI and fusion-TB. Therefore, generalising these results in a real-world setting requires caution. Second, the present study was subject to all the potential biases inherent in a retrospective study design, such as selection bias and limited sample size. Third, the definition of csPCa used in this study (GGS ≥ 2) may not be universally agreed upon as it did not account for tumour volume and was based on TB rather than on radical prostatectomy. Finally, our sample was heterogeneous and limited to 120 patients with PI-RADS 3 lesions; thus, multicentric studies with larger patient cohorts are needed to confirm the present results.
In conclusion, in the present study a new diagnostic parameter was identified, called TransPA, as a strong independent predictor of csPCa in a patient population of PI-RADS 3 lesions at fusion-TB. This parameter can be manually defined on the diagnostic workstation in a simpler manner as compared to prostate volume and PSA density and can be useful in selecting patients requiring prostate biopsy. However, additional studies are needed to confirm these data and integrate these results into clinical predictor risk models.
The raw data supporting the conclusions of this article will be made available by the authors, without undue reservation.
The studies involving human participants were reviewed and approved by Institutional Review Board of IRCCS Azienda Ospedaliero-Universitaria di Bologna (Ethics Committee 94 code: 784/2021/Oss/AOUBo, approved on 16 September 2021). The patients/participants provided their written informed consent to participate in this study. Written informed consent was obtained from the individual(s) for the publication of any potentially identifiable images or data included in this article.
Conceptualization, CG, LBr, MT. Methodology, CG, LBr, MT, MD. Software, LBr, MT, AP. Validation, CG, LBr, MT, LBi, BC. Formal analysis, LBr, MT, MD, AP, FG. Investigation, CG, LBr, MT, LBi, BC. Resources, CG, LBr, MT, LBi, BC. Data curation, LBr, MT, AP, FG. Writing—original draft preparation, CG, LBr, MT, LBi, BC, FC, FG. Writing—review and editing, CG, LBr, MT, LBi, BC, FC, FG. Visualization, MF, RS, EB, RG. Supervision, MF, RS, EB, RG. Project administration, CG, RG. All authors contributed to the article and approved the submitted version.
The work reported in this publication was funded by the Italian Ministry of Health, RC-2022-2773479.
The authors declare that the research was conducted in the absence of any commercial or financial relationships that could be construed as a potential conflict of interest.
All claims expressed in this article are solely those of the authors and do not necessarily represent those of their affiliated organizations, or those of the publisher, the editors and the reviewers. Any product that may be evaluated in this article, or claim that may be made by its manufacturer, is not guaranteed or endorsed by the publisher.
1. Liddell H, Jyoti R, Haxhimolla HZ. Mp-MRI prostate characterised PIRADS 3 lesions are associated with a low risk of clinically significant prostate cancer - a retrospective review of 92 biopsied PIRADS 3 lesions. Curr Urol (2015) 8(2):96–100. doi: 10.1159/000365697
2. Hansen NL, Koo BC, Warren AY, Kastner C, Barrett T. Sub-Differentiating equivocal PI-RADS-3 lesions in multiparametric magnetic resonance imaging of the prostate to improve cancer detection. Eur J Radiol (2017) 95:307–13. doi: 10.1016/j.ejrad.2017.08.017
3. Mottet N, van den Bergh RCN, Briers E, Van den Broeck T, Cumberbatch MG, De Santis M, et al. EAU-EANM-ESTRO-ESUR-SIOG guidelines on prostate cancer–2020 update. part 1: Screening, diagnosis, and local treatment with curative intent. Eur Urol (2021) 79(2):243–62. doi: 10.1016/j.eururo.2020.09.042
4. Turkbey B, Rosenkrantz AB, Haider MA, Padhani AR, Villeirs G, Macura KJ, et al. Prostate imaging reporting and data system version 2.1: 2019 update of prostate imaging reporting and data system version 2. Eur Urol (2019) 76(3):340–51. doi: 10.1016/j.eururo.2019.02.033
5. Schoots IG, Padhani AR. Delivering clinical impacts of the MRI diagnostic pathway in prostate cancer diagnosis. Abdom Radiol (2020) 45(12):4012–22. doi: 10.1007/s00261-020-02547-x
6. Van Poppel H, Hogenhout R, Albers P, van den Bergh RCN, Barentsz JO, Roobol MJ. Early detection of prostate cancer in 2020 and beyond: Facts and recommendations for the European union and the European commission. Eur Urol (2021) 79(3):327–9. doi: 10.1016/j.eururo.2020.12.010
7. Schoots IG, Padhani AR. Personalizing prostate cancer diagnosis with multivariate risk prediction tools: How should prostate MRI be incorporated? World J Urol (2020) 38(3):531–45. doi: 10.1007/s00345-019-02899-0
8. Wegelin O, Exterkate L, van der Leest M, Kelder JC, Bosch JLHR, Barentsz JO, et al. Complications and adverse events of three magnetic resonance imaging–based target biopsy techniques in the diagnosis of prostate cancer among men with prior negative biopsies: Results from the FUTURE trial, a multicentre randomised controlled trial. Eur Urol Oncol (2019) 2(6):617–24. doi: 10.1016/j.euo.2019.08.007
9. Gaudiano C, Rustici A, Corcioni B, Ciccarese F, Bianchi L, Schiavina R, et al. PI-RADS version 2.1 for the evaluation of transition zone lesions: A practical guide for radiologists. Br J Radiol (2022) 95(1131):20210916. doi: 10.1259/bjr.20210916
10. Borghesi M, Bianchi L, Barbaresi U, Vagnoni V, Corcioni B, Gaudiano C, et al. Diagnostic performance of MRI/TRUS fusion-guided biopsies vs. systematic prostate biopsies in biopsy-naïve, previous negative biopsy patients and men undergoing active surveillance. Minerva Urol Nephrol (2021) 73(3):357–66. doi: 10.23736/S2724-6051.20.03758-3
11. Jiang S, Huang Z, Liu B, Chen Z, Xu Y, Zheng W, et al. MRI-Based nomogram of prostate maximum sectional area and its zone area for prediction of prostate cancer. Front Oncol (2021) 11:708730. doi: 10.3389/fonc.2021.708730
12. van Leenders GJLH, van der Kwast TH, Grignon DJ, Evans AJ, Kristiansen G, Kweldam CF, et al. The 2019 international society of urological pathology (ISUP) consensus conference on grading of prostatic carcinoma. Am J Surg Pathol (2020) 44(8):e87–99. doi: 10.1097/PAS.0000000000001497
13. Gaudiano C, Bianchi L, Corcioni B, Giunchi F, Schiavina R, Ciccarese F, et al. Evaluating the performance of clinical and radiological data in predicting prostate cancer in prostate imaging reporting and data system version 2.1 category 3 lesions of the peripheral and the transition zones. Int Urol Nephrol (2022) 54(2):263–71. doi: 10.1007/s11255-021-03071-7
14. Borghesi M, Ahmed H, Nam R, Schaeffer E, Schiavina R, Taneja S, et al. Complications after systematic, random, and image-guided prostate biopsy. Eur Urol (2017) 71(3):353–65. doi: 10.1016/j.eururo.2016.08.004
15. Mata LA, Retamero JA, Gupta RT, García Figueras R, Luna A. Artificial intelligence–assisted prostate cancer diagnosis: Radiologic-pathologic correlation. RadioGraphics (2021) 41(6):1676–97. doi: 10.1148/rg.2021210020
16. Görtz M, Radtke JP, Hatiboglu G, Schütz V, Tosev G, Güttlein M, et al. The value of prostate-specific antigen density for prostate imaging-reporting and data system 3 lesions on multiparametric magnetic resonance imaging: A strategy to avoid unnecessary prostate biopsies. Eur Urol Focus. (2021) 7(2):325–31. doi: 10.1016/j.euf.2019.11.012
17. Kim TJ, Lee MS, Hwang SI, Lee HJ, Hong SK. Outcomes of magnetic resonance imaging fusion-targeted biopsy of prostate imaging reporting and data system 3 lesions. World J Urol (2019) 37(8):1581–6. doi: 10.1007/s00345-018-2565-3
18. Brizmohun Appayya M, Sidhu HS, Dikaios N, Johnston EW, Simmons LA, Freeman A, et al. Characterizing indeterminate (Likert-score 3/5) peripheral zone prostate lesions with PSA density, PI-RADS scoring and qualitative descriptors on multiparametric MRI. Br J Radiol (2017) 91(1083):20170645. doi: 10.1259/bjr.20170645
Keywords: multiparametric magnetic resonance imaging, prostate cancer, PI-RADS 3 lesions, transverse prostate maximum sectional area, PIRADS 3, urological imaging
Citation: Gaudiano C, Braccischi L, Taninokuchi Tomassoni M, Paccapelo A, Bianchi L, Corcioni B, Ciccarese F, Schiavina R, Droghetti M, Giunchi F, Fiorentino M, Brunocilla E and Golfieri R (2023) Transverse prostate maximum sectional area can predict clinically significant prostate cancer in PI-RADS 3 lesions at multiparametric magnetic resonance imaging. Front. Oncol. 13:1082564. doi: 10.3389/fonc.2023.1082564
Received: 28 October 2022; Accepted: 07 February 2023;
Published: 20 February 2023.
Edited by:
Xiaoyi Duan, The First Affiliated Hospital of Xi’an Jiaotong University, ChinaReviewed by:
Mark Emberton, University College London, United KingdomCopyright © 2023 Gaudiano, Braccischi, Taninokuchi Tomassoni, Paccapelo, Bianchi, Corcioni, Ciccarese, Schiavina, Droghetti, Giunchi, Fiorentino, Brunocilla and Golfieri. This is an open-access article distributed under the terms of the Creative Commons Attribution License (CC BY). The use, distribution or reproduction in other forums is permitted, provided the original author(s) and the copyright owner(s) are credited and that the original publication in this journal is cited, in accordance with accepted academic practice. No use, distribution or reproduction is permitted which does not comply with these terms.
*Correspondence: Caterina Gaudiano, Y2F0ZXJpbmEuZ2F1ZGlhbm9AYW9zcC5iby5pdA==, Y2F0ZXJpbmEuZ2F1ZGlhbm9AZ21haWwuY29t; Lorenzo Braccischi, bG9yZW56by5icmFjY2lzY2hpQHN0dWRpby51bmliby5pdA==, bC5icmFjY2lzY2hpQGdtYWlsLmNvbQ==
Disclaimer: All claims expressed in this article are solely those of the authors and do not necessarily represent those of their affiliated organizations, or those of the publisher, the editors and the reviewers. Any product that may be evaluated in this article or claim that may be made by its manufacturer is not guaranteed or endorsed by the publisher.
Research integrity at Frontiers
Learn more about the work of our research integrity team to safeguard the quality of each article we publish.